Abstract
There are a variety of amino acids and polysaccharides contained in Pleurotus eryngii that can improve immunity and prevent cancer in humans. The purpose of this research was to investigate the improved quality hypha of P. eryngii-3, which could shorten the ripening cycle of the hypha and increase economic benefits to industries. In this paper, the quality hypha of P. eryngii-3 was investigated for the DCW, total protein, polysaccharides, laccase activity, and so on. The medium was screened and carbon and nitrogen sources were screened and optimized as 40 g/L of corn flour and soybean meal by P. eryngii-3. Then, the effects of pH, temperature, volume, and rotation speed were investigated, in which the suitable fermentation conditions were, respectively, pH = 6, a temperature of 27 °C, 90 mL of fermentation broth, and a 150 r/min rotation speed. Meanwhile, the transcription levels of Lcc1, Lcc5, Lcc8, and Lcc12 were upregulated by 10.25-, 3.32-, 2.33-, and 6.29-fold, respectively, after the optimization. In addition, the response surface method of the BBD was utilized for further improvements to the DCW by P. eryngii-3, in which the optimized DCW reached 17.2345 ± 0.7845 g/L.
1. Introduction
Pleurotus eryngii is a fungus of the genus Pleurotus (Basidiomycota, Agaricales) and can produce an edible fruiting body in the lignocellulosic substrate [1,2,3]. It is a large succulent toadstool of good quality, which is distributed in Europe, North Africa, and Central Asia [4]. There are many nutritious elements in P. eryngii, in which the plant protein content is about 25%. Meanwhile, there are a variety of amino acids and oligosaccharides in P. eryngii, which have an effective function of promoting digestion and absorption [5,6]. In addition, P. eryngii has a wide range of applications in the degradation of straw and lignin [7,8], degradation of plastics [9,10], adsorption of heavy metal [11,12], feed additives [13,14], and active metabolites [15,16,17,18]. For this reason, people have begun to try artificial planting with submerged and solid fermentation [19,20].
There are many functional components in P. eryngii (such as polysaccharides, triterpenes, and ergosterol), the medicinal function of which is its hypolipidemic, antioxidant, and anticancer effects, as well as its ability to lower the risks of cardiovascular disease [21,22]. A variety of functional enzymes are biosynthesized by P. eryngii (ligninolytic enzyme, laccase, Mn-oxidizing peroxidases, and aryl-alcohol oxidase), which are beneficial for decomposing lignin and promoting the use of biomass materials [23,24,25]. In a word, P. eryngii is a popular edible fungus and has been widely researched by experts and scholars at home and abroad for its unique flavor, high nutritional value, and numerous medicinal functions [26,27]. However, there has been little research on the cultivation and optimization of P. eryngii species. Therefore, the research on the submerged cultivation of P. eryngii hypha bioproduction technologies urgently need to be optimized, which would improve the biomass yield of P. eryngii for its further industrial production.
The common and effective methods for the enhancement of the mycelial biomass and active metabolites of Pleurotus spp. are the optimization of the medium and culture processes [28,29]. There have been many successful cases that have shown that the optimization of biological fermentation had a significant promoting effect on the submerged fermentation of edible fungi [30,31,32]. Bellettini et al. provided an overview of the effects of the intrinsic factors (composition of substrates, nitrogen sources, C/N, pH, and so on) and extrinsic factors (temperature, humidity, luminosity, air composition, and so on) on Pleurotus spp [33]. Tang et al. researched the effects of pH, shaking speed, culture temperature, inoculation amount, and culture time on the dry weight of fermentation and the contents of ergothioneine and selenium by Pleurotus eryngii 528 [34]. Singh et al. optimized the parameters of temperature, ultraviolet-B intensity, and time of exposure using response surface methodology for producing Vitamin D2 and β-glucan by P. eryngii 18.K07 [35]. As a result, the optimization of the medium components and fermentation conditions was significantly beneficial to the enhancement of biomass yield by edible fungus.
In this work, the authors attempted to increase the hypha and active metabolites of P. eryngii-3 using single-element inspection and statistical experiments to optimize the medium components and fermentation conditions. Through the above effective optimization experiments, the hypha quality of P. eryngii was well-optimized for industrial manufacture.
2. Material and Methods
2.1. Microorganism
Pleurotus eryngii-3 cultured in this work was provided by Jiangsu Jiuhe Biotechnology Development Co., Ltd., and was a special strain utilized in industrial production. P. eryngii-3 was activated in potato dextrose agar medium (PDA) from a hypha tube. The first activated plate was cultivated at 25 °C for 336 h. The grown colonies were sub-cultured on a PDA agar medium in which the mycelium was homogenized and used as inoculum for the fermentation medium.
2.2. Medium Screening for Mycelium of P. eryngii-3
The screened mediums were selected from the literature for the enhancement of mycelium by P. eryngii-3. The compositions of the nine different mediums were as follows Table 1 (g/L):

Table 1.
Components of nine medium.
The mediums were prepared and loaded with 80 mL of broth in 250 mL in an Erlenmeyer flask. A piece of hyphae with a size of 0.5 × 1.5 cm2 from the active PDA was inoculated into the above shake flask. The fermentation was cultured in a rotary shaker at 150 r/min and 25 ± 0.5 °C for 216 h.
2.3. Medium Optimization by Single Factor and Orthogonal Experiments
A variety of carbon and nitrogen sources have an important role in the development and growth of edible fungus. Therefore, the species and concentrations of the carbon and nitrogen sources were optimized based on the determined mediums. Maltose, cornmeal, lactose, fructose, and a control were selected as the carbon sources. Peptone, beef extract, sodium nitrate, urea, and a control were selected as the nitrogen sources. The concentrations of the carbon and nitrogen sources were both set at 10, 20, 30, 40, 50, and 60 g/L for the optimization. Then, the orthogonal design was utilized to further obtain the optimal concentrations of the determined carbon and nitrogen sources. The concentrations are listed in Table 2 along with the 2 factors and 3 levels of the orthogonal experiments.
Table 2.
Two-factor three-level tests of corn flour and soybean meal.
2.4. Optimization of Fermentation Conditions
Fermentation conditions also have a significant impact on the development and growth of hypha. In this work, the different effects of the culture time, pH, temperature, volume, and rotation speed on the biomass, total protein, and polysaccharides of P. eryngii-3 were investigated. The different parameters used are as follows (Table 3):
Table 3.
The screening conditions on culture time, pH, temperature, volume, and rotation speed.
2.5. Optimization of Significant Variables Using Box–Behnken Design (BBD)
The BBD of the response surface method (RSM) using Design Expert software 12.0.3 was applied to optimize the fermentation conditions of P. eryngii-3. The temperature, volume, and rotation speed were set as the optimized factors and the response was set as the DCW of P. eryngii-3. The RSM contained 17 experiments that included 3 independent replications for each ratio of starter culture to evaluate the effect of the combination of the 3 independent variables, as shown in Table 4. The behavior of the system was described by the following quadratic equation:
in which the DCW was the predicted response, β0 was the intercept term, βi was the linear effect, βii was the quadratic effect, βij was the interaction effect, and A, B, and C were the encoded independent variables.
Table 4.
Experimental design and results of response surface analysis.
2.6. Analysis
2.6.1. Detection of Total Protein
The assay of the total protein used the Coomassie bright-blue colorimetry. The preparation of the protein standard curve was described as follows: the seven different concentrations (10, 20, 30, 40, 60, and 80 μg/mL) of bovine serum albumin solution (standard protein solution) were dissolved, mixed, and maintained at room temperature for 3 min. The standard protein solution was detected at 595 nm by a UV-visible spectrophotometer (752N, Mettler-Toledo Instruments (Shanghai, China) Co., Ltd.).
The sample testing process was as follows: the mycelium was selected by 80 mesh screens from 15 mL of broth at day 9 of the fermentation process. The crude enzyme solution was achieved by the mycelium grinding with 5 g of quartz sand in the ice-water bath and centrifuging at 4000 r/min for 15 min at 4 °C. An amount of 1 mL of crude enzyme solution was added with 4 mL of Coomassie bright blue G-250, then it was shaken evenly and placed at room temperature for 3 min and then analyzed at 595 nm.
2.6.2. Determination of Polysaccharide Content
The different concentrations (0, 0.01, 0.02, 0.03, 0.04, and 0.05 mg/mL) of glucose were prepared in 6 clean tubes, and were added with 4 mL of anthrone reagent to the ice-water bath. The mixture was boiled for 10 min and cooled with water to room temperature for 10 min, and was detected at 620 nm by a UV-visible spectrophotometer. An amount of 500 μL of crude enzyme solution for the detection of total protein was added with 500 μL of distilled water. Then, the treated process as described above, as well as the results, were detected at 620 nm.
2.6.3. Detection of Dry Cell Weight (DCW) for P. eryngii-3
The dry cell weight (DCW) of P. eryngii-3 was detected as the biomass of P. eryngii-3. The mycelium was selected and collected by 80 mesh screens at 216 h of fermentation, then it was cleaned with deionized water 3 times. The wet mycelium was processed by vacuum filtration and dried in a constant-temperature drying oven (DHG-9140, Tianjin Test Instrument Co., Ltd.). Until a constant weight was reached, the mycelium was weighted by analytical balance (AE240, Mettler-Toledo Instruments (Shanghai) Co., Ltd.).
2.6.4. Determination of Growth Rate and Diameter of Mycelium
Some mycelium was randomly drawn from the broth every 24 h of fermentation and was laid flat in the PDA. The growth rate of mycelium was detected using a vernier caliper and was calculated between the initial length and the length after 24 h of cultivation. The value of the difference in the mycelial length was the average value of the sample.
An amount of 5 mL of broth every 24 h of fermentation was sampled and 20 mycelium balls were randomly picked, which were lined up and the lengths were measured using the vernier caliper. The determination of the diameter of mycelium was set at 3 parallel.
2.6.5. Analysis of Laccase Activity
The activity of laccase by P. eryngii-3 was analyzed using the revised method in the reported literature [36]. The reaction mixture contained 0.5 mM 2,20-azino-bis (3-ethylbenzthiazoline-6-sulfonate) (ABTS), 50 mM sodium acetate buffer (pH 5.0), and 100 µL crude enzyme solution. The crude enzyme solution was taken from 1 mL broth by grinding the mycelium pellets with liquid nitrogen. The laccase activity was detected as the oxidation of ABTS at 420 nm (ε420 = 3.6 × 10⁴ M−1 cm−1). A unit of laccase activity was defined as the amount of enzyme oxidizing 1 µmol of ABTS per min at 25 °C [37]. The protein concentration of the enzyme solution was determined using the standard Bradford method.
2.6.6. qRT-PCR for Laccase Genes
An RNA extraction kit was utilized to extract the total RNA of P. eryngii-3 at the sampling point of fermentation. The extracted solution was detected for RNA concentration using a spectrophotometer at A260/280. The method of Passarini et al. [38] was utilized to detect the transcription levels of the laccase genes after the optimization of the culture medium and fermentation conditions. The extracted RNA and the Premix Script TM Reagent Kit (Takara, Shanghai, China) were used for reverse transcription. The Premix Ex Taq TM II (Takara, Shanghai, China) was utilized to determine transcriptional levels of the laccase genes according to the manufacturer’s procedures. The primer sequences of Lcc genes and GAPDH (housekeeping gene) for PCR amplification and qRT-PCR assay are displayed in Table 5. The qRT-PCR experiment was performed by mixing 5 μL SYBR qRT-PCR, 1 μL primers (forward and reverse), template cDNA (2 μL), and double-distilled water. A CFX96 real-time PCR detection system was used to calculate the standard curves and CT values and detect the transcriptional levels of the samples.
Table 5.
List of primers used for the qRT-PCR of Lcc genes and GAPDH in this study.
2.7. Statistical Analysis
All data obtained in the shake flask culture process were the mean of triplicate experiments. The statistical significance of the differences in the DCW, concentration of total protein and soluble sugar, and growth rate and diameter of mycelium were evaluated using a one-way analysis of variance (ANOVA) and Duncan’s multiple range tests in SPSS version 16.0. A value of p < 0.05 was considered statistically significant.
3. Results
3.1. Screening of Culture Medium
The culture medium is the basis of microbial growth and development and provides the nutrients and energy for the fermentation of microbes. A suitable culture medium was beneficial to mycelium growth and product synthesis by P. eryngii-3 in this work. The DCW, total protein, polysaccharides, tie-back speed, and diameter of mycelium were detected using nine different culture mediums, as seen in Table 6. The different kinds of mediums had different effects on the physiological and biochemical parameters of P. eryngii-3. The DCW of medium 3 was the maximum (5.9863 ± 0.3518 g/L) out of the tested mediums and was 17 times higher than medium 9 (0.3513 ± 0.0424 g/L). The parameter of total protein was affected to varying degrees by the medium and also reached a maximum (0.4811 ± 0.0642 mg/mL) in medium 3. The type of culture medium caused great differences in the polysaccharides, which achieved values of 0.5123 ± 0.0001, 0.4536 ± 0.0161, 0.4376 ± 0.0046, and 0.3727 ± 0.0634 mg/mL in mediums 3, 5, 6, and 1, respectively. The higher values of the tie-back speed were 0.6725 ± 0.0106, 0.5150 ± 0.0000, and 0.5075 ± 0.0601 mm/d in mediums 1, 2, and 3, respectively. The diameter of mycelium in medium 3 was the maximum at 2.07000 ± 0.3137 mm. In general, the parameters of medium 3 were significant in the DCW, total protein, polysaccharides, and diameter of mycelium. According to the above data analysis, medium 3 was suitable for the growth and metabolism of P. eryngii-3.
Table 6.
Comparison of physiological and biochemical indexes of P. eryngii-3 by the nine mediums.
3.2. Optimization of Carbon and Nitrogen Sources
Based on the selected medium, the optimization of the carbon and nitrogen sources was necessary for the enhancements of the biomass and active metabolites by P. eryngii-3. The five kinds of carbon sources (glucose, corn flour, maltose, lactose, and fructose) were selected by the DCW, total protein, and polysaccharides, as seen in Figure 1. There were different effects on the DCW and polysaccharides caused by the different types of carbon sources, in which corn flour had an obvious advantage over the others (7.5123 ± 1.3647 g/L and 0.7167± 0.2648 mg/mL). The trend for the total protein was not distinct for the different carbons. The contents of the DCW and total protein were significant in the medium with corn meal and maltose as the carbon sources. After a comprehensive comparison, corn flour was determined to be the carbon of the medium for the fermentation of P. eryngii-3.
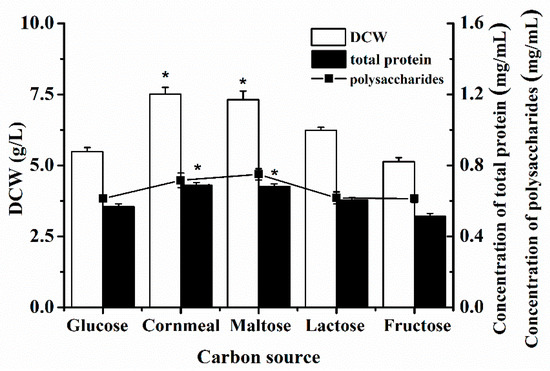
Figure 1.
The effect of the carbon source on the DCW, total protein, and polysaccharides of P. eryngii-3 in shake flask. * Indicates statistical significance (p < 0.05). Data points are the average of n = 3; error bars represent the standard error of the mean. The samples were harvested at 216 h of fermentation.
Homoplastically, the suitable nitrogen source was selected from soybean meal, peptone, beef extract, sodium nitrate, and urea, as seen in Figure 2. The effect of urea was found to be that it inhibited the growth of P. eryngii-3, in which the numbers of the three parameters were all 0. The biomass and metabolites of P. eryngii-3 in the beef extract were lower than peptone, sodium nitrate, and soybean meal. The effect of soybean meal was better than other nitrogen sources, with the DCW, polysaccharides, and total protein, respectively, at 5.4861 ± 0.8752 g/L, 0.6131 ± 0.0765 mg/mL, and 0.5674 ± 0.0543 mg/mL, which was more significant than the others. Therefore, soybean meal was confirmed as the optimized nitrogen source.
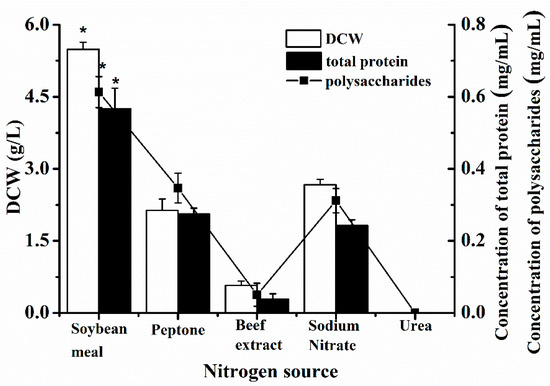
Figure 2.
The effect of nitrogen source on the DCW, total protein, and polysaccharides of P. eryngii-3 in shake flask. * Indicates statistical significance (p < 0.05). Data points are the average of n = 3; error bars represent the standard error of the mean. The samples were harvested at 216 h of fermentation.
Then, the concentrations of the screened carbon and nitrogen sources were optimized using the biostatistical method. The two-factor three-level orthogonal test of the corn flour and soybean meal was designed to acquire the optimal content of the carbon and nitrogen sources seen in Table 2. The tendency of the DCW was increased by the increasing content of the corn flour, and there was no difference in the DCW between 30 and 40 g/L of corn flour (mean value 8.2684 ± 0.7283 and 8.7815 ± 0.1099 g/L, respectively). The trends for the total protein and polysaccharides were similar to the DCW by increasing the corn flour. In addition, there was the same effect in the test of the soybean meal. When the corn flour and soybean meal were 40 g/L, the DCW reached the maximum (9.1782 ± 0.1105 g/L) and the total protein and polysaccharides reached a higher level (0.9201 ± 0.0184 and 1.2456 ± 0.1327 mg/mL, respectively). Meanwhile, these parameters were significant with 40 g/L of corn flour and soybean meal. Therefore, the optimized concentration of corn flour and soybean meal were both set at 40 g/L.
3.3. Determination of Culture Time by P. eryngii-3
Based on the optimization of the medium composition, the culture time was investigated to determine the fermentation period of P. eryngii-3. As shown in Figure 3A, the trend in the DCW of P. eryngii-3 was shown to increase and then decrease. In addition, the maximum DCW was obtained at 168 h, with a value of 9.3543 ± 0.2327 g/L. Meanwhile, the tendencies of the total protein and polysaccharides were similar to those of the DCW, in which the peak value appeared at 168 h (total protein 0.9813 ± 0.0325 mg/mL, polysaccharides 1.2501 ± 0.0423 mg/mL). Furthermore, a dynamic change in the laccase activity was detected by the fermentation of P. eryngii-3, as seen in Figure 3B. The activity of laccase increased from 120 h to 168 h and then remained stable (5.3500 U/mL at 168 h), which indicated the maximum laccase activity was acquired at 168 h. Therefore, the fermentation period was set at 168 h.
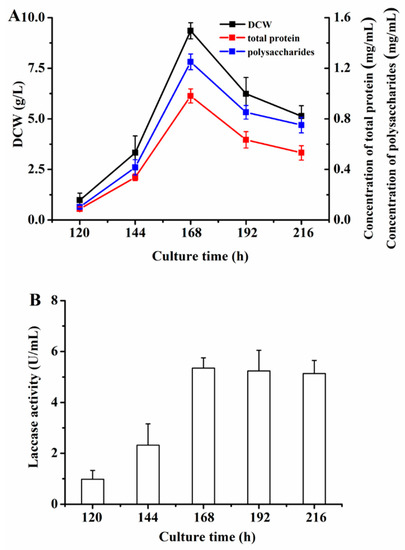
Figure 3.
The effect of the culture time of P. eryngii-3 in the shake flask. (A) The effect on the DCW, total protein, and polysaccharides; (B) The effect on laccase activity. Data points are the average of n = 3; error bars represent the standard error of the mean. The samples were harvested at 120 h, 144 h, 168 h, 192 h, and 216 h of fermentation.
3.4. Optimization of Fermentation Conditions by P. eryngii-3
To further improve the fermentation effect, the optimization of the fermentation conditions was researched. The result of the pH optimization is displayed in Figure 4A, in which the trends in the DCW, laccase activity, total protein, and polysaccharides can be seen to increase and then decrease. The maximum DCW, total protein, and polysaccharides appeared at pH = 6 and the maximum values were, respectively, 9.8601 ± 1.0326 g/L, 1.0154 ± 0.0929 mg/mL, and 1.2862 ± 0.0427 mg/mL. The maximum value of the laccase activity was 5.51 U/mL, which was at pH = 7. The effect of temperature on the fermentation of P. eryngii-3 can be seen in Figure 4B. The trends in the DCW, total protein, and polysaccharides were identical and the maximum values of the DCW, total protein, and polysaccharides were 11.8743 ± 1.3328 g/L, 1.1331 ± 0.6331 mg/mL, and 1.3114 ± 0.7422 mg/mL at 27 °C. The laccase activity was shown to be very steady during the different temperature treatments.
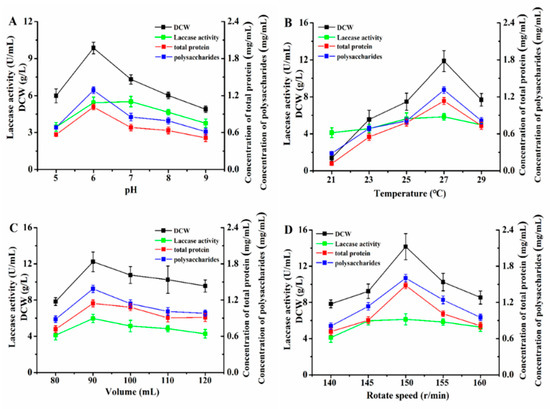
Figure 4.
The effect of fermentation parameters on the DCW, laccase activity, total protein, and polysaccharides of P. eryngii-3 in the shake flask. (A) pH; (B) temperature; (C) volume; (D) rotation speed. Data points are the average of n = 3; error bars represent the standard error of the mean. The samples were harvested at 168 h of fermentation.
As shown in Figure 4C, the tendencies of the DCW, laccase activity, total protein, and polysaccharides were similar after the optimization of the volume. The suitable volume was 90 mL, in which the maximum values of the DCW, laccase activity, total protein, and polysaccharides were 12.2304 ± 1.6323 g/L, 5.9600 U/mL, 1.1454 ± 0.0324 mg/mL, and 1.3873 ± 0.0727 mg/mL. The effect of rotation speed is shown in Figure 4D and the maximum values of the DCW, total protein, and polysaccharides were 14.1604 ± 1.4345 g/L, 1.4810 ± 0.2126 mg/mL, and 1.6037 ± 0.1027 mg/mL at 150 r/min. The laccase activity was 5.96, 6.13, and 5.84 U/mL at 145, 150, and 155 r/min, respectively. Therefore, the optimized parameters for the pH, temperature, liquid medium volume, and rotation speed were, respectively, pH = 6, 27 °C, 90 mL, and 150 r/min, in which the DCW and laccase activity increased by 51.4% and 14.6%, respectively.
3.5. Transcription Profiling of P. eryngii-3 four Laccase Gene
The laccase activity significantly improved after the optimization of the mediums and fermentation conditions, which could have been affected by the variational transcription level of the genes encoding laccase. Thus, the transcription levels of genes encoding laccases (Lcc1, Lcc5, Lcc8, and Lcc12) were investigated in this work. The changing tendencies of the Lcc genes were analogical, and first increased and then decreased, as seen in Figure 5. The transcription levels of Lcc1 were upregulated at 120 h, 168 h, and 216 h, as seen in Figure 5A, and were, respectively, 3.23-,10.25-, and 4.77-fold higher than those of the control. The expression levels of Lcc5 and Lcc8 were similar, as seen in Figure 5B, C, and were, respectively, 1.29-, 3.32-, 1.62- and 1.59-, 2.33-, and 1.30-fold higher at 120 h, 168 h, and 216 h. The transcription levels of Lcc12 improved, as seen in Figure 5D, and were, respectively, 4.35-, 6.29-, and 1.61-fold higher than the control after the optimization.
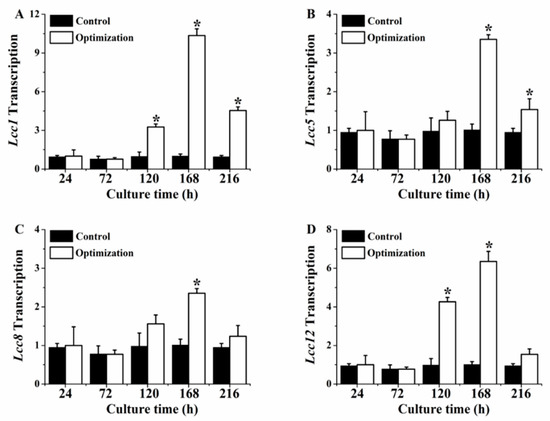
Figure 5.
The transcriptional level of Lcc genes by P. eryngii-3 after optimization. (A) Lcc1; (B) Lcc5; (C) Lcc8; (D) Lcc12. * Indicates statistical significance (p < 0.05) compared to the control. Data points are the average of n = 3; error bars represent the standard error of the mean. The samples were harvested at 168 h of fermentation.
3.6. Optimization of Significant Variables by BBD
The results of the RSM were shown as three different gradients for the temperature (A), volume (B), and rotation speed (C), as seen in Figure 6. The following polynomial model was derived from the cubic model:
DCW = 17.66 + 0.1812 ∗ A − 0.2075 ∗ B − 0.3762 ∗ C − 0.0055 ∗ AB + 1.32 ∗ AC + 0.44 ∗ BC − 1.78 ∗ A2 − 1.98 ∗ B2 − 2.17 ∗ C2
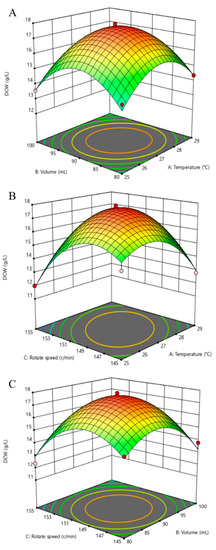
Figure 6.
Response surface plot showing the effects of two various factors on the DCW of P. eryngii-3. (A) Combined effects on the DCW of temperature and volume; (B) Combined effects on the DCW of temperature and rotation speed; (C) Combined effects on the DCW of volume and rotation speed. Data points are the average of n = 3; error bars represent the standard error of the mean. The samples were harvested at 168 h of fermentation.
The DCW was analyzed using Duncan’s multiple range test in the RSM, in which the numbers 10 and 15 (17.8497 ± 1.4543 and 17.6945 ± 0.1203 g/L, respectively) were relatively significant. The experimental data on the DCW was analyzed and fit a cubic model with high R2 values (0.9758). Setting significance at the 5% level (p < 0.05), the model p value was <0.0001, which implied that the model was significant, as seen in Table 7. In addition, the significance of the lack of fit was 0.0043 < 0.01, which means the difference between the fitted model function and the real function was very small and the fitting effect was very good.
Table 7.
Analysis of variance of response surface quadratic model.
4. Discussion
4.1. Screening of Culture Medium by P. eryngii-3
The culture medium is an important factor in the industrial production of P. eryngii-3 as it affects the growth of microbes and therefore the economic benefits to the company. Therefore, the suitable selection of the culture medium is imperative for the improvement of the economic benefits of P. eryngii-3. In this research, nine media were selected, as seen in Table 2, in which the DCW, total protein, polysaccharides, regrowth rate, and diameter of mycelium were investigated. The physiological parameters of the regrowth rate and diameter of mycelium were the manifestation of the external morphology of P. eryngii-3. The dominant media for the diameter of mycelium were mediums 1, 3, and 7 (respectively, 1.57500 ± 0.3536, 2.07000 ± 0.3137, and 1.13000 ± 0.2054 mm). The mediums with the faster regrowth rates were mediums 1, 2, and 3 (respectively, 0.6725 ± 0.0106, 0.5150 ± 0.0000, and 0.5075 ± 0.0601 mm/d). Visibly, medium 3 could promote the formation of the microsphere structure and the growth of mycelium.
The biochemical indexes of P. eryngii-3 were detected in the DCW, total protein, and polysaccharides. The DCW was used to characterize the biomass by P. eryngii-3, which indicated that microorganisms could efficiently absorb and transform nutrients from the culture medium. A higher DCW was obtained in mediums 3, 5, and 6 (respectively, 5.9863 ± 0.3518, 4.5600 ± 0.1379, and 4.8450 ± 0.0124 g/L). The total protein was the mean of the protein formed by absorption and transformation in P. eryngii-3, in which mediums 3, 5, and 6 achieved a better result (respectively, 0.4811 ± 0.0642, 0.4320 ± 0.0332, and 0.4674 ± 0.0088 mg/mL). Mediums 3, 5, and 6 had a strong advantage in the biosynthesis of polysaccharides (respectively, 0.5123 ± 0.0001, 0.4536 ± 0.0161, and 0.4376 ± 0.0016 mg/mL), which had a variety of biological activities, such as hyperglycemic, antiviral, and antineoplastic [39]. Therefore, medium 3 was identified as the optimum medium for the fermentation of P. eryngii-3 by comparison.
4.2. Optimization of Carbon and Nitrogen Sources
The carbon and nitrogen sources are important components of the culture medium and affect the growth and metabolism of microorganisms [40,41]. The optimal culture medium was confirmed as medium 3 for the fermentation of P. eryngii-3; however, the components need to be further optimized. In this work, glucose, corn flour, maltose, lactose, and fructose were investigated as the carbon sources, as seen in Figure 1, and corn flour was determined as the suitable carbon for the DCW and polysaccharides of P. eryngii-3. Similar results were found when the corn flour was set as the optimized carbon in Lactobacillus plantarum LOCK 0860 for the production of probiotics [42]. In addition, the nitrogen source was selected from soybean meal, peptone, beef extract, sodium nitrate, and urea, as seen in Figure 2, and the amounts of the DCW, total protein, and polysaccharides were all promoted by soybean meal. The improvement of protein quality and the degradation of allergens in the medium of soybean meal were investigated by Neurospora crassa [43]. In addition, the concentrations of corn flour and soybean meal were optimized by orthogonal experiments, as seen in Table 4, in which the concentration of corn flour and soybean meal were both determined to be 40 g/L through a comparison of the DCW, total protein, and polysaccharides.
4.3. Optimization of Fermentation Conditions by P. eryngii-3
After the components of the culture medium were optimized, the optimal fermentation period was investigated and determined to be 168 h (Figure 3A,B). The fermentation cycle depended on the changes in the biomass, nutrient content (protein, polysaccharides), and laccase activity. An analogical phenomenon was found in the research of Pleurotus ostreatus and Pleurotus eryngii mushroom strains on agro-industrial residues, in which the growth, laccase, and biomass production were investigated for the screening of the optimized fermentation substance [44].
Then, the fermentation conditions were optimized from the pH, temperature, volume, and rotation speed. The effect of pH is to change the concentrations of H+ and OH- in the culture mediums, which could affect the activity of important enzymes in the growth and metabolism of microbes. In this work, pH = 6 was found to be a suitable pH for the accumulation of biomass and synthesis of active substances by P. eryngii-3. The research on pH was also investigated in lignocellulolytic enzymes by the Pleurotus genus and laccase production by a common macrofungal [45,46]. Temperature is another important factor that affects the activity of enzymes and the stability of metabolites; the effect of temperature was obvious in the DCW and polysaccharides in this paper. A similar phenomenon was found in the expression of peroxidase by Pleurotus eryngii that depended on the cultivation temperature [47]. The volume of the medium influenced the concentration of oxygen in the Erlenmeyer flask, which affected the uptake of oxygen in microorganisms. The tendencies of the DCW, laccase activity, total protein, and polysaccharides were coincident with the different volumes. Volume as a necessary factor in the fermentation of microbes was investigated in the production of exopolysaccharides by Oudemansiella radicata in shaken flasks and 5 L bioreactors [48]. In addition, the rotation speed is a common regulatory parameter in submerged fermentation, in which the rotation speed is generally optimized. The DCW and polysaccharides were clearly improved by different rotation speeds. The research of microbial composting by different fruit wastes in submerged fermentations was optimized by the rotation speed, which was determined to be 80–100 rev. min−1 [49].
The activity of laccase was clearly improved by the optimization of the medium and fermentation conditions, as seen in Figure 3 and Figure 4. The laccase catalyzed the oxidation of a wide range of substrates (mainly phenolics, methoxy-substituted monophenols, and aromatic amines), which was developed for the decomposition of lignocellulose, bleaching in paper industries, clarification of juice and wine, and synthesis of biofuel [50,51]. Sato et al. [52] utilized Lentinula edodes to produce the laccase for industrial manufacture and verified that the Lcc1 gene was expressed and then promoted the biosynthesis of laccase. Yan et al. [53] explored the function of Lcc genes by Lentinula edodes W1-26 under the conditions of different carbon sources, temperatures, and photoperiods. In this paper, the transcription levels of Lcc1, Lcc5, Lcc8, and Lcc12 were investigated after the optimization of the medium and fermentation conditions, in which the expression levels of Lcc1 and Lcc12 were, respectively, 10.25- and 6.29-fold higher than those of the control at 168 h. It was speculated that P. eryngii-3 could be developed to produce laccase by industries.
4.4. Optimization of Fermentation by BBD
Response surface methodology is the analysis of a response that has been influenced by several factors to obtain the optimal conditions [54]. In the study of Atly et al., a Box–Behnken experimental design was utilized to obtain the optimum levels of barley, yeast extract, and the particle size of the solid substrate for the fermentation of lovastatin by Pleurotus ostreatus [55]. In this work, the effects of temperature, volume, and rotation speed were better than the pH on the metabolic parameters of P. eryngii-3, as seen in Figure 6. As the results of the RSM showed, the model predicted that the highest DCW of 17.8497 ± 1.4543 g/L would be obtained with the conditions of temperature, volume, and rotation speed of 25.9 °C, 96.6 mL, and 152.5 r/min, respectively. The experiments in the shake flask (n = 3) were taken to verify the theoretical optimum. The DCW result of the verified experiment was 17.2345 ± 0.7845 g/L using the predicted conditions, which was only 3.47% lower than the predicted value of the polynomial equation. This indicated the proficiency of the model used for the fermentation process optimization.
5. Conclusions
In this work, the authors hoped to develop a rapid breeding process for Pleurotus eryngii hypha for saving time and costs in industrial production. The biomass and metabolic parameters of P. eryngii-3 were optimized by the selection of the culture medium, optimization of carbon and nitrogen sources, optimization of culture conditions, and statistical method, in which the DCW of P. eryngii-3 improved to 17.2345 ± 0.7845 g/L. Meanwhile, the activity of laccase also increased to 6.13 U/mL after the optimization and the transcription levels of the Lcc genes were upregulated and thus helped the promotion of laccase activity. This work can provide valuable experiences and a theoretical basis for the industrial production of Pleurotus eryngii hypha.
Author Contributions
C.L.: Methodology, Formal analysis, Writing—review and editing. J.F.: Investigation, Formal analysis. S.W.: Investigation, Formal analysis. Y.C.: Investigation, Formal analysis. Y.S.: Resources, Conceptualization, Supervision, Funding acquisition. All authors have read and agreed to the published version of the manuscript.
Funding
This work was supported by funding from the North Jiangsu Science and Technology Special Project of the Science and Technology Department in Jiangsu Province (SZ-YC2019044), and school-level research projects of the Yancheng Institute of Technology (xjr2020026).
Institutional Review Board Statement
Not applicable.
Informed Consent Statement
Not applicable.
Data Availability Statement
The data generated or analyzed in this study are included in this article.
Acknowledgments
Special thanks to Jiangsu Jiuhe Biotechnology Development Co., Ltd. for providing Pleurotus eryngii-3.
Conflicts of Interest
The authors declare that there are no competing interests and the article is submitted without any commercial or economic interests that could be perceived as potential conflicts of interest.
Declarations
Ethics approval and consent to participate: The authors declare that this study complies with the current laws of the countries in which the experiments were performed.
References
- Zervakis, G.I.; Ntougias, S.; Gargano, M.L.; Besi, M.I.; Polemis, E.; Typas, M.A.; Venturella, G. A reappraisal of the Pleurotus eryngii complex-New species and taxonomic combinations based on the application of a polyphasic approach, and an identification key to Pleurotus taxa associated with Apiaceae plants. Fungal. Biol. UK 2014, 118, 814–834. [Google Scholar] [CrossRef]
- Zervakis, G.I.; Venturella, G.; Papadopoulou, K. Genetic polymorphism and taxonomic infrastructure of the Pleurotus eryngii speciescomplex as determined by RAPD analysis, isozyme profiles and ecomorphological characters. Microbiology 2001, 147, 3183–3194. [Google Scholar] [CrossRef]
- Wen, J.; Zhang, Z.; Gong, L.; Xun, H.; Li, J.; Qi, B.; Wang, Q.; Li, X.; Li, Y.; Liu, B. Transcriptome changes during major developmental transitions accompanied with little alteration of DNA methylome in two Pleurotus species. Genes 2019, 10, 465. [Google Scholar] [CrossRef]
- Wang, Y.; Wang, R.; Mao, W.J.; Gong, M.; Gao, Y.N.; Tang, L.H.; Yang, R.F.; Li, Y.; Zhou, C.L.; Bao, D.P. A simple and efficient transformation system for the edible mushroom Pleurotus eryngii. Mycoscience 2016, 57, 356–360. [Google Scholar] [CrossRef]
- Deora, A.; Sharma, S.S.; Kumari, P.; Dahima, V.; Kumar, S.; Rohith, M. Cultivation of Kabul Dhingri (Pleurotus eryngii) mushroom by standardizing protocols in subtropical zones of world. Sci. Rep. 2021, 11, 14692–14702. [Google Scholar] [CrossRef]
- Niazi, A.R.; Ghafoor, A. Different ways to exploit mushrooms: A review. All Life 2021, 14, 450–460. [Google Scholar] [CrossRef]
- Hernández-Ortega, A.; Ferreira, P.; Martínez, A.T. Fungal aryl-alcohol oxidase: A peroxide-producing flavoenzyme involved in lignin degradation. Appl. Microbiol. Biotechnol. 2012, 93, 1395–1410. [Google Scholar] [CrossRef]
- Nayan, N.; Sonnenberg, A.S.M.; Hendriks, W.H.; Cone, J.W. Prospects and feasibility of fungal pretreatment of agricultural biomass for ruminant feeding. Anim. Feed Sci. Tech. 2020, 268, 114577. [Google Scholar] [CrossRef]
- Srikanth, M.; Sandeep, T.S.R.S.; Sucharitha, K.; Godi, S. Biodegradation of plastic polymers by fungi: A brief review. Bioresour. Bioprocess 2022, 9, 42. [Google Scholar] [CrossRef]
- Hock, O.G.; Lum, H.W.; Qin, D.D.; Kee, W.K.; Shing, W.L. The growth and laccase activity of edible mushrooms involved in plastics degradation. Appl. Curr. Top. Toxicol. 2019, 15, 57–62. [Google Scholar]
- Kapahi, M.; Sachdeva, S. Mycoremediation potential of Pleurotus species for heavy metals: A review. Bioresour. Bioprocess 2017, 4, 32. [Google Scholar] [CrossRef]
- Joo, J.H.; Hussein, K.A.; Hassan, S.H.A. Biosorptive capacity of Cd(II) and Pb(II) by lyophilized cells of Pleurotus eryngii. Korean J. Soil Sci. Fert. 2011, 44, 615–624. [Google Scholar] [CrossRef]
- Bederska-Łojewska, D.; Swiatkiewicz, S.; Muszynska, B. The use of Basidiomycota mushrooms in poultry nutrition—A review. Anim. Feed Sci. Tech. 2017, 230, 59–69. [Google Scholar] [CrossRef]
- Lee, T.T.; Ciou, J.Y.; Chen, C.N.; Yu, B. The effect of Pleurotus eryngii stalk residue dietary supplementation on layer performance, egg traits and oxidative status. Ann. Anim. Sci. 2015, 15, 447–461. [Google Scholar] [CrossRef]
- Wong, J.H.; Ng, T.B.; Chan, H.H.L.; Liu, Q.; Man, G.C.W.; Zhang, C.Z.; Guan, S.; Ng, C.C.W.; Fang, E.F.; Wang, H.; et al. Mushroom extracts and compounds with suppressive action on breast cancer: Evidence from studies using cultured cancer cells, tumor-bearing animals, and clinical trials. Appl. Microbiol. Biot. 2020, 104, 4675–4703. [Google Scholar] [CrossRef]
- Giardina, P.; Faraco, V.; Pezzella, C.; Piscitelli, A.; Vanhulle, S.; Sannia, G. Laccases: A never-ending story. Cell. Mol. Life Sci. 2010, 67, 369–385. [Google Scholar] [CrossRef]
- Zhang, B.; Li, Y.; Zhang, F.; Linhardt, R.J.; Zeng, G.; Zhang, A. Extraction, structure and bioactivities of the polysaccharides from Pleurotus eryngii: A review. Int. J. Biol. Macromol. 2020, 150, 1342–1347. [Google Scholar] [CrossRef]
- Leong, Y.K.; Ma, T.W.; Chang, J.S.; Yang, F.C. Recent advances and future directions on the valorization of spent mushroom substrate (SMS): A review. Bioresour. Technol. 2022, 344, 126157. [Google Scholar] [CrossRef]
- Correa, R.C.G.; Brugnari, T.; Bracht, A.; Peralta, R.M.; Ferreira, I.C.F.R. Biotechnological, nutritional and therapeutic uses of Pleurotus spp. (Oyster mushroom) related with its chemical composition: A review on the past decade findings. Trends Food Sci. Tech. 2016, 50, 103–117. [Google Scholar] [CrossRef]
- Palma, C.; Lloret, L.; Sepúlveda, L.; Contreras, E. Production of versatile peroxidase from Pleurotus eryngii by solid-state fermentation using agricultural residues and evaluation of its catalytic properties. Prep. Biochem. Biotech. 2016, 46, 200–207. [Google Scholar] [CrossRef]
- Stajic, M.; Vukojevic, J.; Duletic-Lausevic, S. Biology of Pleurotus eryngii and role in biotechnological processes: A review. Crit. Rev. Biotechnol. 2009, 29, 55–66. [Google Scholar] [CrossRef]
- Wei, H.; Yue, S.; Zhang, S.; Lu, L. Lipid-lowering effect of the Pleurotus eryngii (King Oyster Mushroom) polysaccharide from solid-state fermentation on both macrophage-derived foam cells and zebrafish models. Polymers 2018, 10, 492. [Google Scholar] [CrossRef]
- Wang, C.Y. A review on the potential reuse of functional polysaccharides extracted from the by-products of mushroom processing. Food Bioprocess Tech. 2020, 13, 217–228. [Google Scholar] [CrossRef]
- Zeng, X.; Suwandi, J.; Fuller, J.; Doronila, A.; Ng, K. Antioxidant capacity and mineral contents of edible wild Australian mushrooms. Food Sci. Technol. Int. 2012, 18, 367–379. [Google Scholar] [CrossRef]
- Wyman, V.; Henríquez, J.; Palma, C.; Carvajal, A. Lignocellulosic waste valorisation strategy through enzyme and biogas production. Bioresource Technol. 2018, 247, 402–411. [Google Scholar] [CrossRef]
- Zhang, Q.; Zhao, L.; Li, Y.; Wang, F.; Li, S.; Shi, G.; Ding, Z. Comparative transcriptomics and transcriptional regulation analysis of enhanced laccase production induced by co-culture of Pleurotus eryngii var. ferulae with Rhodotorula mucilaginosa. Appl. Microbiol. Biot. 2020, 104, 241–255. [Google Scholar] [CrossRef]
- Wang, B.; Zhao, N.; Li, J.; Xu, R.; Wang, T.; Guo, L.; Ma, M.; Fan, M.; Wei, X. Selenium-enriched Lactobacillus plantarum improves the antioxidant activity and flavor properties of fermented Pleurotus eryngii. Food Chem. 2021, 345, 128770–128778. [Google Scholar] [CrossRef]
- Nguyen, T.N.; Ranamukhaarachchi, S.L. Effect of different culture media, grain sources and alternate substrates on the mycelial growth of Pleurotus eryngii and Pleurotus ostreatus. Pak. J. Biol. Sci. 2020, 23, 223–230. [Google Scholar] [CrossRef]
- Singh, U.; Gautam, A.; Singha, T.K.; Tiwari, A.; Tiwari, P.; Sahai, V.; Sharma, S. Mass production of Pleurotus eryngii mycelia under submerged culture conditions with improved minerals and vitamin D2. LWT-Food Sci. Technol. 2020, 131, 109665. [Google Scholar] [CrossRef]
- Zhang, Y.; Jiao, R.; Lu, Y.; Yao, L. Improvement of chaetominine production by tryptophan feeding and medium optimization in submerged fermentation of Aspergillus fumigatus CY018. Bioresour. Bioprocess. 2016, 3, 45–53. [Google Scholar] [CrossRef][Green Version]
- Shenbhagaraman, R.; Jagadish, L.K.; Premalatha, K.; Kaviyarasan, V. Optimization of extracellular glucan production from Pleurotus eryngii and its impact on angiogenesis. Int. J Biol. Macromol. 2012, 50, 957–964. [Google Scholar] [CrossRef]
- Ge, X.; Huang, W.; Xu, X.; Lei, P.; Sun, D.; Xu, H.; Li, S. Production, structure, and bioactivity of polysaccharide isolated from Tremella fuciformis XY. Int. J Biol. Macromol. 2020, 148, 173–181. [Google Scholar] [CrossRef] [PubMed]
- Bellettini, M.B.; Fiorda, F.A.; Maieves, H.A.; Teixeira, G.L.; Avila, S.; Hornung, P.S.; Junior, A.M.; Ribani, R.H. Factors affecting mushroom Pleurotus spp. Saudi J. Biol. Sci. 2019, 26, 633–646. [Google Scholar] [CrossRef] [PubMed]
- Tang, B.; Lai, P.; Weng, M.; Wu, L.; Li, Y. Optimization of submerged fermentation conditions for biosynthesis of ergothioneine and enrichment of selenium from Pleurotus eryngii 528. Food Sci. Tech. 2022, 42, e40022. [Google Scholar] [CrossRef]
- Singh, U.; Gautam, A.; Sharma, S. Enhancement of Vitamin D2 content through ultraviolet-B irradiation in submerged cultivated Pleurotus eryngii mycelia using response surface methodology. J. Appl. Biol. Biotechnol. 2021, 9, 121–126. [Google Scholar]
- Bourbonnais, R.; Paice, M.G. Oxidation of non-phenolic substrates: An expanded role for laccase in lignin biodegradation. FEBS 08563 1990, 267, 99–102. [Google Scholar] [CrossRef]
- Cavallazzi, J.R.P.; Oliveira, M.G.D.A.; Kasuya, M.C.M. Laccase production by Lepista sordida. Braz. J. Microbiol. 2004, 35, 261–263. [Google Scholar] [CrossRef]
- Passarini, M.R.; Ottoni, C.A.; Santos, C.; Lima, N.; Sette, L.D. Induction, expression and characterisation of laccase genes from the marine-derived fungal strains Nigrospora sp. CBMAI 1328 and Arthopyrenia sp. CBMAI 1330. AMB Express 2015, 5, 19. [Google Scholar] [CrossRef]
- Chen, J.; Yong, Y.; Xing, M.; Gu, Y.; Zhang, Z.; Zhang, S.; Lu, L. Characterization of polysaccharides with marked inhibitory effect on lipid accumulation in Pleurotus eryngii. Carbohyd. Polym. 2013, 97, 604–613. [Google Scholar] [CrossRef]
- Tong, A.; Lu, J.; Huang, Z.; Huang, Q.; Zhang, Y.; Farag, M.A.; Liu, B.; Zhao, C. Comparative transcriptomics discloses the regulatory impact of carbon/nitrogen fermentation on the biosynthesis of Monascus kaoliang pigments. Food Chem. X 2022, 13, 100250–100259. [Google Scholar] [CrossRef]
- Stajic, M.; Persky, L.; Friesem, D.; Hadar, Y.; Wasser, S.P.; Nevo, E.; Vukojevic, J. Effect of different carbon and nitrogen sources on laccase and peroxidases production by selected Pleurotus species. Enzym. Microb. Tech. 2006, 38, 65–73. [Google Scholar] [CrossRef]
- Archacka, M.; Celinska, E.; Białas, W. Techno-economic analysis for probiotics preparation production using optimized corn flour medium and spray-drying protective blends. Food Bioprod. Process. 2020, 123, 354–366. [Google Scholar] [CrossRef]
- Li, J.; Zhou, R.L.; Ren, Z.Q.; Fan, Y.W.; Hu, S.B.; Zhuo, C.F.; Deng, Z.Y. Improvement of protein quality and degradation of allergen in soybean meal fermented by Neurospora crassa. LWT Food Sci. Technol. 2019, 101, 220–228. [Google Scholar] [CrossRef]
- Melanouri, E.M.; Dedousi, M.; Diamantopoulou, P. Cultivating Pleurotus ostreatus and Pleurotus eryngii mushroom strains on agro-industrial residues in solid-state fermentation. Part I: Screening for growth, endoglucanase, laccase and biomass production in the colonization phase. Carbon Resour. Convers. 2022, 5, 61–70. [Google Scholar] [CrossRef]
- Kim, D.; Ko, Y.H.; Chung, H.C.; Han, G.D. Straightforward bacterial-fungal fermentation between Lactobacillus plantarum and Pleurotus eryngii for synergistic improvement of bioactivity. Food Sci. Biotechnol. 2015, 24, 607–610. [Google Scholar] [CrossRef]
- Mathur, P.; Sanyal, D.; Dey, P. Optimization of growth conditions for enhancing the production of microbial laccase and its application in treating antibiotic contamination in wastewater. 3 Biotechnology 2021, 11, 81–95. [Google Scholar] [CrossRef]
- Eibes, G.M.; Lu-Chau, T.A.; Ruiz-Duenas, F.J.; Feijoo, G.; Martinez, M.J.; Martinez, A.T.; Lema, J.M. Effect of culture temperature on the heterologous expression of Pleurotus eryngii versatile peroxidase in Aspergillus hosts. Bioproc. Biosyst. Eng. 2009, 32, 129–134. [Google Scholar] [CrossRef] [PubMed]
- Wu, C.Y.; Lin, Y.P.; Wang, J.C.; Liang, Z.C. Effect of cultivation conditions on the production of mycelial biomass and exopolysaccharide by submerged culture of a rooting shank medicinal mushroom, Oudemansiella radicata (Relhan) singer (Agaricomycetideae). Int. J. Med. Mushrooms 2010, 12, 99–110. [Google Scholar] [CrossRef]
- Petre, M.; Petre, V.; Rusea, I. Microbial composting of fruit tree wastes through controlled submerged fermentation. Ital. J. Agron. 2014, 9, 610–614. [Google Scholar] [CrossRef]
- Vats, A.; Mishra, S. Laccase isoform diversity on basal medium in Cyathus bulleri and role in decolorization/detoxification of textile dyes and effluent. World, J. Microb. Biot. 2020, 36, 164. [Google Scholar] [CrossRef]
- Ahlawat, A.; Mishra, S. Structural, phylogenetic and expression analysis of genes producing lignin degrading enzymes in the basidiomycete Cyathus bulleri and their effect on the release of reducing sugars from agro-residues. Fuel 2022, 314, 122716. [Google Scholar] [CrossRef]
- Sato, T.; Suzuki, Y.; Naito, M.; Minami, A.; Suzuki, N.; Yaegashi, K.; Hirano, T. Overexpression of the laccase gene, lcc1, in Lentinula edodes using the pChG vector. Mycoscience 2019, 60, 246–249. [Google Scholar] [CrossRef]
- Yan, L.; Xu, R.; Bian, Y.; Li, H.; Zhou, Y. Expression Profile of Laccase Gene Family in White-Rot Basidiomycete Lentinula edodes under Different Environmental Stresses. Genes 2019, 10, 1045. [Google Scholar] [CrossRef] [PubMed]
- Isham, N.K.M.; Mokhtar, N.; Fazry, S.; Lim, S.J. The development of an alternative fermentation model system for vinegar production. LWT-Food Sci. Technol. 2019, 100, 322–327. [Google Scholar] [CrossRef]
- Atly, B.; Yamac, M.; Yyldyz, Z.; Solener, M. Solid state fermentation optimization of Pleurotus ostreatus for lovastatin production. Pharm. Chem. J. 2019, 53, 858–864. [Google Scholar] [CrossRef]


Publisher’s Note: MDPI stays neutral with regard to jurisdictional claims in published maps and institutional affiliations. |
© 2022 by the authors. Licensee MDPI, Basel, Switzerland. This article is an open access article distributed under the terms and conditions of the Creative Commons Attribution (CC BY) license (https://creativecommons.org/licenses/by/4.0/).