Article

Fertilizer of the Future: Beneficial Bacteria Promote Strawberry Growth and Yield and May Reduce the Need for Chemical Fertilizer

by
Leandro Israel da Silva
1,*,
Indira Pereira de Oliveira
2,
Ederson da Conceição Jesus
3,
Marlon Corrêa Pereira
4,
Moacir Pasqual
2,
Ronilson Carlos de Araújo
2 and
Joyce Dória
2,*
1
Biology Department, Federal University of Lavras, Lavras 37200-000, MG, Brazil
2
Agriculture Department, Federal University of Lavras, Lavras 37200-000, MG, Brazil
3
Embrapa Agrobiology, Highway BR 465, Km 7, Seropédica 23897-970, RJ, Brazil
4
Biological Science and Health Institute, Federal University of Viçosa—Campus Rio Paranaíba, Rio Paranaíba 38810-000, MG, Brazil
*
Authors to whom correspondence should be addressed.
Agronomy 2022, 12(10), 2465; https://doi.org/10.3390/agronomy12102465
Submission received: 31 August 2022 / Revised: 24 September 2022 / Accepted: 29 September 2022 / Published: 11 October 2022

Abstract

:
Agriculture is a fundamental activity for human development. However, its sustainable practice is required to ensure the perpetuity of future resources. In this way, bacteria can benefit crops by making available nutrients and metabolites, mainly contributing to reducing the demand for chemical fertilizers. This study aimed to evaluate the biofertilizing capacity of Azospirillum brasilense, Bacillus megaterium, and Brevibacillus fluminis and their effects on improving the physiological and morphoanatomical properties of strawberry seedlings. In vitro tests were performed to evince their potential to supply nutrients (P and K) and produce siderophores and indole-acetic acid. In an inoculation experiment, these strains were inoculated in isolation and mixed in pairs and triples. This experiment was carried out in a greenhouse in a completely randomized design (CRD). The inoculated treatments were fertilized with 30% N and P demands; the uninoculated control received 30% and 100% of these demands. Leaf gas exchange, total chlorophylls, and crown diameter were evaluated during cultivation. After 138 days, leaf number, nutrient content, root length, root and shoot fresh and dry weight, and total seedlings were evaluated. The bacteria tested positive in all in vitro evaluations except for siderophore production. The strawberry responded positively to inoculation. The inoculation, either in isolation or in a mixture, improved stomatal conductance, leaf transpiration, internal CO2 concentration, leaf N and Mg contents, crown diameter, leaf area, and root elongation. We can conclude that the intermediation of microorganisms improves nutrient use efficiency and reduces the strawberry’s fertilizer demand by up to 70%, leading to plant development and yields comparable to complete fertilization.

Graphical Abstract

1. Introduction

Agriculture is a fundamental activity for society, constituting the livelihood of about 40% of the world population [1]. Alexandratos and Bruinsma [2] estimated that the global population will grow 35% by 2050, requiring a 60% increase in agricultural production.
In this sense, strawberry characterizes a market of global interest. The fruit is highly appreciated due to its unique organoleptic characteristics, being cultivated on a large scale in different countries [3,4]. In 2020, 385,000 ha across the globe were cultivated with this crop, with about 8.9 million tons harvested [5].
Nevertheless, the current agricultural model is very dependent on the use of chemical fertilizers to ensure crop productivity [6]. In many cases, these fertilizers are applied in excess, with a small fraction used by the plants [7,8]. However, this excessive application risks the environment and the overall quality of the agricultural system [9]. In addition, it is essential to note that resources, such as phosphate rock deposits, are finite, and their indiscriminate exploitation risks their perpetuity [10,11].
Bacteria can interact with plants beneficially, and this interaction happens through several mechanisms that provide them the ability to make essential nutrients available to plants, such as N, through nitrogen fixation [12], and P, through phosphate solubilization [13]. In addition, these microbes also synthesize plant hormones and affect the plant’s hormonal balance [14], among other mechanisms. As a consequence, these bacteria are known as plant growth-promoting bacteria.
The use of microorganisms as inoculants, alone or in consortia, has been explored in many crops [15,16,17]. Bacteria such as Azospirillum brasilense have been components of product formulations and targets of studies due to their nitrogen-fixing and plant growth-promoting abilities [18,19]. The genus Bacillus also demonstrates interesting capabilities for phosphate solubilization and the production of metabolites such as antifungal substances [20,21].
Microorganisms also benefit plant physiology. For example, studies indicate they can improve leaf gas exchange [22,23,24]. In addition, the use of plant growth-promoting microorganisms as biofertilizers contributes to reducing the demand for the application of chemical fertilizers [25]. Their inoculation can reduce nitrogen and phosphorus fertilizations by 25–50% [26,27] and 50–75% [28], respectively, showing performances that match those of fully fertilized plants.
Thus, the interaction between plants and microorganisms becomes a viable alternative for agricultural production as it is currently unfeasible to establish agriculture that does not guarantee resource sustainability [29,30].
Within this context, this study aimed to investigate the ability of Azospirillum brasilense, Bacillus megaterium, and Brevibacillus fluminis to promote strawberry growth and improve its physiological properties related to leaf gas exchange. These bacteria were inoculated alone or in combinations in strawberry seedlings with reduced N and P fertilization to verify whether their use allows a reduction in part of the nutrient demand necessary for strawberry growth. The results indicate that bacterial inoculation benefits several physiological and morphoanatomical properties, providing a reduction of up to 70% in N and P demands.

2. Materials and Methods

2.1. Cultivation Conditions of Isolates and Standardization of Inoculum

The microorganisms used in this study were A. brasilense (Ab-v5) and B. megaterium (CCMA 0004), from the Agricultural Microbiology Culture Collection at the Federal University of Lavras, and B. fluminis (MET12M2), previously isolated from strawberry.
The microorganisms were preserved in a solution containing nutrient broth (1 g/L of beef extract, 1 g/L of yeast extract, 5 g/L peptone, 5 g/L of NaCl, pH = 6.8–7) and 40% glycerol, and refrigerated at −20 °C. Inoculum preparation was carried out in a nutrient broth medium. The incubation temperature was 30 °C, and the pH was adjusted to 6.8 with shaking of the culture vessels in an orbital shaker at 120 rpm.
After 12 h of cultivation, the cultures had their optical density standardized in a spectrophotometer at a wavelength of 600 nm at a value of 0.5, equivalent to 1 × 10⁸ CFU/mL on the McFarland scale. Aliquots were collected from these inocula containing an approximate number of colony-forming units to carry out the growth promotion tests and inoculate strawberry seedlings.

2.2. Metabolic Profile of Growth-Promoting Bacteria

2.2.1. Phosphate Solubilization

The methodology of Nautiyal [31] was used to evaluate the ability of the isolates to solubilize phosphate. First, the isolates were cultivated in an NBRIP culture medium (10 g/L of glucose, 5 g/L of MgCl2·6H2O, 5 g/L of Ca3(PO4)2, 0.25 g/L of MgSO4·7H2O, 0.2 g/L of KCl, 0.1 g/L of (NH4)2SO4, and 15 g/L of agar, pH = 6.8–7); then, 10 µL of each cell suspension was inoculated separately at three equidistant points in a petri dish. Lastly, the treatments in triplicate were stored for 15 days at 30 °C.
The ability to solubilize phosphate was measured by observing the translucent halo around the colonies, which is evidence of tricalcium phosphate Ca3(PO4)2 solubilization. The significance of element degradation was measured by calculating the solubilization index (SI) [31,32,33].
S I = Colony   diameter   +   Halo   diameter Colony   diameter

2.2.2. Potassium Solubilization

Potassium solubilization was verified according to the methodology of Sun et al. [34] using the modified Aleksandrov medium. The medium used was composed of 5 g/L of KNO3, 0.2 g/L of KCl, 0.5 g/L of (NH4)2SO4, 0.1 g/L of MgSO4.7H2O, 0.1 g/L of MnSO4, 0.125 g/L of bromocresol purple, and 10 g/L of glucose, pH = 6.8–7. A positive result is shown by a change in pH indicated by bromocresol purple.

2.2.3. Siderophore Production

Siderophore production was checked according to Louden et al. [35] with modifications in their methodology. For this, the B-King culture medium was used with the following processes:
B-King medium: 1.5 g/L of K2HPO4, 1.5 g/L of MgSO47H2O, 15 mL/L of glycerol, 15 g/L of agar;
Solution A (CAS): 72.9 mg of HDTMA (hexadecyltrimethylammonium bromide) dissolved in 40 mL of distilled water;
Solution B: 60.5 mg of chrome azurol sulfonate, dissolved in 50 mL of distilled water, added to a solution of 0.0027 g of FeCl3 in 10 mL of HCl (10 mM).
The two solutions were mixed and autoclaved separately. After sterilization, the culture medium and solutions were mixed in a ratio of 9:1, respectively, thus being poured into Petri dishes. The production of siderophores was evaluated by observing yellowish halos after the inoculation of bacteria in the medium.

2.2.4. Acidification of the Culture Medium

The pH change was measured following Vincent [36]. In this way, the ELMABT medium (mannitol yeast extract, bromothymol blue agar) was used, composed of 1 g/L of K2HPO4, 0.18 g/L of MgSO4.7H2O, 0.2 g/L of NaCl, 9 g/L of mannitol, 1.5 g/L of yeast extract, 5 mL of bromothymol blue solution, and 15 g/L of agar, pH = 7. This culture medium has a greenish color due to a pH of 7. If the cultured microorganism causes an acidification of the medium, it will become yellowish. If it alkalizes the medium, it will have bluish tones.

2.2.5. Indole-Acetic Acid (IAA) Synthesis

IAA production was evaluated using the Salkowski colorimetric method [37,38]. The culture medium for this test was nutrient broth with 100 µg/mL of tryptophan. The isolates were cultured and had their optical density standardized. Afterward, an aliquot of 250 µL of the cell suspension was inoculated, and each treatment was performed in triplicate. The isolates were incubated in a BOD (bio-oxygen demand incubator) for seven days at 30 °C and then centrifuged at 12,000 rpm for 5 min.
The phytohormone production was evaluated by mixing 1 mL of the supernatant with 2 mL of Salkowski reagent (1.875 g of FeCl3·6H2O, 150 mL of 35% H2SO4, and 100 mL of water). The cultures were incubated in BOD at 30 °C for 15 min without light. The pink color of the samples is a positive indication of the presence of auxins.

2.3. Microbial Inoculation on Strawberry Seedlings

The experiment was conducted in a completely randomized design (CRD), with one strawberry plant per pot with six replicates per treatment. The experiment was conducted for 138 days, covering the entire strawberry cycle, in a greenhouse of the Tissue Culture Laboratory of the Department of Agriculture of the Federal University of Lavras.
The inoculation of the tested lines was carried out in seedlings of the cultivar Aromas of neutral day. The seedlings were planted in sterile sand and vermiculite mixed in a 1:1 ratio (v/v). The substrate was autoclaved three times at 121 °C for 1 h, with 24 h intervals between autoclavations. The seedlings were acclimatized in the substrate for 30 days before their inoculation.
The inocula were applied close to the roots according to the treatments and amounts expressed in Table 1. They were reapplied at intervals of 15 days, ensuring the viability of the microorganisms until the end of the experiment. The culture medium was centrifuged, and the pellet was resuspended in potassium phosphorus buffer (16.282 g/L of K2HPO4, 0.9 g/L of KH2PO4, pH = 7.4). Inoculation was performed according to the methods of cultivation and standardization of microorganisms mentioned above. Different volumes of inoculum were adopted to standardize the concentration of cells expressed in each treatment, thus establishing a maximum total volume of inoculated cells.
The seedlings were grown in pots with a volume of 5 L. Irrigation occurred regularly every 2 days. Ten milliliters of Hoagland and Arnon’s solution [39] was applied every 15 days. The complete solution was used in Control 1 (no inoculation with complete fertilization), composed of 2 mL/L of KH2PO4 2 mol/L, 5 mL/L of KNO3 1 mol/L, 10 mL/L of Ca(NO3)2 1 mol/L, 4 mL/L of MgSO4 1 mol/L, 2 mL of micronutrient solution (2.86 g/L of H3BO3, 1.81 g/L of MnCl2, 0.22 g/L of ZnSO4·7H2O, and 0.08 g/L of NaMoO·4H2O), and 2 mL of Fe-EDTA (24.1 g/L of FeSO4·7H2O and 25.1 g/L of EDTA). Control 2 (without inoculation with reduced fertilization) and the inoculated treatments received a reduced solution, with 30% of the original N and P concentrations. Thus, the formulation of the Hoagland and Arnon reduced solution included 6 ml/L of 1 mol/L KCl, 5 ml/L of 1 mol/L CaCl2, 0.3 mL/L of 1 mol/L KH2PO4, 4.5 mL/L of 1 mol/L NH4NO3, 2 mL/L of 1 mol/L MgSO4, 1 mL/L of micronutrient solution, and 1 mL/L of Fe-EDTA.
A natural reactive phosphate from Algeria with 29% P2O5 and solubility equal to 2% in citric acid was added to all treatments in a dose corresponding to 350 mg P/dm3 (13.8 g of phosphate per pot).

2.4. Physiological Evaluation of Foliar Gas Exchange

The physiological evaluation of foliar gas exchange was performed with a portable photosynthesis measurement system (IRGA, Infrared Gas Analyzer-Licor-6400 XT). The analyses were conducted on a sunny day without cloudiness from 7 a.m. to noon. Each treatment was composed of six repetitions, with three readings per plant. The chamber flux was set at 500 μmol·s−1, the internal photosynthetically active radiation (PAR) was set at 1200 μmol·m−2·s−1, the temperature was set at 25 °C, and the CO2 reference was set at 400 μmol·m−2·s−1.
The photosynthetic efficiency (PE, μmol CO2·m−2·s−1), stomatal conductance (gs, mol CO2·m−2·s−1), internal CO2 concentration (Ci, μmol·mol−1), and leaf transpiration rate (T, CO2·m−2·s−1) were measured. In addition, water use efficiency (WUE (μmol·m−2·s−1) (mmol H2O·m−2·s−1)−1) was calculated as the relationship between internal CO2 concentration and leaf transpiration, and carboxylation efficiency (CUE (μmol·m−2·s−1) (μmol·mol−1)−1) was calculated as the relationship between photosynthetic efficiency and internal CO2 concentration.

2.5. Quantification of Chlorophylls

The measurement of total chlorophylls was performed using a nondestructive method. For this, a Falkner chlorophyll meter CFL 1030 was used. Six strawberry plants of each treatment were sampled, and the inference was performed with a reading in the largest leaflet of three distinct leaves. The result of this analysis is expressed as the Falkner chlorophyll index (FCI), according to the instructions of the equipment.

2.6. Evaluation of Plant Morphological Characters

The first morphological evaluation performed on the strawberry plants was the measurement of the diameter of the crown. Two days after the application of the first bacterial inoculum, the distance between the two largest opposite leaves was measured using a digital pachymeter. Fifteen days later, this evaluation was reperformed, seeking to analyze the increase in leaf extension.
The mean crown diameter of the treatments was compared on day 0 and day 15. Furthermore, the variation in growth provided by each treatment was verified in relation to the initial value of the crown length between seedlings. The statistical methodology used to perform these comparisons is described in Section 2.8.
At the end of the experiment, the seedlings were removed from the pots to evaluate the total biomass increment provided by the microorganisms.
The number of leaves and root length (measured with a digital caliper) were counted. The leaf area was also measured. For this, six experimental units of each treatment were collected, from which the largest leaf present on the plant was sampled and scanned. The image generated was processed in ImageJ v1.53 software [40], where the area of each leaf was measured in cm2.
The total fresh matter of the shoot and root were also measured using an analytical balance. This weighing was performed again to measure the dry matter of these variables, for which the seedlings were conditioned in a forced circulation oven at a temperature of 60 °C until their weight stabilized.

2.7. Foliar Nutrient Analysis

Foliar nutrient analysis was performed from the stabilized dry matter. The leaf material from each plant was grouped according to its treatment, thus originating a composite sample. Afterward, they were ground, and the N, P, K, Ca, and Mg contents were determined according to the methodology of Malavolta et al. [41].
Total nitrogen was determined using the Kjeldahl method. The other nutrients were extracted via nitroperchloric digestion and determined using inductively coupled plasma optical emission spectrometry (ICP-OES).

2.8. Experimental Design and Data Analysis

Statistical inferences were performed using RStudio [42] and IBM SPSS Statistics 20 software [43]. The normality and homogeneity of the residuals were checked for all variables. Nonparametric data were analyzed with the Kruskal–Wallis test (p ≤ 0.05) followed by Dunn’s test (p ≤ 0.05) for multiple comparisons. For parametric data, a one-way analysis of variance was performed, followed by the Dunnet test comparing inoculated treatments and controls (p ≤ 0.05). Lastly, Duncan’s test (p ≤ 0.05) was used as a multiple comparison test. The graphs were plotted using SigmaPlot 12.3 [44] and the RStudio software.
Specifically, the mean crown diameter of the treatments was compared on day 0 and day 15 with Duncan’s test (p ≤ 0.05). In addition, the crown diameters from days 0 and 15 were compared with a paired Student’s t-test (p ≤ 0.01). Furthermore, the variation in growth was compared with the overall crown diameter on day 0 using Dunnet’s test (p ≤ 0.05).
A principal component analysis (PCA) on the correlation matrix was performed to check the correlations among the measured variables. The following variables were included in this analysis: morphological variables: crown diameter (day 15), leaf area, number of leaves, root length, shoot fresh and dry weights, root fresh and dry weights, and total fresh and dry weights; physiological variables: internal CO2 concentration, leaf transpiration, stomatal conductance, photosynthetic efficiency, water use efficiency, carboxylation efficiency, foliar nitrogen, phosphorus, potassium, calcium, magnesium, and total chlorophylls. The variables had their measures standardized by subtracting the mean and dividing by the standard deviation, thus resulting in the mean of the standardized variables being equal to 0 and the standard deviation equal to 1. The correlation matrix was built from that, and the graphs were finally plotted with the first two principal components.
The similarity of the treatments was verified. For this purpose, a dendrogram was prepared gathering the average of all variables analyzed in the study. The grouping was performed using the Euclidean distance combined with Ward’s method for minimum variances.

3. Results

3.1. Metabolic Screening

According to the results, it was seen that the microorganisms have several mechanisms with the potential to stimulate plant growth, as presented in Table 2.
All microorganisms were positive for phosphate and potassium solubilization, and none produced siderophores. In addition, the microbial growth of all strains resulted in acidification of the culture medium. Furthermore, the microorganisms were able to synthesize indole-acetic acid.

3.2. Physiological Assessment

The results of the gas exchange analysis of the strawberry plants are shown in Table 3. Bacterial inoculation improved stomatal conductance, internal CO2 concentration, and leaf transpiration.
The PE of all treatments was equivalent to the means of C1 and C2. However, significant differences were observed between treatments. T4 and T3 provided the highest and the lowest PEs, with T4 having a PE 32.74% higher. In the same way, T7 also improved photosynthesis compared to T3, with the values 27.11% higher. The other treatments were statistically similar.
The gs was 39.29% and 48.10% higher in T5 than in C1 and C2, respectively. This treatment also had a larger stomatal opening than T6 (31.46%), and these two treatments were statistically different. In general, all other inoculated treatments showed results that were at least equivalent to those in the controls.
No significant differences in Ci were observed among treatments. Nevertheless, strawberries associated with T3 and T5 concentrated more CO2 in their leaves than controls. The greatest difference was observed between T5 and C2, with 40.82% more CO2 in T5. No significant differences were observed in T, but the values found in T5 were again higher than those of C1 (35.65%) and C2 (41.82%).
T3 had a lower yield than the controls, as indicated by its lower WUE and CUE. Regarding WUE, this treatment was similar to other inoculated treatments except for T4. CUE differed between T3 and T7.
Furthermore, it is important to emphasize that the controls were equivalent for all variables.

3.3. Total Chlorophyll

The chlorophyll concentration was higher in C2 than in C1, accounting for 9.67% more chlorophyll (Figure 1). Initially, the chlorophyll concentration in all inoculated treatments was comparable to that in C1; however, the concentrations in T1, T2, T3, T4, and T5 were lower than in C2 and other equivalent treatments. T7 showed the highest chlorophyll concentration (44.24 FCI).

3.4. Concentration of Leaf Nutrients

Leaf nutrient content was influenced by bacterial activity (Table 4). T4 was the treatment that best benefited the accumulation of macronutrients, in contrast to T1.
Except for T1, leaf N content in all treatments was equivalent to C1. N content in T4 was 11.64%, 54.01%, and 12.83% higher than in T1, T2, and C2, respectively, indicating the consortium’s effectiveness. Treatments T1, T2, and T5 showed a lower K content than both controls. However, T1 had the lowest K content among the inoculated treatments (41.29% lower than T4). No significant differences were observed for P.
Leaf Ca concentration was lower in T1 and T2 compared to the uninoculated controls. Following the same trend, the levels of this nutrient in T1 and T2 were lower than in other inoculation treatments. Ca concentration was lower in T1 than in T3, T4, T5, T6, and T7. The greatest difference was between T4 and T1, which showed 78.31% higher Ca levels. T2 was statistically smaller only than T4, being 20.32% lower.
For Mg, its concentration in T1 was lower than the two controls and the lowest compared to all other treatments. T2, on the other hand, had an Mg content lower than C2 but equivalent to C1. Lastly, T4 and T5 provided values above the average of C1 but lower than C2.

3.5. Crown Diameter Measurement

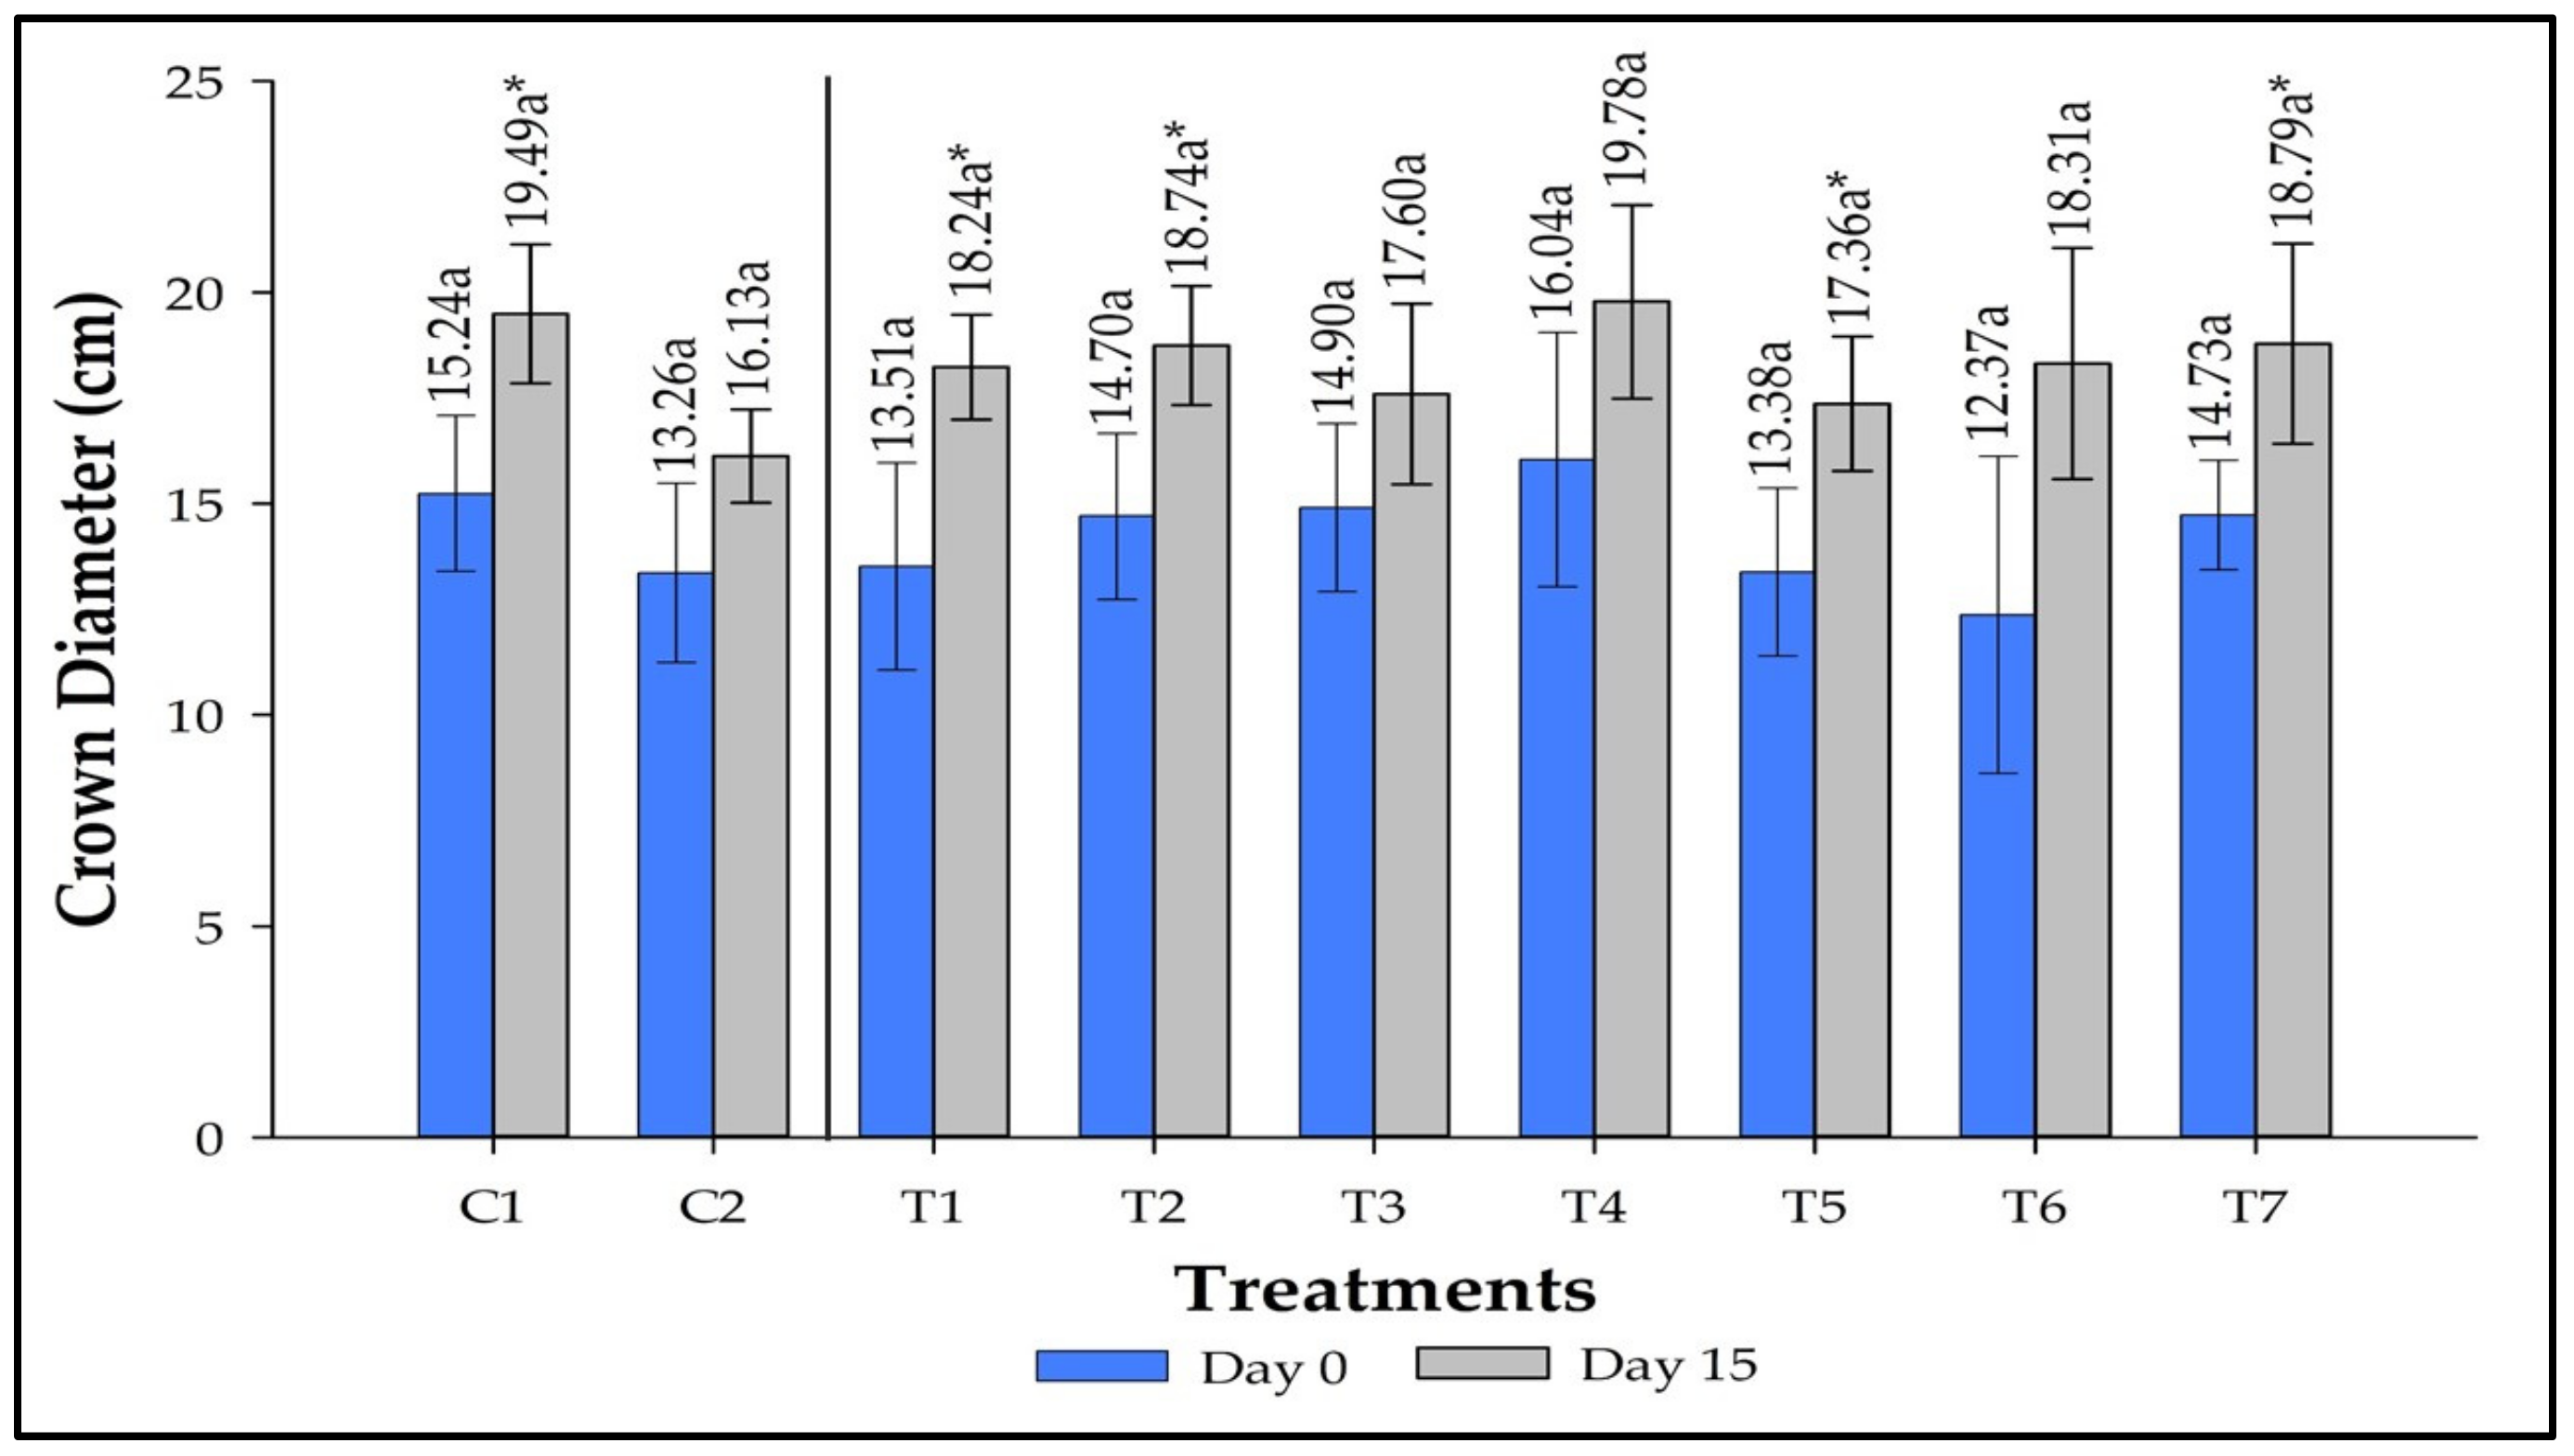
Figure 2 displays the effects of inoculation on crow diameter. No significant differences were observed in crown diameter among the treatments on the first and 15th days, allowing us to infer that the seedlings had similar leaf diameters at the beginning of the experiment and that this proportion remained the same until the 15th day. Plants responded individually to each treatment, and C1, T1, T2, T4, and T7 showed significantly higher averages on day 15. The inoculation treatments that most contributed to crown growth were T6, T1, and T7 with 5.94, 4.72, and 4.06 cm, respectively. C1 accounted for an increment of 4.25 cm. C2, on the other hand, accounted for an increase of 2.87 cm.
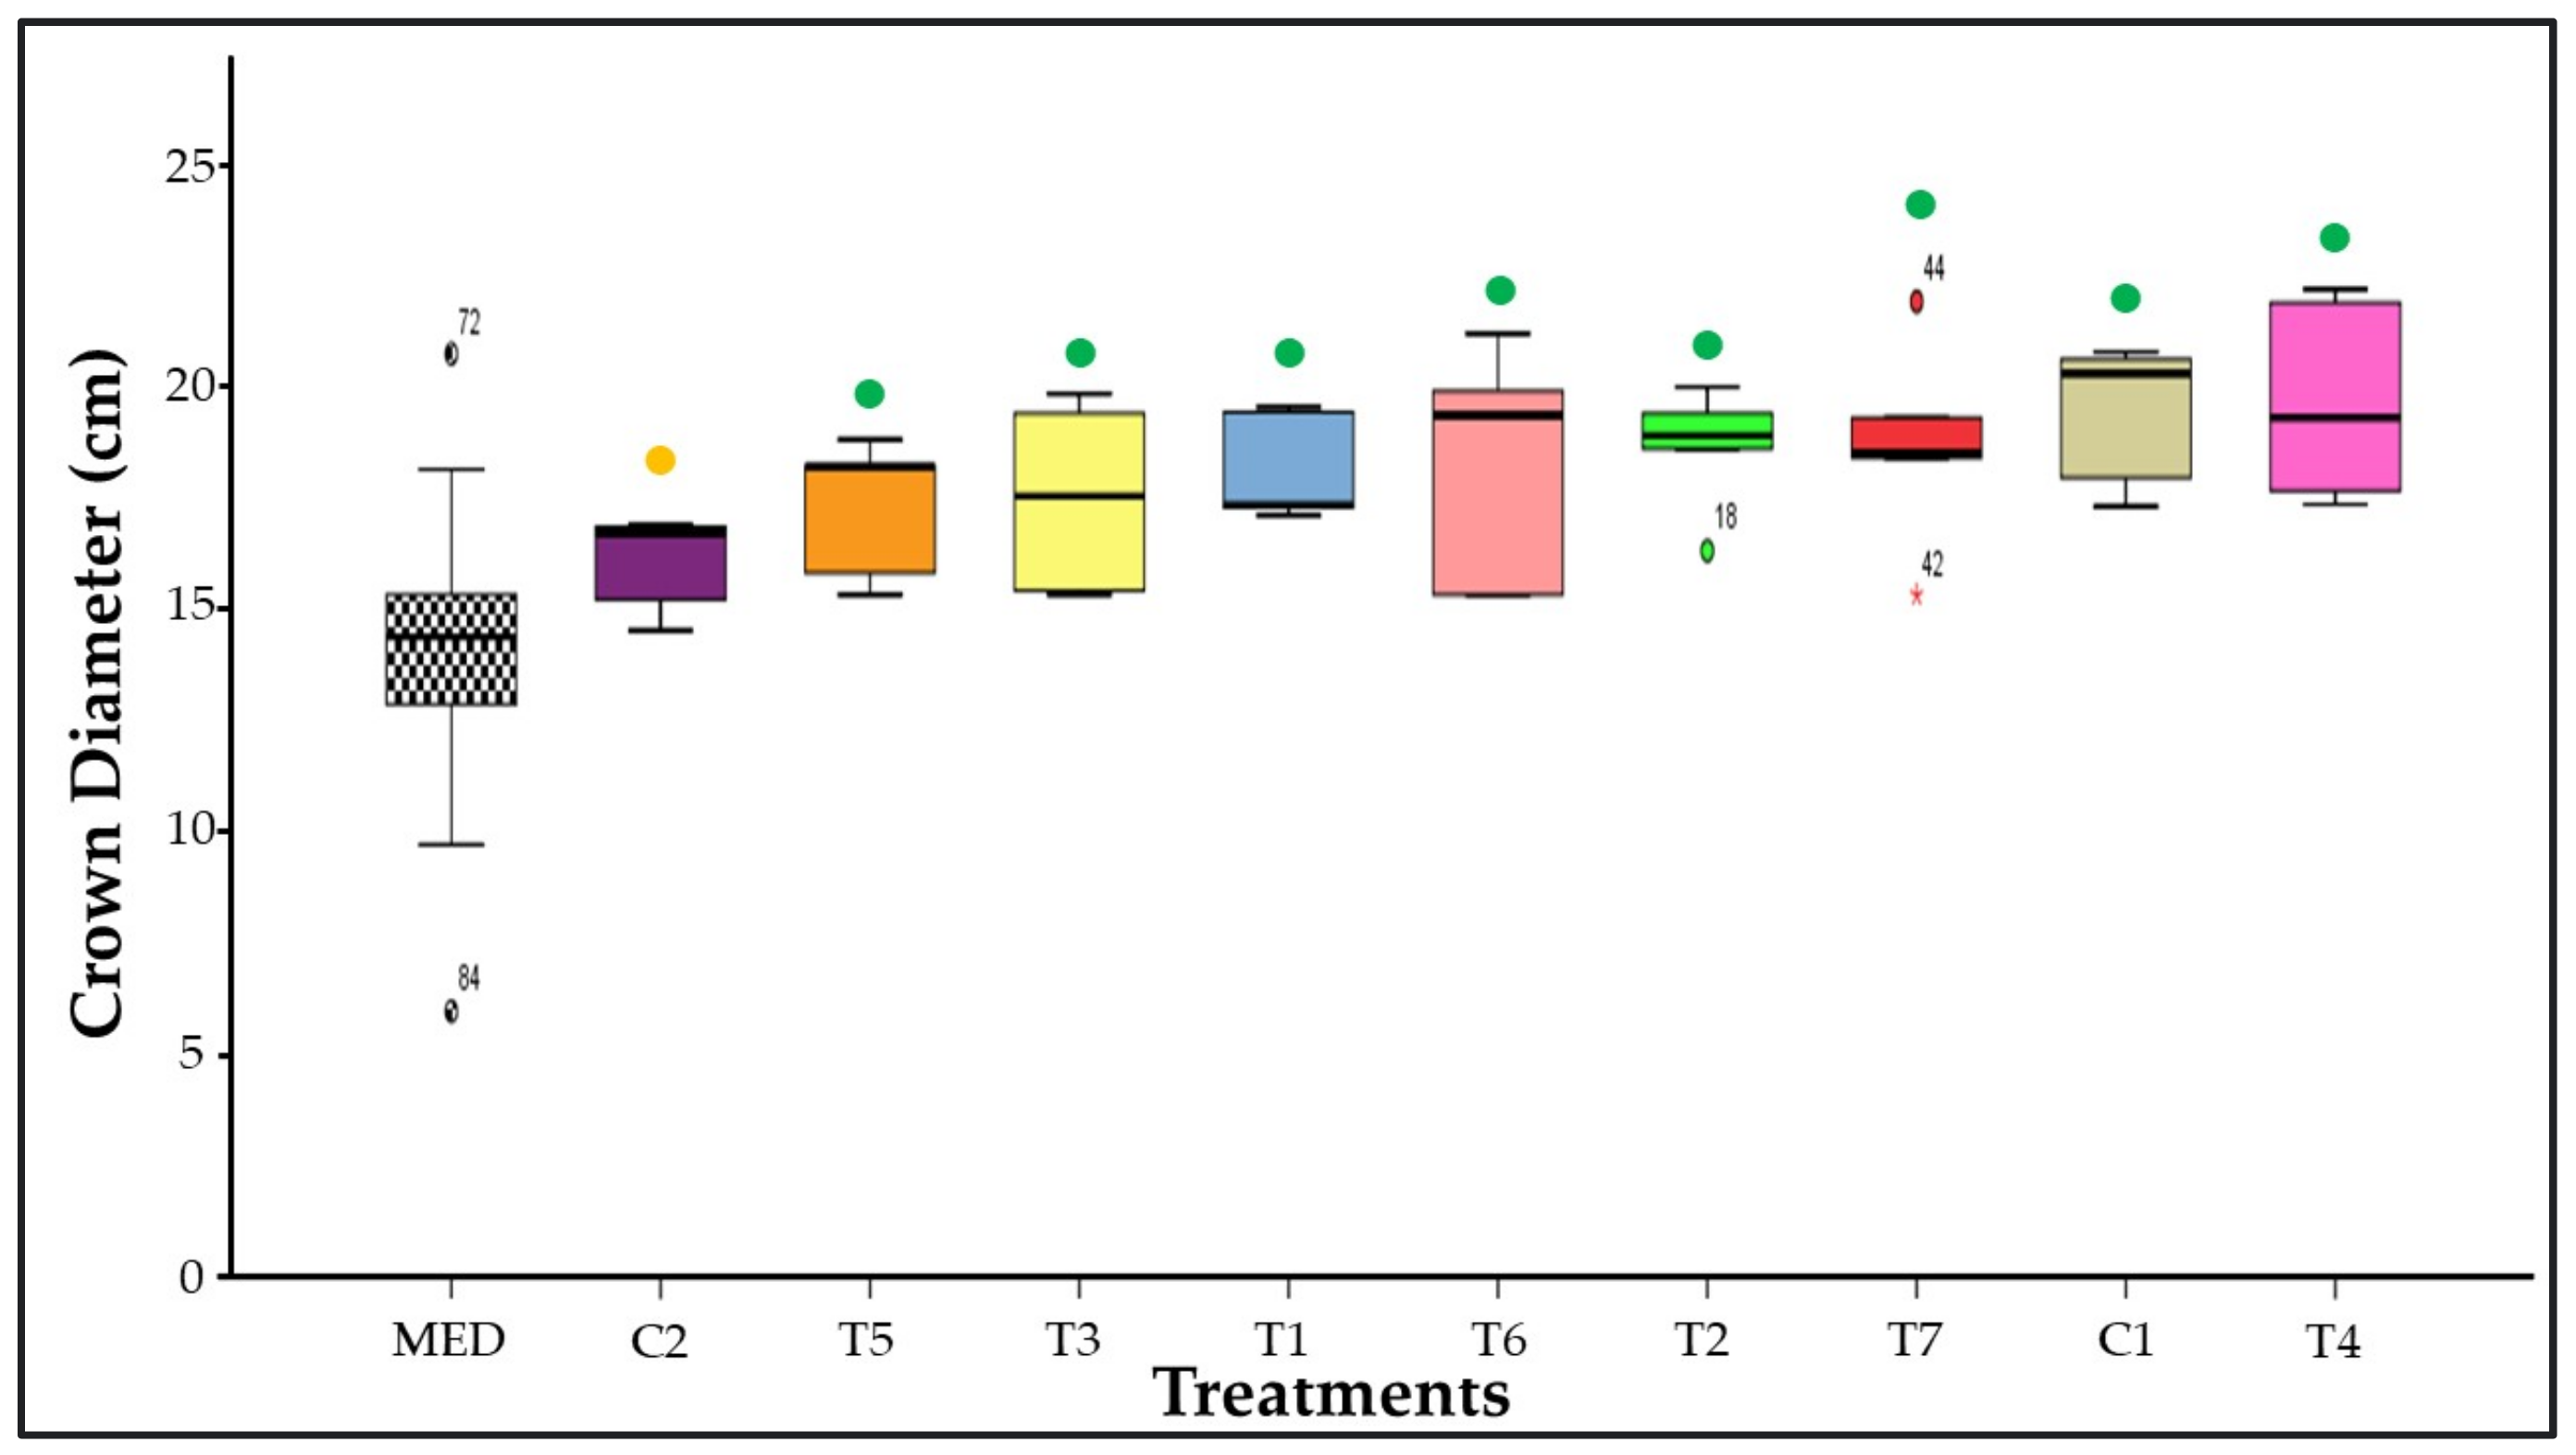
Figure 3 displays the variation in diameter between the first and 15th days. The overall mean crown diameter was 14.3 cm, as represented by MED. All treatments, except for C2, had a higher average variation in crown diameter if compared to the MED (p ≤ 0.05). Therefore, it is possible to infer that the 30% N and P fertilization negatively affected leaf growth in the first 15 days.

3.6. Number of Leaves and Leaf Area

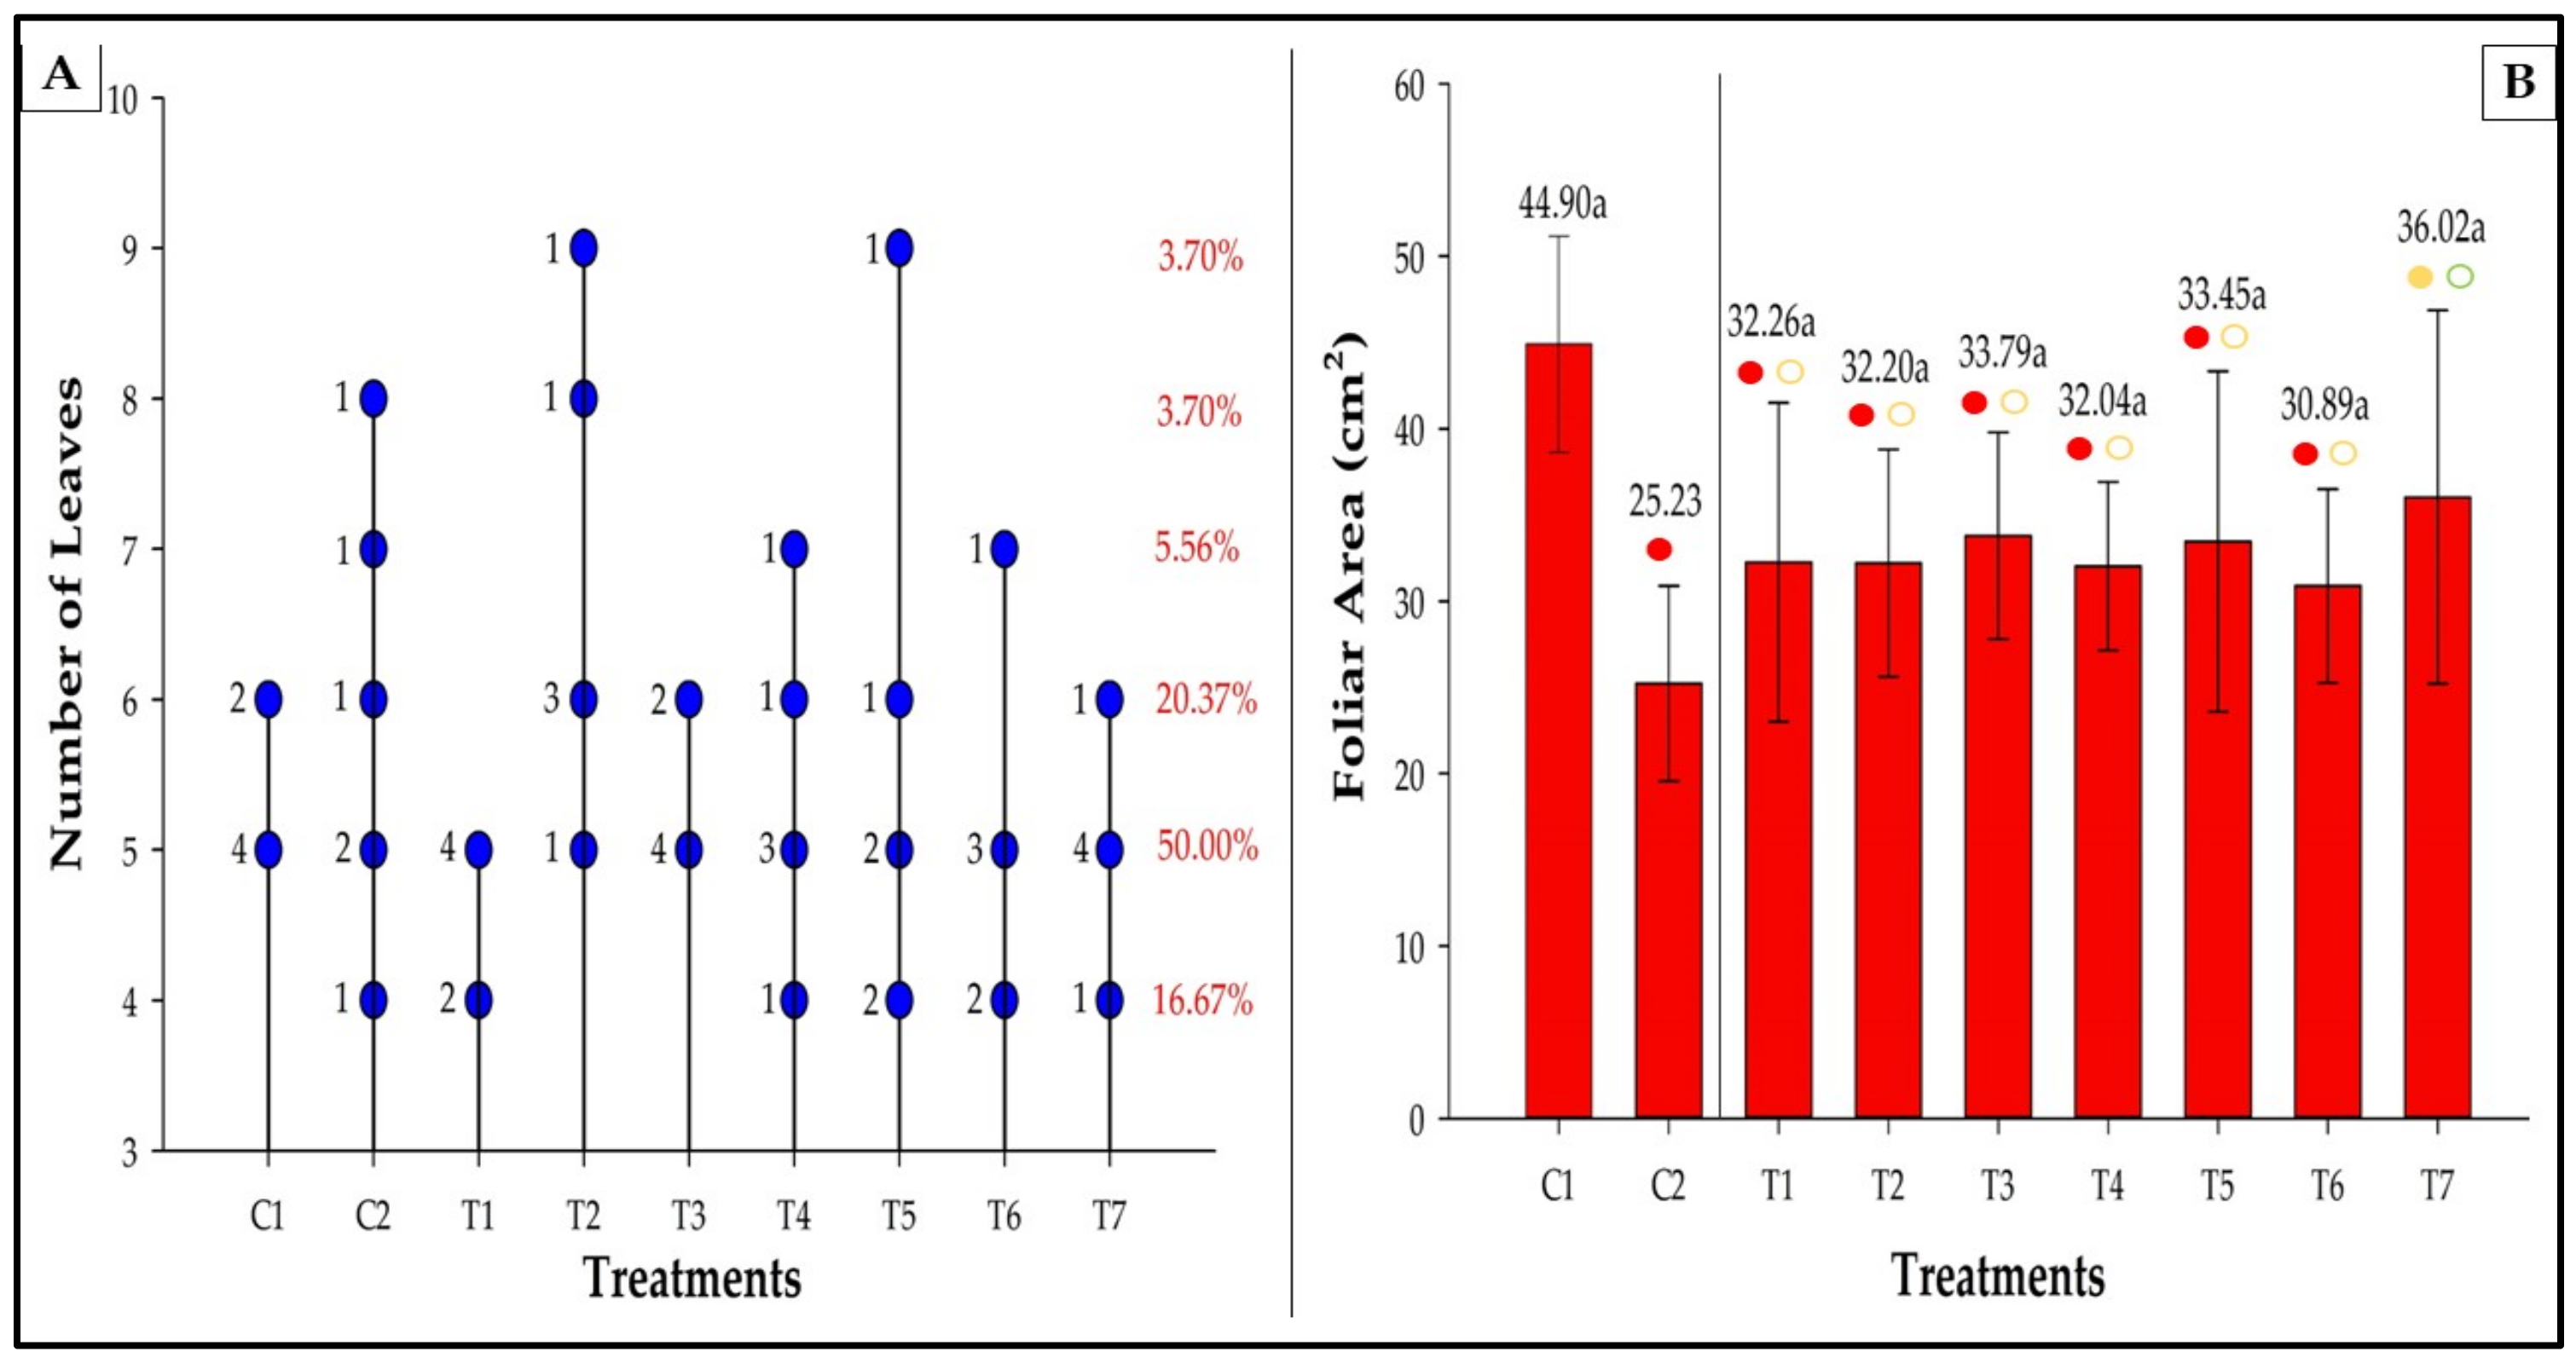
According to Figure 4A, there was high variability in the number of leaves within the treatments. For example, some treatments, such as T5, had plants with four and nine leaves. Consequently, the average number of leaves did not differ among the evaluated treatments (Figure 5, Table 5).
The leaf area also showed a high variability (Figure 4 and Figure 5). C1 showed the largest area, 77.23% greater than C2 (Figure 4B). Among the inoculated treatments, T7 was statistically equivalent to C1 and increased the leaf area by 42.77% compared to C2. Leaf area in other treatments was statistically equivalent to C2 and T7, although lower than C1.

3.7. Root Length

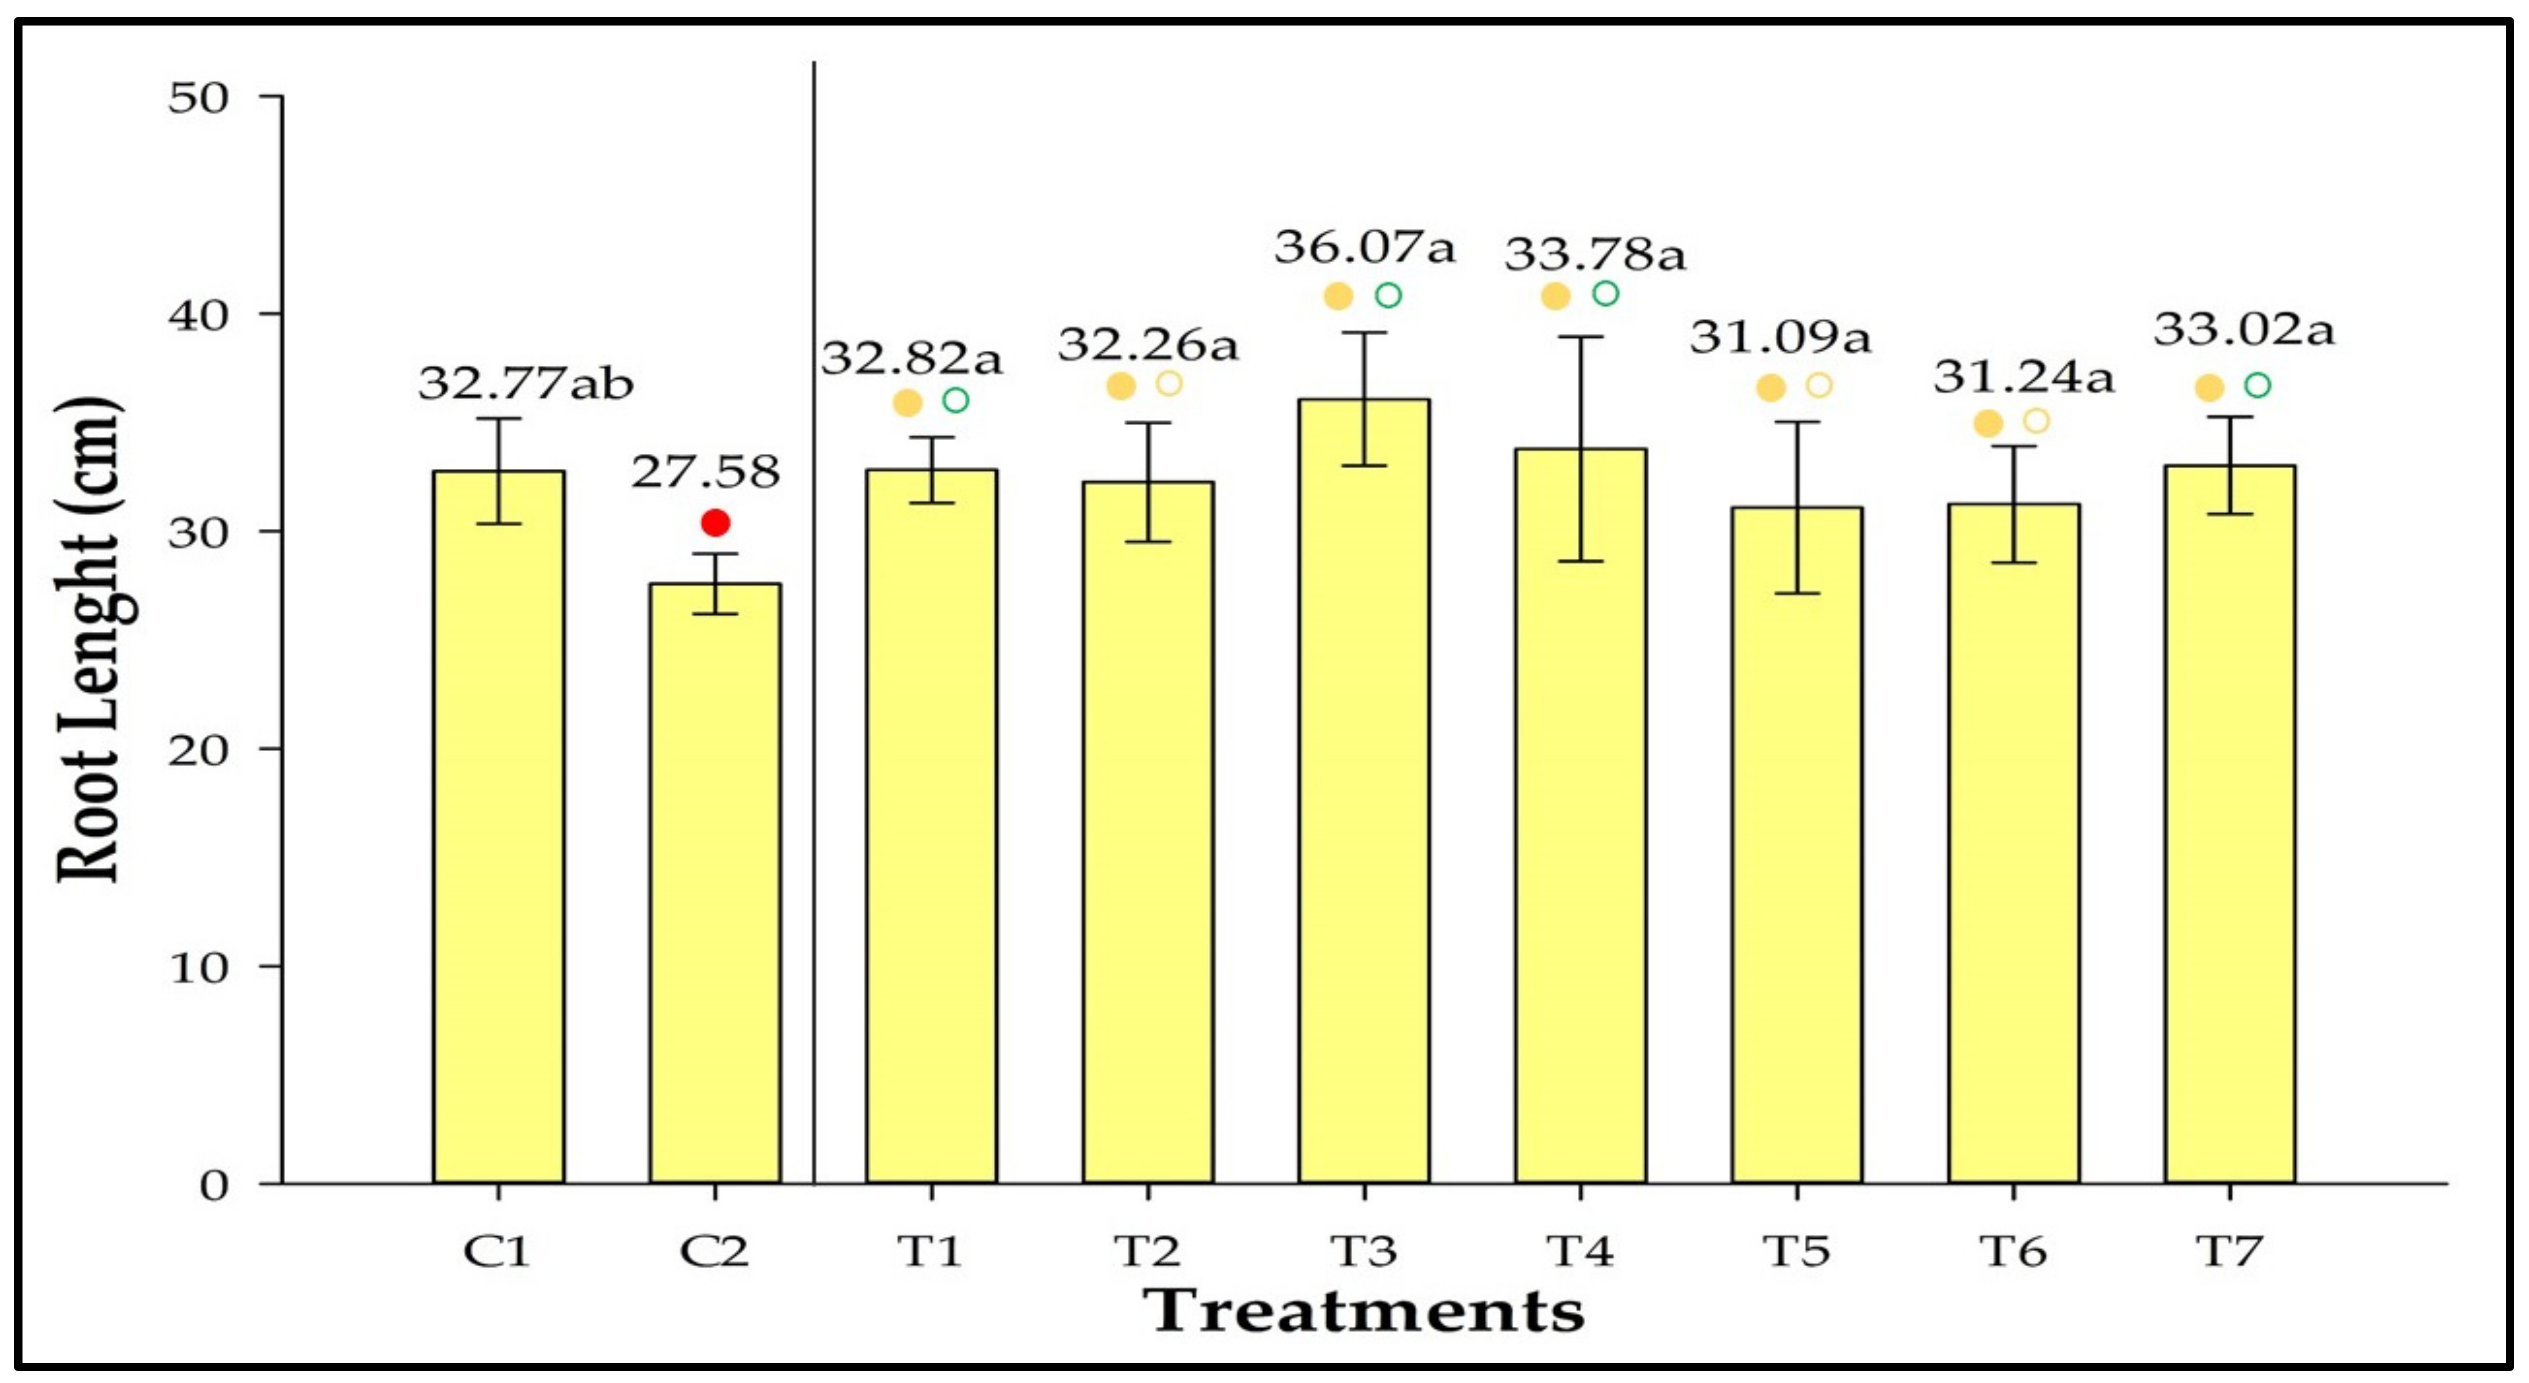
Root length did not differ significantly among the inoculated treatments and was similar to that observed in C1 (Figure 6). However, the roots in T1, T3, T4, and T7 were longer than in C2. Root length in T3 was 30.78% larger than in C2.

3.8. Fresh and Dry Weight

3.8.1. Shoot

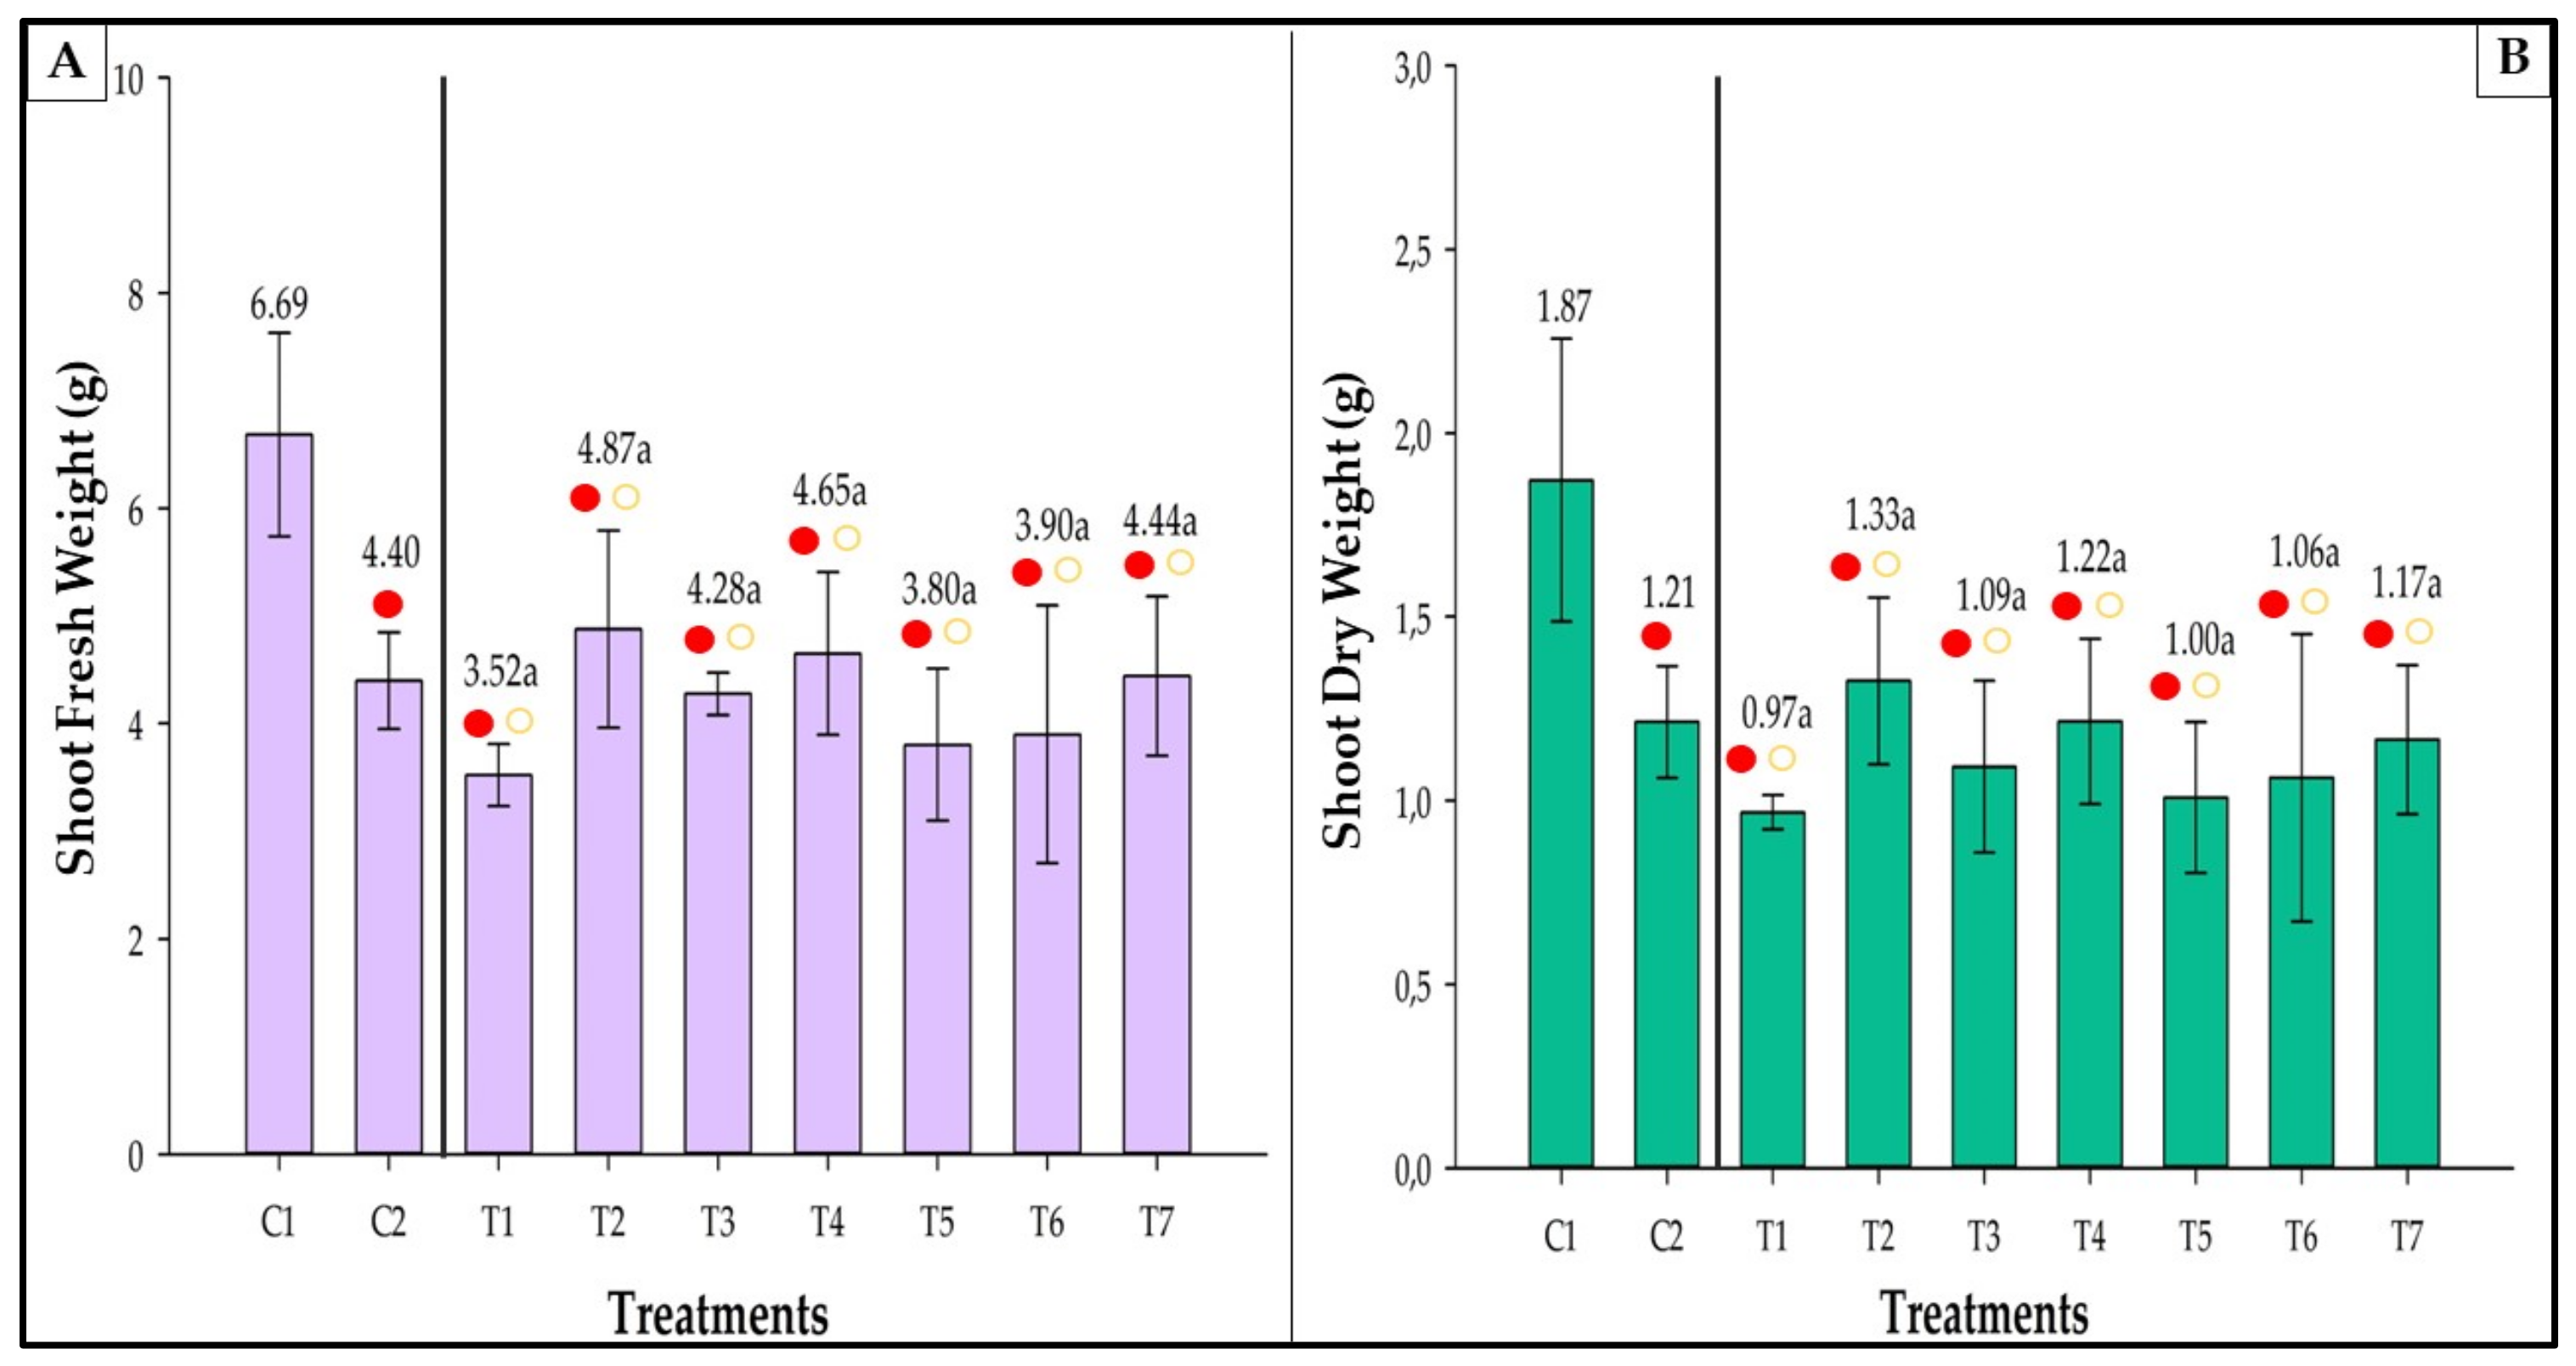
C1 accumulated the highest fresh and dry weights (Figure 7). Nevertheless, no significant differences were observed in the comparisons between treatments. Furthermore, all inoculated treatments showed fresh weight equivalent to C2 and lower than C1 (Figure 7A). C1 had a fresh weight of 52.05% and 90.06% higher than C2 and T1, respectively.
A similar trend was observed for the shoot dry weight (Figure 7B). In this case, C1 had a shoot dry weight of 54.54% and 92.78% higher than C2 and T1, respectively.

3.8.2. Root

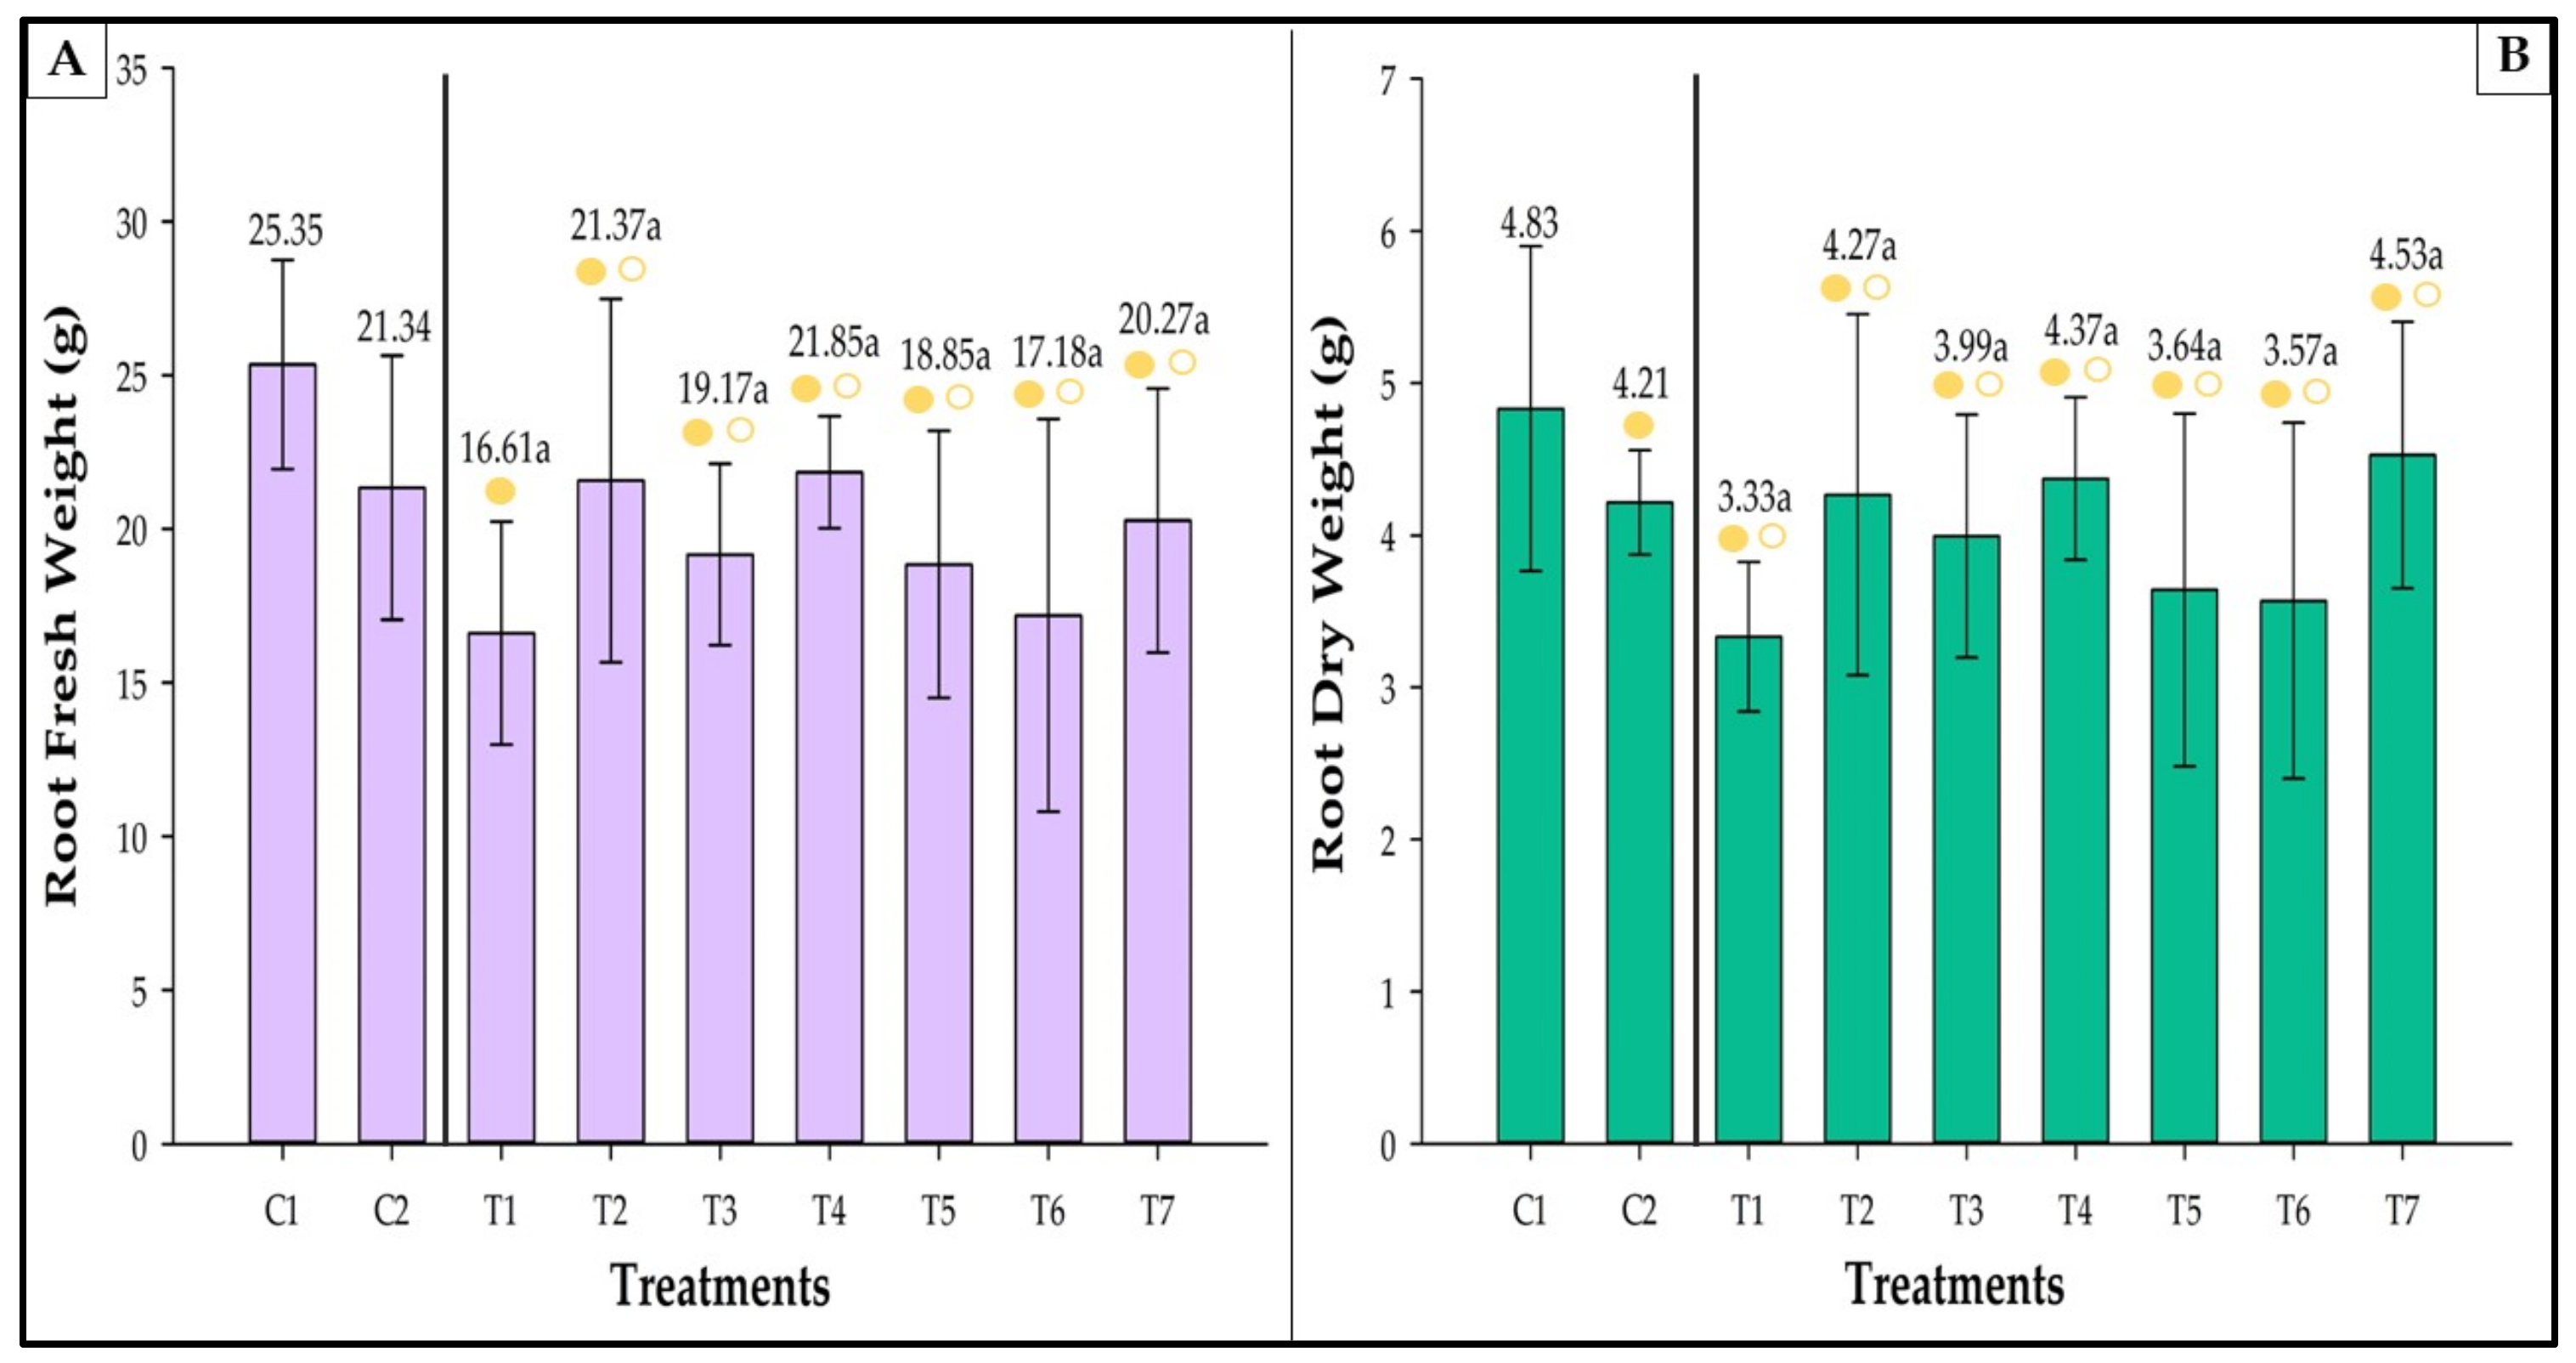
No statistically significant differences were observed for fresh (Figure 8A) and root dry matter (Figure 8).

3.8.3. Total Weight

C1 showed the highest fresh and dry weights (Figure 9). On the other hand, T1 showed the smallest total weight. Fresh weight in T1, T3, T5, and T6 was comparable to C2 and lower than C1 (Figure 9A), and T2, T4, and T7 did not differ from the two controls. T2, T3, T4, T7, and C2 had dry weights similar to C1 (Figure 9B). Nevertheless, treatments T1, T5, and T6 were statistically different from C1 and showed lower dry weights. There were no significant differences among the inoculated treatments, and no statistical differences were observed between the inoculated treatments and C2.

3.9. Morphology of Seedling Growth

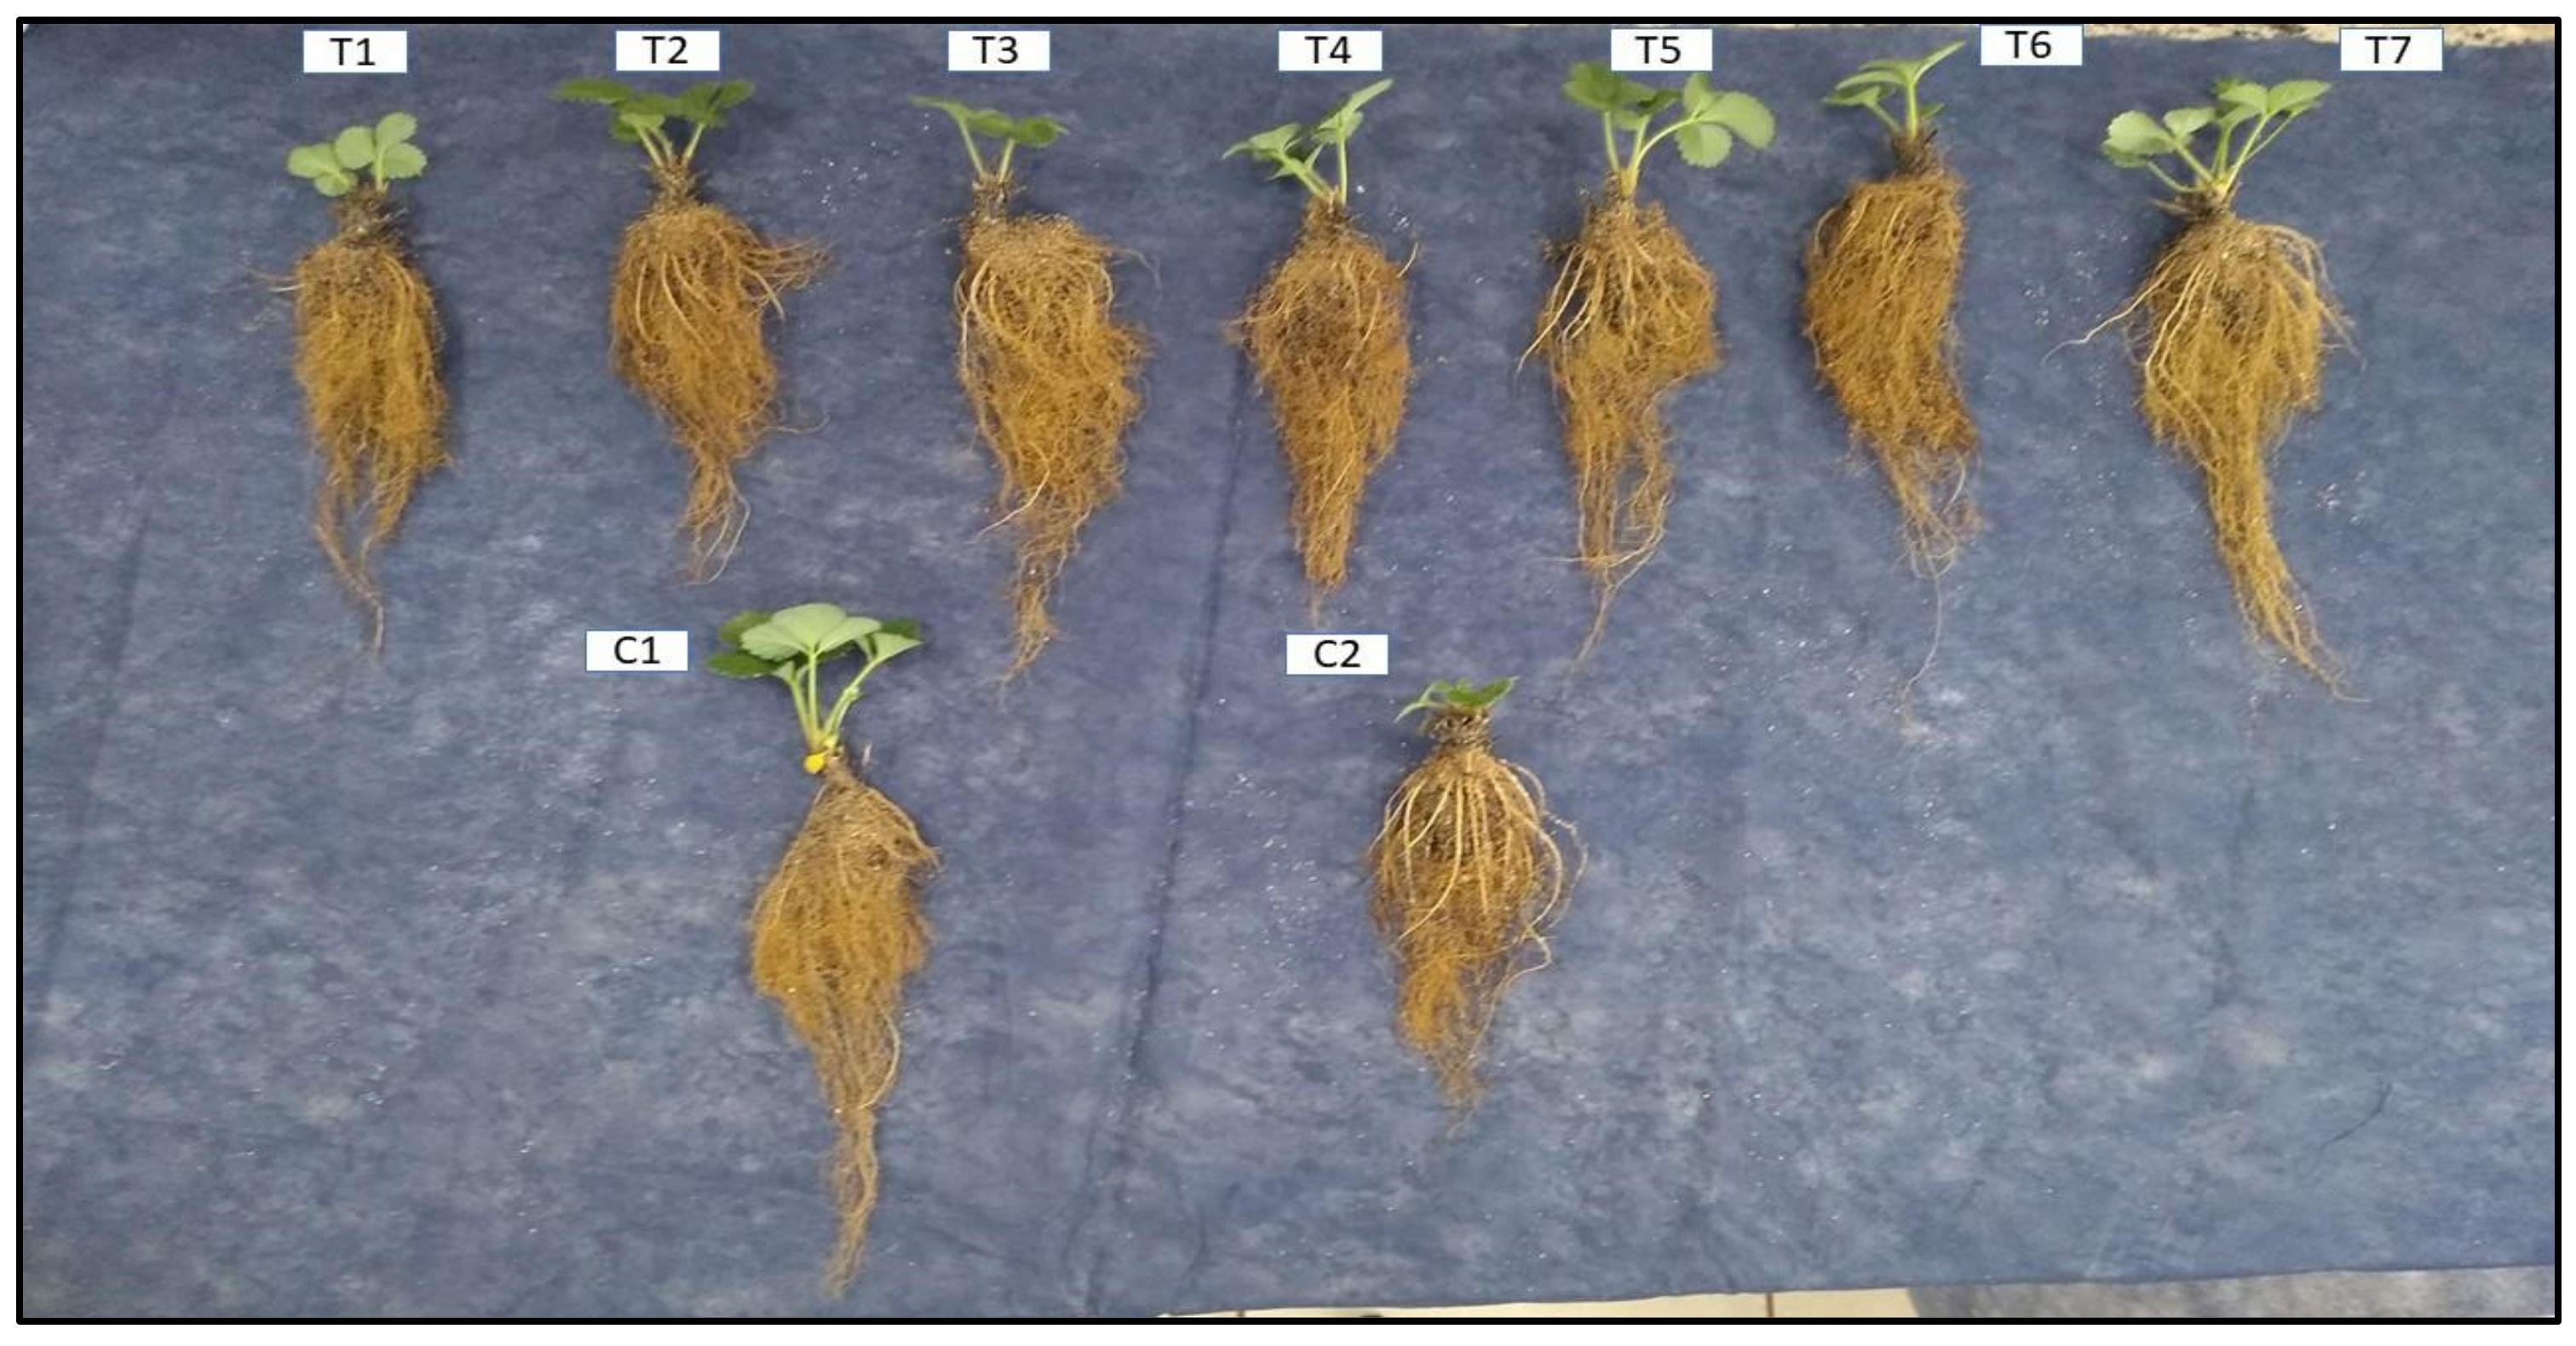
Seedling length and root development differed among the treatments (Figure 10). Some showed less shoot development, while others provided greater root development. For example, C2 plants had prominent primary roots.

3.10. Correlations between Vegetative Data

The principal component analysis (PCA) with vegetative data explained 84.7% of data variation (Figure 11). Three groups of variables can be observed: group 1, composed of root length, crown diameter after 15 days, and leaf area; group 2, composed of the number of leaves; group 3, referring to fresh and dry weights.
C1 had the highest biomass, root length, crown diameter, and leaf area, followed by T2, T3, T4, and T7. Meanwhile, T2 was associated with a larger number of leaves. T1, T6, and T5 had the lowest biomass accumulation. C2 had a drastically reduced biomass gain compared to C1.

3.11. Correlations among the Physiological Data

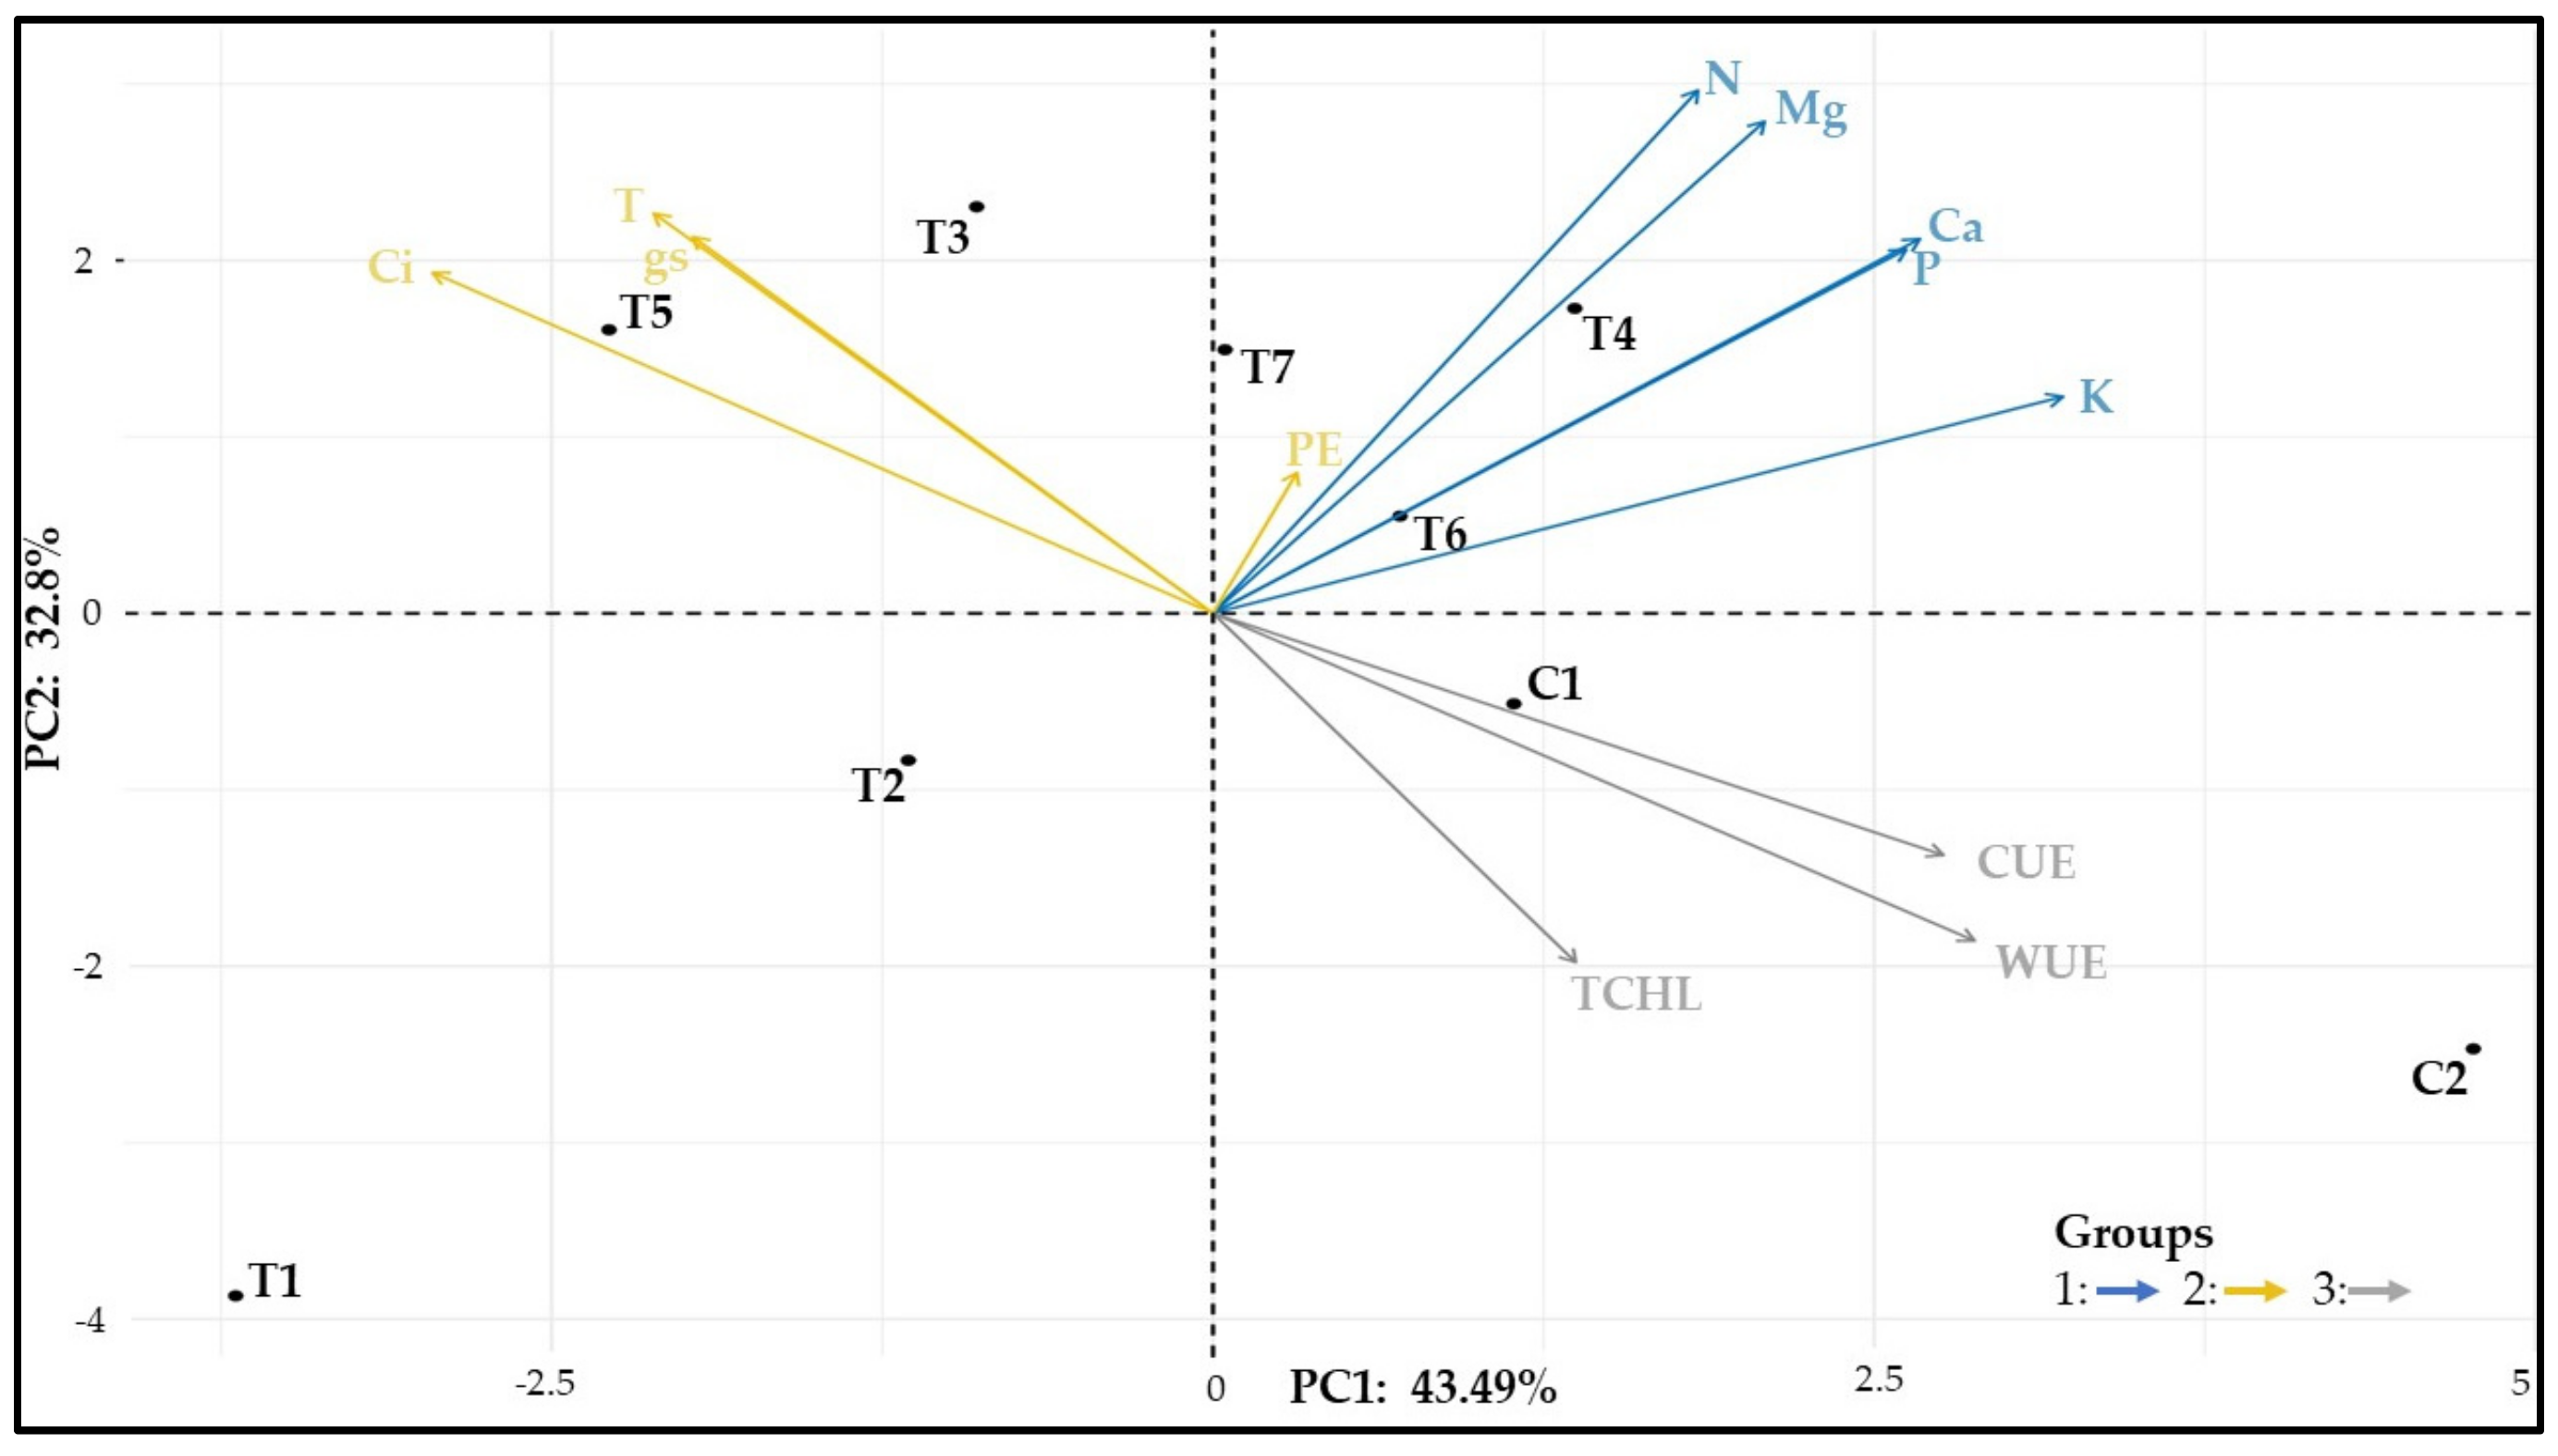
The PCA explained 76.7% of the data variation (Figure 12). Three groups of variables can be delimited: group 1, formed exclusively by nutrient contents; group 2, consisting of PE, Ci, T, and gs; group 3, related to total chlorophyll, WUE, and CUE. T1 differed from the others and had the lowest nutrient contents; T3, T4, T6, and T7 showed nitrogen contents similar to C1; T3 and T5 showed the highest Ci and T.

3.12. Similarity among Treatments

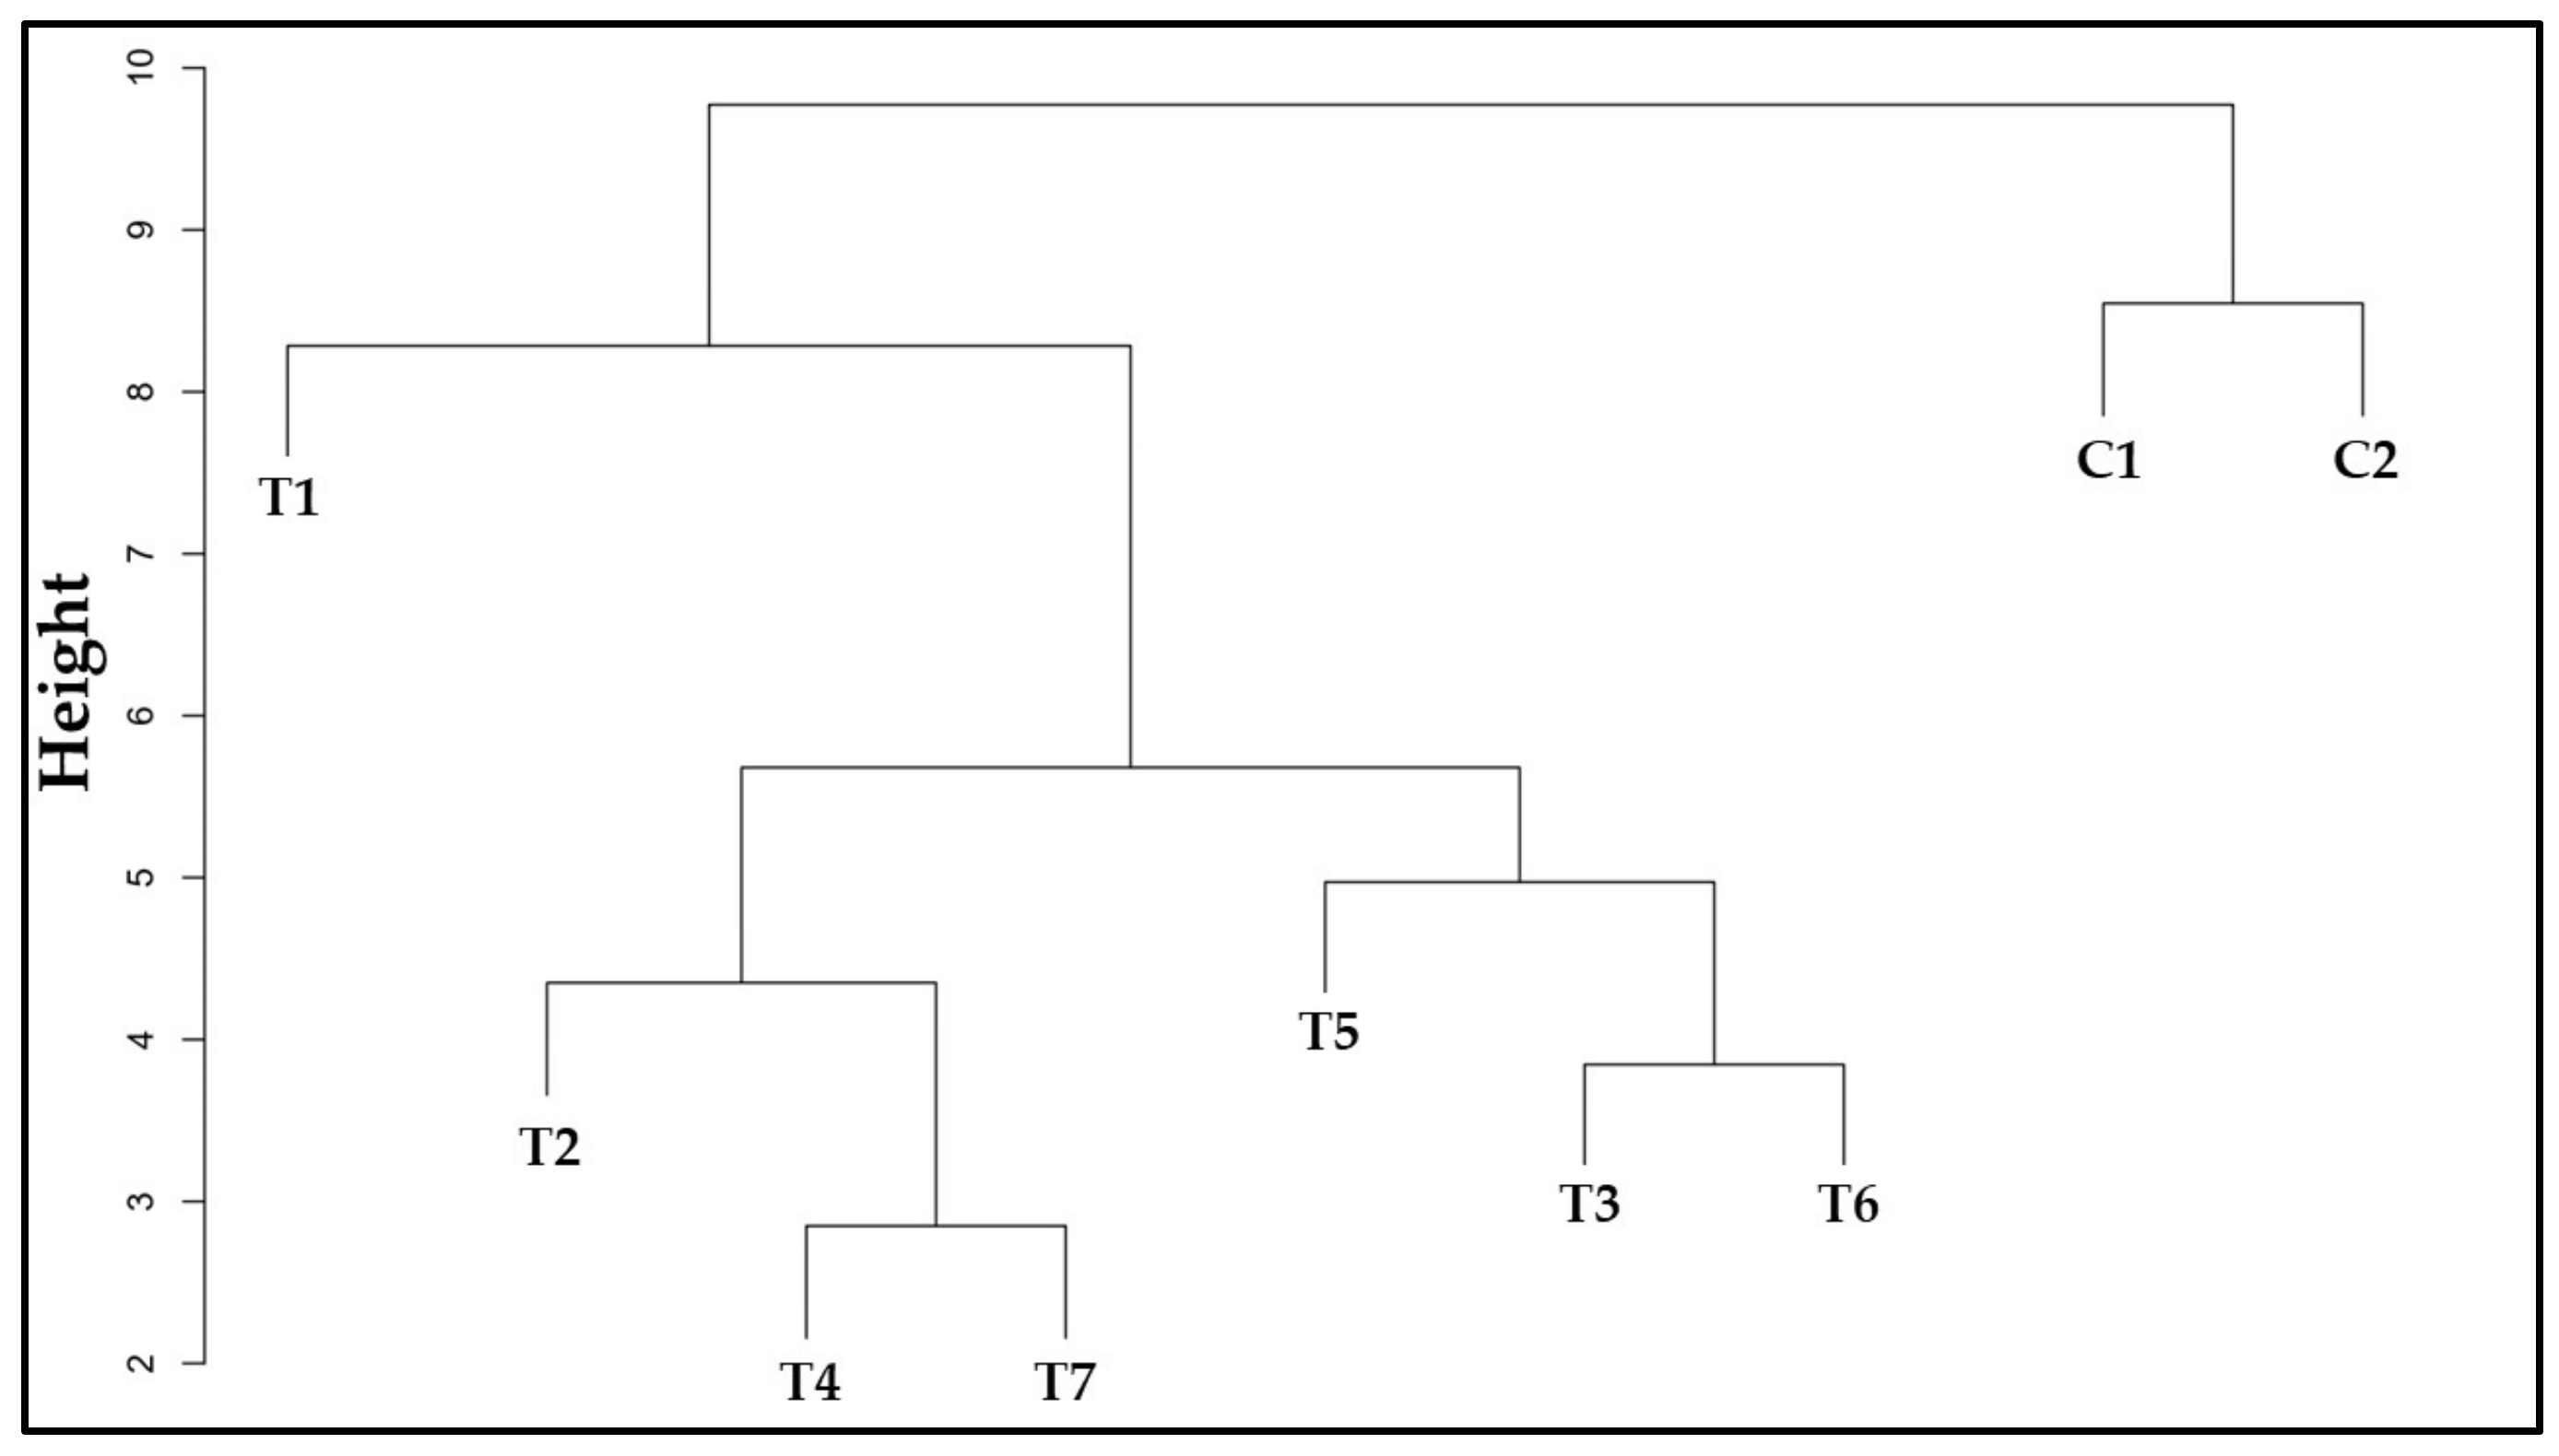
The similarity dendrogram shows two major treatment groups (Figure 13). One group was formed by the controls and the other by the inoculation treatments. By associating these results with the PCAs (Figure 11 and Figure 12), it could be inferred which factors were responsible for this grouping pattern. The formation of the groups was not delimited by the number of species and their combinations.
Control plants had higher WUE and CUE in common, with C1 seedlings showing greater biomass and C2 seedlings showing the highest amount of chlorophyll. Treatments T4 and T7 had plants with similar shoot development (CD15 and FA) and nutrient contents, which may be related to the inoculation of A. brasilense and B. megaterium, shared by both treatments. T2 was the closest treatment, differing in that it received B. megaterium only. This bacterium, under certain conditions, increased the number of leaves but not nutrient accumulation. T5 showed better gas exchange (T, gs, Ci), which indicates that the combination of A. brasilense and B. fluminis was responsible for this behavior. T3 and T6 were put in the same group but did not stand out significantly in the evaluated aspects. However, B. fluminis inoculation in T3 stimulated root elongation. Lastly, T1 indicates that the isolated inoculation of A. brasilense did not benefit most aspects evaluated. However, when applied in consortia, this species potentialized growth promotion as seen in treatments T4, T5, and T7.

4. Discussion

4.1. Growth-Promoting Aspects of the Bacteria

As observed in the results, the three bacterial strains used here provide essential nutrients for plant growth. Previous reports indicated that microbes from these species have several plant-growth mechanisms. For example, Toffoli et al. [45] evinced the ability of several Azospirillum strains to solubilize phosphate in NBRIP medium. B. megaterium is widely reported as a phosphate solubilizer, and Kang et al. [46] reported that its solubilization halo could be greater than 6 mm when cultured for 96 h. The study by Yadav et al. [47] demonstrated the ability of a Brevibacillus strain to solubilize 223.1 mg of tricalcium phosphate per liter.
Siderophores are low-molecular-weight molecules that chelate iron in soils [48]. Various bacteria, including the species studied here, produce these molecules [49,50,51], although not detected among our strains. In addition, Liu et al. [52] inoculated siderophore-producing Paenibacillus illinoisensis and Bacillus sp. in peanuts (Arachis hypogaea) cultivated in calcareous soils. The bacteria benefited the plant’s iron absorption from the soil, increasing its content in leaves and promoting the accumulation of other nutrients.
Additionally, we observed a relationship between growth characteristics in the culture media and nutrient solubilization ability. For example, all bacteria acidified the culture media, indicating organic acid production. These molecules assist in the release of phosphorus, calcium, and potassium from sources not available for plant assimilation [53].
The inoculated strains also produce IAA, a hormone responsible for cell division, elongation, and enlargement, affecting root development [54]. Its synthesis depends on the tryptophan amount in the environment, regulated by the plant that exudes this amino acid through the roots [55].
Furthermore, these mechanisms and the co-inoculations performed explain the growth behavior of the seedlings, e.g., the production of IAA. This plant hormone is responsible for cell division, elongation and enlargement, being extremely responsible for root development [54]. However, the synthesis of this auxin is dependent on the amount of tryptophan in the environment; thus, the plant itself is responsible for regulating the synthesis of this phytohormone by the bacteria since it manages to exude this amino acid through the roots [55]. Furthermore, the addition of tryptophan favors the plant–microbe interaction, influencing the modulation of the bacterial population in the soil. The study by Przemieniecki et al. [56] evinced this interaction, where soils fertilized with L-tryptophan benefited the proliferation of Bacillus spp., in addition to providing an improvement in the quality of nutrient assimilation of perennial ryegrass (Lolium perenne).
Coupling several plant-growth promoting mechanisms is strategic in the development of microbial inoculants, and several studies indicate that the inoculation of microorganisms in combinations promotes better benefits to the plant [15,57,58].

4.2. The Impacts of Microorganisms on Strawberry Physiology

Three factors must be considered to discuss the results of this study: (1) the bacterial inoculation effect, (2) the strawberry’s metabolism and physiology itself, and (3) the impact of fertilization. In general, the results indicate that the inoculation of microorganisms benefits the growth of the strawberry, but each combination of bacteria was responsible for favoring specific aspects, with no treatment that stood out in all parameters of the others.
First, the photosynthetic efficiency (PE) varied between 7.1 and 9.3 μmol CO2·m−2·s−1, with differences observed among the inoculated treatments, although these did not differ from the controls. Other studies indicated that microbial inoculation influenced PE, resulting in higher rates than uninoculated plants [59,60].
Among the combinations, the consortium between A. brasilense and B. megaterium (T4) improved PE if compared to the single inoculation of B. fluminis (T3). According to Samaniego-Gámez et al. [60], the CO2 produced by microbial respiration can benefit photosynthesis. Furthermore, Rozpadek et al. [61] stated that plants change their photosynthetic apparatus after endophytic colonization.
Considering that the PE was relatively equal among the controls, we can assume that the C2 strawberries compensated for the nutritional deficit by allocating their resources to produce chlorophylls. This may explain the higher concentration of total chlorophylls, which were even higher than the rates observed in C1, and the considerably high values of foliar N and Mg, i.e., structural components of chlorophyll. Agathokleous et al. [62] suggested that the concentration of chlorophylls increases under low stress and that this mechanism is adopted to minimize more severe stresses.
The stomatal conductance of T5 (A. brasilense + B. fluminis), with 0.117 mol CO2·m−2·s−1, was higher than in the controls and T3. As a result of the higher stomatal conductance, T5 had a higher internal concentration of CO2 and a higher transpiration rate, corroborating the results of Mikiciuk et al. [63]. Morais et al. [64] also found higher transpiration and stomatal conductance in plants inoculated with bacteria.
T3 also showed a higher internal concentration of CO2, although not superior for other photosynthetic variables. On the other hand, it had lower water use efficiency (WUE) and carboxylation efficiency (CUE), indicating a greater water loss for each absorbed CO2 molecule and lower affinity of RUBISCO with available CO2, respectively. Morais et al. [64] also observed lower water use efficiency in plants inoculated with Bacillus strains (B106 and B167A). In addition, the lower CUE in T3 can be attributed to a condition of CO2 excess, where its accumulation in the leaves can provide a decrease in the rate of ATP/ADP available in chloroplasts; consequently, the energy imbalance reduces the activation of RUBISCO activase and the catalytic performance of the enzyme [65,66].
Regarding the concentration of nutrients, T4 promoted the highest nutrient accumulation. This was possibly due to the consortium’s effectiveness in promoting the solubilization of nutrients. Similar results were obtained in the study by Ribeiro et al. [67], where the co-inoculation of A. brasilense and Bacillus provided better assimilation of nutrients in corn compared to single inoculations.

4.3. Strawberry Growth Promotion

As observed, the microorganisms provided differentiation in shoot growth, benefiting the initial growth of the crown diameter in the first 15 days of evaluation. Similar results were observed by Andrade et al. [19], who described a positive inoculation effect on strawberry’s development, where their inoculation contributed to increasing the plant’s crown diameter. For example, A. brasilense increased this extension by approximately 30 cm in 80 days.
Regarding the number of leaves, all treatments had similar averages, with 70.37% of the seedlings having a total of five or six leaves. Furthermore, the leaf area of T7 was the only one that differed from C2, indicating a positive effect of the triple microbial consortium. The effects of this treatment were equivalent to the uninoculated control with complete fertilization (C1). Other studies highlighted the benefits of using microorganisms to increase leaf area [68,69].
The inoculations, especially with B. fluminis (T3), increased root length significantly. Above all, auxins are responsible for root elongation. Consequently, the more extensive root surface enables the plant to better exploit the soil for nutrients [70]. Nevertheless, the length of the roots did not necessarily represent roots with a greater weight. This may be related to the plant’s strategy to explore the environment, especially when comparing treatments T3 and C2. In a way, the plants with better resource access grew more vertically and gained root length; these resources may be the hormones released by bacteria [71]. Conversely, when these resources are scarce, plants may prioritize horizontal growth, with greater prominence of primary and voluminous roots [72].
Seedlings in C1 had a considerably higher shoot and total weight, showing that the inoculation associated with the fertilization of 30% N and P could not provide a biomass accumulation that surpassed the fertilization with 100% of these nutrients. On the other hand, C2, which was not inoculated, was sometimes equivalent to inoculated treatments or C1. This indicates that the strawberry does not depend exclusively on the applied inoculum under our experimental conditions. Therefore, some factors can be suggested to explain this result. Firstly, a more extended evaluation time would possibly result in a more significant biomass accumulation by the inoculated treatments. Secondly, higher N and P fertilizations associated with inoculations would also allow greater biomass assimilation.
Other studies indicated that microbial inoculation benefits plant biomass accumulation [64,73]. Additionally, microbial inoculants may confer a more significant biomass gain under higher fertilization. For example, Andrade et al. [19] showed that the inoculation of A. brasilense + Burkholderia cepacia + Enterobacter cloacae supplemented with 50% N fertilization increased strawberry’s biomass by 160.13% (12.54–32.62 g).
We highlight the relevance that the use of microorganisms played in stimulating strawberry’s development. The inoculations improved most of the variables analyzed; the inoculated treatments with reduced fertilization showed higher yields than C2 and were even equivalent to C1. Therefore, microbial inoculation compensates for the lower fertilization, allowing its reduction by 70%. Similar results were achieved in other studies. For example, Rosa et al. [74] showed that using A. brasilense and Bacillus subtilis reduced sugarcane’s demand for phosphate fertilization by 75%. Likewise, Bona et al. [75] concluded that the consortium application, composed of an arbuscular mycorrhizal fungus + Pseudomonas sp. + Pseudomonas fluorescens, helped to reduce tomato fertilization in the field by 30%.

5. Conclusions

The bacteria used in this study could solubilize phosphate and potassium, acidify the culture medium, and synthesize indole-acetic acid. Compared to the uninoculated controls, microbial inoculation increased gas exchange, especially the combination of A. brasilense and B. fluminis. (T5), as expressed by the higher stomatal conductance, leaf transpiration, and internal CO2 concentration. Regarding the concentration of leaf nutrients, inoculating A. brasilense and B. megaterium (T4) increased N and Mg contents. Lastly, inoculation stimulated crown growth, root elongation, and leaf area.
Bacterial inoculation could reduce fertilizer demand by up to 70% since most treatments were statistically equivalent to 100% N and P application. Consequently, the use of growth-promoting bacteria is increasingly necessary and viable for the development of sustainable agriculture.
The selected microorganisms showed remarkable plant growth-promoting characteristics, whereby either single or combined inoculations could lead to similar results depending on the bacteria used and their interaction with the strawberry. In this way, new studies should be carried out to better understand the interaction between the strawberry and plant growth-promoting bacteria and even formulate bioinoculants based on these microorganisms.

Author Contributions

Conceptualized, designed, and performed experiments, analyzed data, and wrote the article, L.I.d.S.; conducted the gas exchange analysis, I.P.d.O. and L.I.d.S.; assisted in statistical analysis, review, and editing, M.C.P.; review and editing, E.d.C.J.; availability of the laboratory, greenhouse, and other resources, M.P.; review and editing, R.C.d.A.; supervision, J.D. All authors have read and agreed to the published version of the manuscript.

Funding

This study was financed in part by the Coordenação de Aperfeiçoamento de Pessoal de Nível Superior, Brasil (CAPES)—Finance Code 001.

Data Availability Statement

Not applicable.

Acknowledgments

The authors would like to thank CAPES, CNPq, and FAPEMIG for the financial resources and scholarship payments to the team members. The authors are grateful for the support offered by the Federal University of Lavras, the Graduate Program in Agricultural Microbiology and all the assistance provided by laboratory technicians. The authors are also grateful to the anonymous reviewers for their proposed contributions.

Conflicts of Interest

The authors declare no conflict of interest.

References

  1. Ramankutty, N.; Mehrabi, Z.; Waha, K.; Jarvis, L.; Kremen, C.; Herrero, M.; Rieseberg, L.H. Trends in Global Agricultural Land Use: Implications for Environmental Health and Food Security. Annu. Rev. Plant Biol. 2018, 69, 789–815. [Google Scholar] [CrossRef] [PubMed] [Green Version]
  2. Alexandratos, N.; Bruinsma, J. World Agriculture towards 2030/2050: The 2012 Revision; ESA Working Papers 12-03; Food and Agriculture Organization of the United Nations (FAO): Rome, Italy, 2012. [Google Scholar]
  3. Fernández-Lara, R.; Gordillo, B.; Rodríguez-Pulido, F.J.; Lourdes González-Miret, M.; Del Villar-Martínez, A.A.; Dávila-Ortiz, G.; Heredia, F.J. Assessment of the differences in the phenolic composition and color characteristics of new strawberry (Fragaria x ananassa Duch.) cultivars by HPLC-MS and Imaging Tristimulus Colorimetry. Food Res. Int. 2015, 76, 645–653. [Google Scholar] [CrossRef] [PubMed] [Green Version]
  4. Pinheiro, D.F.; Resende, J.T.V.; Constantino, L.V.; Hata, F.T.; Hata, N.N.Y.; Lustosa, S.B.C. Physical, biochemical, and sensory properties of strawberries grown in high-altitude tropical climate. Ciênc. Agrotec. 2021, 45, e008221. [Google Scholar] [CrossRef]
  5. Food and Agriculture Organization of the United Nations—FAOSTAT. Production Quantities of Strawberries by Country 2020. Available online: https://www.fao.org/faostat/en/#data/QCL/visualize (accessed on 22 August 2022).
  6. Pahalvi, H.N.; Rafiya, L.; Rashid, S.; Nisar, B.; Kamili, A.N. Chemical Fertilizers and Their Impact on Soil Health. In Microbiota and Biofertilizers; Dar, G.H., Bhat, R.A., Mehmood, M.A., Hakeem, K.R., Eds.; Springer: New York, NY, USA, 2021; Volume 2, pp. 1–20. [Google Scholar] [CrossRef]
  7. Pignati, W. Uso de agrotóxicos no brasil: Perspectiva da saúde do trabalhador e ambiental. Rev. Bras. Med. Trab. 2018, 16, 37. [Google Scholar] [CrossRef]
  8. Srivastava, P.K.; Singh, V.P.; Singh, A.; Singh, S.; Prasad, S.M. Pesticides in Crop Production, 1st ed.; John Wiley & Sons Inc.: Hoboken, NJ, USA, 2020; pp. 55–63. [Google Scholar]
  9. Lin, W.; Lin, M.; Zhou, H.; Wu, H.; Li, Z.; Lin, W. The effects of chemical and organic fertilizer usage on rhizosphere soil in tea orchards. PLoS ONE 2019, 14, e0217018. [Google Scholar] [CrossRef] [PubMed]
  10. Walan, P.; Davidsson, S.; Johansson, S.; Höök, M. Phosphate rock production and depletion: Regional disaggregated modeling and global implications. Resour. Conserv. Recycl. 2014, 93, 178–187. [Google Scholar] [CrossRef] [Green Version]
  11. Vaccari, D.A.; Powers, S.M.; Liu, X. A demand-driven model for global phosphate rock suggests paths for phosphorus sustainability. Environ. Sci. Technol. 2019, 53, 10417–10425. [Google Scholar] [CrossRef] [PubMed]
  12. Franche, C.; Lindström, K.; Elmerich, C. Nitrogen-fixing bacteria associated with leguminous and non-leguminous plants. Plant Soil 2009, 321, 35–59. [Google Scholar] [CrossRef]
  13. Billah, M.; Khan, M.; Bano, A.; Hassan, T.U.; Munir, A.; Gurmani, A.R. Phosphorus and phosphate solubilizing bacteria: Keys for sustainable agriculture. Geomicrobiol. J. 2019, 36, 904–916. [Google Scholar] [CrossRef]
  14. Asghar, H.; Zahir, Z.A.; Arshad, M.; Khaliq, A. Relationship between in vitro production of auxins by rhizobacteria and their growth-promoting activities in Brassica juncea L. Biol. Fert. Soils 2002, 35, 231–237. [Google Scholar] [CrossRef]
  15. Bradáčová, K.; Florea, A.; Bar-Tal, A.; Minz, D.; Yermiyahu, U.; Shawahna, R.; Poşta, G. Microbial Consortia versus Single-Strain Inoculants: An Advantage in PGPM-Assisted Tomato Production? Agronomy 2019, 9, 105. [Google Scholar] [CrossRef] [Green Version]
  16. Ríos-Ruiz, W.F.; Torres-Chávez, E.E.; Torres-Delgado, J.; Rojas-García, J.C.; Bedmar, E.J.; Valdez-Nuñez, R.A. Inoculation of bacterial consortium increases rice yield (Oryza sativa L.) reducing applications of nitrogen fertilizer in San Martin region, Peru. Rhizosphere 2020, 14, 100200. [Google Scholar] [CrossRef]
  17. Wang, J.; Li, R.; Zhang, H.; Wei, G.; Li, Z. Beneficial bacteria activate nutrients and promote wheat growth under conditions of reduced fertilizer application. BMC Microbiol. 2020, 20, 38. [Google Scholar] [CrossRef] [PubMed] [Green Version]
  18. Lovaisa, N.C.; Guerrero-Molin, M.F.; Quintana, D.P.G.A.; Salazar, S.M. Total and marketable fruit yield of strawberry plants grown under different levels of nitrogen fertility and inoculated with Azospirillum brasilense REC3. Rev. Agron. Noroeste Argent. 2016, 36, 43–46. [Google Scholar]
  19. Andrade, F.M.; Assis Pereira, T.; Souza, T.P.; Sales Guimarães, P.H.; Martins, A.D.; Schwan, R.F.; Dória, J. Beneficial effects of inoculation of growth-promoting bacteria in strawberry. Microbiol. Res. 2019, 223–225, 120–128. [Google Scholar] [CrossRef]
  20. Moura, G.G.D.; Barros, A.V.; Machado, F.; Martins, A.D.; Silva, C.M.; Durango, L.G.C.; Doria, J. Endophytic bacteria from strawberry plants control gray mold in fruits via production of antifungal compounds against Botrytis cinerea L. Microbiol. Res. 2021, 251, 126793. [Google Scholar] [CrossRef]
  21. Olanrewaju, O.S.; Babalola, O.O. Bacterial Consortium for Improved Maize (Zea mays L.) Production. Microorganisms 2019, 7, 519. [Google Scholar] [CrossRef] [Green Version]
  22. Nascente, A.S.; de Filippi, M.C.C.; Lanna, A.C. Biomass, gas exchange, and nutrient contents in upland rice plants affected by application forms of microorganism growth promoters. Environ. Sci. Pollut. Res. 2017, 24, 2956–2965. [Google Scholar] [CrossRef]
  23. Haider, F.U.; Coulter, J.A.; Cheema, S.A.; Farooq, M.; Wu, J.; Zhang, R.; Liqun, C. Co-application of biochar and microorganisms improves soybean performance and remediate cadmium-contaminated soil. Ecotoxicol. Environ. Saf. 2021, 214, 112112. [Google Scholar] [CrossRef]
  24. Santana, S.R.A.; Voltolini, T.V.; Antunes, G.R. Inoculation of plant growth-promoting bacteria attenuates the negative effects of drought on sorghum. Arch. Microbiol. 2020, 202, 1015–1024. [Google Scholar] [CrossRef]
  25. Alori, E.T.; Babalola, O.O. Microbial Inoculants for Improving Crop Quality and Human Health in Africa. Front. Microbiol. 2018, 9, 2213. [Google Scholar] [CrossRef] [Green Version]
  26. Sandini, I.E.F.; Pacentchuk, M.; Hungria, M.A.; Nogueira, S.P.D.; Cruz, A.S.; Nakatani, A.S.; Araujo, R.S. Seed inoculation with Pseudomonas fluorescens promotes growth, yield and reduces nitrogen application in maize. Int. J. Agric. Biol. 2019, 22, 1369–1375. [Google Scholar] [CrossRef]
  27. Romero-Perdomo, F.; Abril, J.; Camelo, M.; Moreno-Galván, A.; Pastrana, I.; Rojas-Tapias, D.; Bonilla, R. Azotobacter chroococcum as a potentially useful bacterial biofertilizer for cotton (Gossypium hirsutum): Effect in reducing N fertilization. Rev. Argent. Microbiol. 2017, 49, 377–383. [Google Scholar] [CrossRef] [PubMed]
  28. Nosheen, A.; Naz, R.; Tahir, A.T.; Yasmin, H.; Keyani, R.; Mitrevski, B. Improvement of safflower oil quality for biodiesel production by integrated application of PGPR under reduced amount of NP fertilizers. PLoS ONE 2018, 13, e0201738. [Google Scholar] [CrossRef]
  29. Mendes, R.; Garbeva, P.; Raaijmakers, J.M. The rhizosphere microbiome: Significance of plant beneficial, plant pathogenic, and human pathogenic microorganisms. FEMS Microbiol. Rev. 2013, 37, 634–663. [Google Scholar] [CrossRef] [Green Version]
  30. Patel, P.; Panchal, K. Effect of Free-Living Nitrogen Fixing and Phosphate Solubilizing Bacteria on Growth of Gossypium hirsutum L. Asian J. Biol. Sci. 2020, 9, 169–176. [Google Scholar] [CrossRef]
  31. Nautiyal, C.S. An efficient microbiological growth medium for screening phosphate solubilizing microorganisms. FEMS Microbiol. Lett. 1999, 170, 265–270. [Google Scholar] [CrossRef]
  32. Berraquero, F.R.; Baya, A.M.; Cormenzana, A.R. Estabelecimento de índices para el estúdio de la solubilización de fosfatos por bactérias del suelo. Ars Pharm. 1976, 17, 339–406. [Google Scholar]
  33. Chagas, A.F., Jr.; Oliveira, L.A.; Oliveira, A.N.; Willerding, A.L. Capacidade de solubilização de fosfatos e eficiência simbiótica de rizóbios isolados de solos da Amazônia. Acta Sci. Agron. 2010, 32, 359–366. [Google Scholar] [CrossRef]
  34. Sun, F.; Ou, Q.; Wang, N.; Guo, Z.W.; Ou, Y.; Li, N.; Peng, C. Isolation and identification of potassium-solubilizing bacteria from Mikania micrantha rhizospheric soil and their effect on M. micrantha plants. Glob. Ecol. Conserv. 2020, 23, e01141. [Google Scholar] [CrossRef]
  35. Louden, B.C.; Lynne, A.M.; Haarmann, D. Use of Blue Agar CAS Assay for Siderophore Detection. J. Microbiol. Biol. Educ. 2011, 12, 51–53. [Google Scholar] [CrossRef]
  36. Vincent, J.M. Manual Práctico de Rizobiología; Hemisferio Sur: Buenos Aires, Argentina, 1975; p. 178. [Google Scholar]
  37. Gordon, S.A.; Weber, R.P. Colorimetric estimation of indoleacetic acid. Plant Physiol. 1951, 26, 192–195. [Google Scholar] [CrossRef] [PubMed] [Green Version]
  38. Loaces, I.; Ferrando, L.; Scavino, A.F. Dynamics, diversity and function of endophytic siderophore-producing bacteria in rice. Microb. Ecol. 2011, 61, 606–618. [Google Scholar] [CrossRef] [PubMed]
  39. Hoagland, D.; Arnon, D.I. The water culture method for growing plants without soil. Calif. Agric. Exp. Stn. Circ. 1950, 347, 32. [Google Scholar]
  40. Abramoff, M.D.; Magalhaes, P.J.; Ram, S.J. Image Processing with ImageJ. Biophotonics Int. 2004, 11, 36–42. [Google Scholar]
  41. Malavolta, E.; Vitti, G.C.; Oliveira, S.A. Avaliação do Estado Nutricional das Plantas: Princípios e Aplicações; POTAFOS: Piracicaba, Brazil, 1997. [Google Scholar]
  42. RStudio Team. RStudio: Integrated Development for R. RStudio, PBC, Boston, MA, USA. Available online: http://www.rstudio.com/ (accessed on 22 October 2021).
  43. IBM Corp. IBM SPSS Statistics for Windows, version 20.0; IBM Corp: Armonk, NY, USA, 2011. [Google Scholar]
  44. SigmaPlot, Version 12.3, Systat Software Inc.: San Jose, CA, USA, 2013.
  45. Toffoli, L.M.; Martínez-Zamora, M.G.; Medrano, N.N.; Fontana, C.A.; Lovaisa, N.C.; Delaporte-Quintana, P.; Pedraza, R.O. Natural occurrence of Azospirillum brasilense in petunia with capacity to improve plant growth and flowering. J. Basic Microbiol. 2021, 61, 662–673. [Google Scholar] [CrossRef]
  46. Kang, S.M.; Radhakrishnan, R.; You, Y.H.; Joo, G.J.; Lee, I.J.; Lee, K.E.; Kim, J.H. Phosphate Solubilizing Bacillus megaterium mj1212 Regulates Endogenous Plant Carbohydrates and Amino Acids Contents to Promote Mustard Plant Growth. Indian J. Microbiol. 2014, 54, 427–433. [Google Scholar] [CrossRef]
  47. Yadav, H.; Gothwal, R.K.; Nigam, V.K.; Sinha-Roy, S.; Ghosh, P. Optimization of culture conditions for phosphate solubilization by a thermo-tolerant phosphate-solubilizing bacterium Brevibacillus sp. BISR-HY65 isolated from phosphate mines. Biocatal. Agric. Biotechnol. 2013, 2, 217–225. [Google Scholar] [CrossRef]
  48. Ferreira, M.J.; Silva, H.; Cunha, A. Siderophore-Producing Rhizobacteria as a Promising Tool for Empowering Plants to Cope with Iron Limitation in Saline Soils: A Review. Pedosphere 2019, 29, 409–420. [Google Scholar] [CrossRef]
  49. Tortora, M.L.; Díaz-Ricci, J.C.; Pedraza, R.O. Azospirillum brasilense siderophores with antifungal activity against Colletotrichum acutatum. Arch. Microbiol. 2011, 193, 275–286. [Google Scholar] [CrossRef]
  50. Santos, S.; Neto, I.F.F.; Machado, M.D.; Soares, H.M.V.M.; Soares, E.V. Siderophore Production by Bacillus megaterium: Effect of Growth Phase and Cultural Conditions. Appl. Biochem. Biotechnol. 2013, 172, 549–560. [Google Scholar] [CrossRef] [PubMed] [Green Version]
  51. Sheng, M.M.; Jia, H.K.; Zhang, G.Y.; Zeng, L.N.; Zhang, T.T.; Liu, H.M. Siderophore Production by Rhizosphere Biological Control Bacteria Brevibacillus brevis GZDF3 of Pinellia ternata and Its Antifungal Effects on Candida albicans. J. Microbiol. Biotechnol. 2020, 30, 689–699. [Google Scholar] [CrossRef] [PubMed]
  52. Liu, D.; Yang, Q.; Ge, K.; Hu, X.; Qi, G.; Du, B.; Ding, Y. Promotion of iron nutrition and growth on peanut by Paenibacillus illinoisensis and Bacillus sp. strains in calcareous soil. Braz. J. Microbiol. 2017, 48, 656–670. [Google Scholar] [CrossRef] [PubMed]
  53. Macias-Benitez, S.; Garcia-Martinez, A.M.; Caballero, P.J.; Gonzalez, J.M.; Tejada, M.M.; Parrado, J.R. Rhizospheric Organic Acids as Biostimulants: Monitoring Feedbacks on Soil Microorganisms and Biochemical Properties. Front. Plant Sci. 2020, 11, 633. [Google Scholar] [CrossRef]
  54. Suliasih; Widawati, S. Isolation of Indole Acetic Acid (IAA) producing Bacillus siamensis from peat and optimization of the culture conditions for maximum IAA production. IOP Conf. Ser. Earth Environ. Sci. 2020, 572, 012025. [Google Scholar] [CrossRef]
  55. Arkhipchenko, I.A.; Shaposhnikov, A.I.; Kravchenko, L.V. Tryptophan concentration of animal wastes and organic fertilizers. Appl. Soil Ecol. 2006, 34, 62–64. [Google Scholar] [CrossRef]
  56. Przemieniecki, S.W.; Purwin, C.; Mastalerz, J.; Borsuk, M.; LipiŃski, K.; Kurowski, T. Biostimulating effect of L-tryptophan on the yield and chemical and microbiological quality of perennial ryegrass (Lolium perenne) herbage and silage for ruminant. Journal of the Science of Food and Agriculture. J. Sci. Food Agric. 2020, 101, 3969–3974. [Google Scholar] [CrossRef]
  57. Santoyo, G.; Moreno-Hagelsieb, G.; del Carmen, O.M.M.; Glick, B.R. Plant growth-promoting bacterial endophytes. Microbiol. Res. 2016, 183, 92–99. [Google Scholar] [CrossRef]
  58. Hashmi, I.; Paul, C.; Al-Dourobi, A.; Sandoz, F.; Deschamps, P.; Junier, T.; Bindschedler, S. Comparison of the plant growth promotion performance of a consortium of Bacilli inoculated as endospores or as vegetative cells. FEMS Microbiol. Ecol. 2019, 95, fiz147. [Google Scholar] [CrossRef]
  59. Ramos, A.C.; Melo, J.; de Souza, S.B. Inoculation with the endophytic bacterium Herbaspirillum seropedicae promotes growth, nutrient uptake and photosynthetic efficiency in rice. Planta 2020, 252, 87. [Google Scholar] [CrossRef]
  60. Samaniego-Gámez, B.Y.; Garruña, R.; Tun-Suárez, J.M.; Kantun-Can, J.; Reyes-Ramírez, A.; Cervantes-Díaz, L. Bacillus spp. inoculation improves photosystem II efficiency and enhances photosynthesis in pepper plants. Chil. J. Agric. Res. 2016, 76, 409–416. [Google Scholar] [CrossRef] [Green Version]
  61. Rozpadek, P.K.; Wężowicz, M.; Nosek, R.; Ważny, K.; Tokarz, M.; Lembicz, M.; Miszalski, Z.; Turnau, K. The fungal endophyte Epichloë typhina improves photosynthesis efficiency of its host orchard grass (Dactylis glomerata). Planta 2015, 242, 1025–1035. [Google Scholar] [CrossRef] [PubMed] [Green Version]
  62. Agathokleous, E.; Feng, Z.; Peñuelas, J. Chlorophyll hormesis: Are chlorophylls major components of stress biology in higher plants? Sci. Total Environ. 2020, 726, 138637. [Google Scholar] [CrossRef] [PubMed]
  63. Mikiciuk, G.; Sas-Paszt, L.; Mikiciuk, M.; Derkowska, E.; Trzciński, P.; Głuszek, S.; Rudnicka, J. Mycorrhizal frequency, physiological parameters, and yield of strawberry plants inoculated with endomycorrhizal fungi and rhizosphere bacteria. Mycorrhiza 2019, 29, 489–501. [Google Scholar] [CrossRef] [PubMed] [Green Version]
  64. Morais, M.C.; Mucha, Â.; Ferreira, H.; Gonçalves, B.; Bacelar, E.; Marques, G. Comparative study of plant growth-promoting bacteria on the physiology, growth and fruit quality of strawberry. J. Sci. Food Agric. 2019, 99, 5341–5349. [Google Scholar] [CrossRef]
  65. Gardestrom, P.; Wigge, B. Influence of Photorespiration on ATP/ADP Ratios in the Chloroplasts, Mitochondria, and Cytosol, Studied by Rapid Fractionation of Barley (Hordeum vulgare) Protoplasts. Plant Physiol. 1988, 881, 69–76. [Google Scholar] [CrossRef] [Green Version]
  66. Crafts-Brandner, S.J.; Salvucci, M.E. Rubisco activase constrains the photosynthetic potential of leaves at high temperature and CO2. Proc. Natl. Acad. Sci. USA 2000, 97, 13430–13435. [Google Scholar] [CrossRef] [Green Version]
  67. Ribeiro, V.P.; Gomes, E.A.; de Sousa, S.M. Co-inoculation with tropical strains of Azospirillum and Bacillus is more efficient than single inoculation for improving plant growth and nutrient uptake in maize. Arch. Microbiol. 2022, 204, 143. [Google Scholar] [CrossRef]
  68. Saghafi, D.; Ghorbanpour, M.; Lajayer, B.A. Efficiency of Rhizobium strains as plant growth promoting rhizobacteria on morpho-physiological properties of Brassica napus L. under salinity stress. J. Soil Sci. Plant Nutr. 2018, 18, 253–268. [Google Scholar] [CrossRef] [Green Version]
  69. Silva, C.F.B.; Brito, T.L.; Taniguchi, C.A.K.; Lopes, L.A.; Pinto, G.A.S.; Carvalho, A.C.P.P. Growth-promoting potential of bacterial biomass in the banana micropropagated plants. Rev. Bras. Eng. Agric. Ambient. 2018, 22, 782–787. [Google Scholar] [CrossRef]
  70. Deepa, C.K.; Dastager, S.G.; Pandey, A. Isolation and characterization of plant growth promoting bacteria from non-rhizospheric soil and their effect on cowpea (Vigna unguiculata (L.) Walp.) seedling growth. World J. Microbiol. Biotechnol. 2010, 26, 1233–1240. [Google Scholar] [CrossRef] [PubMed]
  71. Vacheron, J.; Desbrosses, G.; Bouffaud, M.L.; Touraine, B.; Moënne-Loccoz, Y.; Muller, D.; Prigent-Combaret, C. Plant growth-promoting rhizobacteria and root system functioning. Front. Plant Sci. 2013, 4, 356. [Google Scholar] [CrossRef] [PubMed] [Green Version]
  72. Verhage, L. Underground allies: How bacteria stimulate plant growth by altering root development. Plant J. 2020, 103, 1637–1638. [Google Scholar] [CrossRef] [PubMed]
  73. Gomes, D.G.; Radi, A.J.; Aquino, G.S. Bactérias promotoras de crescimento alteram o desenvolvimento da parte aérea e sistema radicular da canola. Semin. Cienc. Agrar. 2018, 39, 2375–2384. [Google Scholar] [CrossRef]
  74. Rosa, P.A.L.; Mortinho, E.S.; Jalal, A.; Galindo, F.S.; Buzetti, S.; Fernandes, G.C.; Teixeira Filho, M.C.M. Inoculation With Growth-Promoting Bacteria Associated With the Reduction of Phosphate Fertilization in Sugarcane. Front. Environ. Sci. 2020, 8, 32. [Google Scholar] [CrossRef]
  75. Bona, E.; Cantamessa, S.; Massa, N. Arbuscular mycorrhizal fungi and plant growth-promoting pseudomonads improve yield, quality and nutritional value of tomato: A field study. Mycorrhiza 2017, 27, 1–11. [Google Scholar] [CrossRef]
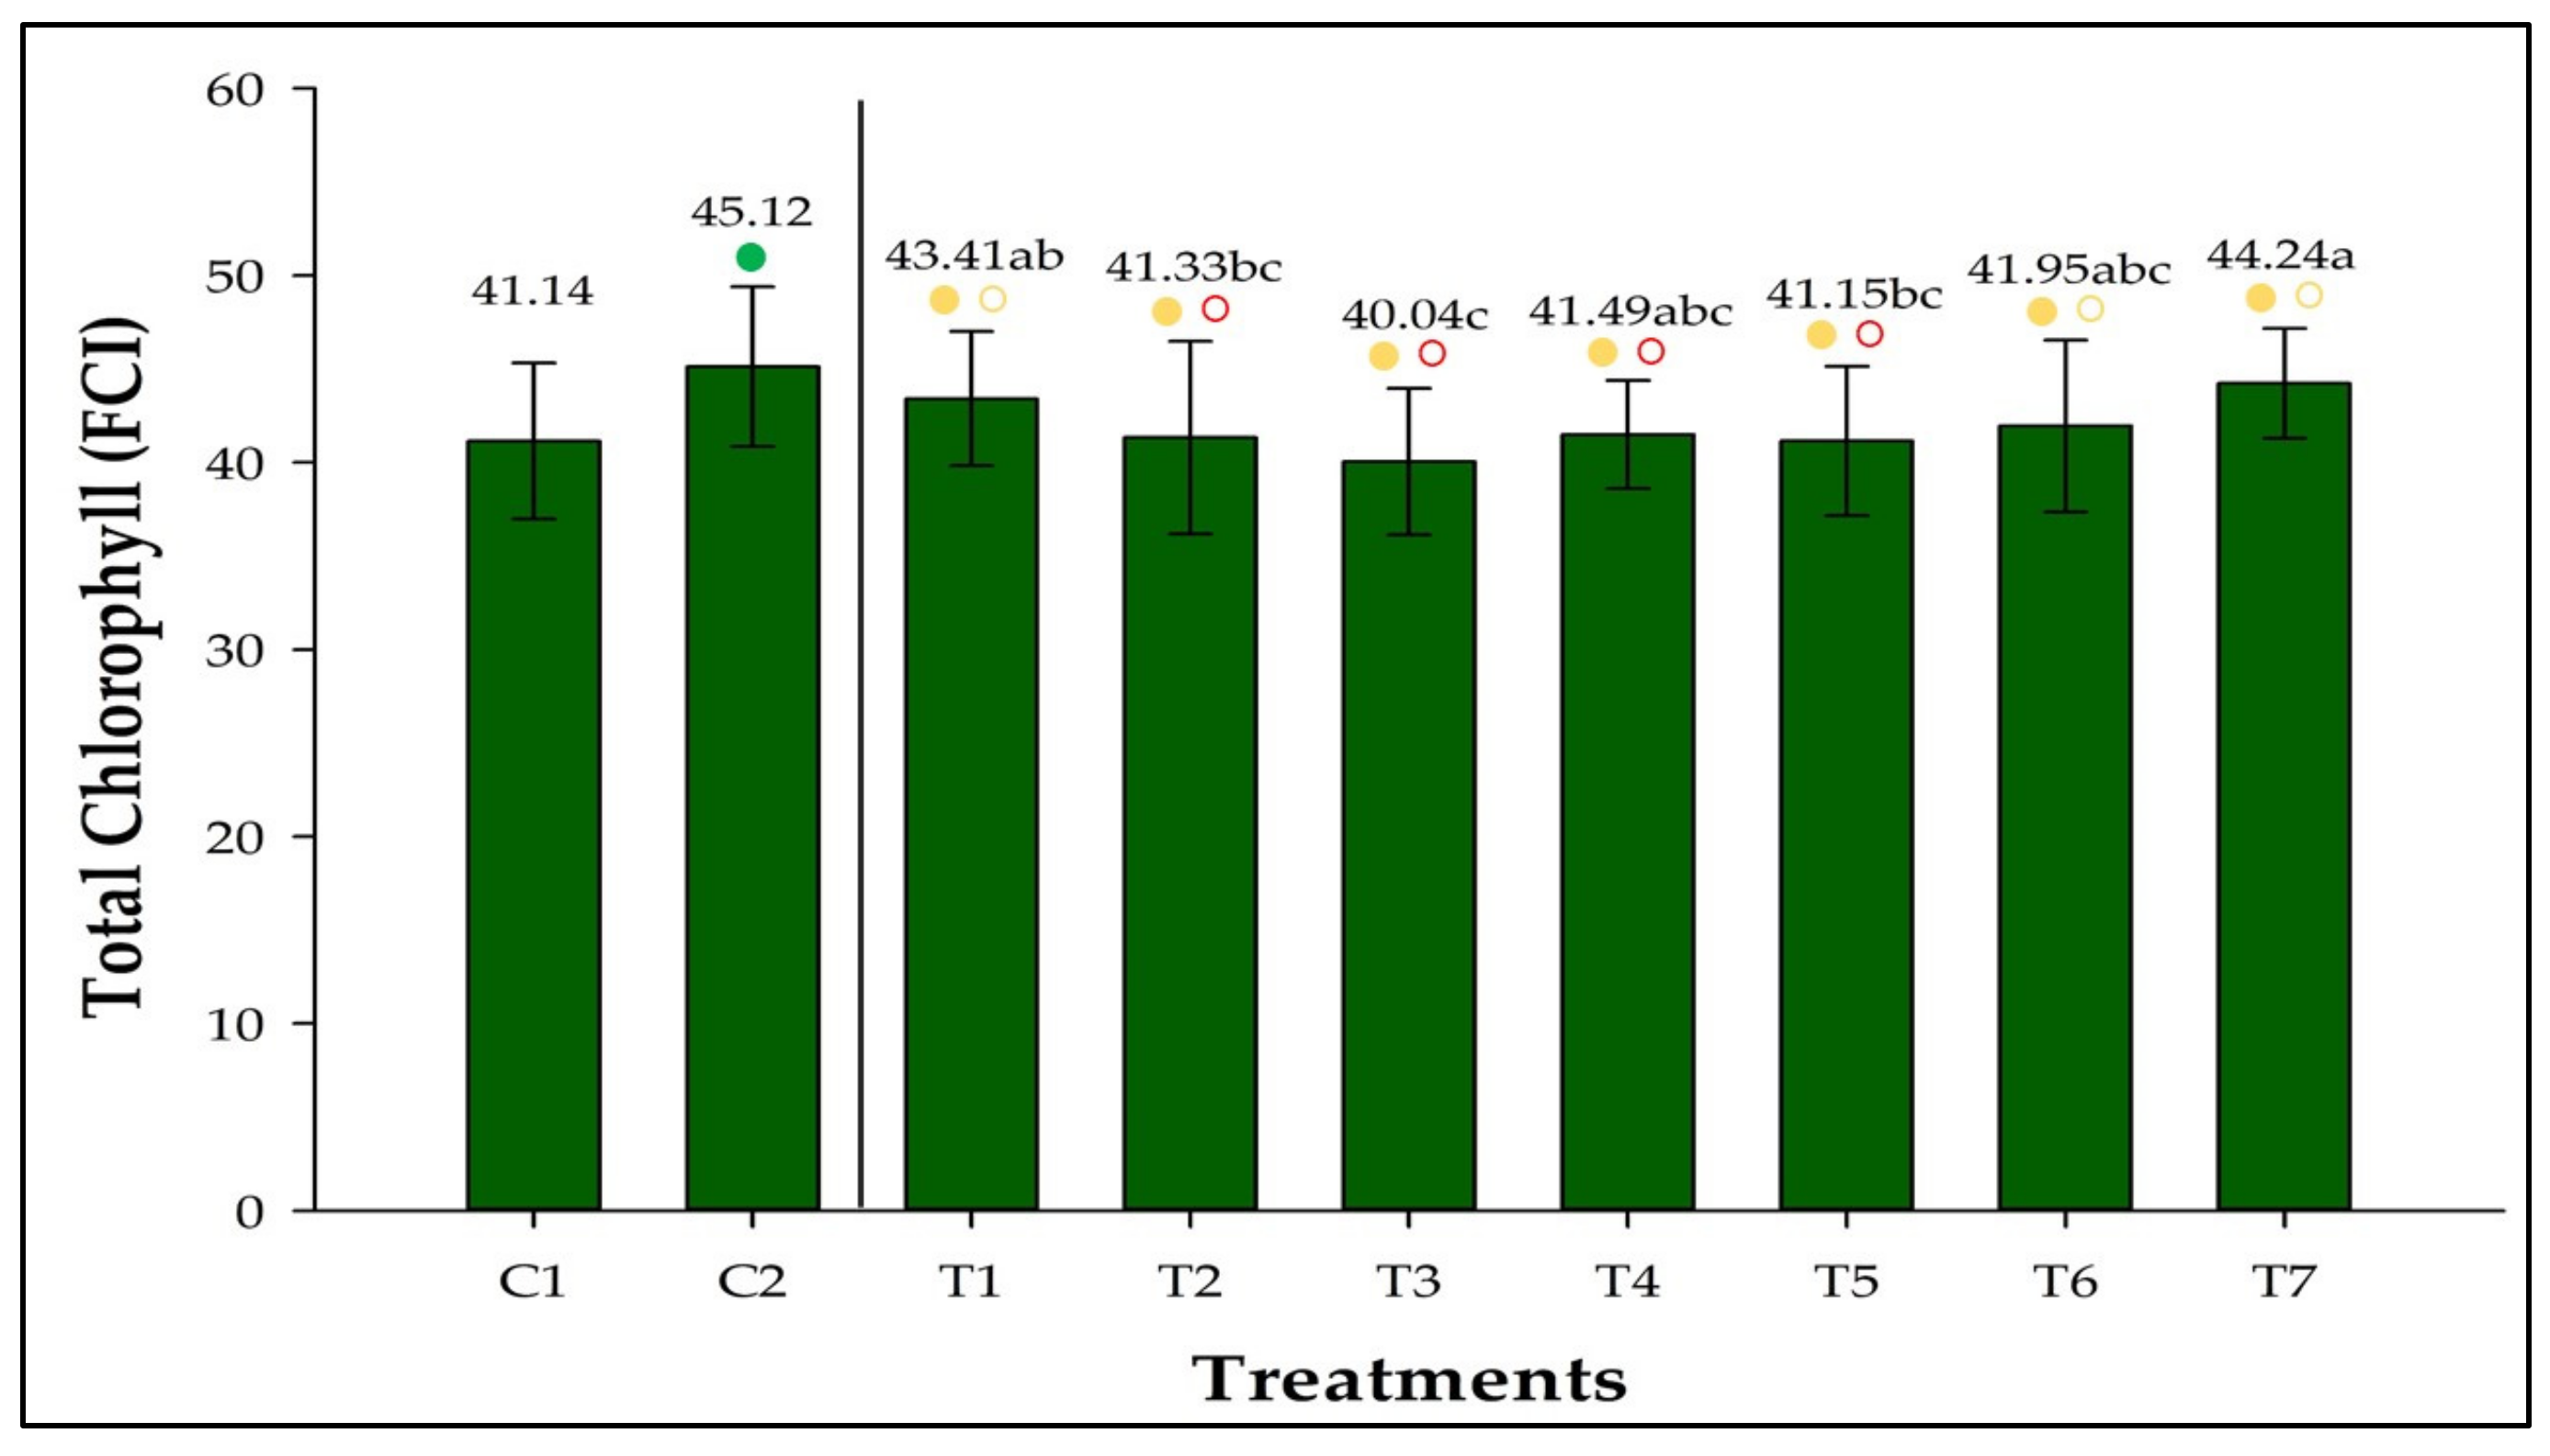
Figure 1. Total chlorophyll concentration in strawberries inoculated with Azospirillum brasilense, Bacillus megaterium, and Brevibacillus fluminis, alone and in mixtures. The concentration is expressed as the Falkner chlorophyll index (FCI). Closed (⬤) and open () circles indicate comparisons withs Controls 1 (C1) and 2 (C2), respectively. Green, yellow, and red circles indicate that the values are higher than, equivalent to, or lower than those observed in the controls according to Dunnet’s test (p ≤ 0.05). Means followed by the same letter do not differ statistically according to Duncan’s test (p ≤ 0.05). C1: control without inoculation + fertilization 100% of N and P; C2: control without inoculation + fertilization 30% of N and P; T1: Azospirillum brasilense Ab-v5; T2: Bacillus megaterium 0004; T3: Brevibacillus fluminis MET12M2; T4: Ab-v5 + 0004; T5: Ab-v5 + MET12M2; T6: 0004 + MET12M2; T7: Ab-v5 + 0004 + MET12M2.
Agronomy 12 02465 g001
Figure 2. Crown diameter extension in strawberries inoculated with Azospirillum brasilense, Bacillus megaterium, and Brevibacillus fluminis, alone and in mixtures on days 0 and 15. Means followed by the same letter do not differ significantly according to Duncan’s test (p ≤ 0.05). Means on Day 15 followed by asterisks (*) differ statistically from the corresponding mean on Day 0 according to the paired Student’s t-test (p ≤ 0.01). C1: control without inoculation + fertilization 100% of N and P; C2: control without inoculation + fertilization 30% of N and P; T1: Azospirillum brasilense Ab-v5; T2: Bacillus megaterium 0004; T3: Brevibacillus fluminis MET12M2; T4: Ab-v5 + 0004; T5: Ab-v5 + MET12M2; T6: 0004 + MET12M2; T7: Ab-v5 + 0004 + MET12M2.
Agronomy 12 02465 g002
Figure 3. Crown diameter extension in strawberries inoculated with Azospirillum brasilense, Bacillus megaterium, and Brevibacillus fluminis, alone and in mixtures. MED: Cluster with measurements of all treatments on day 0. Clusters of controls and treatments represent their respective mean crown diameter at day 15. Closed circles (⬤) indicate the comparison of means in relation to MED cluster. The coloring of the circles suggests that according to Dunnet’s test (p ≤ 0.05), the values are higher than those observed in the MED cluster when green, equivalent to them when yellow, and lower than them when red. C1: control without inoculation + fertilization 100% of N and P; C2: control without inoculation + fertilization 30% of N and P; T1: Azospirillum brasilense Ab-v5; T2: Bacillus megaterium 0004; T3: Brevibacillus fluminis MET12M2; T4: Ab-v5 + 0004; T5: Ab-v5 + MET12M2; T6: 0004 + MET12M2; T7: Ab-v5 + 0004 + MET12M2.
Agronomy 12 02465 g003
Figure 4. Number of leaves (A) and foliar area (B) of strawberries inoculated with Azospirillum brasilense, Bacillus megaterium, and Brevibacillus fluminis, alone and in mixtures. In (A), the values next to the bars represent the number of samples with a given number of leaves. The percentages express the proportion of the number of leaves among all observations. In (B), closed (⬤) and open (〇) circles and indicate the comparisons of the inoculation treatments and C1 and C2, respectively, according to Dunnet’s test (p ≤ 0.05). Green, yellow, and red indicate when the mean is higher than, equivalent to, or lower than those of the controls. Means followed by the same letter are not statistically different by Duncan’s test (p ≤ 0.05). C1: control without inoculation + fertilization 100% of N and P; C2: control without inoculation + fertilization 30% of N and P; T1: Azospirillum brasilense Ab-v5; T2: Bacillus megaterium 0004; T3: Brevibacillus fluminis MET12M2; T4: Ab-v5 + 0004; T5: Ab-v5 + MET12M2; T6: 0004 + MET12M2; T7: Ab-v5 + 0004 + MET12M2.
Agronomy 12 02465 g004
Figure 5. Leaf area and number of leaves in strawberries inoculated with Azospirillum brasilense, Bacillus megaterium, and Brevibacillus fluminis, alone and in mixtures. The red triangles represent the leaf area. The colored circles represent the experimental units and their respective number of leaves. Control 1: control without inoculation + fertilization 100% of N and P; Control 2: control without inoculation + fertilization 30% of N and P; Treatment 1: Azospirillum brasilense (Ab-v5), Treatment 2: Bacillus megaterium (0004); Treatment 3: Brevibacillus fluminis (MET12M2); Treatment 4: Ab-v5 + 0004; Treatment 5: Ab-v5 + MET12M2; T6: 0004 + MET12M2; Treatment 7: Ab-v5 + 0004 + MET12M2.
Agronomy 12 02465 g005
Figure 6. Root length of strawberries inoculated with Azospirillum brasilense, Bacillus megaterium, and Brevibacillus fluminis, alone and in mixtures. Closed (⬤) and open () circles indicate comparisons withs Controls 1 (C1) and 2 (C2), respectively. Green, yellow, and red circles indicate that the values are higher than, equivalent to, or lower than those observed in the controls according to Dunnet’s test (p ≤ 0.05). Means followed by the same letter do not differ statistically according to Duncan’s test (p ≤ 0.05). C1: control without inoculation + fertilization 100% of N and P; C2: control without inoculation + fertilization 30% of N and P; T1: Azospirillum brasilense (Ab-v5); T2: Bacillus megaterium (0004); T3: Brevibacillus fluminis (MET12M2); T4: Ab-v5 + 0004; T5: Ab-v5 + MET12M2; T6: 0004 + MET12M2; T7: Ab-v5 + 0004 + MET12M2.
Agronomy 12 02465 g006
Figure 7. Shoot fresh (A) and dry (B) weights of strawberries inoculated with Azospirillum brasilense, Bacillus megaterium, and Brevibacillus fluminis, alone and in mixtures. Closed (⬤) and open () circles indicate comparisons withs Controls 1 and 2, respectively. Yellow and red circles indicate that the values are equivalent to, or lower than those observed in the controls according to Dunnet’s test (p ≤ 0.05). Means followed by the same letter do not differ statistically according to Duncan’s test (p ≤ 0.05). C1: control without inoculation + fertilization 100% of N and P; C2: control without inoculation + fertilization 30% of N and P; T1: Azospirillum brasilense (Ab-v5); T2: Bacillus megaterium (0004); T3: Brevibacillus fluminis (MET12M2); T4: Ab-v5 + 0004; T5: Ab-v5 + MET12M2; T6: 0004 + MET12M2; T7: Ab-v5 + 0004 + MET12M2.
Agronomy 12 02465 g007
Figure 8. Root fresh (A) and dry (B) weights of strawberries inoculated with Azospirillum brasilense, Bacillus megaterium, and Brevibacillus fluminis, alone and in mixtures. Closed (⬤) and open () circles indicate comparisons withs Controls 1 and 2, respectively. Yellow circles indicate that the values are equivalent to those observed in the controls according to Dunnet’s test (p ≤ 0.05). Means followed by the same letter do not differ statistically according to Duncan’s test (p ≤ 0.05). C1: control without inoculation + fertilization 100% of N and P; C2: control without inoculation + fertilization 30% of N and P; T1: Azospirillum brasilense (Ab-v5); T2: Bacillus megaterium (0004); T3: Brevibacillus fluminis (MET12M2); T4: Ab-v5 + 0004; T5: Ab-v5 + MET12M2; T6: 0004 + MET12M2; T7: Ab-v5 + 0004 + MET12M2.
Agronomy 12 02465 g008
Figure 9. Total fresh (A) and dry (B) weights of strawberries inoculated with Azospirillum brasilense, Bacillus megaterium, and Brevibacillus fluminis, alone and in mixtures. Closed (⬤) and open () circles indicate comparisons withs Controls 1 and 2, respectively. Yellow and red circles indicate that the values are equivalent to, or lower than those observed in the controls according to Dunnet’s test (p ≤ 0.05). Means followed by the same letter do not differ statistically according to Duncan’s test (p ≤ 0.05). C1: control without inoculation + fertilization 100% of N and P; C2: control without inoculation + fertilization 30% of N and P; T1: Azospirillum brasilense (Ab-v5); T2: Bacillus megaterium (0004); T3: Brevibacillus fluminis (MET12M2); T4: Ab-v5 + 0004; T5: Ab-v5 + MET12M2; T6: 0004 + MET12M2; T7: Ab-v5 + 0004 + MET12M2.
Agronomy 12 02465 g009
Figure 10. Roots of strawberries inoculated with Azospirillum brasilense, Bacillus megaterium, and Brevibacillus fluminis, alone and in mixtures. C1: control without inoculation + fertilization 100% of N and P; C2: control without inoculation + fertilization 30% of N and P; T1: Azospirillum brasilense (Ab-v5); T2: Bacillus megaterium (0004); T3: Brevibacillus fluminis (MET12M2); T4: Ab-v5 + 0004; T5: Ab-v5 + MET12M2; T6: 0004 + MET12M2; T7: Ab-v5 + 0004 + MET12M2.
Agronomy 12 02465 g010
Figure 11. Principal component analysis with the morphoanatomical variables. CD15: crown diameter (Day 15), FA: leaf area, NL: number of leaves, RL: root length, SF: shoot fresh weight, SD: shoot dry weight, RF: root fresh weight, RD: root dry weight, TF: total fresh weight, TD: total dry weight.
Agronomy 12 02465 g011
Figure 12. Principal component analysis with physiological variables. Ci: internal CO2 concentration, T: leaf transpiration, gs: stomatal conductance, PE: photosynthetic efficiency, WUE: water use efficiency, CUE: carboxylation efficiency, N: nitrogen, P: phosphorus, K: potassium, Ca: calcium, Mg: magnesium, TCHL: total chlorophylls.
Agronomy 12 02465 g012
Figure 13. Dendrogram displaying the distances between the different inoculation treatments of strawberries. Ward’s method for minimum variances and the Euclidean distance were chosen. Comparison between treatments and controls. C1: control without inoculation + fertilization 100% of N and P; C2: control without inoculation + fertilization 30% of N and P; T1: Azospirillum brasilense (Ab-v5); T2: Bacillus megaterium (0004); T3: Brevibacillus fluminis (MET12M2); T4: Ab-v5 + 0004; T5: Ab-v5 + MET12M2; T6: 0004 + MET12M2; T7: Ab-v5 + 0004 + MET12M2.
Agronomy 12 02465 g013
Table 1. Experimental treatments applied.
TreatmentDescription of FertilizationInoculumInoculum Concentration
Control 1 (C1)Complete fertilization (100% N and P)No inoculum-
Control 2 (C2)Reduced fertilization (30% N and P)No inoculum-
Treatment 1 (T1)Reduced fertilization (30% N and P)Ab-v56 mL (1 × 10⁸)
Treatment 2 (T2)Reduced fertilization (30% N and P)00046 mL (1 × 10⁸)
Treatment 3 (T3)Reduced fertilization (30% N and P)MET12M26 mL (1 × 10⁸)
Treatment 4 (T4)Reduced fertilization (30% N and P)Ab-v5 + 00043 mL (1 × 10⁸) + 3 mL (1 × 10⁸)
Treatment 5 (T5)Reduced fertilization (30% N and P)Ab-v5 + MET12M23 mL (1 × 10⁸) + 3 mL (1 × 10⁸)
Treatment 6 (T6)Reduced fertilization (30% N and P)0004 + MET12M23 mL (1 × 10⁸) + 3 mL (1 × 10⁸)
Treatment 7 (T7)Reduced fertilization (30% N and P)Ab-v5 + 0004 + MET12M22 mL (1 × 10⁸) + 2 mL (1 × 10⁸) + 2 mL (1 × 10⁸)
Ab-v5: Azospirillum brasilense, 0004: Bacillus megaterium, MET12M2: Brevibacillus fluminis. The inoculum concentration represents the concentration of cells measured by optical density (0.5 at 600 nm).
Table 2. Results of in vitro tests for growth promotion.
BacteriumPhosphate Solubilization (IS)Potassium SolubilizationSiderophore ProductionpHIAA Production
Azospirillum brasilense (Ab-v5)16.67 ± 9.81a+ Acid+
Bacillus megaterium (0004)14.33 ± 2.89a+ Acid+
Brevibacillus fluminis (MET12M2)15 ± 3a+ Acid+
The symbols (+) and (−), indicate that the strain was positive or negative for a given character. IAA: indole-acetic acid. The ± symbol indicates the standard deviation. Means followed by the same letters do not differ according to Duncan’s test (p ≤ 0.05).
Table 3. Photosynthetic efficiency (PE), stomatal conductance (gs), internal CO2 concentration (Ci), leaf transpiration (T), water use efficiency (WUE), and carboxylation efficiency (CUE) in strawberries inoculated with Azospirillum brasilense, Bacillus megaterium, and Brevibacillus fluminis, alone and in mixtures. Means are followed by their standard deviations.
TreatmentPEgsCiTWUECUE
(μmol CO2·m−2·s−1)(mol CO2·m−2·s−1)(μmol·mol−1)(CO2·m−2·s−1)(μmol·m−2·s−1)
(mmol H2O·m−2·s−1)−1
(μmol·m−2·s−1)
(μmol·mol−1)−1
Control 18.171 ± 1.900.084 ± 0.02231.76 ± 14.441.15 ± 0.307.179 ± 0.530.035 ± 0.009
Control 28.282 ± 0.94   0.079 ± 0.03 189.1 ± 89.30 1.1 ± 0.418.72 ± 3.58 0.065 ± 0.048
Treatment 18.017 ± 1.08ab 0.093 ± 0.02ab 245.9 ± 20.06a 1.3 ± 0.28a 6.31 ± 0.74ab 0.033 ± 0.004ab
Treatment 28.039 ± 2.24ab 0.095 ± 0.03ab 244.9 ± 35.12a 1.26 ± 0.39a 6.58 ± 1.37ab 0.034 ± 0.014ab
Treatment 37.123 ± 0.89b 0.096 ± 0.02ab 266.29 ± 23.99a 1.39 ± 0.26a 5.28 ± 1.10b 0.027 ± 0.005b
Treatment 49.353 ± 1.92a 0.102 ± 0.03ab 233.77 ± 37.40a 1.37 ± 0.32a 7.02 ± 1.47a 0.041 ± 0.012a
Treatment 59.169 ± 3.22ab 0.117 ± 0.02a 263.9 ± 29.96a 1.56 ± 0.26a 5.86 ± 1.49ab 0.036 ± 0.017ab
Treatment 67.749 ± 1.17ab 0.089 ± 0.02b 240.08 ± 37.85a 1.25 ± 0.32a 6.51 ± 1.63ab 0.033 ± 0.006ab
Treatment 79.052 ± 1.47a 0.108 ± 0.02ab 250.46 ± 25.46a 1.46 ± 0.21a 6.24 ± 0.88ab 0.037 ± 0.007a
Closed (⬤) and open () circles indicate comparisons withs Controls 1 and 2, respectively. Green, yellow, and red circles indicate that the values are higher than, equivalent to, or lower than those observed in the controls, according to the Kruskal–Wallis test (p ≤ 0.05) and pairwise comparison with the Dunn test (p ≤ 0.05). Means followed by the same letter do not differ statistically. Control 1: control without inoculation + fertilization 100% of N and P; Control 2: control without inoculation + fertilization 30% of N and P; Treatment 1: Azospirillum brasilense (Ab-v5), Treatment 2: Bacillus megaterium (0004); Treatment 3: Brevibacillus fluminis (MET12M2); Treatment 4: Ab-v5 + 0004; Treatment 5: Ab-v5 + MET12M2; Treatment 6: 0004 + MET12M2; Treatment 7: Ab-v5 + 0004 + MET12M2.
Table 4. Foliar nitrogen (N), phosphorus (P), potassium (K), calcium (Ca), and magnesium (Mg) contents in strawberries inoculated with Azospirillum brasilense, Bacillus megaterium, and Brevibacillus fluminis, alone and in mixtures. Means are followed by their standard deviations.
TreatmentMacronutrients (g/kg)
NPKCaMg
Control 19.75 ± 0.155 ± 018.45 ± 0.657.35 ± 0.056.8 ± 0
Control 29.45 ± 0.45 5.9 ± 0.1 19.55 ± 0.05 7.15 ± 0.25 7.2 ± 0.10
Treatment 1 6.85 ± 0.75c 4.1 ± 0.5A 12.35 ± 1.25b 5.15 ± 0.65c 4.8 ± 0.50d
Treatment 29.35 ± 0.95b 5.2 ± 1.1A 15.3 ± 2.90a 6.15 ± 1.15bc 6.05 ± 1.05c
Treatment 310.2 ± 0.60ab 5.55 ± 0.25A 17.4 ± 0.90a 7.2 ± 0.20ab 7.85 ± 0.35a
Treatment 410.55 ± 0.55a 6.05 ± 0.65A 17.45 ± 1.35a 7.4 ± 0.70a 7.6 ± 0.60a
Treatment 59.65 ± 0.35ab 5.2 ± 0.3A 15.6 ± 0.80a 6.3 ± 0.40ab 6.75 ± 0.35bc
Treatment 610.4 ± 0.10ab 5.8 ± 0.3A 17.2 ± 1.00a 6.9 ± 0.30ab 7.25 ± 0.15ab
Treatment 710.2 ± 0ab 5.55 ± 0.15A 17.1 ± 0.50a 7.1 ± 0.20ab 7.55 ± 0.15ab
Closed (⬤) and open () circles indicate comparisons withs Controls 1 and 2, respectively. Green, yellow, and red circles indicate that the values are higher than, equivalent to, or lower than those observed in the controls according to Dunnet’s test (p ≤ 0.05). Means followed by the same letter do not differ statistically according to Duncan’s test (p ≤ 0.05). Similar uppercase letters indicate statistically equal means according to the Kruskal–Wallis test (p ≤ 0.05) and pairwise comparison with the Dunn test (p ≤ 0.05). The color comparison is the same as described above. Control 1: control without inoculation + fertilization 100% of N and P; Control 2: control without inoculation + fertilization 30% of N and P; Treatment 1: Azospirillum brasilense (Ab-v5), Treatment 2: Bacillus megaterium (0004); Treatment 3: Brevibacillus fluminis (MET12M2); Treatment 4: Ab-v5 + 0004; Treatment 5: Ab-v5 + MET12M2; Treatment 6: 0004 + MET12M2; Treatment 7: Ab-v5 + 0004 + MET12M2.
Table 5. Number of leaves in strawberries inoculated with Azospirillum brasilense, Bacillus megaterium, and Brevibacillus fluminis, alone and in mixtures. Means are followed by their standard deviations.
TreatmentAverage Number of Leaves
Control 15.33 ± 0.52
Control 25.83 ± 1.47
Treatment 14.67 ± 0.52a
Treatment 26.67 ± 1.51a
Treatment 35.33 ± 0.52a
Treatment 45.33 ± 1.03a
Treatment 55.50 ± 1.87a
Treatment 65.00 ± 1.10a
Treatment 75.00 ± 0.63a
Closed (⬤) and open () circles indicate comparisons withs Controls 1 and 2, respectively. Green, yellow, and red circles indicate that the values are higher than, equivalent to, or lower than those observed in the controls according to Dunnet’s test (p ≤ 0.05). Means followed by the same letter do not differ statistically according to Duncan’s test (p ≤ 0.05). Control 1: control without inoculation + fertilization 100% of N and P; Control 2: control without inoculation + fertilization 30% of N and P; Treatment 1: Azospirillum brasilense (Ab-v5), Treatment 2: Bacillus megaterium (0004); Treatment 3: Brevibacillus fluminis (MET12M2); Treatment 4: Ab-v5 + 0004; Treatment 5: Ab-v5 + MET12M2; Treatment 6: 0004 + MET12M2; Treatment 7: Ab-v5 + 0004 + MET12M2.
Publisher’s Note: MDPI stays neutral with regard to jurisdictional claims in published maps and institutional affiliations.