
Fertilizer of the Future: Beneficial Bacteria Promote Strawberry Growth and Yield and May Reduce the Need for Chemical Fertilizer
 ,
,
Abstract
:
1. Introduction
2. Materials and Methods
2.1. Cultivation Conditions of Isolates and Standardization of Inoculum
2.2. Metabolic Profile of Growth-Promoting Bacteria
2.2.1. Phosphate Solubilization
2.2.2. Potassium Solubilization
2.2.3. Siderophore Production
2.2.4. Acidification of the Culture Medium
2.2.5. Indole-Acetic Acid (IAA) Synthesis
2.3. Microbial Inoculation on Strawberry Seedlings
2.4. Physiological Evaluation of Foliar Gas Exchange
2.5. Quantification of Chlorophylls
2.6. Evaluation of Plant Morphological Characters
2.7. Foliar Nutrient Analysis
2.8. Experimental Design and Data Analysis
3. Results
3.1. Metabolic Screening
3.2. Physiological Assessment
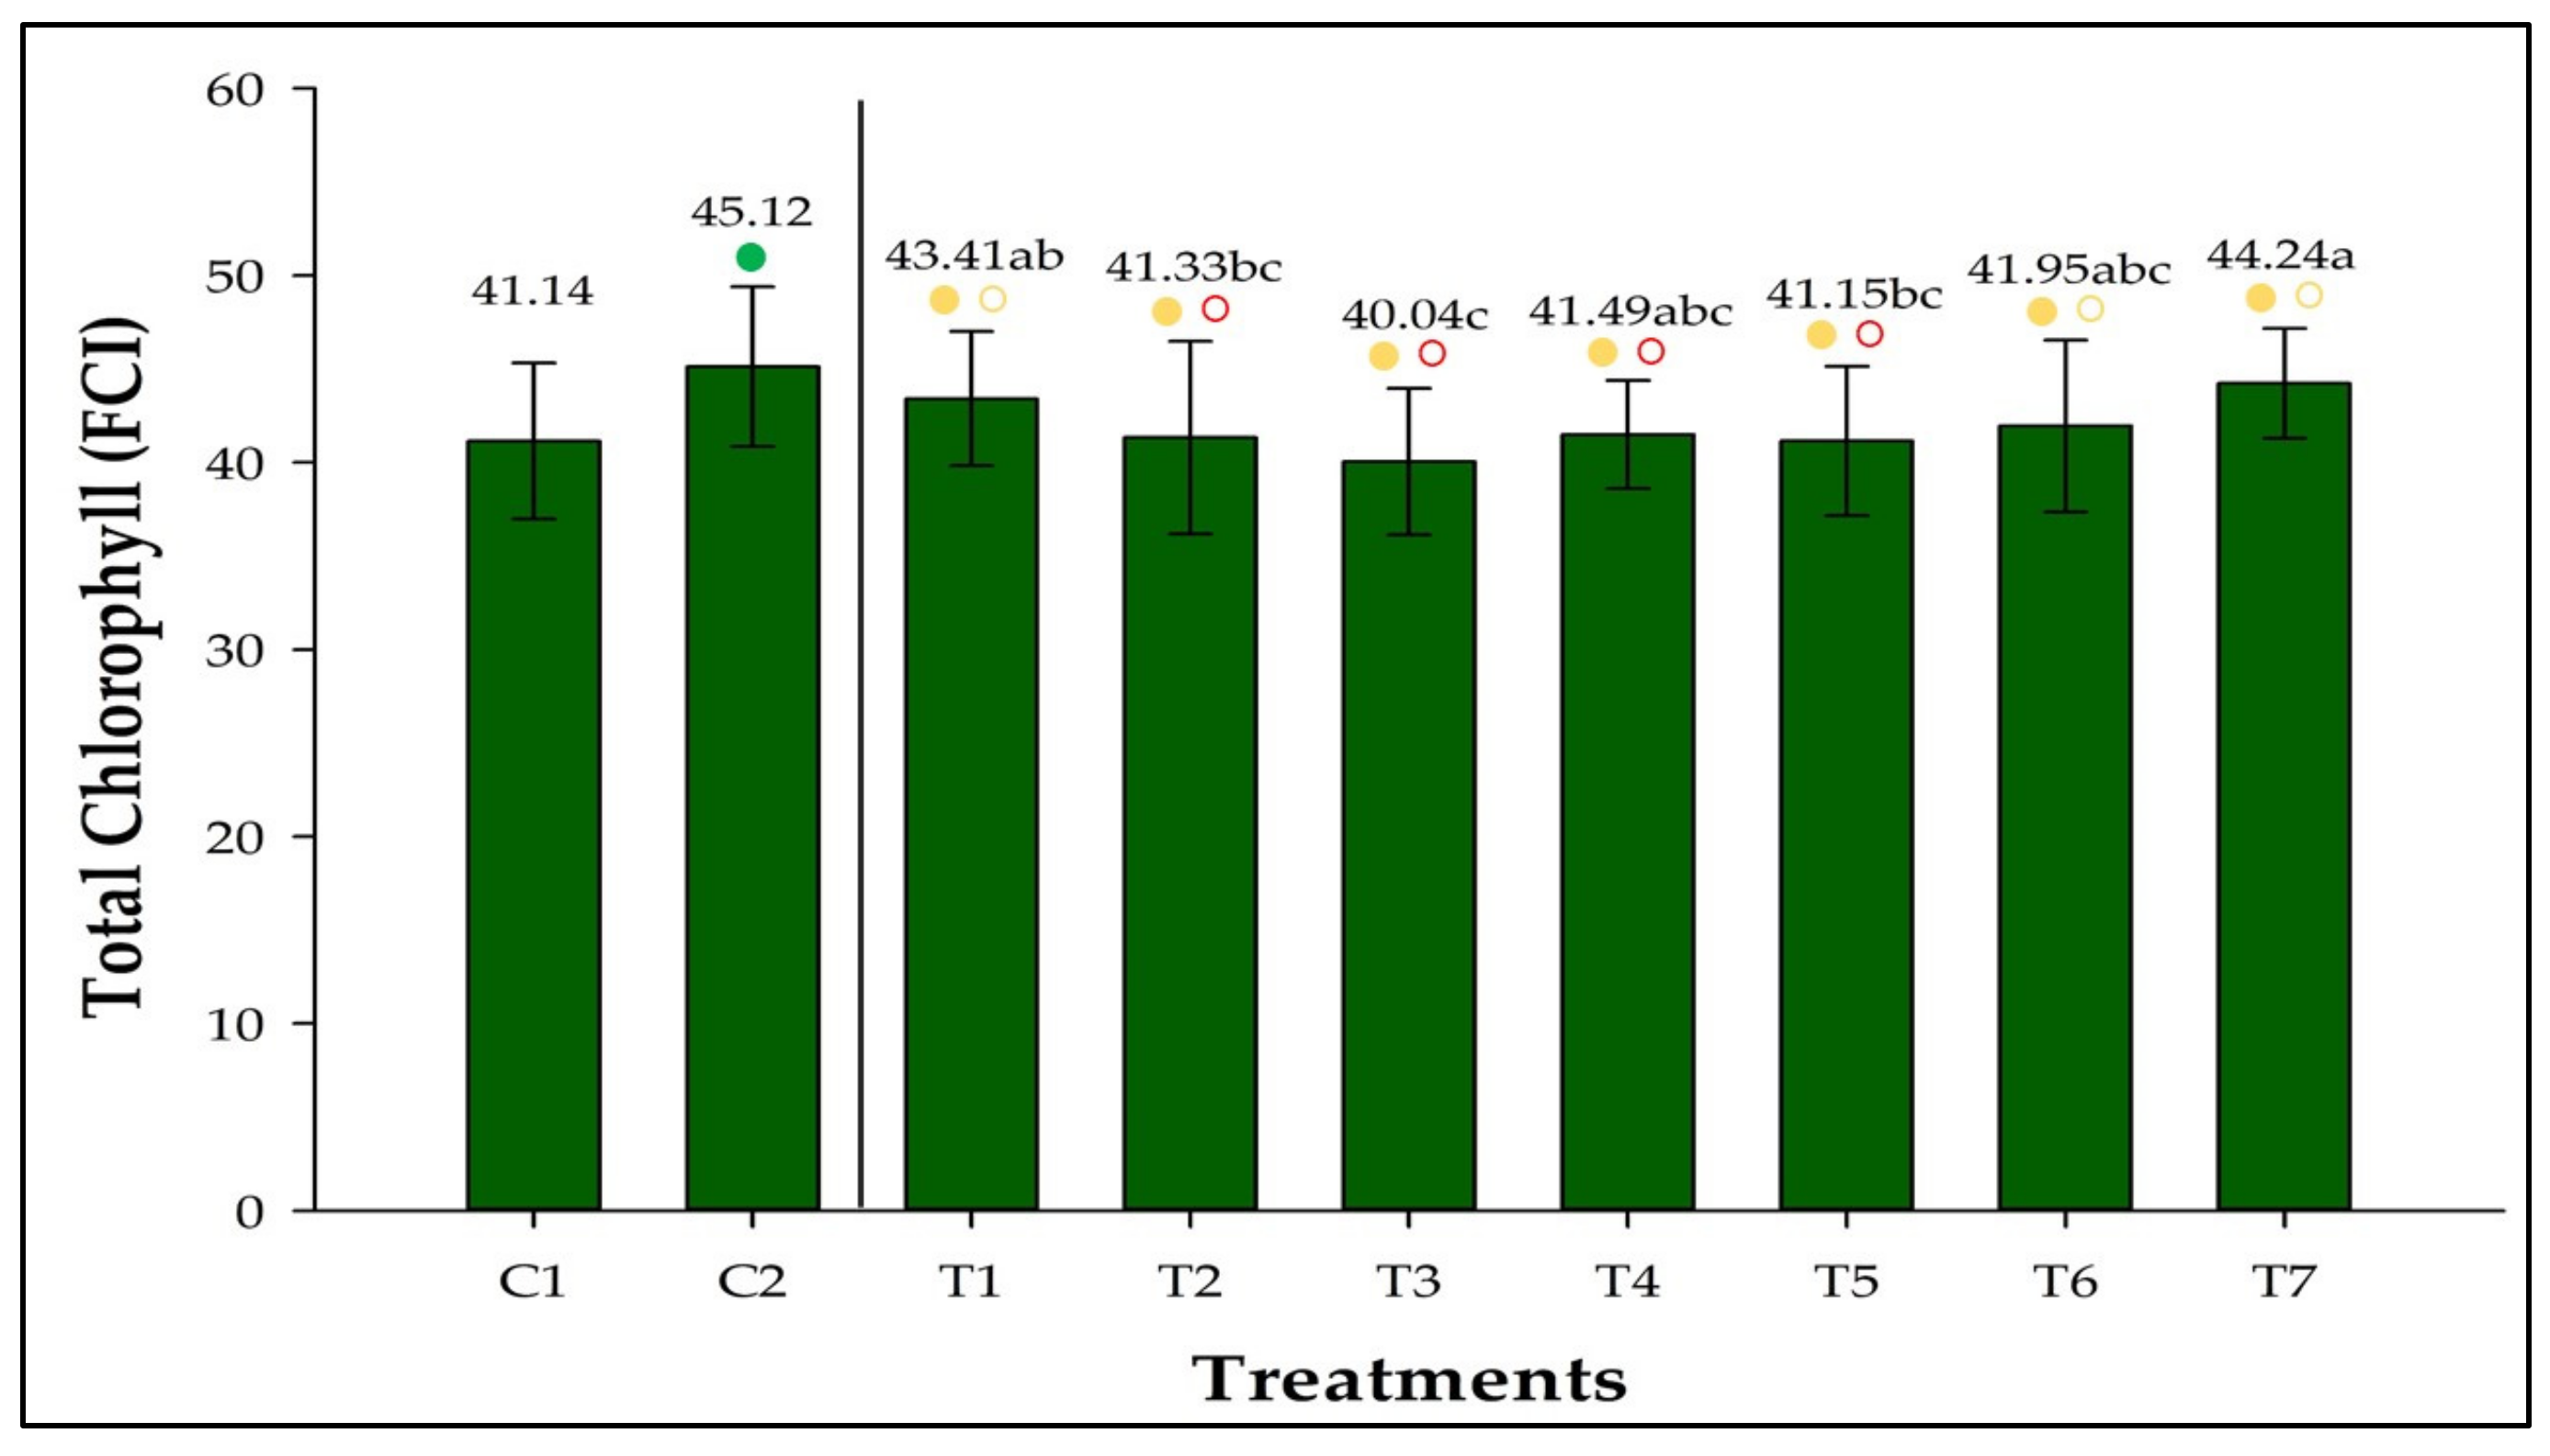
3.3. Total Chlorophyll
3.4. Concentration of Leaf Nutrients
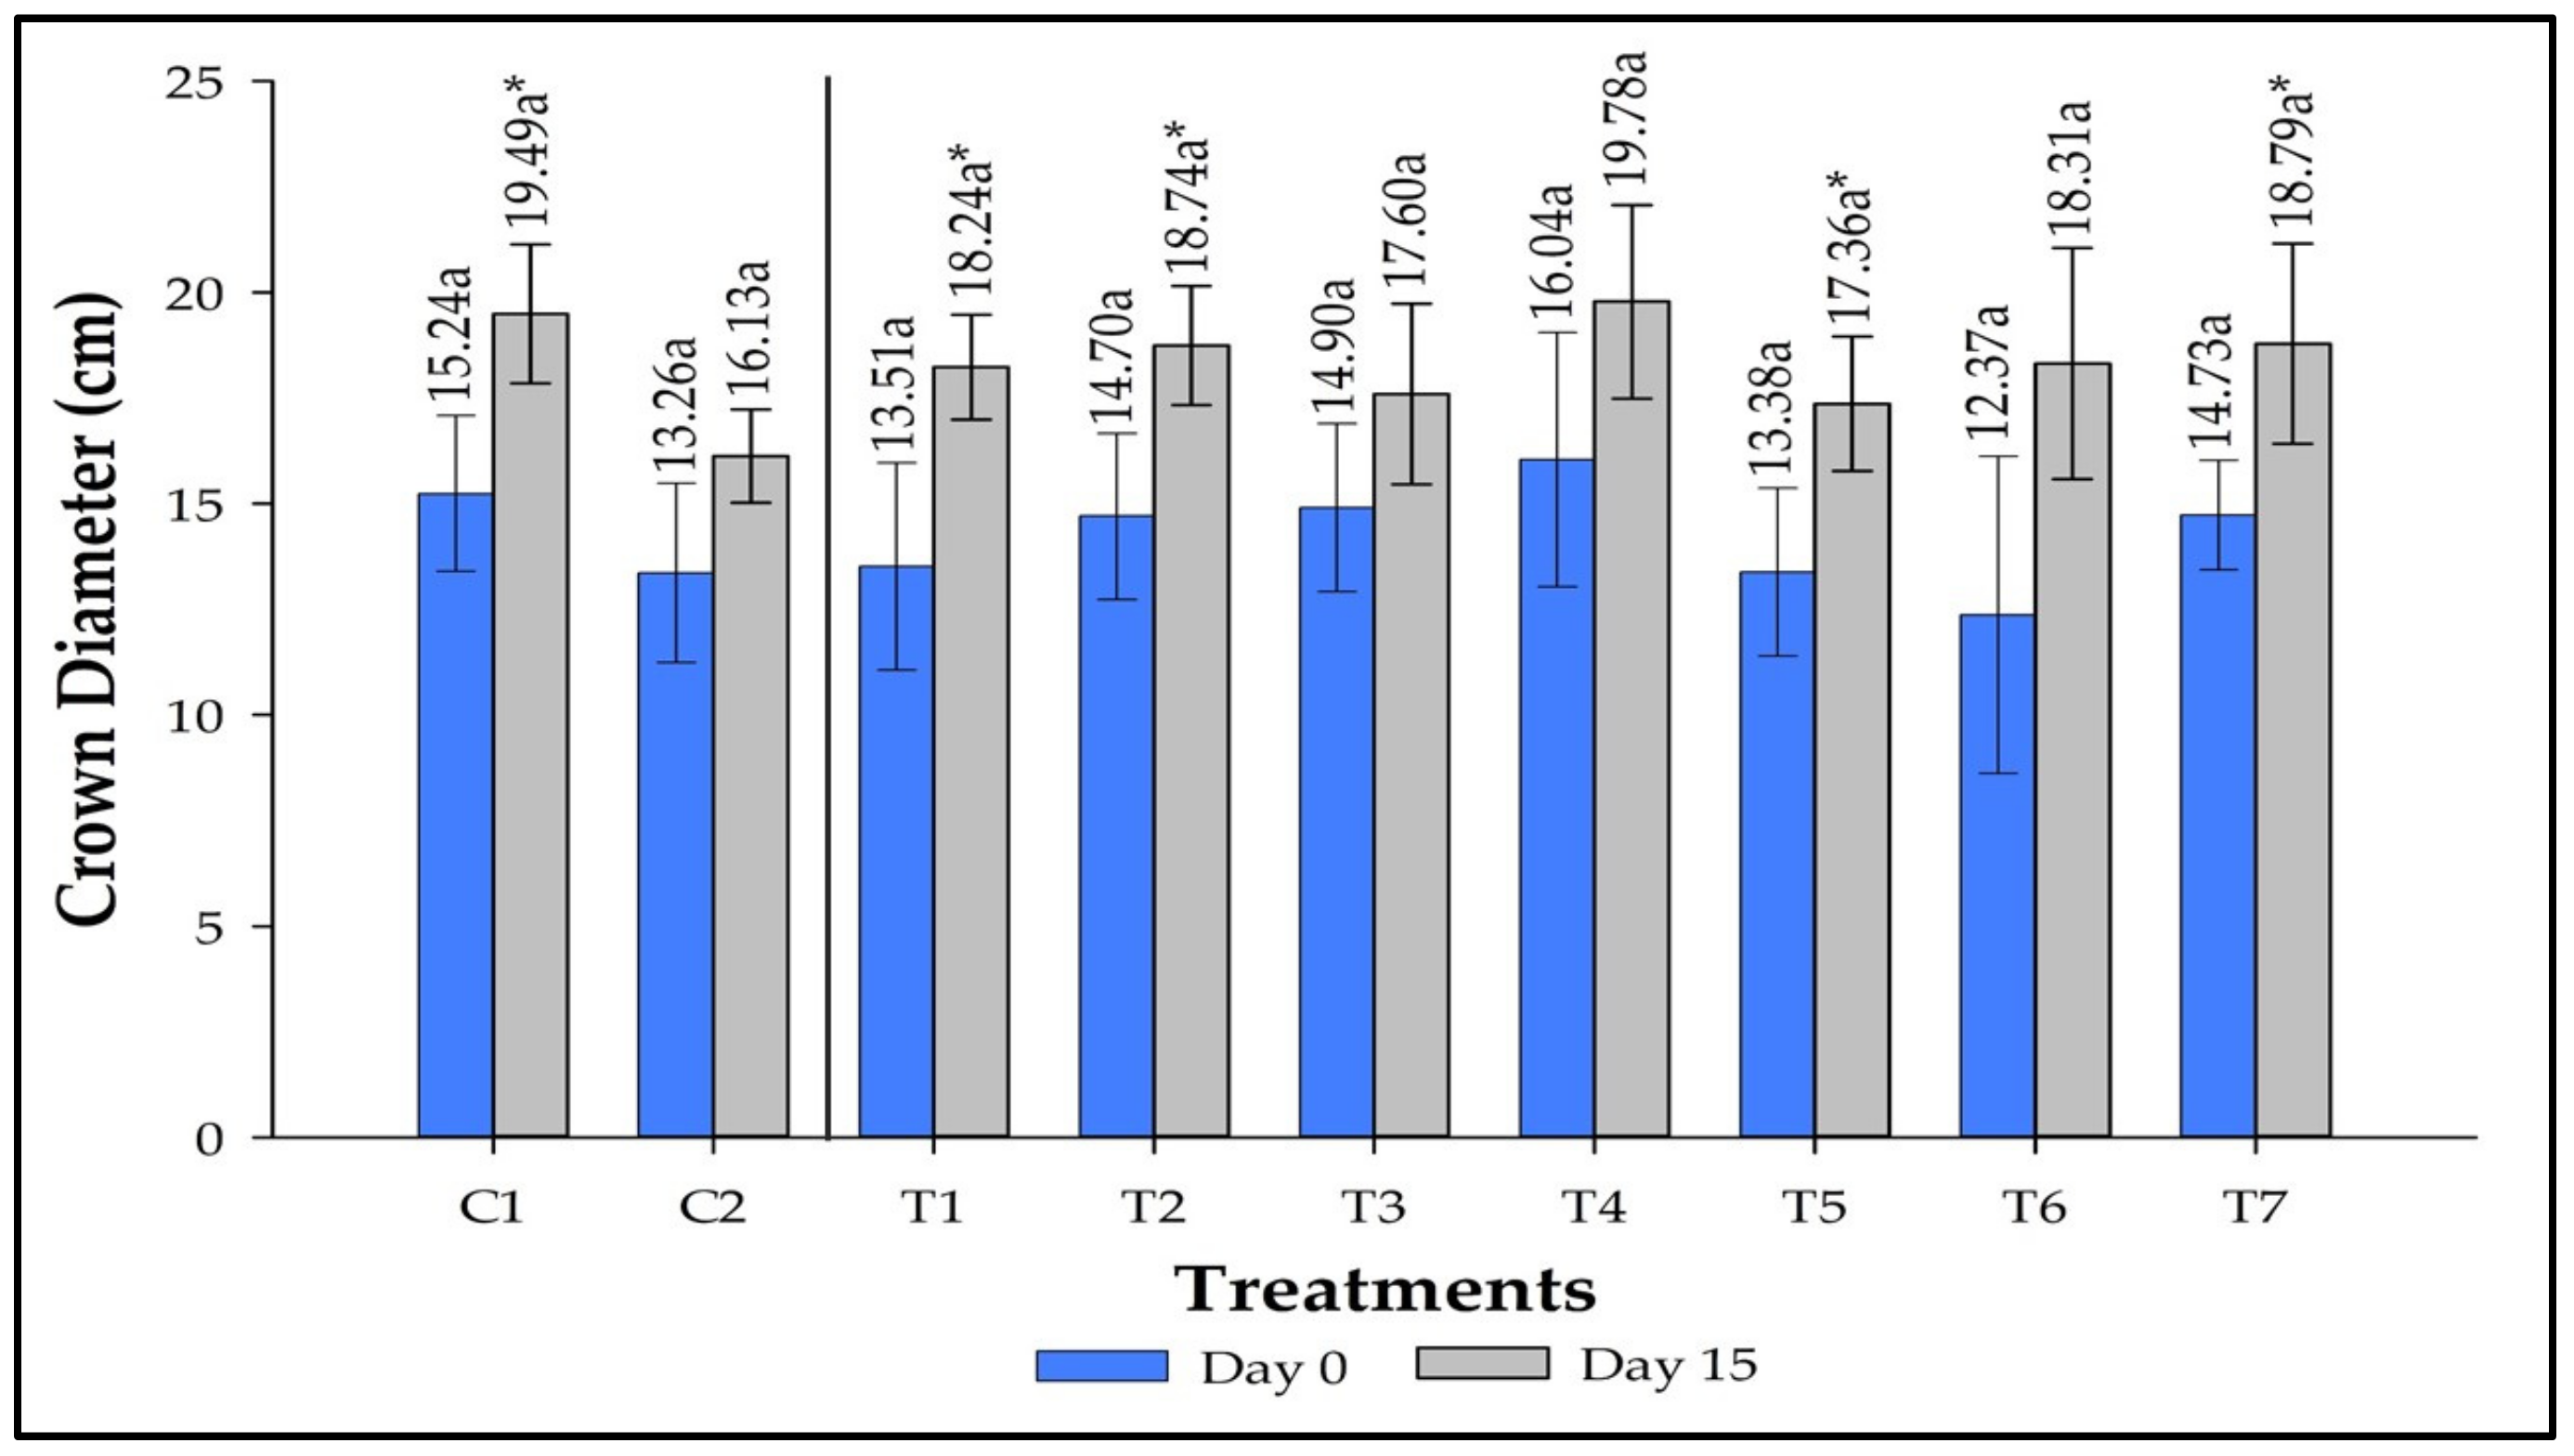
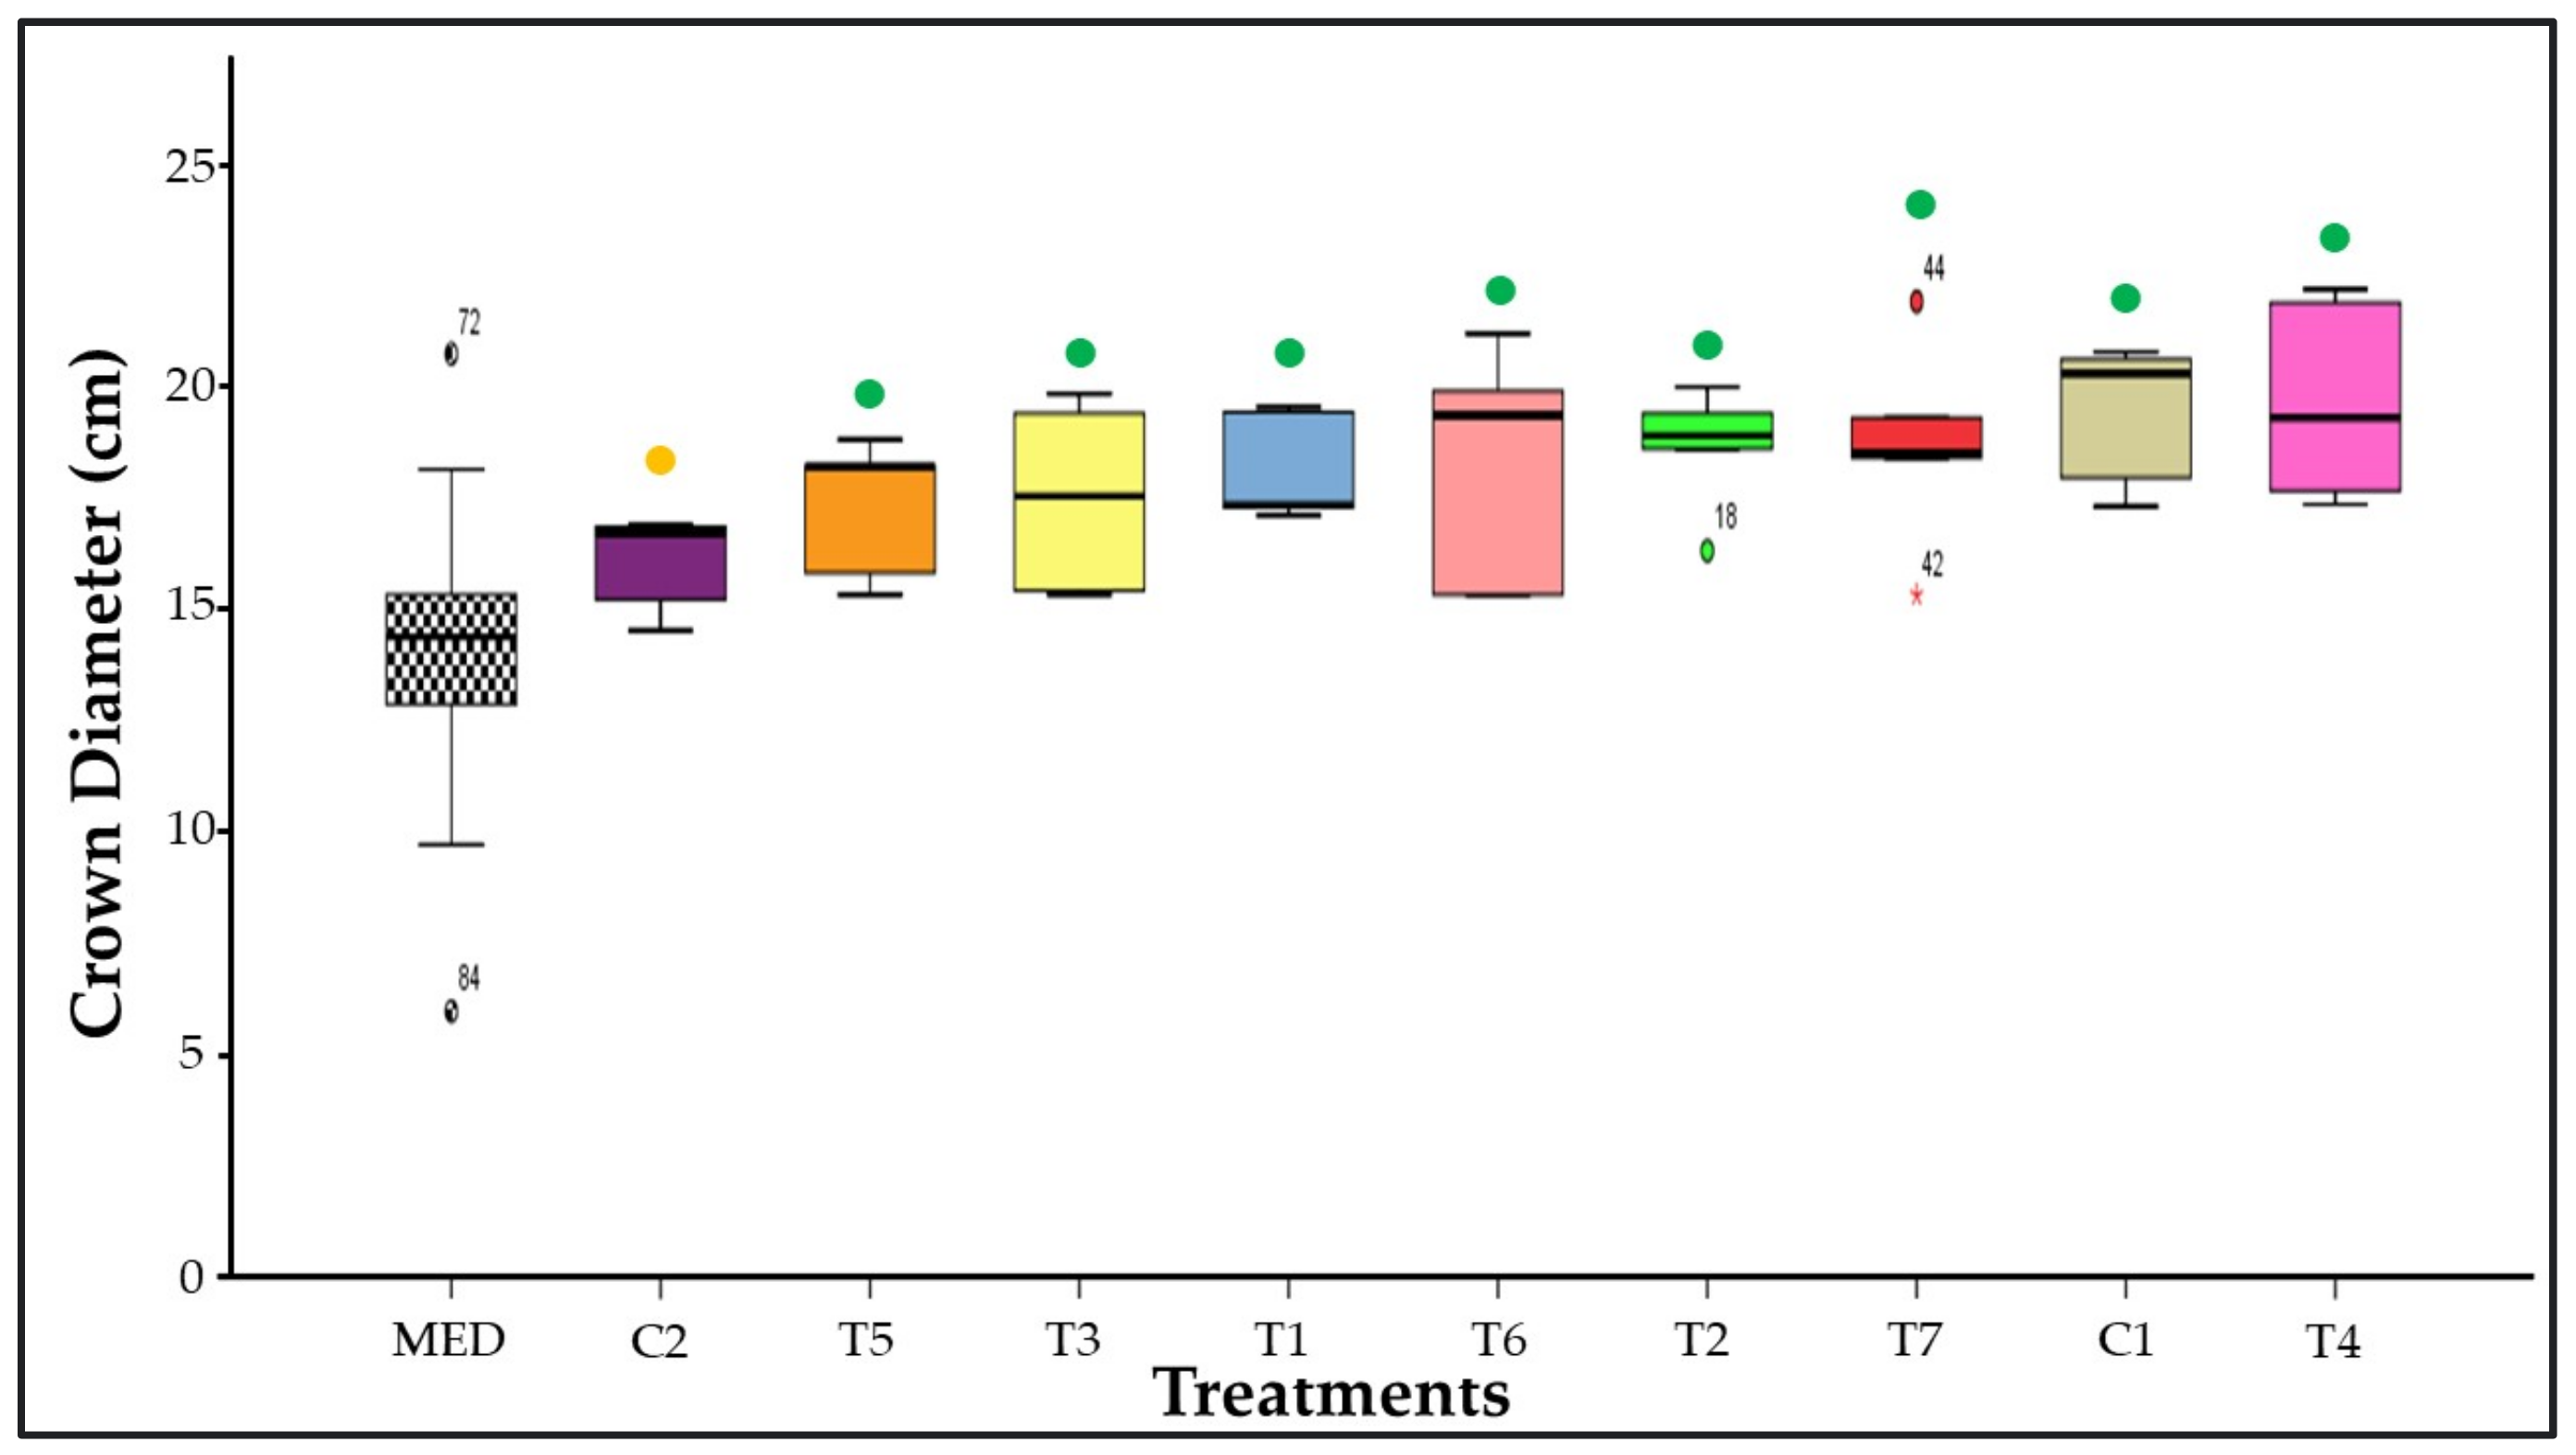
3.5. Crown Diameter Measurement
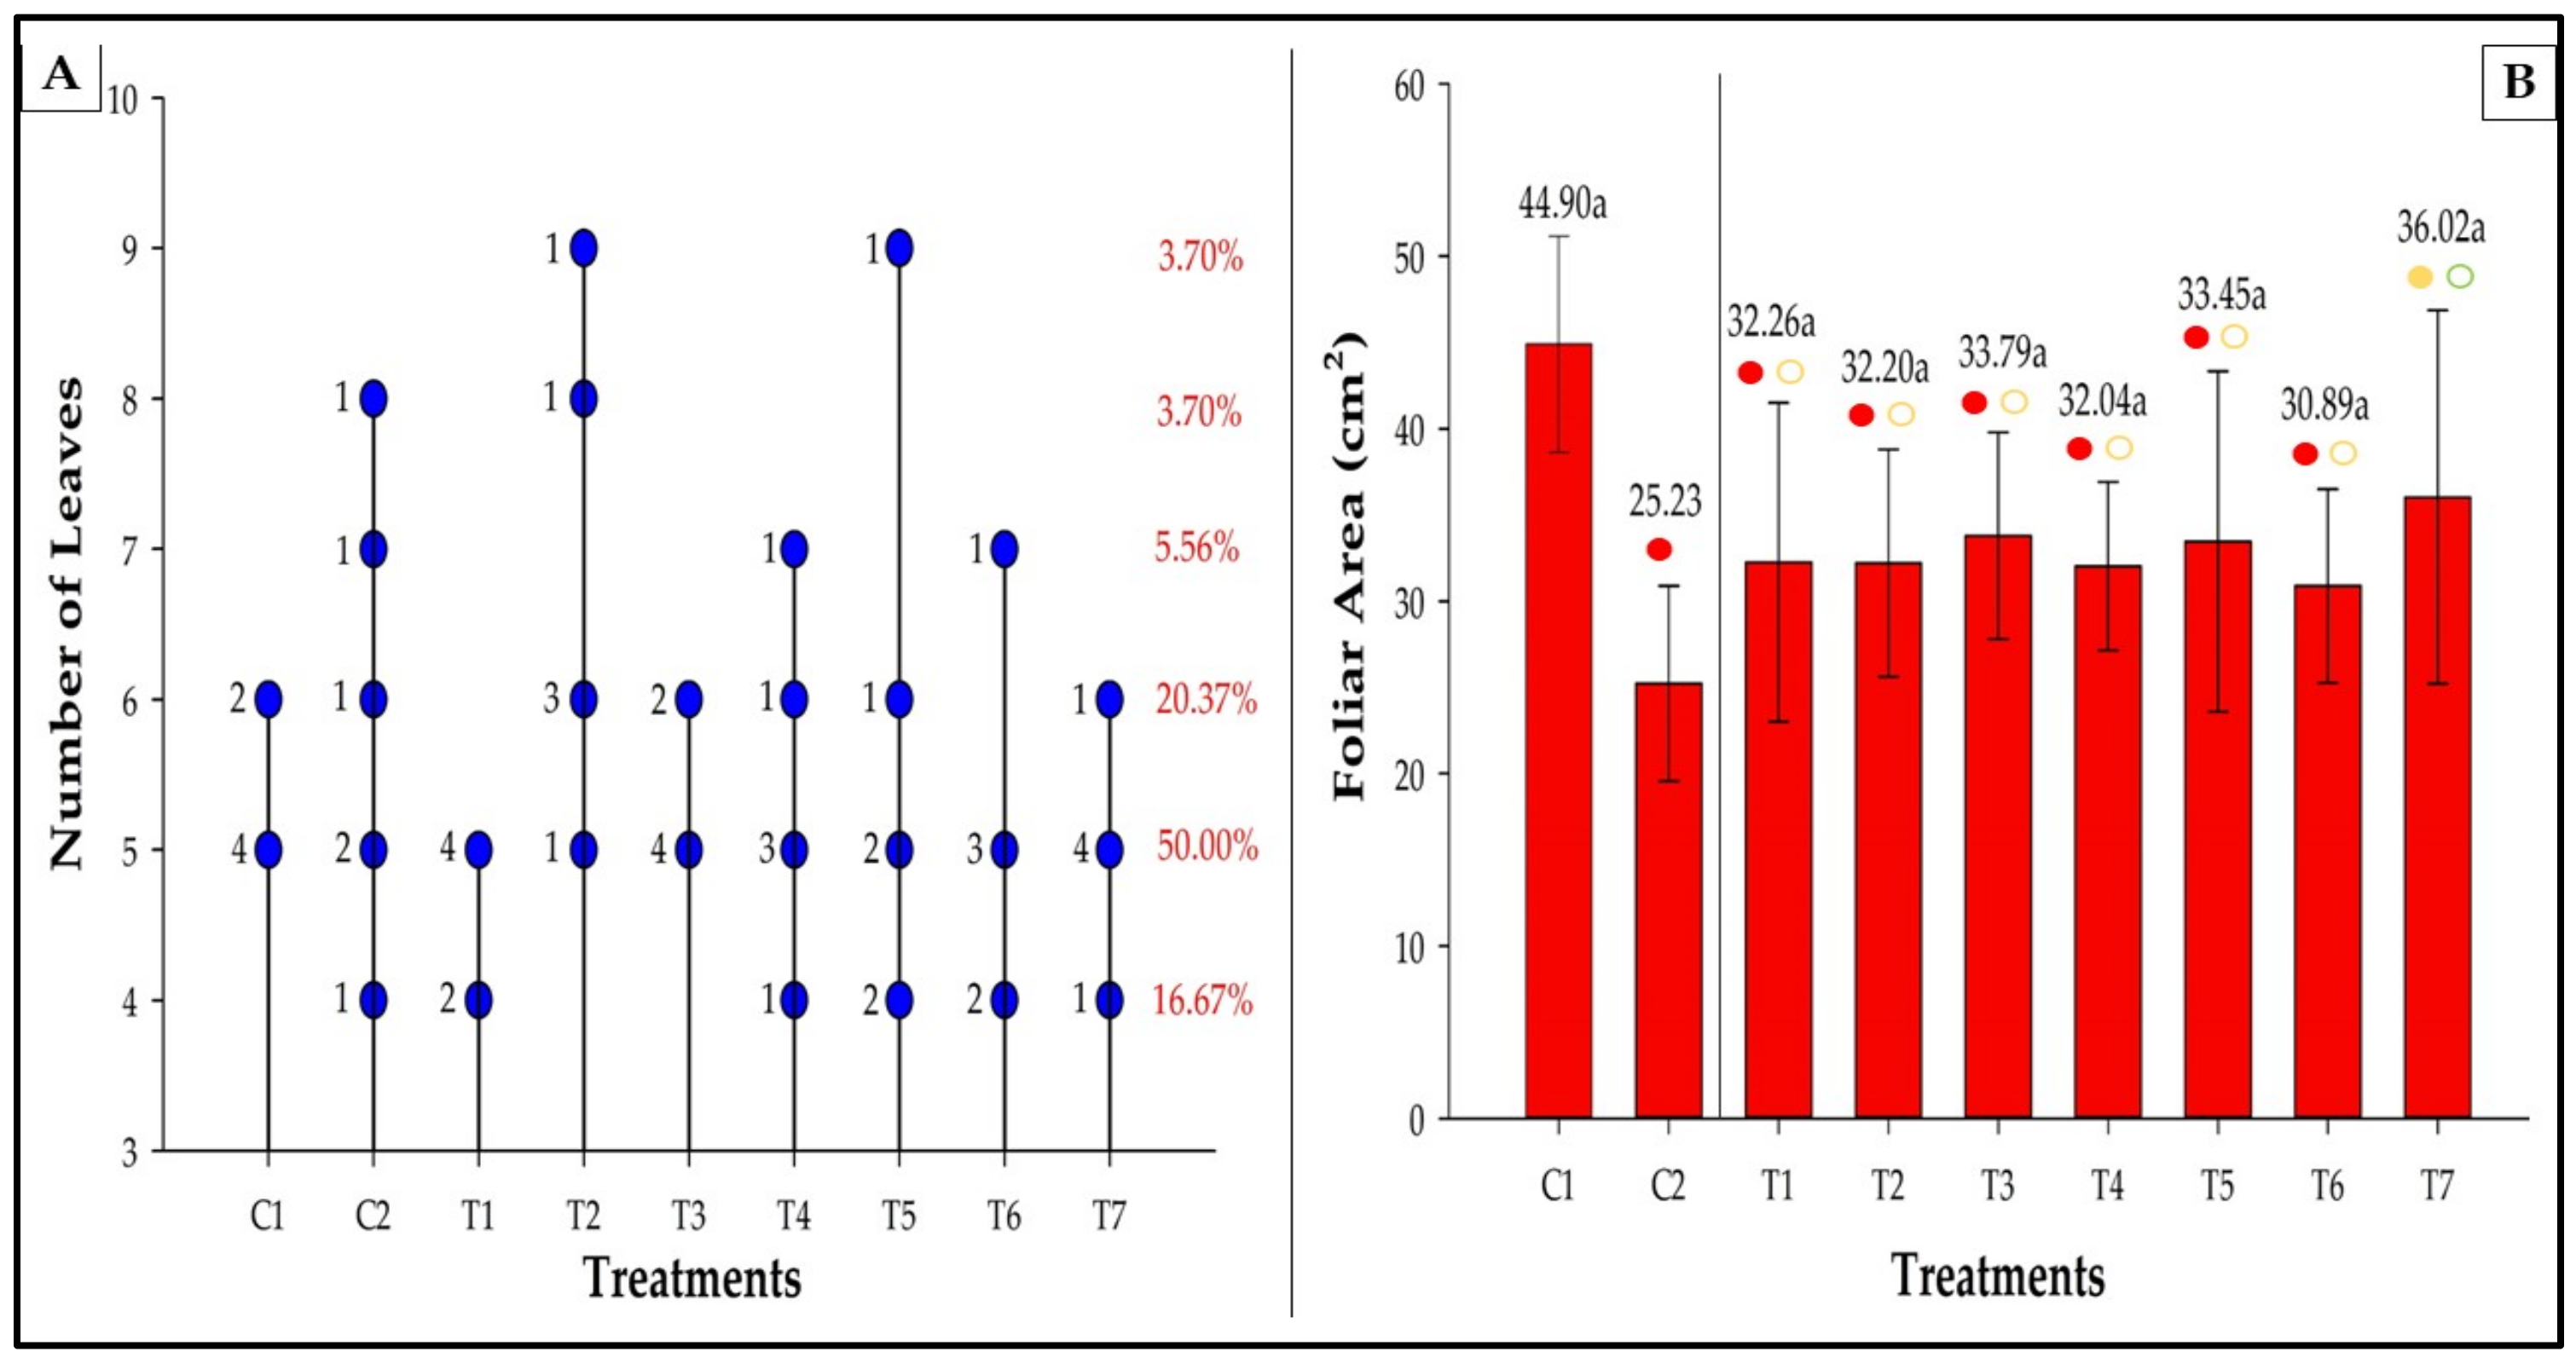
3.6. Number of Leaves and Leaf Area
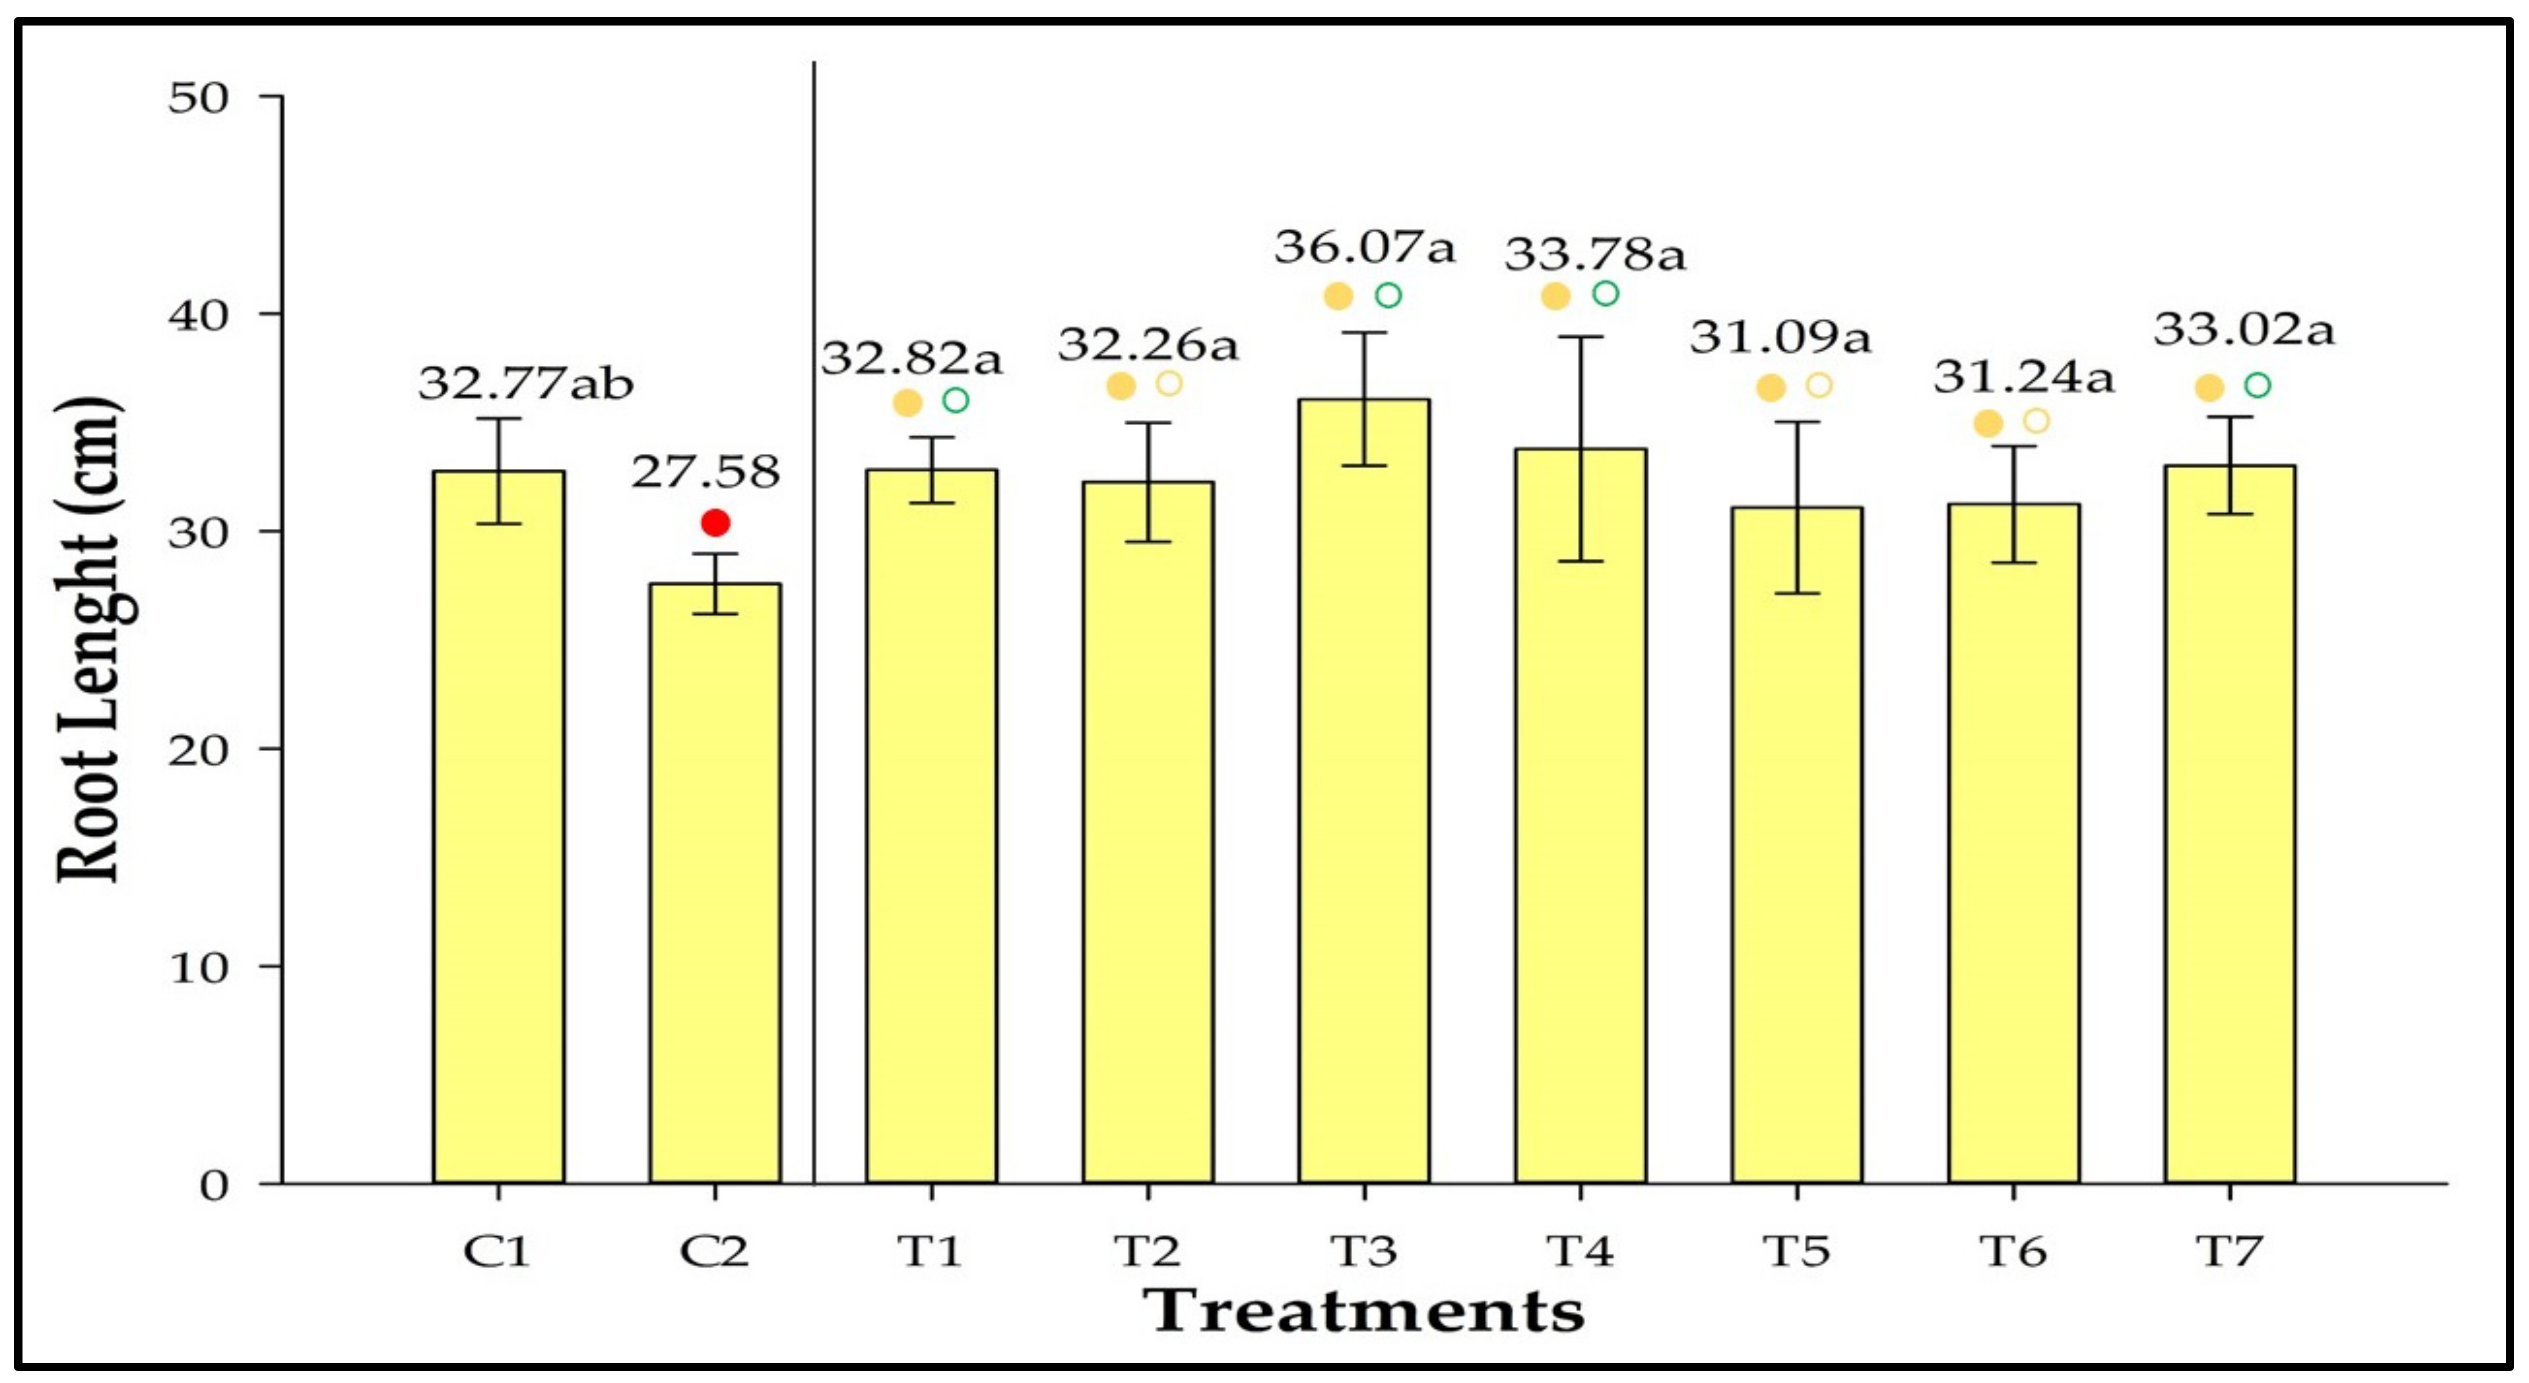
3.7. Root Length
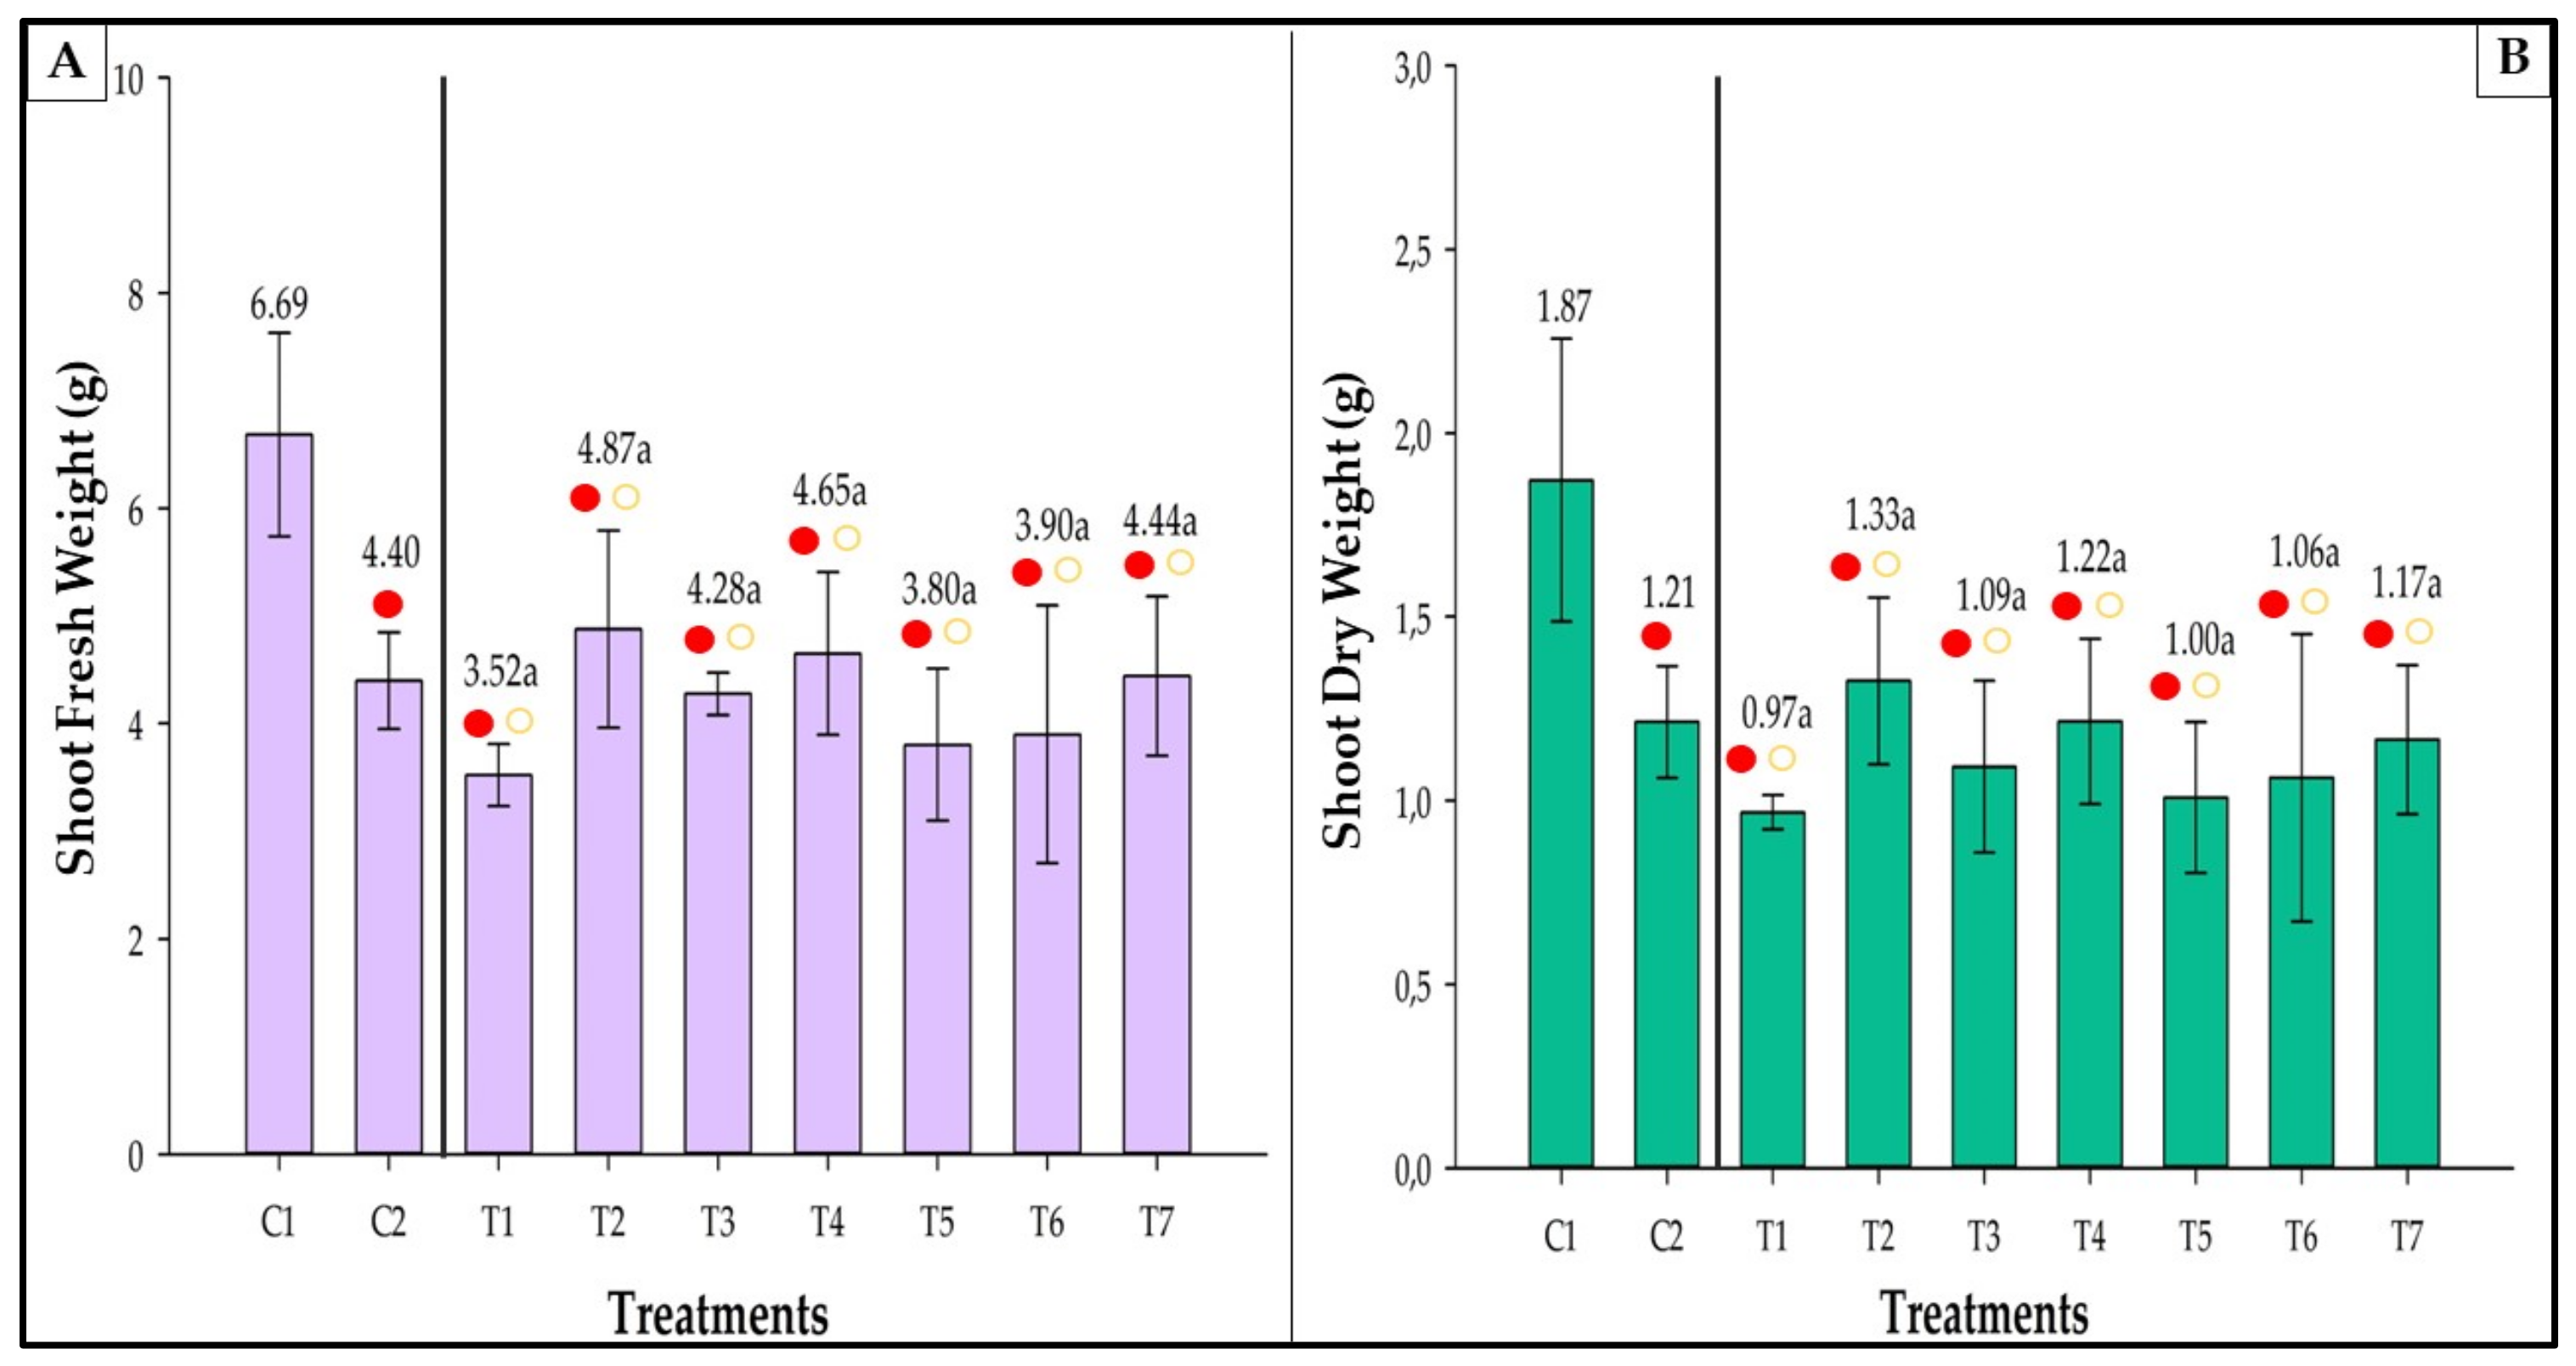
3.8. Fresh and Dry Weight
3.8.1. Shoot
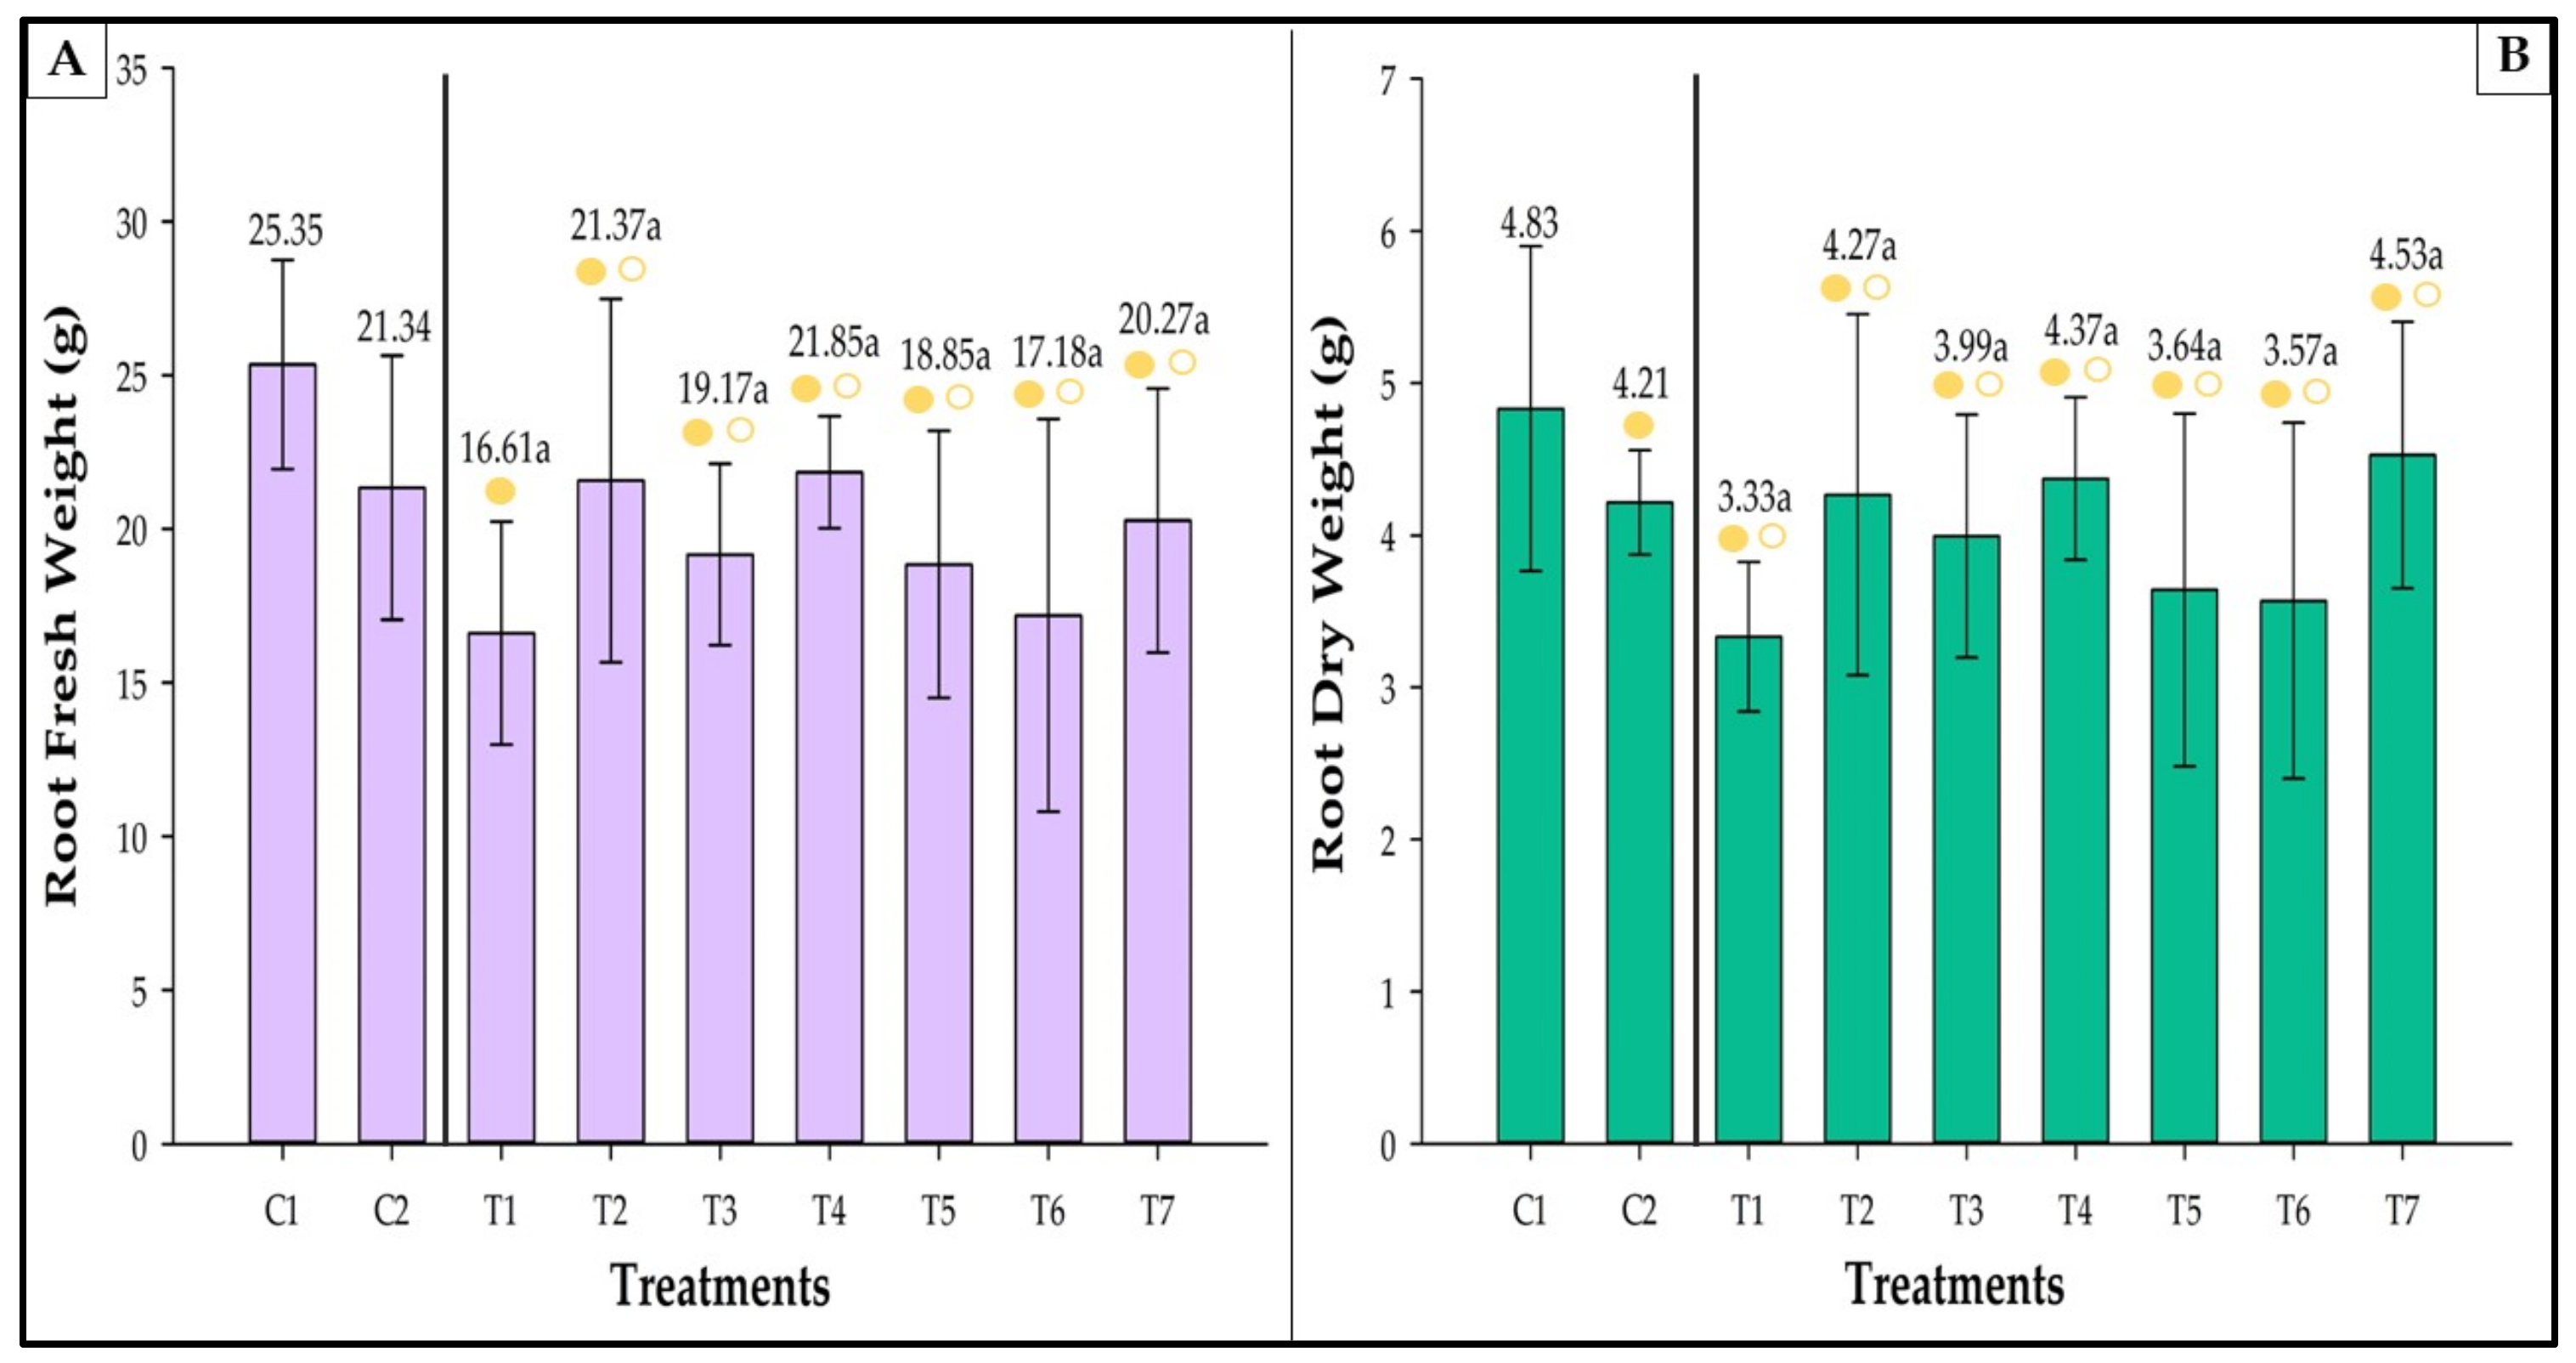
3.8.2. Root
3.8.3. Total Weight
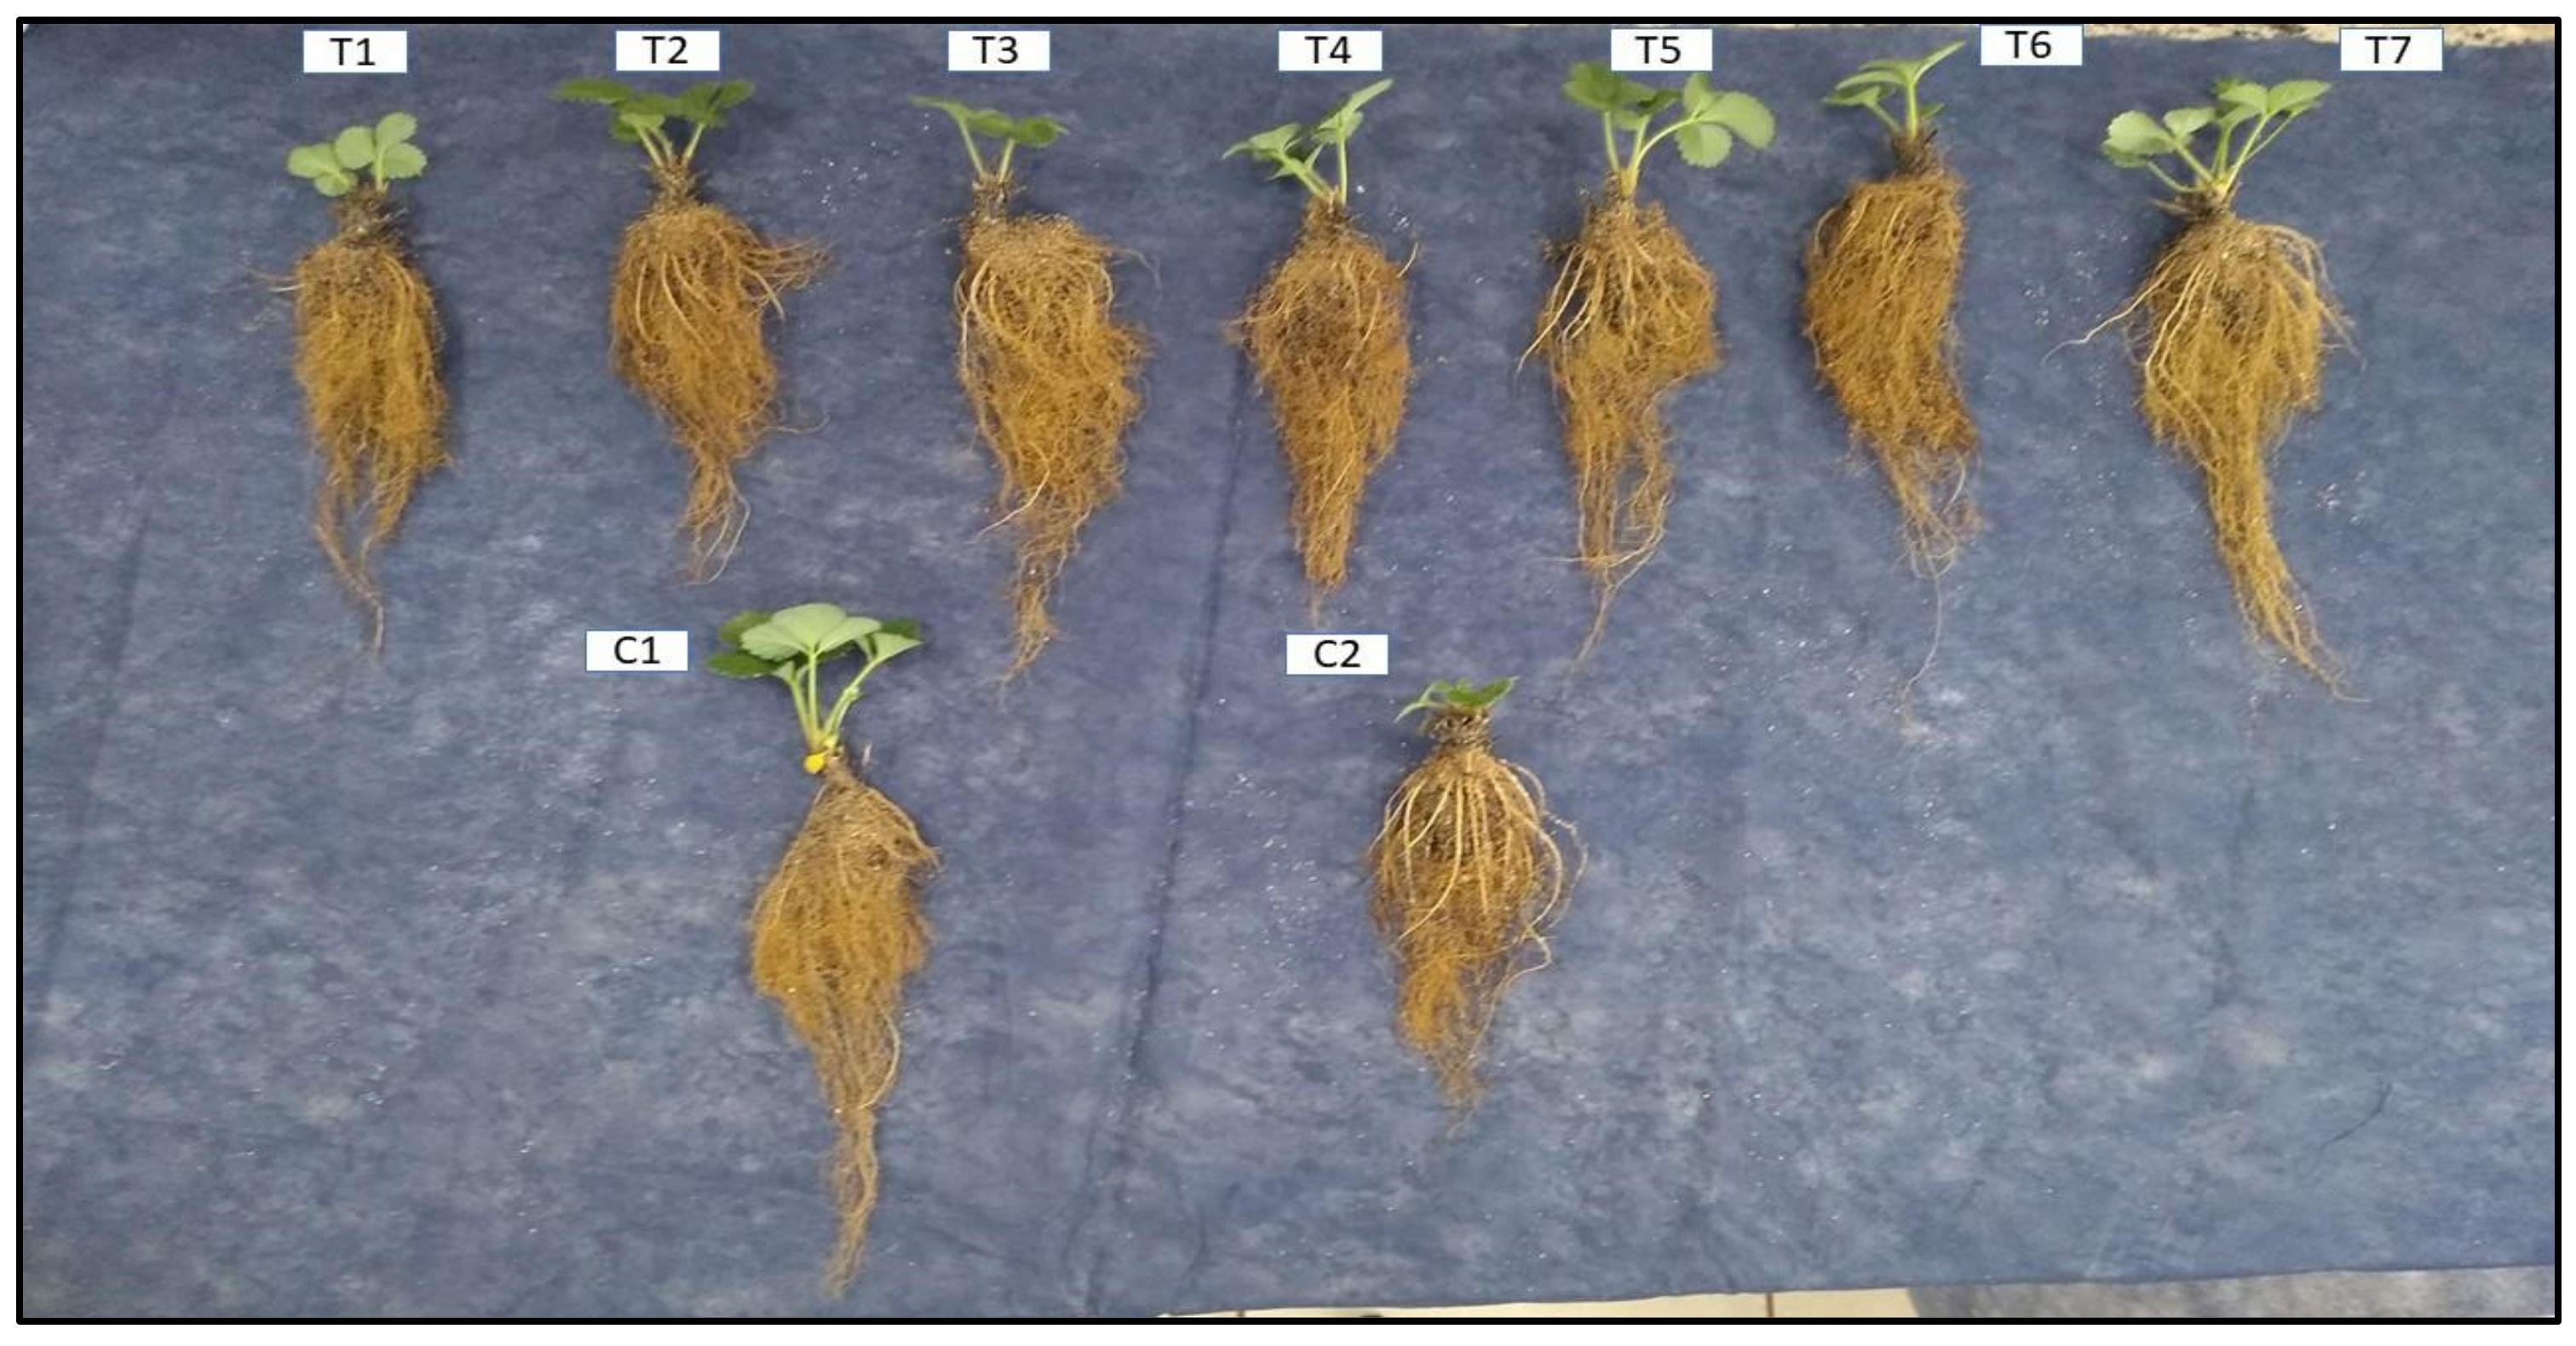
3.9. Morphology of Seedling Growth
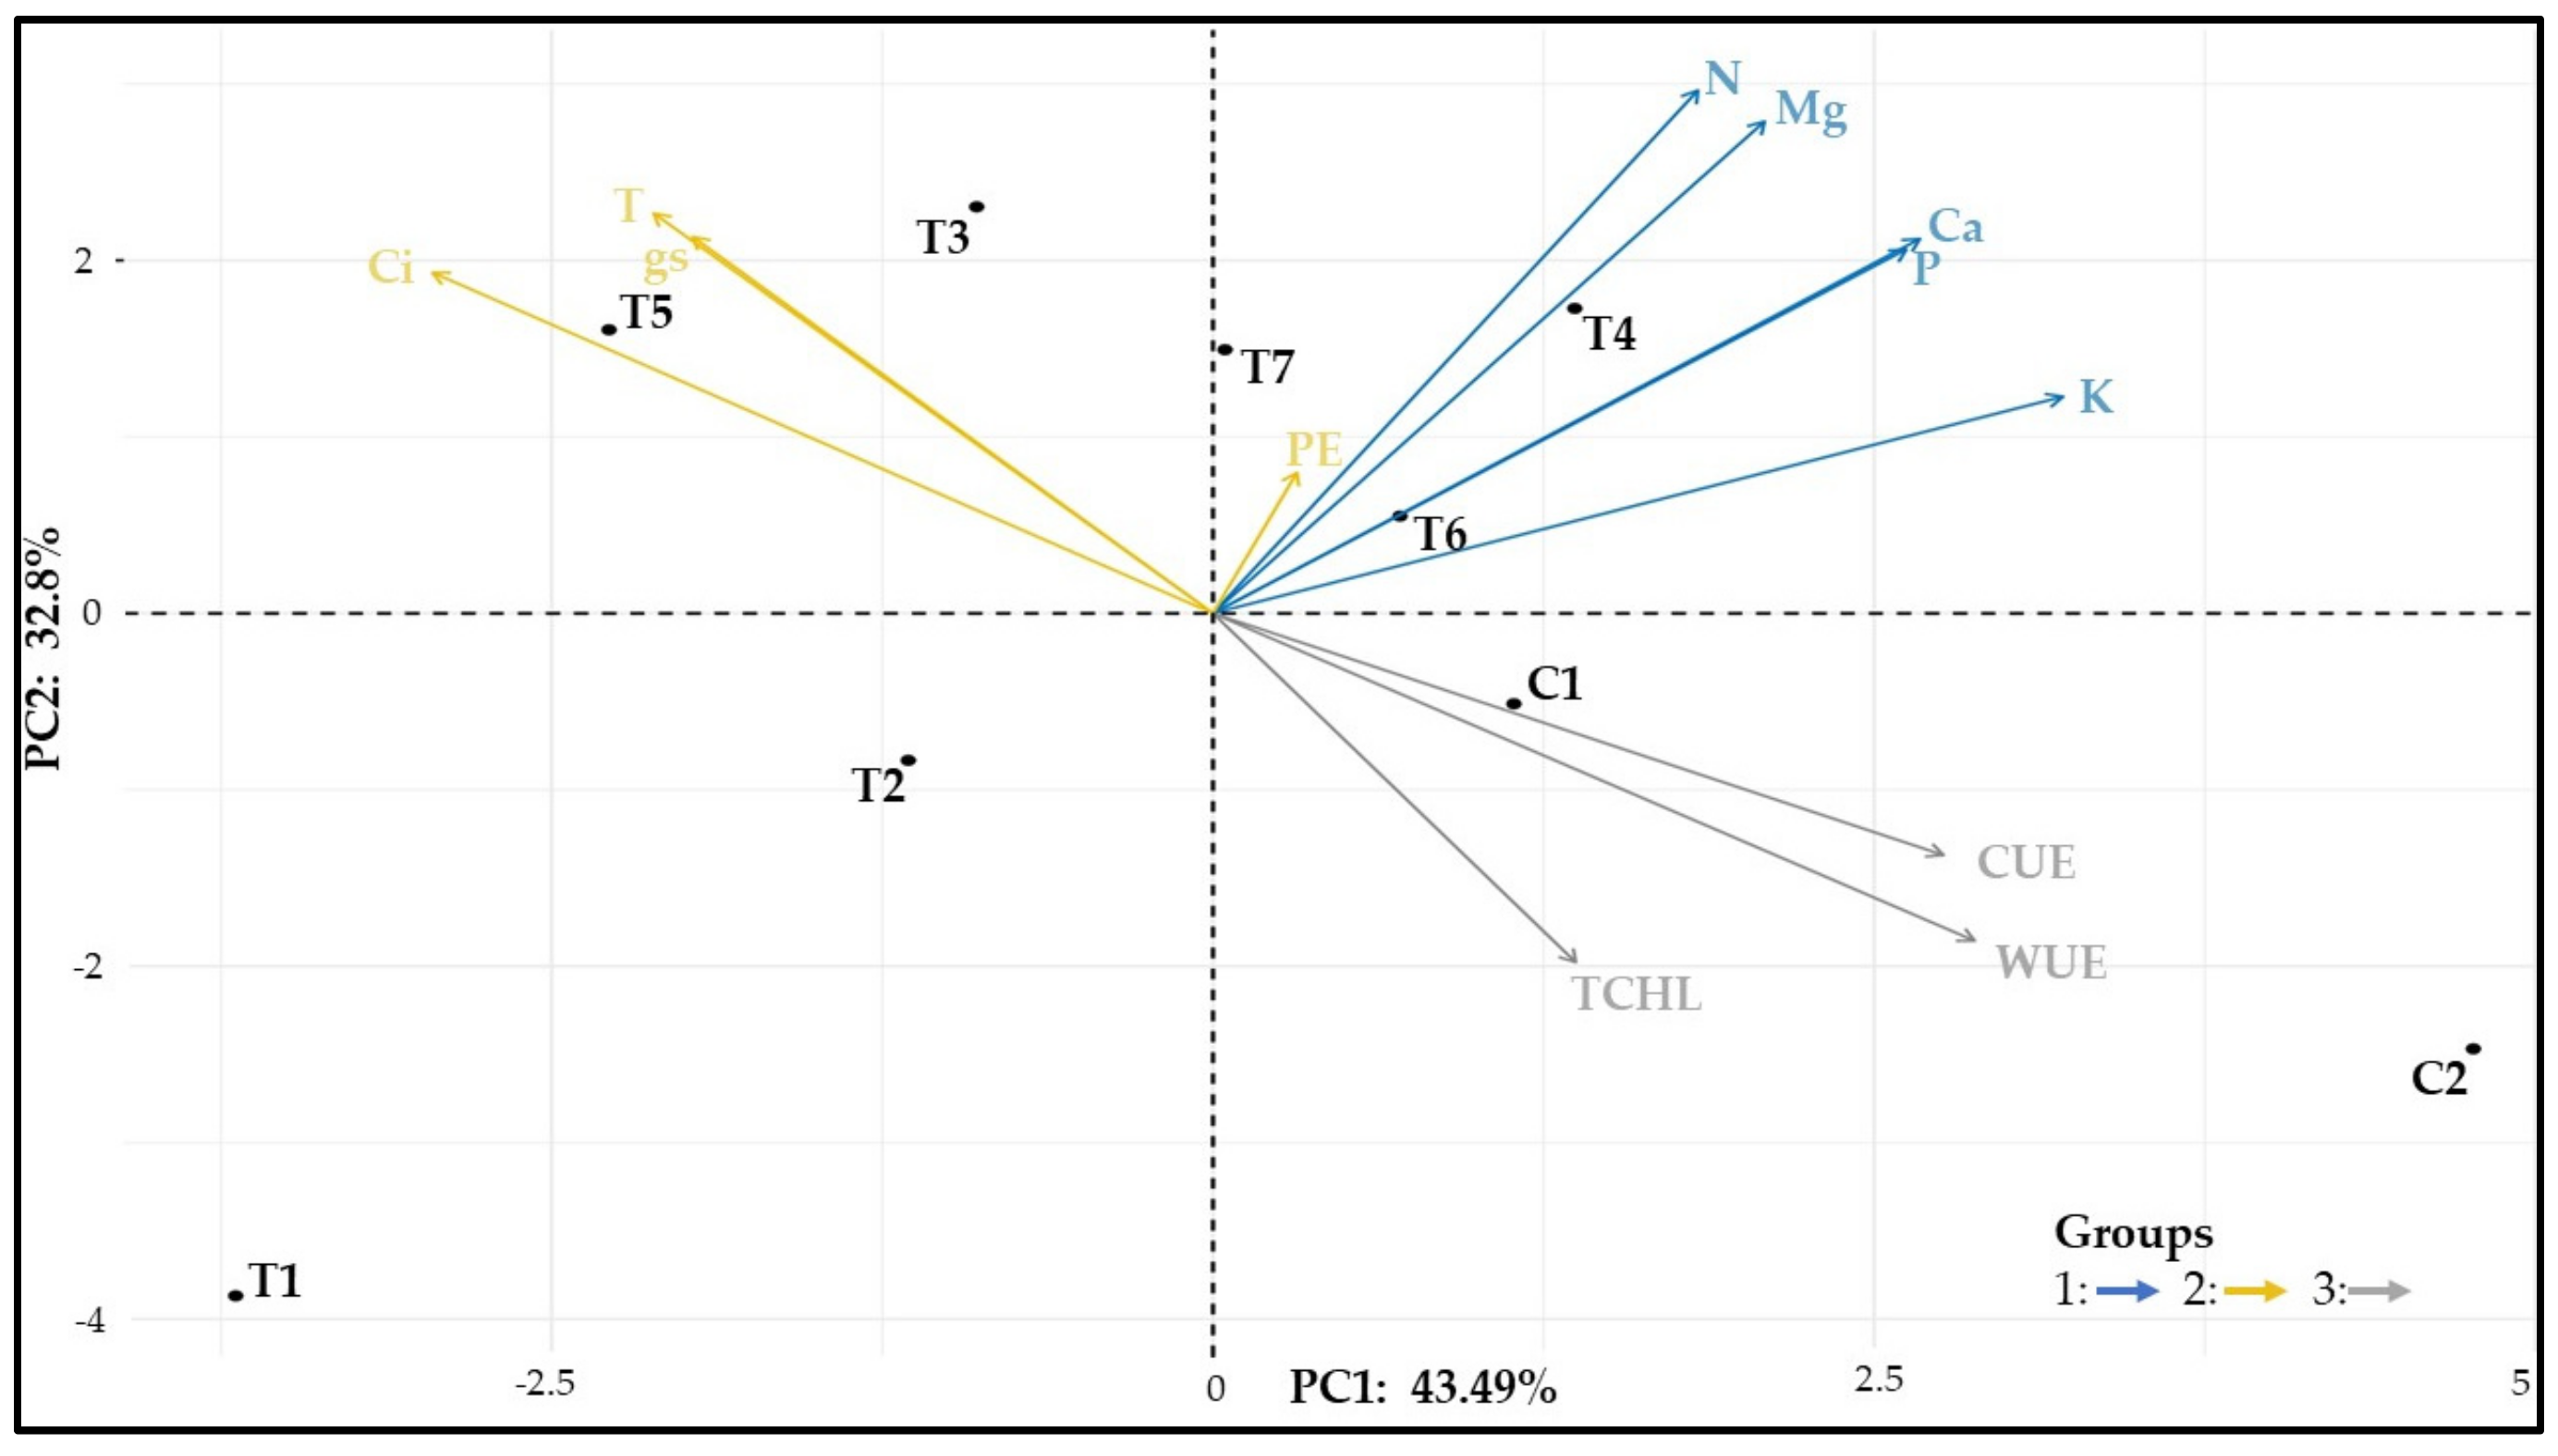
3.10. Correlations between Vegetative Data
3.11. Correlations among the Physiological Data
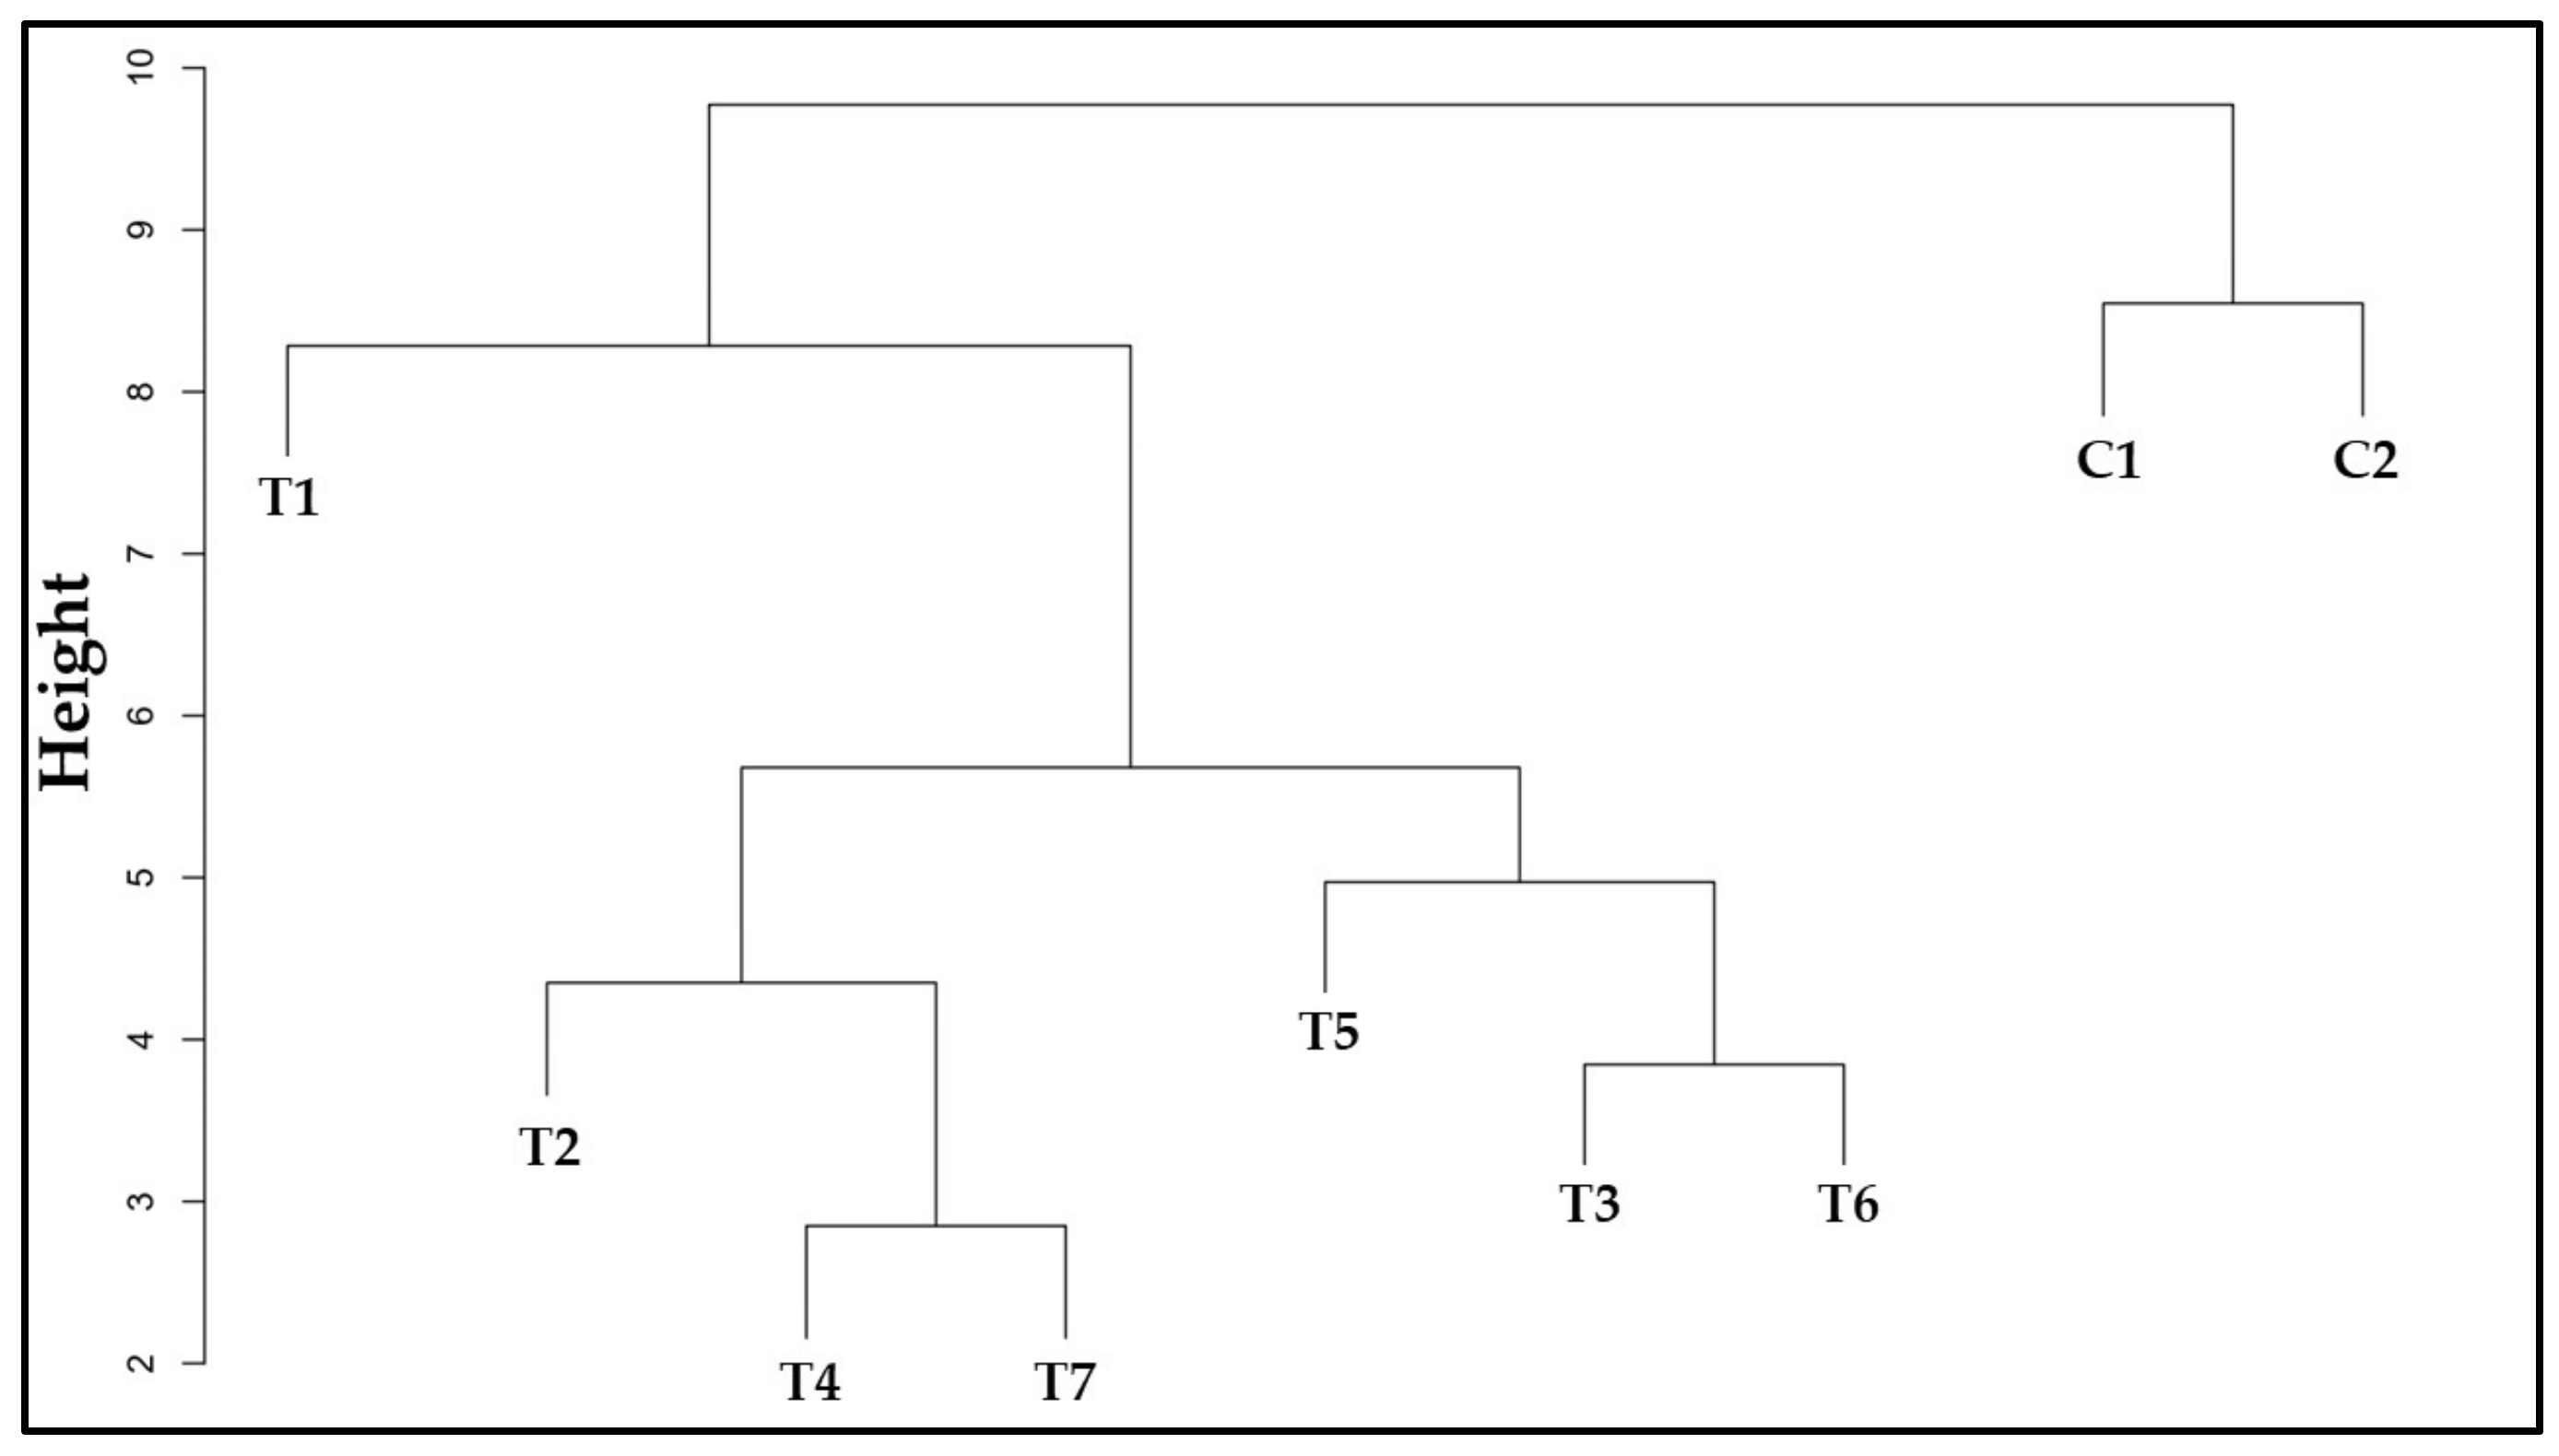
3.12. Similarity among Treatments
4. Discussion
4.1. Growth-Promoting Aspects of the Bacteria
4.2. The Impacts of Microorganisms on Strawberry Physiology
4.3. Strawberry Growth Promotion
5. Conclusions
Author Contributions
Funding
Data Availability Statement
Acknowledgments
Conflicts of Interest
References
- Ramankutty, N.; Mehrabi, Z.; Waha, K.; Jarvis, L.; Kremen, C.; Herrero, M.; Rieseberg, L.H. Trends in Global Agricultural Land Use: Implications for Environmental Health and Food Security. Annu. Rev. Plant Biol. 2018, 69, 789–815. [Google Scholar] [CrossRef] [PubMed] [Green Version]
- Alexandratos, N.; Bruinsma, J. World Agriculture towards 2030/2050: The 2012 Revision; ESA Working Papers 12-03; Food and Agriculture Organization of the United Nations (FAO): Rome, Italy, 2012. [Google Scholar]
- Fernández-Lara, R.; Gordillo, B.; Rodríguez-Pulido, F.J.; Lourdes González-Miret, M.; Del Villar-Martínez, A.A.; Dávila-Ortiz, G.; Heredia, F.J. Assessment of the differences in the phenolic composition and color characteristics of new strawberry (Fragaria x ananassa Duch.) cultivars by HPLC-MS and Imaging Tristimulus Colorimetry. Food Res. Int. 2015, 76, 645–653. [Google Scholar] [CrossRef] [PubMed] [Green Version]
- Pinheiro, D.F.; Resende, J.T.V.; Constantino, L.V.; Hata, F.T.; Hata, N.N.Y.; Lustosa, S.B.C. Physical, biochemical, and sensory properties of strawberries grown in high-altitude tropical climate. Ciênc. Agrotec. 2021, 45, e008221. [Google Scholar] [CrossRef]
- Food and Agriculture Organization of the United Nations—FAOSTAT. Production Quantities of Strawberries by Country 2020. Available online: https://www.fao.org/faostat/en/#data/QCL/visualize (accessed on 22 August 2022).
- Pahalvi, H.N.; Rafiya, L.; Rashid, S.; Nisar, B.; Kamili, A.N. Chemical Fertilizers and Their Impact on Soil Health. In Microbiota and Biofertilizers; Dar, G.H., Bhat, R.A., Mehmood, M.A., Hakeem, K.R., Eds.; Springer: New York, NY, USA, 2021; Volume 2, pp. 1–20. [Google Scholar] [CrossRef]
- Pignati, W. Uso de agrotóxicos no brasil: Perspectiva da saúde do trabalhador e ambiental. Rev. Bras. Med. Trab. 2018, 16, 37. [Google Scholar] [CrossRef]
- Srivastava, P.K.; Singh, V.P.; Singh, A.; Singh, S.; Prasad, S.M. Pesticides in Crop Production, 1st ed.; John Wiley & Sons Inc.: Hoboken, NJ, USA, 2020; pp. 55–63. [Google Scholar]
- Lin, W.; Lin, M.; Zhou, H.; Wu, H.; Li, Z.; Lin, W. The effects of chemical and organic fertilizer usage on rhizosphere soil in tea orchards. PLoS ONE 2019, 14, e0217018. [Google Scholar] [CrossRef] [PubMed]
- Walan, P.; Davidsson, S.; Johansson, S.; Höök, M. Phosphate rock production and depletion: Regional disaggregated modeling and global implications. Resour. Conserv. Recycl. 2014, 93, 178–187. [Google Scholar] [CrossRef] [Green Version]
- Vaccari, D.A.; Powers, S.M.; Liu, X. A demand-driven model for global phosphate rock suggests paths for phosphorus sustainability. Environ. Sci. Technol. 2019, 53, 10417–10425. [Google Scholar] [CrossRef] [PubMed]
- Franche, C.; Lindström, K.; Elmerich, C. Nitrogen-fixing bacteria associated with leguminous and non-leguminous plants. Plant Soil 2009, 321, 35–59. [Google Scholar] [CrossRef]
- Billah, M.; Khan, M.; Bano, A.; Hassan, T.U.; Munir, A.; Gurmani, A.R. Phosphorus and phosphate solubilizing bacteria: Keys for sustainable agriculture. Geomicrobiol. J. 2019, 36, 904–916. [Google Scholar] [CrossRef]
- Asghar, H.; Zahir, Z.A.; Arshad, M.; Khaliq, A. Relationship between in vitro production of auxins by rhizobacteria and their growth-promoting activities in Brassica juncea L. Biol. Fert. Soils 2002, 35, 231–237. [Google Scholar] [CrossRef]
- Bradáčová, K.; Florea, A.; Bar-Tal, A.; Minz, D.; Yermiyahu, U.; Shawahna, R.; Poşta, G. Microbial Consortia versus Single-Strain Inoculants: An Advantage in PGPM-Assisted Tomato Production? Agronomy 2019, 9, 105. [Google Scholar] [CrossRef] [Green Version]
- Ríos-Ruiz, W.F.; Torres-Chávez, E.E.; Torres-Delgado, J.; Rojas-García, J.C.; Bedmar, E.J.; Valdez-Nuñez, R.A. Inoculation of bacterial consortium increases rice yield (Oryza sativa L.) reducing applications of nitrogen fertilizer in San Martin region, Peru. Rhizosphere 2020, 14, 100200. [Google Scholar] [CrossRef]
- Wang, J.; Li, R.; Zhang, H.; Wei, G.; Li, Z. Beneficial bacteria activate nutrients and promote wheat growth under conditions of reduced fertilizer application. BMC Microbiol. 2020, 20, 38. [Google Scholar] [CrossRef] [PubMed] [Green Version]
- Lovaisa, N.C.; Guerrero-Molin, M.F.; Quintana, D.P.G.A.; Salazar, S.M. Total and marketable fruit yield of strawberry plants grown under different levels of nitrogen fertility and inoculated with Azospirillum brasilense REC3. Rev. Agron. Noroeste Argent. 2016, 36, 43–46. [Google Scholar]
- Andrade, F.M.; Assis Pereira, T.; Souza, T.P.; Sales Guimarães, P.H.; Martins, A.D.; Schwan, R.F.; Dória, J. Beneficial effects of inoculation of growth-promoting bacteria in strawberry. Microbiol. Res. 2019, 223–225, 120–128. [Google Scholar] [CrossRef]
- Moura, G.G.D.; Barros, A.V.; Machado, F.; Martins, A.D.; Silva, C.M.; Durango, L.G.C.; Doria, J. Endophytic bacteria from strawberry plants control gray mold in fruits via production of antifungal compounds against Botrytis cinerea L. Microbiol. Res. 2021, 251, 126793. [Google Scholar] [CrossRef]
- Olanrewaju, O.S.; Babalola, O.O. Bacterial Consortium for Improved Maize (Zea mays L.) Production. Microorganisms 2019, 7, 519. [Google Scholar] [CrossRef] [Green Version]
- Nascente, A.S.; de Filippi, M.C.C.; Lanna, A.C. Biomass, gas exchange, and nutrient contents in upland rice plants affected by application forms of microorganism growth promoters. Environ. Sci. Pollut. Res. 2017, 24, 2956–2965. [Google Scholar] [CrossRef]
- Haider, F.U.; Coulter, J.A.; Cheema, S.A.; Farooq, M.; Wu, J.; Zhang, R.; Liqun, C. Co-application of biochar and microorganisms improves soybean performance and remediate cadmium-contaminated soil. Ecotoxicol. Environ. Saf. 2021, 214, 112112. [Google Scholar] [CrossRef]
- Santana, S.R.A.; Voltolini, T.V.; Antunes, G.R. Inoculation of plant growth-promoting bacteria attenuates the negative effects of drought on sorghum. Arch. Microbiol. 2020, 202, 1015–1024. [Google Scholar] [CrossRef]
- Alori, E.T.; Babalola, O.O. Microbial Inoculants for Improving Crop Quality and Human Health in Africa. Front. Microbiol. 2018, 9, 2213. [Google Scholar] [CrossRef] [Green Version]
- Sandini, I.E.F.; Pacentchuk, M.; Hungria, M.A.; Nogueira, S.P.D.; Cruz, A.S.; Nakatani, A.S.; Araujo, R.S. Seed inoculation with Pseudomonas fluorescens promotes growth, yield and reduces nitrogen application in maize. Int. J. Agric. Biol. 2019, 22, 1369–1375. [Google Scholar] [CrossRef]
- Romero-Perdomo, F.; Abril, J.; Camelo, M.; Moreno-Galván, A.; Pastrana, I.; Rojas-Tapias, D.; Bonilla, R. Azotobacter chroococcum as a potentially useful bacterial biofertilizer for cotton (Gossypium hirsutum): Effect in reducing N fertilization. Rev. Argent. Microbiol. 2017, 49, 377–383. [Google Scholar] [CrossRef] [PubMed]
- Nosheen, A.; Naz, R.; Tahir, A.T.; Yasmin, H.; Keyani, R.; Mitrevski, B. Improvement of safflower oil quality for biodiesel production by integrated application of PGPR under reduced amount of NP fertilizers. PLoS ONE 2018, 13, e0201738. [Google Scholar] [CrossRef]
- Mendes, R.; Garbeva, P.; Raaijmakers, J.M. The rhizosphere microbiome: Significance of plant beneficial, plant pathogenic, and human pathogenic microorganisms. FEMS Microbiol. Rev. 2013, 37, 634–663. [Google Scholar] [CrossRef] [Green Version]
- Patel, P.; Panchal, K. Effect of Free-Living Nitrogen Fixing and Phosphate Solubilizing Bacteria on Growth of Gossypium hirsutum L. Asian J. Biol. Sci. 2020, 9, 169–176. [Google Scholar] [CrossRef]
- Nautiyal, C.S. An efficient microbiological growth medium for screening phosphate solubilizing microorganisms. FEMS Microbiol. Lett. 1999, 170, 265–270. [Google Scholar] [CrossRef]
- Berraquero, F.R.; Baya, A.M.; Cormenzana, A.R. Estabelecimento de índices para el estúdio de la solubilización de fosfatos por bactérias del suelo. Ars Pharm. 1976, 17, 339–406. [Google Scholar]
- Chagas, A.F., Jr.; Oliveira, L.A.; Oliveira, A.N.; Willerding, A.L. Capacidade de solubilização de fosfatos e eficiência simbiótica de rizóbios isolados de solos da Amazônia. Acta Sci. Agron. 2010, 32, 359–366. [Google Scholar] [CrossRef]
- Sun, F.; Ou, Q.; Wang, N.; Guo, Z.W.; Ou, Y.; Li, N.; Peng, C. Isolation and identification of potassium-solubilizing bacteria from Mikania micrantha rhizospheric soil and their effect on M. micrantha plants. Glob. Ecol. Conserv. 2020, 23, e01141. [Google Scholar] [CrossRef]
- Louden, B.C.; Lynne, A.M.; Haarmann, D. Use of Blue Agar CAS Assay for Siderophore Detection. J. Microbiol. Biol. Educ. 2011, 12, 51–53. [Google Scholar] [CrossRef]
- Vincent, J.M. Manual Práctico de Rizobiología; Hemisferio Sur: Buenos Aires, Argentina, 1975; p. 178. [Google Scholar]
- Gordon, S.A.; Weber, R.P. Colorimetric estimation of indoleacetic acid. Plant Physiol. 1951, 26, 192–195. [Google Scholar] [CrossRef] [PubMed] [Green Version]
- Loaces, I.; Ferrando, L.; Scavino, A.F. Dynamics, diversity and function of endophytic siderophore-producing bacteria in rice. Microb. Ecol. 2011, 61, 606–618. [Google Scholar] [CrossRef] [PubMed]
- Hoagland, D.; Arnon, D.I. The water culture method for growing plants without soil. Calif. Agric. Exp. Stn. Circ. 1950, 347, 32. [Google Scholar]
- Abramoff, M.D.; Magalhaes, P.J.; Ram, S.J. Image Processing with ImageJ. Biophotonics Int. 2004, 11, 36–42. [Google Scholar]
- Malavolta, E.; Vitti, G.C.; Oliveira, S.A. Avaliação do Estado Nutricional das Plantas: Princípios e Aplicações; POTAFOS: Piracicaba, Brazil, 1997. [Google Scholar]
- RStudio Team. RStudio: Integrated Development for R. RStudio, PBC, Boston, MA, USA. Available online: http://www.rstudio.com/ (accessed on 22 October 2021).
- IBM Corp. IBM SPSS Statistics for Windows, version 20.0; IBM Corp: Armonk, NY, USA, 2011. [Google Scholar]
- SigmaPlot, Version 12.3, Systat Software Inc.: San Jose, CA, USA, 2013.
- Toffoli, L.M.; Martínez-Zamora, M.G.; Medrano, N.N.; Fontana, C.A.; Lovaisa, N.C.; Delaporte-Quintana, P.; Pedraza, R.O. Natural occurrence of Azospirillum brasilense in petunia with capacity to improve plant growth and flowering. J. Basic Microbiol. 2021, 61, 662–673. [Google Scholar] [CrossRef]
- Kang, S.M.; Radhakrishnan, R.; You, Y.H.; Joo, G.J.; Lee, I.J.; Lee, K.E.; Kim, J.H. Phosphate Solubilizing Bacillus megaterium mj1212 Regulates Endogenous Plant Carbohydrates and Amino Acids Contents to Promote Mustard Plant Growth. Indian J. Microbiol. 2014, 54, 427–433. [Google Scholar] [CrossRef]
- Yadav, H.; Gothwal, R.K.; Nigam, V.K.; Sinha-Roy, S.; Ghosh, P. Optimization of culture conditions for phosphate solubilization by a thermo-tolerant phosphate-solubilizing bacterium Brevibacillus sp. BISR-HY65 isolated from phosphate mines. Biocatal. Agric. Biotechnol. 2013, 2, 217–225. [Google Scholar] [CrossRef]
- Ferreira, M.J.; Silva, H.; Cunha, A. Siderophore-Producing Rhizobacteria as a Promising Tool for Empowering Plants to Cope with Iron Limitation in Saline Soils: A Review. Pedosphere 2019, 29, 409–420. [Google Scholar] [CrossRef]
- Tortora, M.L.; Díaz-Ricci, J.C.; Pedraza, R.O. Azospirillum brasilense siderophores with antifungal activity against Colletotrichum acutatum. Arch. Microbiol. 2011, 193, 275–286. [Google Scholar] [CrossRef]
- Santos, S.; Neto, I.F.F.; Machado, M.D.; Soares, H.M.V.M.; Soares, E.V. Siderophore Production by Bacillus megaterium: Effect of Growth Phase and Cultural Conditions. Appl. Biochem. Biotechnol. 2013, 172, 549–560. [Google Scholar] [CrossRef] [PubMed] [Green Version]
- Sheng, M.M.; Jia, H.K.; Zhang, G.Y.; Zeng, L.N.; Zhang, T.T.; Liu, H.M. Siderophore Production by Rhizosphere Biological Control Bacteria Brevibacillus brevis GZDF3 of Pinellia ternata and Its Antifungal Effects on Candida albicans. J. Microbiol. Biotechnol. 2020, 30, 689–699. [Google Scholar] [CrossRef] [PubMed]
- Liu, D.; Yang, Q.; Ge, K.; Hu, X.; Qi, G.; Du, B.; Ding, Y. Promotion of iron nutrition and growth on peanut by Paenibacillus illinoisensis and Bacillus sp. strains in calcareous soil. Braz. J. Microbiol. 2017, 48, 656–670. [Google Scholar] [CrossRef] [PubMed]
- Macias-Benitez, S.; Garcia-Martinez, A.M.; Caballero, P.J.; Gonzalez, J.M.; Tejada, M.M.; Parrado, J.R. Rhizospheric Organic Acids as Biostimulants: Monitoring Feedbacks on Soil Microorganisms and Biochemical Properties. Front. Plant Sci. 2020, 11, 633. [Google Scholar] [CrossRef]
- Suliasih; Widawati, S. Isolation of Indole Acetic Acid (IAA) producing Bacillus siamensis from peat and optimization of the culture conditions for maximum IAA production. IOP Conf. Ser. Earth Environ. Sci. 2020, 572, 012025. [Google Scholar] [CrossRef]
- Arkhipchenko, I.A.; Shaposhnikov, A.I.; Kravchenko, L.V. Tryptophan concentration of animal wastes and organic fertilizers. Appl. Soil Ecol. 2006, 34, 62–64. [Google Scholar] [CrossRef]
- Przemieniecki, S.W.; Purwin, C.; Mastalerz, J.; Borsuk, M.; LipiŃski, K.; Kurowski, T. Biostimulating effect of L-tryptophan on the yield and chemical and microbiological quality of perennial ryegrass (Lolium perenne) herbage and silage for ruminant. Journal of the Science of Food and Agriculture. J. Sci. Food Agric. 2020, 101, 3969–3974. [Google Scholar] [CrossRef]
- Santoyo, G.; Moreno-Hagelsieb, G.; del Carmen, O.M.M.; Glick, B.R. Plant growth-promoting bacterial endophytes. Microbiol. Res. 2016, 183, 92–99. [Google Scholar] [CrossRef]
- Hashmi, I.; Paul, C.; Al-Dourobi, A.; Sandoz, F.; Deschamps, P.; Junier, T.; Bindschedler, S. Comparison of the plant growth promotion performance of a consortium of Bacilli inoculated as endospores or as vegetative cells. FEMS Microbiol. Ecol. 2019, 95, fiz147. [Google Scholar] [CrossRef]
- Ramos, A.C.; Melo, J.; de Souza, S.B. Inoculation with the endophytic bacterium Herbaspirillum seropedicae promotes growth, nutrient uptake and photosynthetic efficiency in rice. Planta 2020, 252, 87. [Google Scholar] [CrossRef]
- Samaniego-Gámez, B.Y.; Garruña, R.; Tun-Suárez, J.M.; Kantun-Can, J.; Reyes-Ramírez, A.; Cervantes-Díaz, L. Bacillus spp. inoculation improves photosystem II efficiency and enhances photosynthesis in pepper plants. Chil. J. Agric. Res. 2016, 76, 409–416. [Google Scholar] [CrossRef] [Green Version]
- Rozpadek, P.K.; Wężowicz, M.; Nosek, R.; Ważny, K.; Tokarz, M.; Lembicz, M.; Miszalski, Z.; Turnau, K. The fungal endophyte Epichloë typhina improves photosynthesis efficiency of its host orchard grass (Dactylis glomerata). Planta 2015, 242, 1025–1035. [Google Scholar] [CrossRef] [PubMed] [Green Version]
- Agathokleous, E.; Feng, Z.; Peñuelas, J. Chlorophyll hormesis: Are chlorophylls major components of stress biology in higher plants? Sci. Total Environ. 2020, 726, 138637. [Google Scholar] [CrossRef] [PubMed]
- Mikiciuk, G.; Sas-Paszt, L.; Mikiciuk, M.; Derkowska, E.; Trzciński, P.; Głuszek, S.; Rudnicka, J. Mycorrhizal frequency, physiological parameters, and yield of strawberry plants inoculated with endomycorrhizal fungi and rhizosphere bacteria. Mycorrhiza 2019, 29, 489–501. [Google Scholar] [CrossRef] [PubMed] [Green Version]
- Morais, M.C.; Mucha, Â.; Ferreira, H.; Gonçalves, B.; Bacelar, E.; Marques, G. Comparative study of plant growth-promoting bacteria on the physiology, growth and fruit quality of strawberry. J. Sci. Food Agric. 2019, 99, 5341–5349. [Google Scholar] [CrossRef]
- Gardestrom, P.; Wigge, B. Influence of Photorespiration on ATP/ADP Ratios in the Chloroplasts, Mitochondria, and Cytosol, Studied by Rapid Fractionation of Barley (Hordeum vulgare) Protoplasts. Plant Physiol. 1988, 881, 69–76. [Google Scholar] [CrossRef] [Green Version]
- Crafts-Brandner, S.J.; Salvucci, M.E. Rubisco activase constrains the photosynthetic potential of leaves at high temperature and CO2. Proc. Natl. Acad. Sci. USA 2000, 97, 13430–13435. [Google Scholar] [CrossRef] [Green Version]
- Ribeiro, V.P.; Gomes, E.A.; de Sousa, S.M. Co-inoculation with tropical strains of Azospirillum and Bacillus is more efficient than single inoculation for improving plant growth and nutrient uptake in maize. Arch. Microbiol. 2022, 204, 143. [Google Scholar] [CrossRef]
- Saghafi, D.; Ghorbanpour, M.; Lajayer, B.A. Efficiency of Rhizobium strains as plant growth promoting rhizobacteria on morpho-physiological properties of Brassica napus L. under salinity stress. J. Soil Sci. Plant Nutr. 2018, 18, 253–268. [Google Scholar] [CrossRef] [Green Version]
- Silva, C.F.B.; Brito, T.L.; Taniguchi, C.A.K.; Lopes, L.A.; Pinto, G.A.S.; Carvalho, A.C.P.P. Growth-promoting potential of bacterial biomass in the banana micropropagated plants. Rev. Bras. Eng. Agric. Ambient. 2018, 22, 782–787. [Google Scholar] [CrossRef]
- Deepa, C.K.; Dastager, S.G.; Pandey, A. Isolation and characterization of plant growth promoting bacteria from non-rhizospheric soil and their effect on cowpea (Vigna unguiculata (L.) Walp.) seedling growth. World J. Microbiol. Biotechnol. 2010, 26, 1233–1240. [Google Scholar] [CrossRef] [PubMed]
- Vacheron, J.; Desbrosses, G.; Bouffaud, M.L.; Touraine, B.; Moënne-Loccoz, Y.; Muller, D.; Prigent-Combaret, C. Plant growth-promoting rhizobacteria and root system functioning. Front. Plant Sci. 2013, 4, 356. [Google Scholar] [CrossRef] [PubMed] [Green Version]
- Verhage, L. Underground allies: How bacteria stimulate plant growth by altering root development. Plant J. 2020, 103, 1637–1638. [Google Scholar] [CrossRef] [PubMed]
- Gomes, D.G.; Radi, A.J.; Aquino, G.S. Bactérias promotoras de crescimento alteram o desenvolvimento da parte aérea e sistema radicular da canola. Semin. Cienc. Agrar. 2018, 39, 2375–2384. [Google Scholar] [CrossRef]
- Rosa, P.A.L.; Mortinho, E.S.; Jalal, A.; Galindo, F.S.; Buzetti, S.; Fernandes, G.C.; Teixeira Filho, M.C.M. Inoculation With Growth-Promoting Bacteria Associated With the Reduction of Phosphate Fertilization in Sugarcane. Front. Environ. Sci. 2020, 8, 32. [Google Scholar] [CrossRef]
- Bona, E.; Cantamessa, S.; Massa, N. Arbuscular mycorrhizal fungi and plant growth-promoting pseudomonads improve yield, quality and nutritional value of tomato: A field study. Mycorrhiza 2017, 27, 1–11. [Google Scholar] [CrossRef]


| Treatment | Description of Fertilization | Inoculum | Inoculum Concentration |
|---|---|---|---|
| Control 1 (C1) | Complete fertilization (100% N and P) | No inoculum | - |
| Control 2 (C2) | Reduced fertilization (30% N and P) | No inoculum | - |
| Treatment 1 (T1) | Reduced fertilization (30% N and P) | Ab-v5 | 6 mL (1 × 10⁸) |
| Treatment 2 (T2) | Reduced fertilization (30% N and P) | 0004 | 6 mL (1 × 10⁸) |
| Treatment 3 (T3) | Reduced fertilization (30% N and P) | MET12M2 | 6 mL (1 × 10⁸) |
| Treatment 4 (T4) | Reduced fertilization (30% N and P) | Ab-v5 + 0004 | 3 mL (1 × 10⁸) + 3 mL (1 × 10⁸) |
| Treatment 5 (T5) | Reduced fertilization (30% N and P) | Ab-v5 + MET12M2 | 3 mL (1 × 10⁸) + 3 mL (1 × 10⁸) |
| Treatment 6 (T6) | Reduced fertilization (30% N and P) | 0004 + MET12M2 | 3 mL (1 × 10⁸) + 3 mL (1 × 10⁸) |
| Treatment 7 (T7) | Reduced fertilization (30% N and P) | Ab-v5 + 0004 + MET12M2 | 2 mL (1 × 10⁸) + 2 mL (1 × 10⁸) + 2 mL (1 × 10⁸) |
| Bacterium | Phosphate Solubilization (IS) | Potassium Solubilization | Siderophore Production | pH | IAA Production |
|---|---|---|---|---|---|
| Azospirillum brasilense (Ab-v5) | 16.67 ± 9.81a | + | − | Acid | + |
| Bacillus megaterium (0004) | 14.33 ± 2.89a | + | − | Acid | + |
| Brevibacillus fluminis (MET12M2) | 15 ± 3a | + | − | Acid | + |
| Treatment | PE | gs | Ci | T | WUE | CUE |
| (μmol CO2·m−2·s−1) | (mol CO2·m−2·s−1) | (μmol·mol−1) | (CO2·m−2·s−1) | (μmol·m−2·s−1) (mmol H2O·m−2·s−1)−1 | (μmol·m−2·s−1) (μmol·mol−1)−1 | |
| Control 1 | 8.171 ± 1.90 | 0.084 ± 0.02 | 231.76 ± 14.44 | 1.15 ± 0.30 | 7.179 ± 0.53 | 0.035 ± 0.009 |
| Control 2 | 8.282 ± 0.94 ⬤ | 0.079 ± 0.03 ⬤ | 189.1 ± 89.30 ⬤ | 1.1 ± 0.41⬤ | 8.72 ± 3.58 ⬤ | 0.065 ± 0.048 ⬤ |
| Treatment 1 | 8.017 ± 1.08ab ⬤ 〇 | 0.093 ± 0.02ab ⬤ 〇 | 245.9 ± 20.06a ⬤ 〇 | 1.3 ± 0.28a ⬤ 〇 | 6.31 ± 0.74ab ⬤ 〇 | 0.033 ± 0.004ab ⬤ 〇 |
| Treatment 2 | 8.039 ± 2.24ab ⬤ 〇 | 0.095 ± 0.03ab ⬤ 〇 | 244.9 ± 35.12a ⬤ 〇 | 1.26 ± 0.39a ⬤ 〇 | 6.58 ± 1.37ab ⬤ 〇 | 0.034 ± 0.014ab ⬤ 〇 |
| Treatment 3 | 7.123 ± 0.89b ⬤ 〇 | 0.096 ± 0.02ab ⬤ 〇 | 266.29 ± 23.99a ⬤ 〇 | 1.39 ± 0.26a ⬤ 〇 | 5.28 ± 1.10b ⬤ 〇 | 0.027 ± 0.005b ⬤ 〇 |
| Treatment 4 | 9.353 ± 1.92a ⬤ 〇 | 0.102 ± 0.03ab ⬤ 〇 | 233.77 ± 37.40a ⬤ 〇 | 1.37 ± 0.32a ⬤ 〇 | 7.02 ± 1.47a ⬤ 〇 | 0.041 ± 0.012a ⬤ 〇 |
| Treatment 5 | 9.169 ± 3.22ab ⬤ 〇 | 0.117 ± 0.02a ⬤ 〇 | 263.9 ± 29.96a ⬤ 〇 | 1.56 ± 0.26a ⬤ 〇 | 5.86 ± 1.49ab ⬤ 〇 | 0.036 ± 0.017ab ⬤ 〇 |
| Treatment 6 | 7.749 ± 1.17ab ⬤ 〇 | 0.089 ± 0.02b ⬤ 〇 | 240.08 ± 37.85a ⬤ 〇 | 1.25 ± 0.32a ⬤ 〇 | 6.51 ± 1.63ab ⬤ 〇 | 0.033 ± 0.006ab ⬤ 〇 |
| Treatment 7 | 9.052 ± 1.47a ⬤ 〇 | 0.108 ± 0.02ab ⬤ 〇 | 250.46 ± 25.46a ⬤ 〇 | 1.46 ± 0.21a ⬤ 〇 | 6.24 ± 0.88ab ⬤ 〇 | 0.037 ± 0.007a ⬤ 〇 |
| Treatment | Macronutrients (g/kg) | ||||
|---|---|---|---|---|---|
| N | P | K | Ca | Mg | |
| Control 1 | 9.75 ± 0.15 | 5 ± 0 | 18.45 ± 0.65 | 7.35 ± 0.05 | 6.8 ± 0 |
| Control 2 | 9.45 ± 0.45 ⬤ | 5.9 ± 0.1 ⬤ | 19.55 ± 0.05 ⬤ | 7.15 ± 0.25 ⬤ | 7.2 ± 0.10 ⬤ |
| Treatment 1 | 6.85 ± 0.75c ⬤ 〇 | 4.1 ± 0.5A ⬤ 〇 | 12.35 ± 1.25b ⬤ 〇 | 5.15 ± 0.65c ⬤ 〇 | 4.8 ± 0.50d ⬤ 〇 |
| Treatment 2 | 9.35 ± 0.95b ⬤ 〇 | 5.2 ± 1.1A ⬤ 〇 | 15.3 ± 2.90a ⬤ 〇 | 6.15 ± 1.15bc ⬤ 〇 | 6.05 ± 1.05c ⬤ 〇 |
| Treatment 3 | 10.2 ± 0.60ab ⬤ 〇 | 5.55 ± 0.25A ⬤ 〇 | 17.4 ± 0.90a ⬤ 〇 | 7.2 ± 0.20ab ⬤ 〇 | 7.85 ± 0.35a ⬤ 〇 |
| Treatment 4 | 10.55 ± 0.55a ⬤ 〇 | 6.05 ± 0.65A ⬤ 〇 | 17.45 ± 1.35a ⬤ 〇 | 7.4 ± 0.70a ⬤ 〇 | 7.6 ± 0.60a ⬤ 〇 |
| Treatment 5 | 9.65 ± 0.35ab ⬤ 〇 | 5.2 ± 0.3A ⬤ 〇 | 15.6 ± 0.80a ⬤ 〇 | 6.3 ± 0.40ab ⬤ 〇 | 6.75 ± 0.35bc ⬤ 〇 |
| Treatment 6 | 10.4 ± 0.10ab ⬤ 〇 | 5.8 ± 0.3A ⬤ 〇 | 17.2 ± 1.00a ⬤ 〇 | 6.9 ± 0.30ab ⬤ 〇 | 7.25 ± 0.15ab ⬤ 〇 |
| Treatment 7 | 10.2 ± 0ab ⬤ 〇 | 5.55 ± 0.15A ⬤ 〇 | 17.1 ± 0.50a ⬤ 〇 | 7.1 ± 0.20ab ⬤ 〇 | 7.55 ± 0.15ab ⬤ 〇 |
| Treatment | Average Number of Leaves |
|---|---|
| Control 1 | 5.33 ± 0.52 |
| Control 2 | 5.83 ± 1.47 ⬤ |
| Treatment 1 | 4.67 ± 0.52a ⬤ 〇 |
| Treatment 2 | 6.67 ± 1.51a ⬤ 〇 |
| Treatment 3 | 5.33 ± 0.52a ⬤ 〇 |
| Treatment 4 | 5.33 ± 1.03a ⬤ 〇 |
| Treatment 5 | 5.50 ± 1.87a ⬤ 〇 |
| Treatment 6 | 5.00 ± 1.10a ⬤ 〇 |
| Treatment 7 | 5.00 ± 0.63a ⬤ 〇 |
Publisher’s Note: MDPI stays neutral with regard to jurisdictional claims in published maps and institutional affiliations. |
© 2022 by the authors. Licensee MDPI, Basel, Switzerland. This article is an open access article distributed under the terms and conditions of the Creative Commons Attribution (CC BY) license (https://creativecommons.org/licenses/by/4.0/).
Share and Cite
Silva, L.I.d.; Oliveira, I.P.d.; Jesus, E.d.C.; Pereira, M.C.; Pasqual, M.; Araújo, R.C.d.; Dória, J. Fertilizer of the Future: Beneficial Bacteria Promote Strawberry Growth and Yield and May Reduce the Need for Chemical Fertilizer. Agronomy 2022, 12, 2465. https://doi.org/10.3390/agronomy12102465
Silva LId, Oliveira IPd, Jesus EdC, Pereira MC, Pasqual M, Araújo RCd, Dória J. Fertilizer of the Future: Beneficial Bacteria Promote Strawberry Growth and Yield and May Reduce the Need for Chemical Fertilizer. Agronomy. 2022; 12(10):2465. https://doi.org/10.3390/agronomy12102465
Chicago/Turabian StyleSilva, Leandro Israel da, Indira Pereira de Oliveira, Ederson da Conceição Jesus, Marlon Corrêa Pereira, Moacir Pasqual, Ronilson Carlos de Araújo, and Joyce Dória. 2022. "Fertilizer of the Future: Beneficial Bacteria Promote Strawberry Growth and Yield and May Reduce the Need for Chemical Fertilizer" Agronomy 12, no. 10: 2465. https://doi.org/10.3390/agronomy12102465