
Impact of Gypsum and Bio-Priming of Maize Grains on Soil Properties, Physiological Attributes and Yield under Saline–Sodic Soil Conditions


Abstract
:1. Introduction
2. Materials and Methods
2.1. Description of the Location
2.2. Materials Used and Their Source
2.3. Field Experiments and Growth Conditions
2.4. Biometrics of Plants
2.4.1. Photosynthetic Pigments
2.4.2. Proline Content
2.4.3. Determination of N, K+, Na+ and the K+/Na+ Ratio
2.4.4. Soil Enzymes Estimations
2.4.5. Soil Physicochemical Characteristics
2.5. Yield
2.6. Statistical Analysis
3. Results
3.1. Photosynthetic Pigments
3.2. N, K+, Na+ and the K+/Na+ Ratio
3.3. Soil Enzymes Estimations
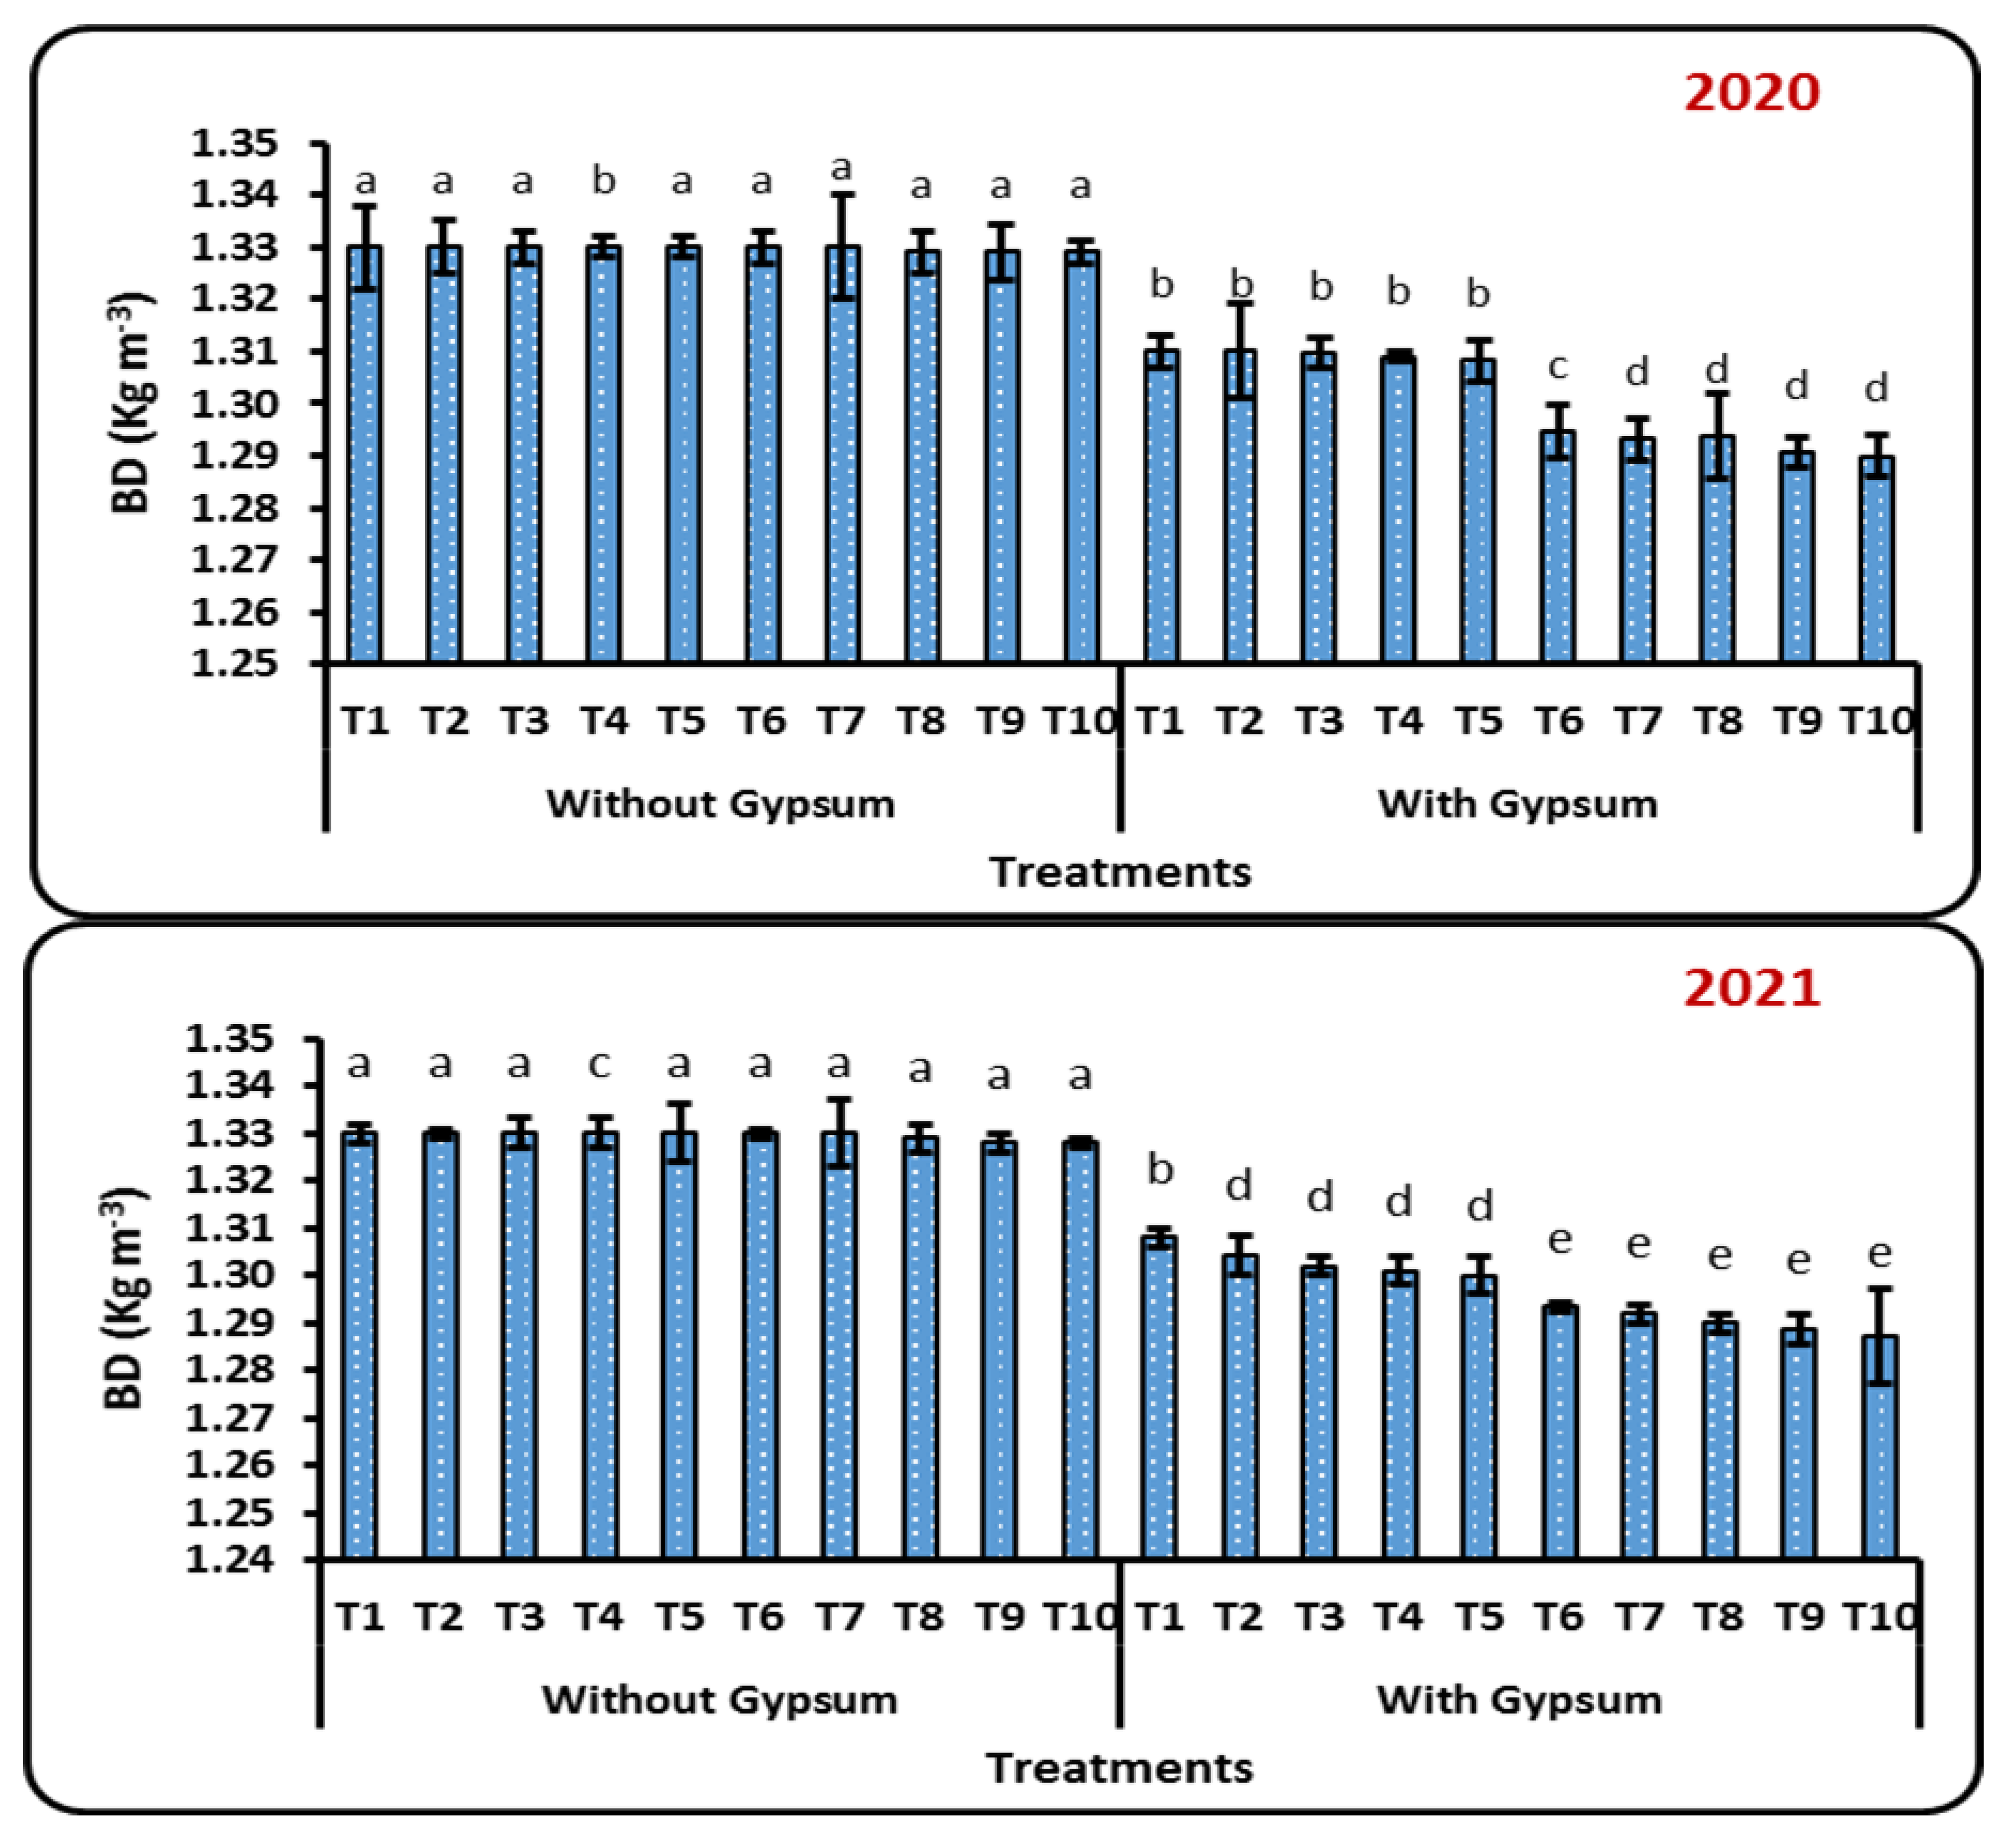
3.4. Soil Physical Characteristics
3.5. Soil Chemical Characteristics
3.6. Yield of Maize and Its Components
4. Discussion
4.1. Photosynthetic Pigments
4.2. N, K+, Na+ and the K+/Na+ Ratio
4.3. Soil Enzymes Estimations
4.4. Soil Physicochemical Characteristics
4.5. Yield of Maize and Its Components
5. Conclusions
Author Contributions
Funding
Institutional Review Board Statement
Informed Consent Statement
Data Availability Statement
Acknowledgments
Conflicts of Interest
References
- Chaudhary, D.; Narula, N.; Sindhu, S.S.; Behl, R.K. Plant growth stimulation of wheat (Triticum aestivum L.) by inoculation of salinity tolerant Azotobacter strains. Physiol. Mol. Biol. Plants 2013, 19, 515–519. [Google Scholar] [CrossRef] [PubMed] [Green Version]
- Stamford, N.P.; Figueiredo, M.V.B.; Junior, S.D.S.; Santos, A.; Junior, M.A.L. Effect of gypsum and sulfur with Acidithiobacillus on soil salinity alleviation and on cowpea biomass and nutrient status as affected by PK rock biofertilizer. Sci. Hortic. 2015, 192, 287–292. [Google Scholar] [CrossRef]
- Wang, W.; Vinocur, B.; Altman, A. Plant responses to drought, salinity and extreme temperatures: Towards genetic engineering for stress tolerance. Planta 2003, 218, 1–14. [Google Scholar] [CrossRef] [PubMed]
- Flowers, T.J.; Galal, H.K.; Bromham, L. Evolution of halophytes: Multiple origins of salt tolerance in land plants. Funct. Plant Biol. 2010, 37, 604–612. [Google Scholar] [CrossRef]
- FAOSTAT. Food and Agriculture Organization of the United Nations Statistics Division. 2020. Available online: https://www.fao.org/faostat/en/#data/QC (accessed on 1 August 2022).
- Nabati, J.; Kafi, M.; Nezami, A.; Moghaddam, P.R.; Ali, M.; Mehrjerdi, M.Z. Effect of salinity on biomass production and activities of some key enzymatic antioxidants in Kochia (Kochia scoparia). Pak. J. Bot. 2011, 43, 539–548. [Google Scholar]
- Rojas-Tapias, D.; Moreno-Galván, A.; Pardo-Díaz, S.; Obando, M.; Rivera, D.; Bonilla, R. Effect of inoculation with plant growth-promoting bacteria (PGPB) on amelioration of saline stress inmaize (Zea mays). Appl. Soil Ecol. 2012, 61, 264–272. [Google Scholar] [CrossRef]
- Kamran, M.; Parveen, A.; Ahmar, S.; Malik, Z.; Hussain, S.; Chattha, M.S.; Saleem, M.H.; Adil, M.; Heidari, P.; Chen, J.-T. An Overview of Hazardous Impacts of Soil Salinity in Crops, Tolerance Mechanisms, and Amelioration through Selenium Supplementation. Int. J. Mol. Sci. 2020, 21, 148. [Google Scholar] [CrossRef] [Green Version]
- Munns, R.; Tester, M. Mechanisms of Salinity Tolerance. Ann. Rev. Plant Biol. 2008, 59, 651–681. [Google Scholar] [CrossRef] [Green Version]
- Evelin, H.; Kapoor, R.; Giri, B. Arbuscular mycorrhizal fungi in alleviation of salt stress: A review. Ann. Bot. 2009, 104, 1263–1280. [Google Scholar] [CrossRef] [Green Version]
- Aghighi Shahverdi, M.; Omidi, H.; Tabatabaei, S.J. Plant growth and steviol glycosides as affected by foliar application of selenium, boron, and iron under NaCl stress in Stevia rebaudiana Bertoni. Ind. Crop. Prod. 2018, 125, 408–415. [Google Scholar] [CrossRef]
- Leal, L.D.S.G.; Pessoa, L.G.M.; de Oliveira, J.P.; Santos, N.A.; Silva, L.F.D.S.; Júnior, G.B.; Freire, M.B.G.D.S.; de Souza, E.S. Do applications of soil conditioner mixtures improve the salt extraction ability of Atriplex nummularia at early growth stage? Int. J. Phytoremediation 2020, 22, 482–489. [Google Scholar] [CrossRef] [PubMed]
- Farid, I.; Hashem, A.N.; El-Aty, A.; Esraa, A.M.; Abbas, M.H.; Ali, M. Integrated approaches towards ameliorating a saline sodic soil and increasing the dry weight of barley plants grown thereon. Environ. Biodivers. Soil Secur. 2020, 4, 31–46. [Google Scholar] [CrossRef]
- El-Gaafarey, T.; El-Nahrawy, S.; El-Nahrawy, S.M. Impact of bio-inoculation with Bradyrhizobium spp. on yield and Seed quality of forage cowpea (Vigna unguiculata L.) under soil salinity conditions. Environ. Biodivers. Soil Secur. 2020, 4, 225–238. [Google Scholar] [CrossRef]
- Assaha, D.V.M.; Ueda, A.; Saneoka, H.; Al-Yahyai, R.; Yaish, M.W. The role of Na+ and K+ transporters in salt stress adaptation in glycophytes. Front. Physiol. 2017, 8, 509. [Google Scholar] [CrossRef] [Green Version]
- Kumar, A.; Kumar, A.; Kumar, P.; Lata, C.; Kumar, S. Effect of individual and interactive alkalinity and salinity on physiological, biochemical and nutritional traits of Marvel grass. Indian J. Exp. Biol. 2018, 56, 573–581. [Google Scholar]
- Capaldi, F.R.; Gratão, P.L.; Reis, A.R.; Lima, L.W.; Azevedo, R.A. Sulfur metabolism and stress defense responses in plants. Trop. Plant Biol. 2015, 8, 60–73. [Google Scholar]
- Ahmed, K.; Qadir, G.; Jami, A.R.; Saqib, A.I.; Nawaz, M.Q.; Kamal, M.A.; Haq, E. Strategies for Soil Amelioration Using Sulphur in Salt Affected Soils. Cercet. Agron. Mold. 2016, 49, 5–16. [Google Scholar] [CrossRef] [Green Version]
- Wiedenfeld, B. Sulfur application effects on soil properties in calcareous soil and on sugarcane growth and yield. J. Plant Nutr. 2011, 34, 1003–1013. [Google Scholar] [CrossRef]
- Al-Enazy, A.A.; Al-Barakah, F.; Al-Oud, S.; Usman, A. Effect of phosphogypsum application and bacteria co-inoculation on biochemical properties and nutrient availability to maize plants in a saline soil. Arch. Agron. Soil Sci. 2018, 64, 1394–1406. [Google Scholar] [CrossRef]
- Hidangmayum, A.; Dwivedi, P.; Katiyar, D.; Hemantaranjan, A. Application of chitosan on plant responses with special reference to abiotic stress. Physiol. Mol. Biol. Plants 2019, 25, 313–326. [Google Scholar] [CrossRef]
- Kean, T.; Thanou, M. Biodegradation, biodistribution, and toxicity of chitosan. Adv. Drug Deliv. Rev. 2010, 62, 3–11. [Google Scholar] [CrossRef]
- Yin, H.; Fretté, X.C.; Christensen, L.P.; Grevsen, K. Chitosan oligosaccharides promote the content of polyphenols in Greek oregano (Oreganum vulgare ssp. hirtum). J. Agric. Food Chem. 2011, 60, 136–143. [Google Scholar] [CrossRef] [PubMed]
- Bittelli, M.; Flury, M.; Campbell, G.S.; Nichols, E.G. Reduction of transpiration of through foliar application of chitosan. Agric. For. Meteorol. 2001, 107, 167–175. [Google Scholar] [CrossRef]
- Gornik, K.; Grzesik, M.; Duda, B.R. The effect of chitosan on rooting of grapevine cuttings and on subsequent plant growth under drought and temperature stress. J. Fruit Ornam. Plant Res. 2008, 16, 333–343. [Google Scholar]
- Richards, L.A. (Ed.) Diagnosis and Improvement of Saline and Alkali Soils; USDA Handbook, 2000, No. 60; U.S. Salinity Laboratory Staff: Washington, DC, USA, 1954. [Google Scholar]
- Döbereiner, J.; Day, J.M. Associative Symbiosis in Tropical Grasses: Characterization of Microorganisms and Dinitrogen Fixing Sites in Sysposium on Nitrogen Fixation; Washington State University Press: Washington, DC, USA, 1976. [Google Scholar]
- Atlas, R.M. Handbook of Microbiological Media, 2nd ed.; CRC Press: New York, NY, USA, 1997; p. 1026. [Google Scholar]
- Al-Manhel, A.J.; Al-Hilphy, A.R.; Niamah, A.K. Extraction of chitosan, characterisation and its use for water purification. J. Saudi Soc. Agric. Sci. 2018, 17, 186–190. [Google Scholar] [CrossRef] [Green Version]
- Bakhoum, G.S.; Sadak, M.S.; Badr, E.A. Mitigation of adverse effects of salinity stress on sunflower plant (Helianthus annuus L.) by exogenous application of chitosan. Bull. Natl. Res. Cent. 2020, 44, 79. [Google Scholar] [CrossRef]
- Mousa, N.A.; Siaguru, P.; Wiryowidagdo, S.; Wagih, M.E. Evaluation and selection of elite clonal genotypes of the sweet crop licorice (Glycyrrhiza glabra) in a new environment. Sugar Technol. 2007, 9, 83–94. [Google Scholar] [CrossRef]
- Bates, L.S.; Waldren, R.P.; Teare, I.D. Rapid determination of free proline for water-stress studies. Plant Soil 1973, 39, 205–207. [Google Scholar] [CrossRef]
- Peters, J.; Combs, S.; Hoskins, B.; Jarman, J.; Kovar, J.; Watson, M.; Wolf, A.; Wolf, N. Recommended Methods of Manure Analysis; University of Wisconsin Cooperative Extension Publishing: Madison, WI, USA, 2003. [Google Scholar]
- Cottenie, A.; Verloo, M.; Kiekens, L.; Velghe, G.; Camerlynck, R. Chemical Analysis of Plants and Soils; Laboratory of Analytical and Agrochemistry, State University: Ghent, Belgium, 1982; pp. 14–24. [Google Scholar]
- Casida, L.E.; Klein, D.A.; Snatoro, T. Soil dehydrogenase activity. Soil Sci. 1964, 98, 371–376. [Google Scholar] [CrossRef]
- Pancholy, S.K.; Rice, E.L. Soil enzymes in relation to old succession: Amylase, invertase, cellulose, dehydrogenase and urease. Soil Sci. Soc. Am. Proc. 1973, 37, 47–50. [Google Scholar] [CrossRef]
- Roberge, M.R. Methodology of soil measurement and extraction. In Soil Enzymes; Burns, R.G., Ed.; Academic Press: New York, NY, USA, 1978; pp. 341–370. [Google Scholar]
- Ross, D.J. A seasonal study of oxygen uptake of some pasture soils and activities of enzymes hydrolysing sucrose and starch. J. Soil Sci. 1965, 16, 73–85. [Google Scholar] [CrossRef]
- Sparks, D.L.; Page, A.L.; Helmke, P.A.; Loeppert, R.H. (Eds.) Methods of Soil Analysis, Part 3: Chemical Methods; John Wiley & Sons: Hoboken, NJ, USA, 2020. [Google Scholar]
- Campbell, C.R.; Plank, C.O. Preparation of plant tissue for laboratory analysis. In Handbook of Reference Methods for Plant Analysis; Kalra, Y.P., Ed.; CRC Press: Boca Raton, FL, USA, 1998; pp. 37–49. [Google Scholar]
- Gomez, K.A.; Gomez, A. Statistical Procedure for Agricultural Research—Hand Book; John Wiley & Sons: New York, NY, USA, 1984. [Google Scholar]
- Hnilickova, H.; Kraus, K.; Vachova, P.; Hnilicka, F. Salinity stress affects photosynthesis, malondialdehyde formation, and proline content in Portulaca oleracea L. Plants 2021, 10, 845. [Google Scholar] [CrossRef] [PubMed]
- Hasanuzzaman, M.; Bhuyan, M.B.; Zulfiqar, F.; Raza, A.; Mohsin, S.M.; Mahmud, J.A.; Fujita, M.; Fotopoulos, V. Reactive oxygen species and antioxidant defense in plants under abiotic stress: Revisiting the crucial role of a universal defense regulator. Antioxidants 2020, 9, 681. [Google Scholar] [CrossRef]
- Sherin, G.; Aswathi, K.R.; Puthur, J.T. Photosynthetic functions in plants subjected to stresses are positively influenced by priming. Plant Stress 2022, 20, 100079. [Google Scholar] [CrossRef]
- ALKahtani, M.D.; Attia, K.A.; Hafez, Y.M.; Khan, N.; Eid, A.M.; Ali, M.A.; Abdelaal, K.A. Chlorophyll fluorescence parameters and antioxidant defense system can display salt tolerance of salt acclimated sweet pepper plants treated with chitosan and plant growth promoting rhizobacteria. Agronomy 2020, 10, 1180. [Google Scholar] [CrossRef]
- Pereira, A.S.; Silva, P.M.; Olivera, J.L.; Olivera, H.C.; Fraceto, L.F. Chitosan nanoparticles as carrier systems for the plant growth hormone gibbereillic acid. Collodis Surf. B Bioenterfaces 2017, 150, 141–152. [Google Scholar] [CrossRef] [Green Version]
- Stamford, N.P.; Freitas, A.D.S.; Ferraz, D.S.; Montenegro, A.A.A.; Santos, C.E. Nitrogen fixation and growth of cowpea (Vigna unguiculata) and yam bean (Pachyrhizus erosus) in a sodic soil as affected by gypsum and sulfur inoculated with Thiobacillus and rhizobial inoculation. Trop. Grassl. 2003, 37, 11–19. [Google Scholar]
- Khalifa, T.; Elbagory, M.; Omara, A.E. Salt Stress Amelioration in Maize Plants through Phosphogypsum Application and Bacterial Inoculation. Plants 2021, 10, 2024. [Google Scholar] [CrossRef]
- Younas, H.S.; Abid, M.; Shaaban, M.; Ashraf, M. Influence of silicon and chitosan on growth and physiological attributes of maize in a saline field. Physiol. Mol. Biol. Plants 2021, 27, 387–397. [Google Scholar] [CrossRef]
- Sinica, A.E.; Shangdong, Y.; Jun, W.U. Variation of soil fertility in Eucalyptus robusta plantations after controlled burning in the red soil region and its ecological evaluation. Acta Ecol. Sin. 2013, 33, 7788–7797. [Google Scholar]
- Sinsabaugh, R.L.; Belnap, J.; Findlay, S.G.; Shah, J.J.F.; Hill, B.H.; Kuehn, K.A.; Kuske, C.R.; Litvak, M.E.; Martinez, N.G.; Moorhead, D.L.; et al. Extracellular enzyme kinetics scale with resource availability. Biogeochemistry 2014, 121, 287–304. [Google Scholar] [CrossRef]
- Wei, C.; Yan, W. Effects of Alfalfa cultivars on amount of soil microorganisms and enzyme activity in Ningxia Yellow river irrigation area. Soils 2018, 37, 4349–4356. [Google Scholar]
- Zhang, N.; Wan, S.; Guo, J.; Han, G.; Gutknecht, J.; Schmid, B.; Yu, L.; Liu, W.; Bi, J.; Wang, Z.; et al. Precipitation modifies the effects of warming and nitrogen addition on soil microbial communities in northern Chinese grasslands. Soil Biol. Biochem. 2015, 89, 12–23. [Google Scholar] [CrossRef] [Green Version]
- Qu, Y.; Tang, J.; Li, Z.; Zhou, Z.; Wang, J.; Wang, S.; Cao, Y. Soil enzyme activity and microbial metabolic function diversity in soda saline–alkali rice paddy fields of northeast China. Sustainability 2020, 12, 10095. [Google Scholar] [CrossRef]
- Omara, A.E.; Hadifa, A.; Ali, D.F. The Integration Efficacy between Beneficial Bacteria and Compost Tea on Soil Biological Activities, Growth and Yield of Rice Under Drought Stress Conditions. J. Agric. Chem. Biotechnol. 2022, 13, 39–49. [Google Scholar] [CrossRef]
- Ren, H.; Lv, C.; Fernández-García, V.; Huang, B.; Yao, J.; Ding, W. Biochar and PGPR amendments influence soil enzyme activities and nutrient concentrations in a eucalyptus seedling plantation. Biomass Convers. Biorefinery 2021, 11, 1865–1874. [Google Scholar] [CrossRef]
- Omara, A.E.D.; Hafez, E.M.; Osman, H.S.; Rashwan, E.; El-Said, M.A.; Alharbi, K.; Abd El-Moneim, D.; Gowayed, S.M. Collaborative Impact of Compost and Beneficial Rhizobacteria on Soil Properties, Physiological Attributes, and Productivity of Wheat Subjected to Deficit Irrigation in Salt Affected Soil. Plants 2022, 11, 877. [Google Scholar] [CrossRef]
- Vance, W.H.; Tisdall, J.M.; McKenzie, B.M. Residual effects of surface applications of organic matter and calcium salts on the subsoil of a red-brown earth. Aust. J. Exp. Agric. 1998, 38, 595–600. [Google Scholar] [CrossRef]
- Bayoumy, M.; Khalifa, T.; Aboelsoud, H. Impact of some organic and inorganic amendments on some soil properties and wheat production under saline-sodic soil. J. Soil Sci. Agric. Eng. 2019, 10, 307–313. [Google Scholar] [CrossRef] [Green Version]
- Zaka, M.A.; Khalil, A.; Hafeezullah, R.; Muhammed, S.; Helge, S. Effectiveness of compost and gypsum for amelioration of saline sodic soil in rice wheat cropping system. Asian J. Agric. Biol. 2018, 6, 514–523. [Google Scholar]
- El-Kamar, F.A. Evaluation of some Soil Conditioners on some Properties of Salt Affected Soil and Wheat Productivity and Quality. J. Soil Sci. Agric. Eng. 2020, 11, 307–314. [Google Scholar] [CrossRef]
- Aboelsoud, H.M. Effect of Gypsum, K-Humate and Plant Growth Promoting Bacteria on Improvement of Soil Properties and Productivity of Wheat and Maize Irrigated by Saline Water. J. Soil Sci. Agric. Eng. 2020, 11, 129–139. [Google Scholar] [CrossRef]


| Month | Temperature (°C) | Wind Speed (km day−1) | RH (%) | Rainfall (mm month−1) | ||||||
|---|---|---|---|---|---|---|---|---|---|---|
| Max | Min | Max | Min | |||||||
| 2020 | 2021 | 2020 | 2021 | 2020 | 2021 | 2020 | 2021 | |||
| May | 33.2 | 17.1 | 33.5 | 17.4 | 125.1 | 124.8 | 68.3 | 69.8 | 0.0 | 0.0 |
| June | 36.4 | 16.5 | 36.5 | 16.8 | 115.1 | 113.7 | 65.2 | 67.7 | 0.0 | 0.0 |
| July | 35.6 | 22.0 | 35.7 | 22.3 | 105.4 | 102.5 | 64.3 | 66.2 | 0.0 | 0.0 |
| August | 38.4 | 23.3 | 38.1 | 23.6 | 93.1 | 91.3 | 62.1 | 64.4 | 0.0 | 0.0 |
| September | 37.2 | 22.2 | 37.5 | 22.7 | 85.0 | 86.2 | 45.6 | 48.5 | 0.0 | 0.0 |
| Depth (cm) | Soil Physical Properties | |||||||
| Moisture Characteristics | Particle Size Distribution (g kg−1) | |||||||
| F.C (%) | W.P. (%) | A.W. (%) | B.D. (kg m−3) | Sand | Silt | Clay | Soil Texture | |
| 0–20 | 44.11 | 22.01 | 22.10 | 1.29 | 173.1 | 255.1 | 571.8 | clay |
| 20–40 | 40.52 | 20.28 | 20.24 | 1.31 | 188.5 | 247.6 | 563.9 | clay |
| 40–60 | 38.03 | 19.03 | 19.00 | 1.33 | 190.6 | 251.2 | 558.2 | clay |
| Soil Chemical Properties | ||||||||
| Depth (cm) | pH | EC (dSm−1) | ESP (%) | CEC (cmole kg−1) | OM (g kg−1) | CaCO3 (g kg−1) | ||
| 0–20 | 8.17 | 6.70 | 14.75 | 37.15 | 17.8 | 27.8 | ||
| 20–40 | 8.20 | 7.61 | 16.90 | 36.10 | 16.4 | 26.9 | ||
| 40–60 | 8.35 | 10.89 | 18.98 | 34.42 | 14.2 | 24.1 | ||
| Biological Properties (cfu g−1 dry weight soil) | ||||||||
| Soil depth (cm) | TCB | TCF | TCA | |||||
| 0–20 | 123 × 106 | 71 × 104 | 67 × 105 | |||||
| Treatments | Chlorophyll (mg g−1 FW) | Carotenoid (µg g−1 FW) | Proline (µmol g−1 FW) | ||||
|---|---|---|---|---|---|---|---|
| 2020 | 2021 | 2020 | 2021 | 2020 | 2021 | ||
| Without Gypsum | T1 | 1.16 ± 0.11 o | 1.09 ± 0.08 o | 0.44 ± 0.03 k | 0.42 ± 0.08 n | 8.24 ± 0.28 o | 8.35 ± 0.48 p |
| T2 | 1.31 ± 0.14 m | 1.24 ± 0.11 n | 0.50 ± 0.04 j | 0.48 ± 0.10 m | 8.39 ± 0.49 n | 8.50 ± 0.67 o | |
| T3 | 1.79 ± 0.08 i | 1.72 ± 0.06 i | 0.69 ± 0.08 e | 0.67 ± 0.06 g | 8.87 ± 0.39 k | 8.98 ± 0.58 l | |
| T4 | 1.45 ± 0.05 k | 1.38 ± 0.13 l | 0.56 ± 0.05 h | 0.54 ± 0.03 k | 8.55 ± 0.41 l | 8.66 ± 0.68 m | |
| T5 | 1.40 ± 0.12 l | 1.33 ± 0.01 m | 0.54 ± 0.07 i | 0.52 ± 0.08 l | 8.48 ± 0.53 m | 8.59 ± 0.69 n | |
| T6 | 1.26 ± 0.08 n | 1.34 ± 0.11 lm | 0.45 ± 0.08 k | 0.51 ± 0.10 l | 8.97 ± 0.48 j | 9.05 ± 0.57 k | |
| T7 | 1.44 ± 0.10 k | 1.52 ± 0.07 k | 0.52 ± 0.10 j | 0.58 ± 0.07 j | 9.15 ± 0.38 i | 9.23 ± 0.59 j | |
| T8 | 2.12 ± 0.16 d | 2.20 ± 0.13 de | 0.76 ± 0.06 c | 0.82 ± 0.03 c | 9.83 ± 0.36 fg | 9.91 ± 0.49 h | |
| T9 | 1.54 ± 0.18 j | 1.62 ± 0.17 j | 0.55 ± 0.08 hi | 0.61 ± 0.07 i | 9.25 ± 0.58 h | 9.33 ± 0.33 i | |
| T10 | 1.54 ± 0.19 j | 1.62 ± 0.11 j | 0.55 ± 0.09 hi | 0.61 ± 0.10 i | 9.25 ± 0.39 h | 9.33 ± 0.61 i | |
| With Gypsum | T1 | 1.85 ± 0.09 h | 1.96 ± 0.22 h | 0.60 ± 0.09 g | 0.64 ± 0.06 h | 9.81 ± 0.58 g | 9.94 ± 0.58 h |
| T2 | 1.90 ± 0.08 g | 2.01 ± 0.19 g | 0.61 ± 0.08 g | 0.65 ± 0.09 gh | 9.86 ± 0.47 f | 9.99 ± 0.69 g | |
| T3 | 2.26 ± 0.05 c | 2.37 ± 0.09 c | 0.73 ± 0.05 d | 0.77 ± 0.09 d | 10.22 ± 0.58 c | 10.35 ± 0.69 c | |
| T4 | 2.05 ± 0.11 e | 2.16 ± 0.06 e | 0.66 ± 0.03 f | 0.70 ± 0.06 f | 10.01 ± 0.68 e | 10.14 ± 0.71 f | |
| T5 | 2.12 ± 0.14 d | 2.23 ± 0.09 d | 0.68 ± 0.04 e | 0.72 ± 0.09 e | 10.08 ± 0.49 d | 10.21 ± 0.53 e | |
| T6 | 1.99 ± 0.18 f | 2.08 ± 0.11 f | 0.69 ± 0.08 e | 0.78 ± 0.05 d | 10.07 ± 0.27 d | 10.16 ± 0.58 f | |
| T7 | 2.11 ± 0.19 d | 2.20 ± 0.12 de | 0.73 ± 0.09 d | 0.82 ± 0.06 c | 10.19 ± 0.49 c | 10.28 ± 0.61 d | |
| T8 | 2.45 ± 0.11 a | 2.54 ± 0.18 a | 0.85 ± 0.07 a | 0.94 ± 0.08 a | 10.53 ± 0.39 a | 10.62 ± 0.66 a | |
| T9 | 2.40 ± 0.19 b | 2.49 ± 0.13 b | 0.83 ± 0.09 b | 0.92 ± 0.03 b | 10.48 ± 0.33 b | 10.57 ± 0.38 b | |
| T10 | 2.39 ± 0.21 b | 2.48 ± 0.17 b | 0.82 ± 0.05 b | 0.91 ± 0.07 b | 10.47 ± 0.61 b | 10.56 ± 0.59 b | |
| F-test | |||||||
| Main | ** | ** | ** | ** | ** | ** | |
| Sub main | ** | ** | ** | ** | ** | ** | |
| Interaction | ** | ** | ** | ** | ** | ** | |
| Treatments | Nitrogen (%) | Potassium (%) | Sodium (%) | Potassium/Sodium Ratio (%) | |||||
|---|---|---|---|---|---|---|---|---|---|
| 2020 | 2021 | 2020 | 2021 | 2020 | 2021 | 2020 | 2021 | ||
| Without Gypsum | T1 | 1.04 ± 0.11 k | 1.06 ± 0.03 l | 1.11 ± 0.09 n | 1.23 ± 0.04 n | 2.40 ± 0.14 a | 2.58 ± 0.11 a | 0.46 ± 0.03 o | 0.47 ± 0.05 m |
| T2 | 1.19 ± 0.12 j | 1.21 ± 0.04 k | 1.26 ± 0.14 l | 1.38 ± 0.02 m | 2.29 ± 0.12 cd | 2.47 ± 0.09 b | 0.55 ± 0.02 m | 0.56 ± 0.06 l | |
| T3 | 1.67 ± 0.09 g | 1.69 ± 0.06 h | 1.74 ± 0.12 h | 1.86 ± 0.01 i | 2.09 ± 0.12 gh | 2.27 ± 0.13 f | 0.83 ± 0.04 gh | 0.82 ± 0.02 h | |
| T4 | 1.33 ± 0.04 h | 1.35 ± 0.03 i | 1.40 ± 0.10 j | 1.52 ± 0.06 k | 2.12 ± 0.09 g | 2.30 ± 0.15 ef | 0.66 ± 0.04 k | 0.66 ± 0.04 k | |
| T5 | 1.28 ± 0.07 i | 1.30 ± 0.02 j | 1.35 ± 0.08 k | 1.47 ± 0.05 l | 2.10 ± 0.16 gh | 2.28 ± 0.08 f | 0.64 ± 0.05 kl | 0.64 ± 0.03 k | |
| T6 | 1.07 ± 0.11 k | 1.10 ± 0.04 l | 1.19 ± 0.05 m | 1.34 ± 0.04 m | 2.32 ± 0.11 c | 2.47 ± 0.07 b | 0.51 ± 0.03 n | 0.54 ± 0.02 l | |
| T7 | 1.25 ± 0.15 i | 1.28 ± 0.03 j | 1.37 ± 0.07 jk | 1.52 ± 0.03 k | 2.19 ± 0.12 f | 2.34 ± 0.13 d | 0.62 ± 0.02 l | 0.65 ± 0.05 k | |
| T8 | 1.93 ± 0.10 e | 1.96 ± 0.03 e | 2.05 ± 0.07 e | 2.20 ± 0.06 de | 2.00 ± 0.15 j | 2.15 ± 0.12 h | 1.02 ± 0.01 e | 1.02 ± 0.06 f | |
| T9 | 1.35 ± 0.11 h | 1.38 ± 0.07 i | 1.49 ± 0.11 i | 1.62 ± 0.07 j | 2.03 ± 0.14 ij | 2.18 ± 0.11 gh | 0.73 ± 0.01 j | 0.74 ± 0.07 j | |
| T10 | 1.35 ± 0.09 h | 1.37 ± 0.02 i | 1.47 ± 0.15 i | 1.61 ± 0.05 j | 2.05 ± 0.08 i | 2.20 ± 0.14 g | 0.71 ± 0.02 j | 0.75 ± 0.07 j | |
| With Gypsum | T1 | 1.71 ± 0.04 g | 1.74 ± 0.05 g | 1.82 ± 0.13 f | 1.96 ± 0.06 h | 2.35 ± 0.05 b | 2.47 ± 0.10 b | 0.77 ± 0.04 i | 0.79 ± 0.05 i |
| T2 | 1.76 ± 0.03 f | 1.79 ± 0.03 f | 1.87 ± 0.09 f | 2.01 ± 0.03 g | 2.26 ± 0.11 de | 2.38 ± 0.12 c | 0.82 ± 0.05 h | 0.84 ± 0.04 h | |
| T3 | 2.12 ± 0.06 c | 2.15 ± 0.04 c | 2.23 ± 0.05 c | 2.37 ± 0.04 c | 1.92 ± 0.09 k | 2.04 ± 0.12 i | 1.16 ± 0.07 c | 1.16 ± 0.01 c | |
| T4 | 1.91 ± 0.13 e | 1.94 ± 0.07 e | 2.02 ± 0.04 e | 2.16 ± 0.07 e | 1.94 ± 0.12 k | 2.06 ± 0.09 i | 1.04 ± 0.05 e | 1.05 ± 0.07 e | |
| T5 | 1.98 ± 0.10 d | 2.01 ± 0.03 d | 2.09 ± 0.04 d | 2.23 ± 0.05 d | 1.95 ± 0.15 k | 2.07 ± 0.08 i | 1.07 ± 0.01 d | 1.08 ± 0.05 d | |
| T6 | 1.77 ± 0.08 f | 1.82 ± 0.02 f | 1.91 ± 0.07 f | 2.09 ± 0.03 f | 2.23 ± 0.16 e | 2.34 ± 0.09 de | 0.85 ± 0.04 g | 0.89 ± 0.06 g | |
| T7 | 1.89 ± 0.11 e | 1.94 ± 0.01 e | 2.03 ± 0.08 e | 2.21 ± 0.03 de | 2.09 ± 0.19 h | 2.20 ± 0.12 g | 0.97 ± 0.03 f | 1.00 ± 0.06 f | |
| T8 | 2.23 ± 0.05 a | 2.28 ± 0.03 a | 2.37 ± 0.09 a | 2.55 ± 0.07 a | 1.94 ± 0.16 k | 2.04 ± 0.14 i | 1.22 ± 0.02 a | 1.25 ± 0.03 a | |
| T9 | 2.18 ± 0.12 b | 2.23 ± 0.05 b | 2.32 ± 0.16 b | 2.50 ± 0.06 b | 1.95 ± 0.17 k | 2.07 ± 0.15 i | 1.18 ± 0.02 b | 1.20 ± 0.07 ab | |
| T10 | 2.17 ± 0.14 b | 2.22 ± 0.02 b | 2.31 ± 0.12 b | 2.49 ± 0.07 b | 1.95 ± 0.19 k | 2.06 ± 0.16 i | 1.18 ± 0.04 b | 1.20 ± 0.07 b | |
| F-test | |||||||||
| Main | ** | ** | ** | ** | ** | ** | ** | ** | |
| Sub main | ** | ** | ** | ** | ** | ** | ** | ** | |
| Interaction | ** | ** | ** | ** | ** | ** | ** | ** | |
| Treatments | DHA (mg TPF g−1 Soil Day−1) | Urease (NH4+- N g−1 Soil Day−1) | Amylase (mg Glucose g−1 soil h−1) | Invertase (mg Sucrose g−1 soil h−1) | |||||
|---|---|---|---|---|---|---|---|---|---|
| 2020 | 2021 | 2020 | 2021 | 2020 | 2021 | 2020 | 2021 | ||
| Without Gypsum | T1 | 89.36 ± 0.52 q | 101.86 ± 0.54 q | 42.36 ± 0.44 q | 44.66 ± 0.33 q | 0.123 ± 0.003 o | 0.131 ± 0.001 p | 0.014 ± 0.0004 p | 0.016 ± 0.0003 q |
| T2 | 91.91 ± 0.52 p | 104.41 ± 0.46 p | 44.91 ± 0.41 p | 47.21 ± 0.45 p | 0.140 ± 0.004 n | 0.148 ± 0.003 o | 0.016 ± 0.0004 o | 0.018 ± 0.0002 p | |
| T3 | 100.13 ± 1.45 n | 112.63 ± 1.49 n | 53.13 ± 0.33 n | 55.43 ± 0.36 n | 0.193 ± 0.005 i | 0.201 ± 0.003 j | 0.021 ± 0.0003 m | 0.023 ± 0.0004 n | |
| T4 | 94.35 ± 0.61 o | 106.85 ± 0.51 o | 47.35 ± 0.30 o | 49.65 ± 0.47 o | 0.156 ± 0.003 l | 0.164 ± 0.002 m | 0.017 ± 0.0004 n | 0.019 ± 0.0005 o | |
| T5 | 93.44 ± 0.26 o | 105.94 ± 1.06 o | 46.44 ± 0.22 o | 48.74 ± 0.16 o | 0.150 ± 0.002 m | 0.158 ± 0.003 n | 0.017 ± 0.0002 n | 0.019 ± 0.0007 o | |
| T6 | 101.84 ± 1.69 m | 116.95 ± 1.39 m | 58.84 ± 0.45 m | 62.24 ± 0.19 m | 0.149 ± 0.005 m | 0.154 ± 0.006 n | 0.021 ± 0.0006 m | 0.026 ± 0.0004 m | |
| T7 | 105.32 ± 1.58 l | 120.43 ± 1.08 l | 62.32 ± 0.46 l | 65.72 ± 0.89 l | 0.172 ± 0.004 k | 0.177 ± 0.002 l | 0.025 ± 0.0005 l | 0.030 ± 0.0008 l | |
| T8 | 118.12 ± 1.48 j | 133.23 ± 1.78 j | 75.12 ± 0.41 j | 78.52 ± 0.95 j | 0.256 ± 0.001 h | 0.261 ± 0.003 i | 0.037 ± 0.0004 j | 0.042 ± 0.0009 j | |
| T9 | 107.22 ± 1.40 k | 122.33 ± 1.80 k | 64.22 ± 0.36 k | 67.62 ± 0.59 k | 0.184 ± 0.003 j | 0.189 ± 0.002 k | 0.026 ± 0.0004 k | 0.031 ± 0.0003 k | |
| T10 | 105.10 ± 1.40 l | 122.21 ± 1.11 k | 64.10 ± 0.36 k | 65.50 ± 0.39 k | 0.183 ± 0.003 j | 0.188 ± 0.004 k | 0.026 ± 0.0004 k | 0.032 ± 0.0005 k | |
| With Gypsum | T1 | 133.17 ± 1.67 i | 143.05 ± 1.37 i | 94.17 ± 0.86 i | 96.05 ± 0.69 i | 0.260 ± 0.006 h | 0.269 ± 0.005 h | 0.052 ± 0.0009 i | 0.061 ± 0.0003 i |
| T2 | 134.27 ± 1.67 h | 144.15 ± 1.46 h | 95.27 ± 0.95 h | 97.15 ± 0.86 h | 0.268 ± 0.004 g | 0.277 ± 0.002 g | 0.054 ± 0.0009 h | 0.063 ± 0.0004 h | |
| T3 | 142.05 ± 2.89 e | 151.93 ± 1.99 e | 103.05 ± 1.64 e | 104.93 ± 0.99 e | 0.318 ± 0.006 c | 0.327 ± 0.004 c | 0.064 ± 0.0012 e | 0.073 ± 0.0011 e | |
| T4 | 137.57 ± 2.46 g | 147.45 ± 1.87 g | 98.57 ± 1.68 g | 100.45 ± 1.26 g | 0.289 ± 0.010 f | 0.298 ± 0.009 f | 0.058 ± 0.0019 g | 0.067 ± 0.0014 g | |
| T5 | 139.11 ± 2.55 f | 148.99 ± 2.15 f | 100.11 ± 1.35 f | 101.99 ± 1.25 f | 0.299 ± 0.004 e | 0.308 ± 0.003 e | 0.060 ± 0.0007 f | 0.069 ± 0.0003 f | |
| T6 | 158.00 ± 2.50 d | 168.66 ± 2.90 d | 124.00 ± 1.40 d | 125.96 ± 1.30 d | 0.289 ± 0.003 f | 0.299 ± 0.002 f | 0.072 ± 0.0008 d | 0.083 ± 0.0005 d | |
| T7 | 160.92 ± 3.76 c | 171.58 ± 3.06 c | 126.92 ± 1.66 c | 128.88 ± 1.76 c | 0.307 ± 0.005 d | 0.317 ± 0.007 d | 0.077 ± 0.0012 c | 0.088 ± 0.0009 c | |
| T8 | 169.58 ± 3.80 a | 180.24 ± 3.66 a | 135.58 ± 1.90 a | 137.54 ± 1.40 a | 0.360 ± 0.005 a | 0.370 ± 0.008 a | 0.090 ± 0.0012 a | 0.101 ± 0.0018 a | |
| T9 | 168.33 ± 3.38 b | 178.99 ± 2.74 b | 134.33 ± 1.88 b | 136.29 ± 1.18 b | 0.352 ± 0.002 b | 0.362 ± 0.007 b | 0.088 ± 0.0006 b | 0.099 ± 0.0016 b | |
| T10 | 167.92 ± 3.38 b | 178.58 ± 2.85 b | 133.92 ± 1.98 b | 135.88 ± 2.08 b | 0.349 ± 0.002 b | 0.359 ± 0.010 b | 0.087 ± 0.0006 b | 0.098 ± 0.0012 b | |
| F-test | |||||||||
| Main | ** | ** | ** | ** | ** | ** | ** | ** | |
| Sub main | ** | ** | ** | ** | ** | ** | ** | ** | |
| Interaction | ** | ** | ** | ** | ** | ** | ** | ** | |
| Treatments | EC (dS m−1) | ESP (%) | CEC (Cmole kg−1) | ||||
|---|---|---|---|---|---|---|---|
| 2020 | 2021 | 2020 | 2021 | 2020 | 2021 | ||
| Without Gypsum | T1 | 8.61 ± 0.28 a | 7.26 ± 0.48 a | 16.64 ± 0.51 a | 16.59 ± 0.66 a | 35.97 ± 0.28 k | 36.17 ± 0.18 m |
| T2 | 8.60 ± 0.49 b | 7.22 ± 0.67 b | 16.61 ± 0.72 b | 16.55 ± 0.45 b | 35.99 ± 0.29 k | 36.19 ± 0.17 lm | |
| T3 | 8.59 ± 0.39 b | 7.22 ± 0.58 b | 16.59 ± 0.62 b | 16.53 ± 0.46 bc | 36.12 ± 0.29 i | 36.21 ± 0.18 kl | |
| T4 | 6.60 ± 0.41 b | 7.20 ± 0.68 c | 11.60 ± 0.64 bc | 16.52 ± 0.86 cd | 36.18 ± 0.23 ef | 36.22 ± 0.28 k | |
| T5 | 8.59 ± 0.53 b | 7.20 ± 0.69 c | 16.58 ± 0.76 c | 16.50 ± 0.87 d | 36.15 ± 0.23 fgh | 36.22 ± 0.39 k | |
| T6 | 8.57 ± 0.48 c | 7.18 ± 0.57 d | 16.61 ± 0.71 bc | 16.53 ± 0.75 bc | 36.17 ± 0.28 efg | 36.27 ± 0.37 j | |
| T7 | 8.56 ± 0.38 d | 7.15 ± 0.59 e | 16.58 ± 0.61 c | 16.51 ± 0.77 cd | 36.18 ± 0.28 e | 36.33 ± 0.29 hi | |
| T8 | 8.55 ± 0.36 d | 7.15 ± 0.49 e | 16.57 ± 0.59 c | 16.38 ± 0.67 e | 36.21 ± 0.26 d | 36.53 ± 0.19 e | |
| T9 | 8.55 ± 0.58 d | 7.14 ± 0.33 e | 16.58 ± 0.81 c | 16.35 ± 0.51 f | 36.23 ± 0.28 d | 36.58 ± 0.23 d | |
| T10 | 8.55 ± 0.39 d | 7.14 ± 0.61 e | 16.58 ± 0.62 c | 16.36 ± 0.79 f | 36.24 ± 0.29 d | 36.59 ± 0.15 d | |
| With Gypsum | T1 | 6.63 ± 0.58 e | 6.11 ± 0.58 f | 11.81 ± 0.81 d | 11.55 ± 0.76 g | 35.99 ± 0.28 jk | 36.31 ± 0.18 i |
| T2 | 6.62 ± 0.47 ef | 6.02 ± 0.69 g | 11.70 ± 0.70 e | 11.40 ± 0.57 h | 36.01 ± 0.27 j | 36.36 ± 0.29 h | |
| T3 | 6.61 ± 0.58 fg | 5.97 ± 0.69 h | 11.60 ± 0.81 f | 11.34 ± 0.87 i | 36.15 ± 0.28 gh | 36.44 ± 0.39 g | |
| T4 | 6.60 ± 0.68 g | 5.96 ± 0.71 hi | 11.60 ± 0.91 f | 11.31 ± 0.89 j | 36.18 ± 0.28 e | 36.47 ± 0.40 f | |
| T5 | 6.60 ± 0.49 g | 5.96 ± 0.53 i | 11.59 ± 0.72 f | 11.25 ± 0.71 k | 36.17 ± 0.29 ef | 36.49 ± 0.23 f | |
| T6 | 6.07 ± 0.27 h | 5.02 ± 0.58 j | 11.43 ± 0.50 g | 11.30 ± 0.56 j | 37.57 ± 0.27 c | 39.50 ± 0.18 c | |
| T7 | 6.00 ± 0.49 i | 4.98 ± 0.61 k | 11.38 ± 0.72 h | 11.18 ± 0.79 l | 37.61 ± 0.29 b | 39.58 ± 0.33 b | |
| T8 | 5.97 ± 0.39 j | 4.86 ± 0.66 l | 11.30 ± 0.62 i | 10.84 ± 0.84 m | 37.67 ± 0.29 a | 39.79 ± 0.36 a | |
| T9 | 5.96 ± 0.33 j | 4.86 ± 0.38 l | 11.28 ± 0.56 i | 10.81 ± 0.56 n | 37.68 ± 0.23 a | 39.80 ± 0.28 a | |
| T10 | 5.97 ± 0.61 j | 4.86 ± 0.59 l | 11.28 ± 0.54 i | 10.81 ± 0.77 n | 37.69 ± 0.26 a | 39.79 ± 0.39 a | |
| F-test | |||||||
| Main | ** | ** | ** | ** | ** | ** | |
| Sub main | ** | ** | ** | ** | ** | ** | |
| Interaction | ** | ** | ** | ** | ** | ** | |
| Treatments | Ear Length (cm) | Ear Diameter (cm) | 100-Grain Weight (g) | Grain Yield (kg ha−1) | |||||
|---|---|---|---|---|---|---|---|---|---|
| 2020 | 2021 | 2020 | 2021 | 2020 | 2021 | 2020 | 2021 | ||
| Without Gypsum | T1 | 16.82 ± 1.78 o | 16.91 ± 1.10 o | 4.21 ± 0.52 n | 4.24 ± 0.22 n | 31.54 ± 1.18 n | 32.94 ± 1.11 n | 5361.80 ± 39.16 n | 5376.00 ± 91.49 o |
| T2 | 17.30 ± 1.10 n | 17.39 ± 1.12 n | 4.33 ± 0.32 m | 4.36 ± 0.19 m | 32.44 ± 3.18 m | 33.84 ± 1.14 m | 5514.80 ± 61.46 m | 5529.10 ± 71.16 n | |
| T3 | 18.85 ± 2.08 j | 18.94 ± 1.78 j | 4.71 ± 0.22 h | 4.74 ± 0.34 h | 35.34 ± 1.16 h | 36.74 ± 2.35 i | 6007.80 ± 66.99 i | 6022.50 ± 76.57 j | |
| T4 | 17.76 ± 1.10 l | 17.85 ± 1.70 l | 4.44 ± 0.62 k | 4.47 ± 0.29 k | 33.30 ± 1.18 k | 34.70 ± 1.29 k | 5661.00 ± 70.60 k | 5676.50 ± 53.39 l | |
| T5 | 17.59 ± 2.05 m | 17.68 ± 1.95 m | 4.40 ± 0.81 l | 4.43 ± 0.46 l | 32.98 ± 1.09 l | 34.38 ± 2.48 l | 5606.60 ± 55.58 l | 5621.20 ± 64.60 m | |
| T6 | 18.22 ± 2.12 k | 18.33 ± 1.62 k | 4.34 ± 0.93 m | 4.38 ± 0.59 m | 33.23 ± 2.22 k | 34.89 ± 2.95 k | 5815.60 ± 79.12 j | 5840.40 ± 69.10 k | |
| T7 | 18.85 ± 2.10 j | 18.96 ± 2.00 j | 4.49 ± 0.72 j | 4.53 ± 0.52 j | 34.37 ± 3.19 j | 36.03 ± 2.49 j | 6014.52 ± 53.15 i | 6039.82 ± 63.59 j | |
| T8 | 21.14 ± 1.09 h | 21.25 ± 1.39 h | 5.03 ± 0.12 de | 5.07 ± 0.79 de | 38.54 ± 3.16 e | 40.20 ± 2.48 f | 6745.08 ± 47.31 f | 6770.28 ± 87.34 g | |
| T9 | 19.19 ± 2.07 i | 19.30 ± 2.00 i | 4.57 ± 0.72 i | 4.61 ± 0.87 i | 34.99 ± 3.13 i | 36.65 ± 1.59 i | 6123.02 ± 62.59 h | 6148.32 ± 92.69 i | |
| T10 | 19.16 ± 1.07 i | 19.27 ± 2.04 i | 4.56 ± 0.32 i | 4.60 ± 0.28 i | 34.95 ± 3.13 i | 36.61 ± 2.96 i | 6115.78 ± 72.59 h | 6140.28 ± 62.78 i | |
| With Gypsum | T1 | 21.79 ± 2.11 g | 21.92 ± 1.91 g | 4.95 ± 0.62 f | 5.00 ± 0.49 f | 39.79 ± 2.16 c | 41.57 ± 1.91 c | 7161.60 ± 58.99 c | 7190.10 ± 86.67 c |
| T2 | 21.97 ± 1.11 f | 22.10 ± 1.18 f | 4.99 ± 0.52 e | 5.04 ± 0.47 e | 36.12 ± 3.13 g | 37.90 ± 1.39 h | 6501.12 ± 73.98 g | 6530.62 ± 29.91 h | |
| T3 | 23.24 ± 3.15 c | 23.37 ± 2.11 c | 5.28 ± 0.83 a | 5.33 ± 0.36 a | 36.07 ± 3.13 g | 37.85 ± 1.49 h | 6493.44 ± 53.98 g | 6522.74 ± 56.98 h | |
| T4 | 22.51 ± 2.24 e | 22.64 ± 1.04 e | 5.12 ± 0.85 c | 5.17 ± 0.27 c | 38.74 ± 3.20 e | 40.52 ± 1.69 e | 6973.44 ± 35.19 e | 7002.94 ± 59.09 f | |
| T5 | 22.76 ± 2.09 d | 22.89 ± 2.27 d | 5.17 ± 0.92 b | 5.22 ± 0.49 b | 39.06 ± 2.20 d | 40.84 ± 2.97 d | 7031.04 ± 65.19 d | 7060.34 ± 78.69 e | |
| T6 | 22.12 ± 2.07 f | 22.26 ± 1.47 f | 4.71 ± 0.31 h | 4.77 ± 0.64 h | 37.92 ± 3.12 f | 39.72 ± 3.59 g | 6939.36 ± 41.96 e | 6973.76 ± 77.86 f | |
| T7 | 22.53 ± 3.11 e | 22.67 ± 2.81 e | 4.79 ± 0.52 g | 4.85 ± 0.78 g | 38.62 ± 3.18 e | 40.42 ± 2.49 e | 7067.46 ± 33.54 d | 7101.96 ± 89.74 d | |
| T8 | 23.74 ± 3.11 a | 23.88 ± 2.91 a | 5.05 ± 0.72 d | 5.11 ± 0.97 d | 40.70 ± 4.19 a | 42.50 ± 3.98 a | 7448.10 ± 35.30 a | 7482.30 ± 93.80 a | |
| T9 | 23.57 ± 3.05 b | 23.71 ± 2.25 b | 5.01 ± 0.71 de | 5.07 ± 0.59 de | 40.40 ± 3.09 b | 42.20 ± 3.93 b | 7393.20 ± 56.77 b | 7427.60 ± 69.07 b | |
| T10 | 23.51 ± 2.05 b | 23.65 ± 1.85 b | 5.00 ± 0.21 e | 5.06 ± 0.87 e | 40.30 ± 4.29 b | 42.10 ± 2.92 b | 7374.90 ± 86.77 b | 7408.50 ± 47.17 b | |
| F-test | |||||||||
| Main | ** | ** | ** | ** | ** | ** | ** | ** | |
| Sub main | ** | ** | ** | ** | ** | ** | ** | ** | |
| Interaction | ** | ** | ** | ** | ** | ** | ** | ** | |
Publisher’s Note: MDPI stays neutral with regard to jurisdictional claims in published maps and institutional affiliations. |
© 2022 by the authors. Licensee MDPI, Basel, Switzerland. This article is an open access article distributed under the terms and conditions of the Creative Commons Attribution (CC BY) license (https://creativecommons.org/licenses/by/4.0/).
Share and Cite
Amer, M.M.; Elbagory, M.; El-Nahrawy, S.; Omara, A.E.-D. Impact of Gypsum and Bio-Priming of Maize Grains on Soil Properties, Physiological Attributes and Yield under Saline–Sodic Soil Conditions. Agronomy 2022, 12, 2550. https://doi.org/10.3390/agronomy12102550
Amer MM, Elbagory M, El-Nahrawy S, Omara AE-D. Impact of Gypsum and Bio-Priming of Maize Grains on Soil Properties, Physiological Attributes and Yield under Saline–Sodic Soil Conditions. Agronomy. 2022; 12(10):2550. https://doi.org/10.3390/agronomy12102550
Chicago/Turabian StyleAmer, Megahed M., Mohssen Elbagory, Sahar El-Nahrawy, and Alaa El-Dein Omara. 2022. "Impact of Gypsum and Bio-Priming of Maize Grains on Soil Properties, Physiological Attributes and Yield under Saline–Sodic Soil Conditions" Agronomy 12, no. 10: 2550. https://doi.org/10.3390/agronomy12102550