Article

The Influence of Flag Leaf Removal and Its Characteristics on Main Yield Components and Yield Quality Indices on Wheat

1
Department of Wheat Breeding, Agricultural Research and Development Station, 400100 Turda, Romania
2
Department of Genetics, Faculty of Agriculture, University of Agricultural Sciences and Veterinary Medicine, 400372 Cluj-Napoca, Romania
3
Food Sciences Department, Faculty of Food Sciences and Technology, University of Agricultural Sciences and Veterinary Medicine, 400372 Cluj-Napoca, Romania
4
Department of Plant Breeding, Faculty of Agriculture, University of Agricultural Sciences and Veterinary Medicine, 400372 Cluj-Napoca, Romania
*
Authors to whom correspondence should be addressed.
Agronomy 2022, 12(10), 2545; https://doi.org/10.3390/agronomy12102545
Submission received: 9 September 2022 / Revised: 11 October 2022 / Accepted: 13 October 2022 / Published: 18 October 2022

Abstract

:
The flag leaf can be an important vehicle for high grain yield due to its position and photosynthetic characteristics. To identify the most adaptive and stable yielding genotype, three winter wheat genotypes were studied during two experimental years under field conditions to quantify the influence of flag leaf removal in different phenological stages on the grain yield and grain quality. To quantify the influence of the flag leaf on the main yield components, the flag leaf was removed every 7 days, starting from the booting stage to ripening. Chlorophyll a, chlorophyll b, and carotenoids were determined from the removed leaves. As a complex trait, the number of grains/spikes and the weight of the grains/spikes were highly influenced by the flag leaf removal during the early generative stages, causing a yield loss from 9% to more than 40%, depending on the variety. It was established that the photosynthetic pigments were highly influenced by the plant phenology stages and the environmental conditions, especially carotenoids, which act as photoprotective and antioxidant agents under stress conditions. Regarding grain quality, flag leaf removal had a significant influence on the accumulation of grain protein and the wet gluten content, the variability of these quantitative traits being also influenced by the climatic conditions.

1. Introduction

Wheat is one of the ancient crops cultivated for human consumption, being a basic source of carbohydrates and proteins [1]. Cereals, such as wheat, will continue to play a critical role in ensuring an adequate and affordable intake of calories and proteins [2]. The current breeding programs in wheat production of around 1–2.5% per year are not in keeping with the rate of yield growth required to achieve the target of doubling crop production by 2050 [3,4]. Extreme temperature fluctuations during the critical growth stages (such as anthesis and the grain-filling stage) cause serious yield losses in most wheat-producing areas [5]. To meet food needs, agricultural research and other related sciences try to minimize or eliminate any other stress factors that limit production potential. On the other hand, knowledge of the intrinsic mechanisms of the plant and how they interact can have a high effect on plant productivity. Fighting against these stress factors is, however, complex due to how interrelated they are [6], with the major challenge being to understand how these plants react to different stressors, the diversity of response pathways elicited by them, and their genetic determination [7,8,9].
The leaf is the major organ involved in light perception and the conversion of solar energy into organic carbon [10,11]. Cereal flag leaf traits have been much better studied under normal irrigated conditions, and that understanding has led to appreciating their possible role in grain filling under drought conditions [12]. The physiological, morphological, and biochemical traits of flag leaves play important roles in determining crop grain yield and biomass [13]. The contribution rate of flag leaves to daily photosynthetic products varies from 50% to 60% [14,15,16], while its defoliation generated grain yield losses of 18% to 30% [17,18]. In wheat, the defoliation of the flag leaf blade increased the contribution of assimilates to the grain from the stem and the chaff under normal conditions [19], and the removal of these affected the grain yields under normal or water-limiting conditions [20]. Saeedipour and Moradi [21] showed that the net CO2 assimilation rate in flag leaves under water deficit was highly correlated with the drought tolerance of wheat plants. Additionally, flag leaf characteristics had heritability greater than 0.70 for all traits [22].
The flag leaf is the main component of the canopy in the middle and late growth stages of winter wheat [23] and is an important organ that determines the grain-filling rate and the final yield [24,25]. The importance of this leaf is given by its position and freshness [26]. Drought, one of the environmental stresses, is the most significant factor restricting plant production in the majority of agricultural fields of the world [27,28]. The grain-filling stage is one of the most important plant stages, with a high impact on grain yield, which is crucial for yield formation [29,30,31,32]. During the grain-filling stage, drought stress accelerates the accumulation of reactive oxygen species, the decomposition of chloroplasts and reduces the accumulation of assimilates in wheat flag leaves [33].
The optical properties of the leaves in the photosynthetically active radiation region depend on a number of factors, such as the conditions of the radiation, species, leaf thickness, leaf surface structure, the chlorophyll and carotenoid content of leaves, and the dry matter content per leaf unit area and the leaf’s internal structure [34].
Chlorophylls and carotenoids are photosynthetic pigments capable of absorbing light, transmitting energy to the photochemical and biochemical phases of photosynthesis, and accumulating chemical energy that is stored as sugar [35]. Determination of chlorophyll content as an indirect method of estimating the productivity of vegetation represents a good way to gain an understanding of the photosynthetic regime of plants [36]. Chlorophyll a (Chl a) and chlorophyll b (Chl b) are the predominant forms of chlorophyll in higher plants that play a key role as primary photosynthetic pigments that allow the plants to absorb energy from light [37].
Carotenoids are a group of isoprenoid compounds comprising a wide range of structures [38,39]. In photosynthetic tissues, carotenoids act as accessory light-harvesting pigments and extend the range of light absorption, and they also play a very important role in photoprotection [40,41,42].
High temperature is one of the main abiotic constraints on cereal yield [43], particularly during reproductive development [44]. In wheat, high temperature during anthesis decreased floret fertility by affecting the morphology and functions of pollen and pistil [45,46]. Moreover, high temperature during the grain-filling stage has been shown to decrease the grain yield through individual grain weight [47,48,49].
In heat-susceptible wheat genotypes, heat stress during reproductive development reduces photosynthesis and promotes premature senescence [44], photosynthesis is highly sensitive to high temperatures, and heat damage leads to cellular energy imbalance [49]. The need to understand flag leaf characteristics better for its role in grain filling under drought conditions assumes increased significance [12].
The aims of this research were to (1) quantify the role and contribution of the flag leaf on grain yield formation and grain quality, (2) determine the dynamics of photosynthetic pigments in flag leaves during the main grain yield formation stages, and (3) identify the relationship between the studied traits under different stress conditions.

2. Materials and Methods
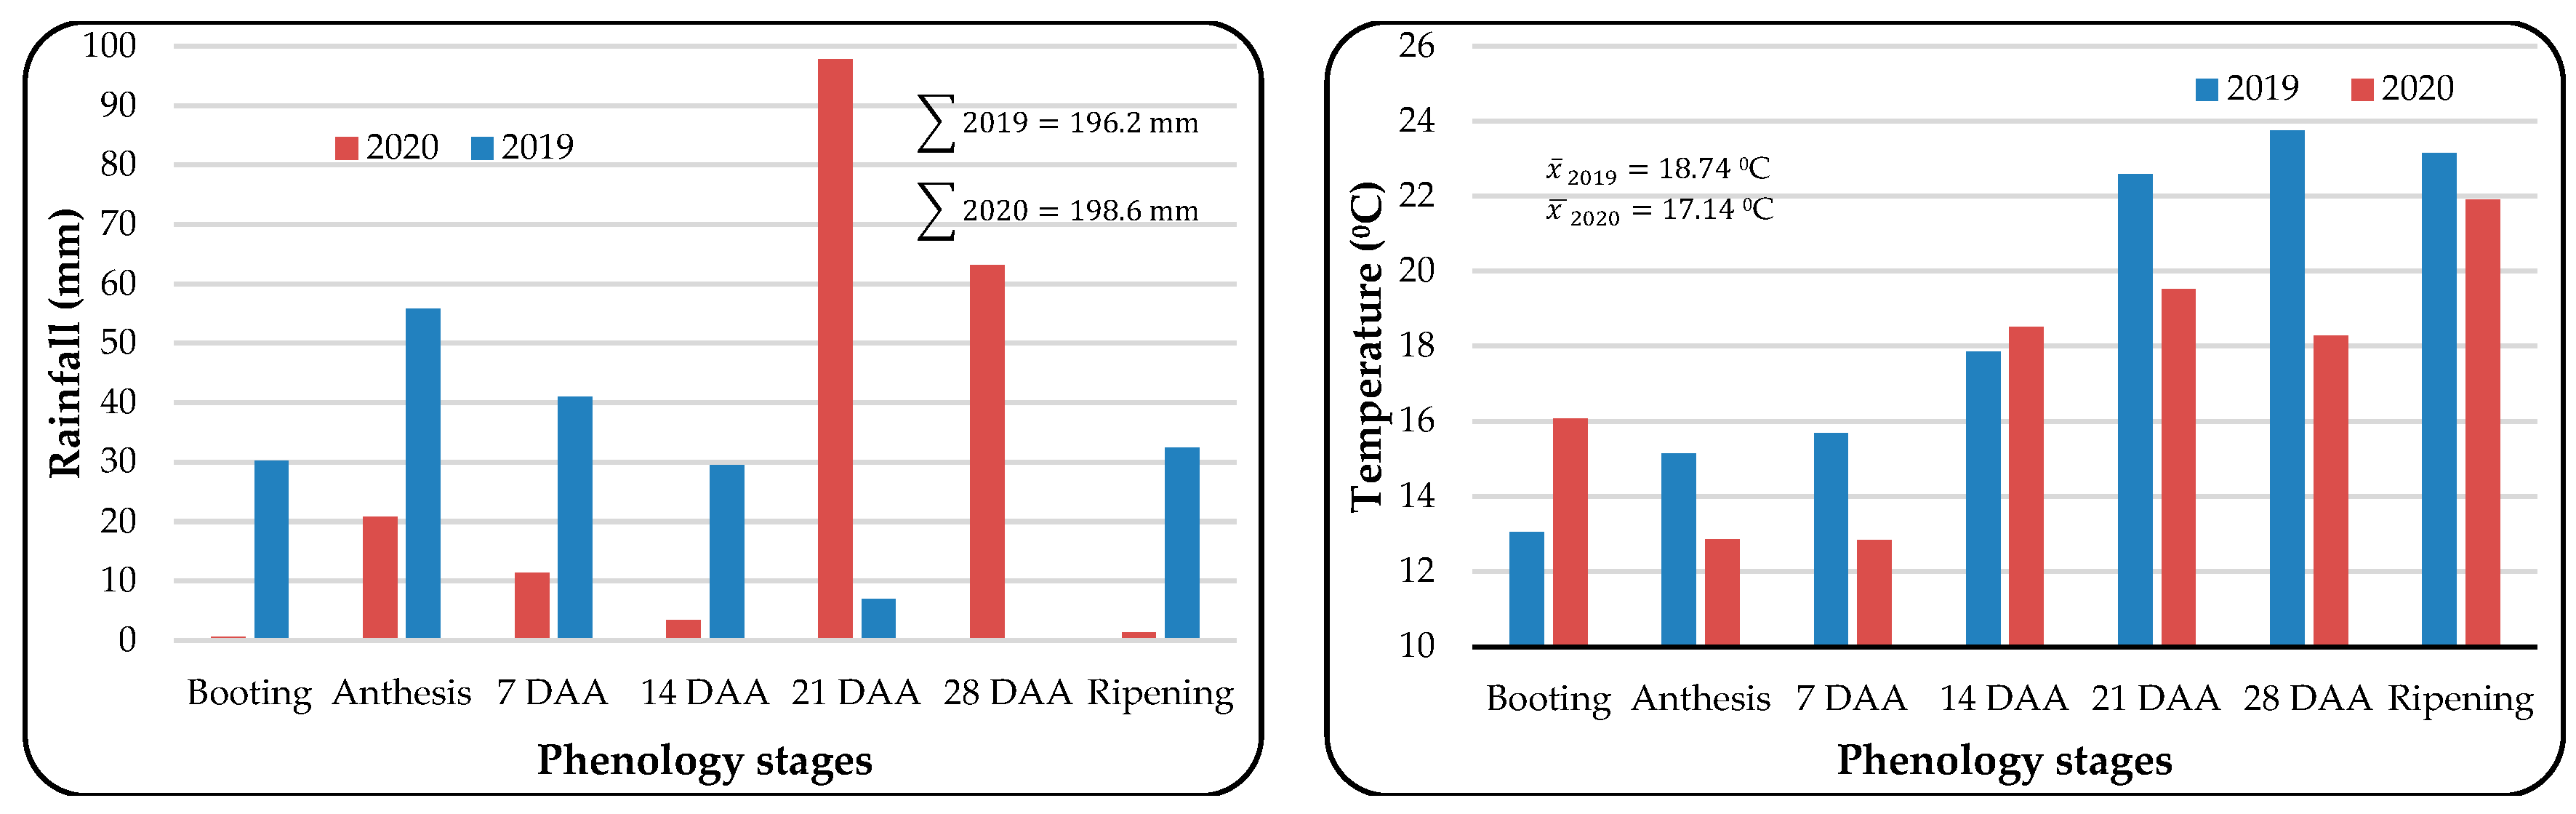
Three Romanian winter wheat genotypes were studied under field conditions at the Agricultural Research and Development Station (ARDS) from Turda for two consecutive years (2018/2019; 2019/2020) to estimate the flag leaves and their contribution to the final grain yield. The biological material was selected from a group of mixed autochthone and foreign winter wheat genotypes based on their adaptability to local conditions and due to the wide use of these genotypes in Romanian agriculture. The Ciprian variety is an intensive winter wheat variety created at ARDS Lovrin with a high yield capacity and superior yield quality. Additionally, the Andrada and Codru varieties are two of the newest winter wheat genotypes created at ARDS Turda, which are characterized by high adaptability to unfavorable conditions, high grain yield, and quality. These three genotypes occupy a considerable area yearly in the North-West area of Romania.

Climatic Conditions

During the experimental years (2018–2019; 2019–2020), the climatic conditions were different, especially for the repartition of rainfall; the sum of precipitation is almost the same (Figure 1). For the first experimental year, the level of precipitation registered in the early analyzed stages (from the booting stage to 14 days after anthesis-DAA) had a positive impact on the main grain yield components. After this period, the rainfall conditions were deficient, considering the high needs of the plants to achieve the formation and filling of the grains. For the second experimental year, the rainfall conditions were in opposition to those of the previous year, with a low level of precipitation from booting to 14 DAA followed by a high level of rainfall at 21 DAA and 28 DAA. In this regard, the wheat plants encountered difficulties in the first phases of development (from booting to 14 DAA), and after this period, the rainfall level was more than favorable.
For the first experimental year, the average temperature was higher at 1.6 °C than in the second experimental year. The first experimental year can be characterized as normal until 14 DAA, which was followed by a period with high temperatures that had a negative influence on the plant’s physiological attributes with effects on grain accumulation. As in the case of precipitation, the temperatures of the second experimental year conditions were different from the first one, as they were characterized by short alternating periods of high temperatures with those of low temperatures. This alternation also had a negative effect on the generative stages, early grain formation stages, and the accumulation of grain components.
The experimental plots were established on the optimal sowing date for winter wheat (the second half of October) in three repetitions; each plot was 14.4 m2 (11.5 × 1.25) and had a sowing rate of 550 seeds/m2. Basic fertilization was applied before the plant sowing at a rate of 50:50:0 kg/ha NPK. A single crop protection treatment was applied (herbicide + insecticide + fungicide) against weeds, diseases, and pests during the stem elongation stage. From each plot, 30 plants were selected whose flag leaves were removed, and these were analyzed for the yield characteristics (number of grains/spike and weight of grains/spike), yield quality (protein and wet gluten content), and photosynthetic leaf pigments (Chl a, Chl b, and the total carotenoids).
The flag leaves were removed at the ligule level every 7 days, from booting to physiological maturity. They were cut into small pieces, sealed in polyethylene bags, weighed, and stored at −20 °C until analysis.
The pigment extraction was accomplished using acetone, followed by vacuum filtration and a spectrophotometric assessment using a T80+ UV/VIS spectrophotometer (PG Instruments Ltd., Leicestershire, UK), the absorbance of the leaf extracts was measured at 470 nm, 646 nm, and 663 nm [50]. All of the determinations were accomplished in triplicate, and the mean values were reported. The dry matter (DM) content was determined by over-drying at 105 °C (4 h) using an SLW 53 programmable forced-air convection oven (POL-EKO-Aparatura, Wodzisław Śląski, Poland). The weighing was accomplished using a KERN 573-34 NM analytical balance (Kern & Sohn GmbH, Bahlingen-Frommern, Germany).
The grain-quality indices were obtained using a Tango spectrometer (Bruker, Germany), and the equipment was calibrated to provide the grain-quality data from the intact grains.
The experimental results were statistically analyzed using ANOVA PoliFact Soft, 2015 and Microsoft Excel software.

3. Results

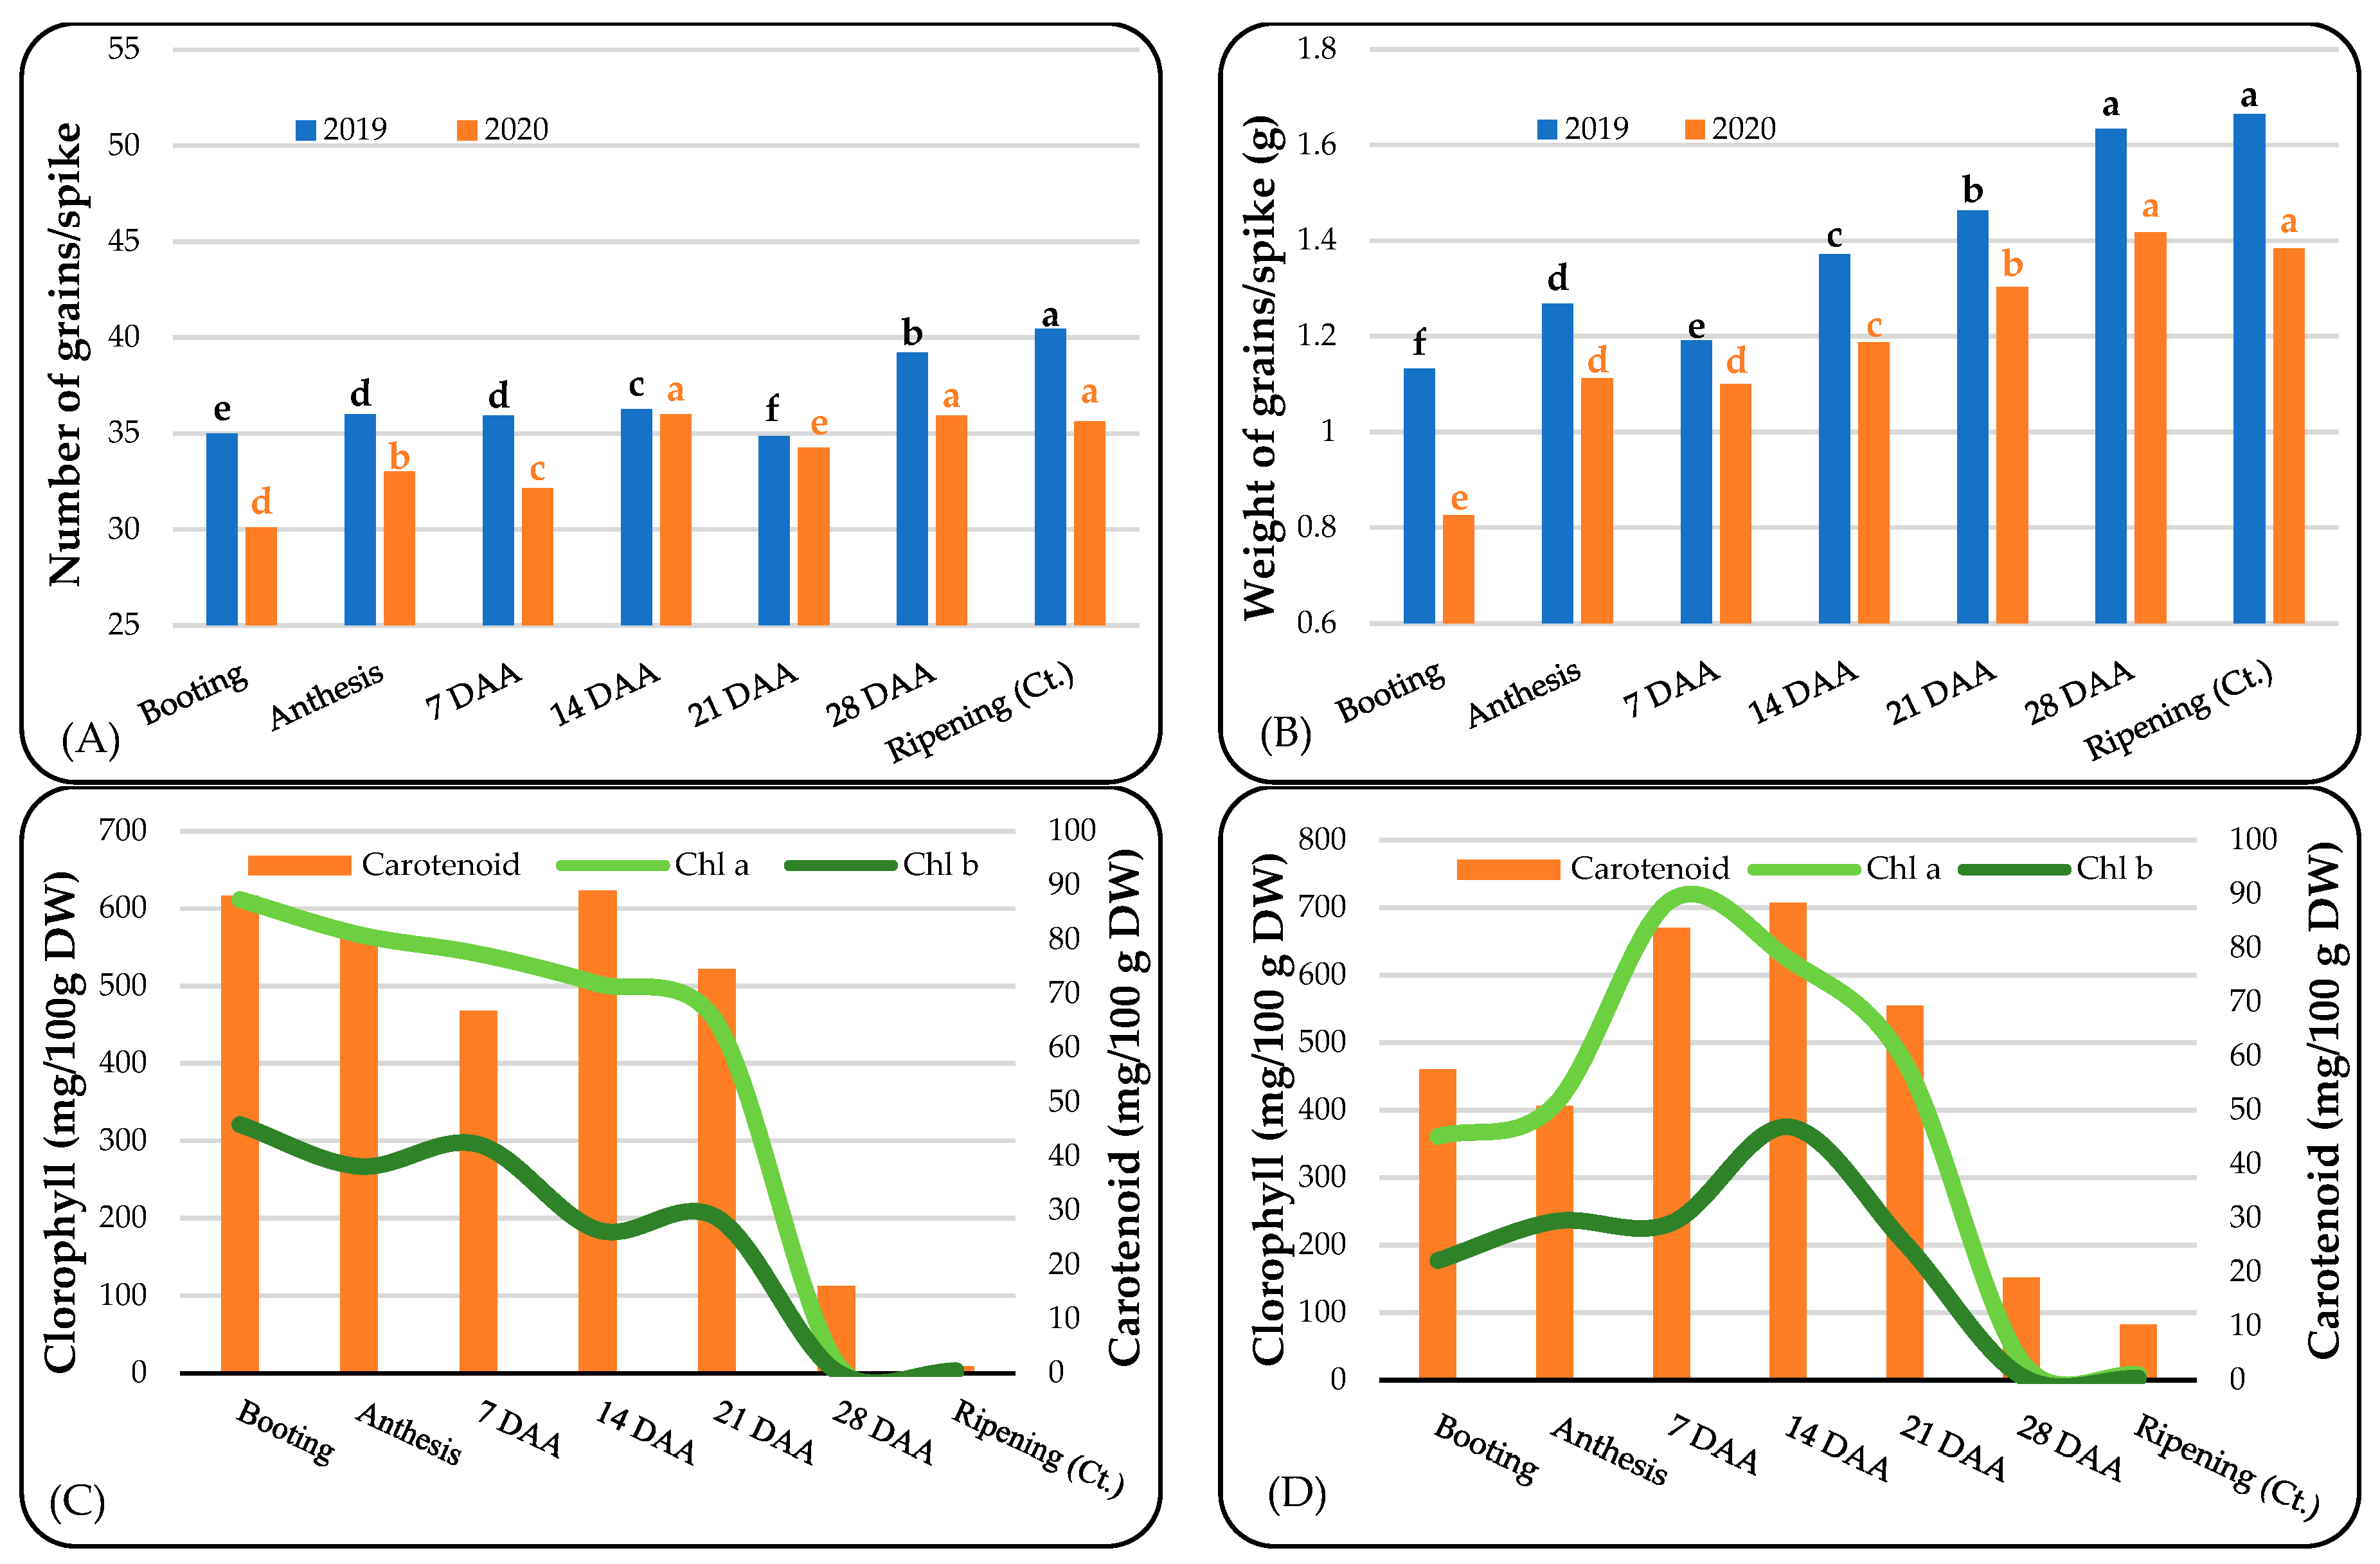
3.1. Yield Components and Photosynthetic Pigments
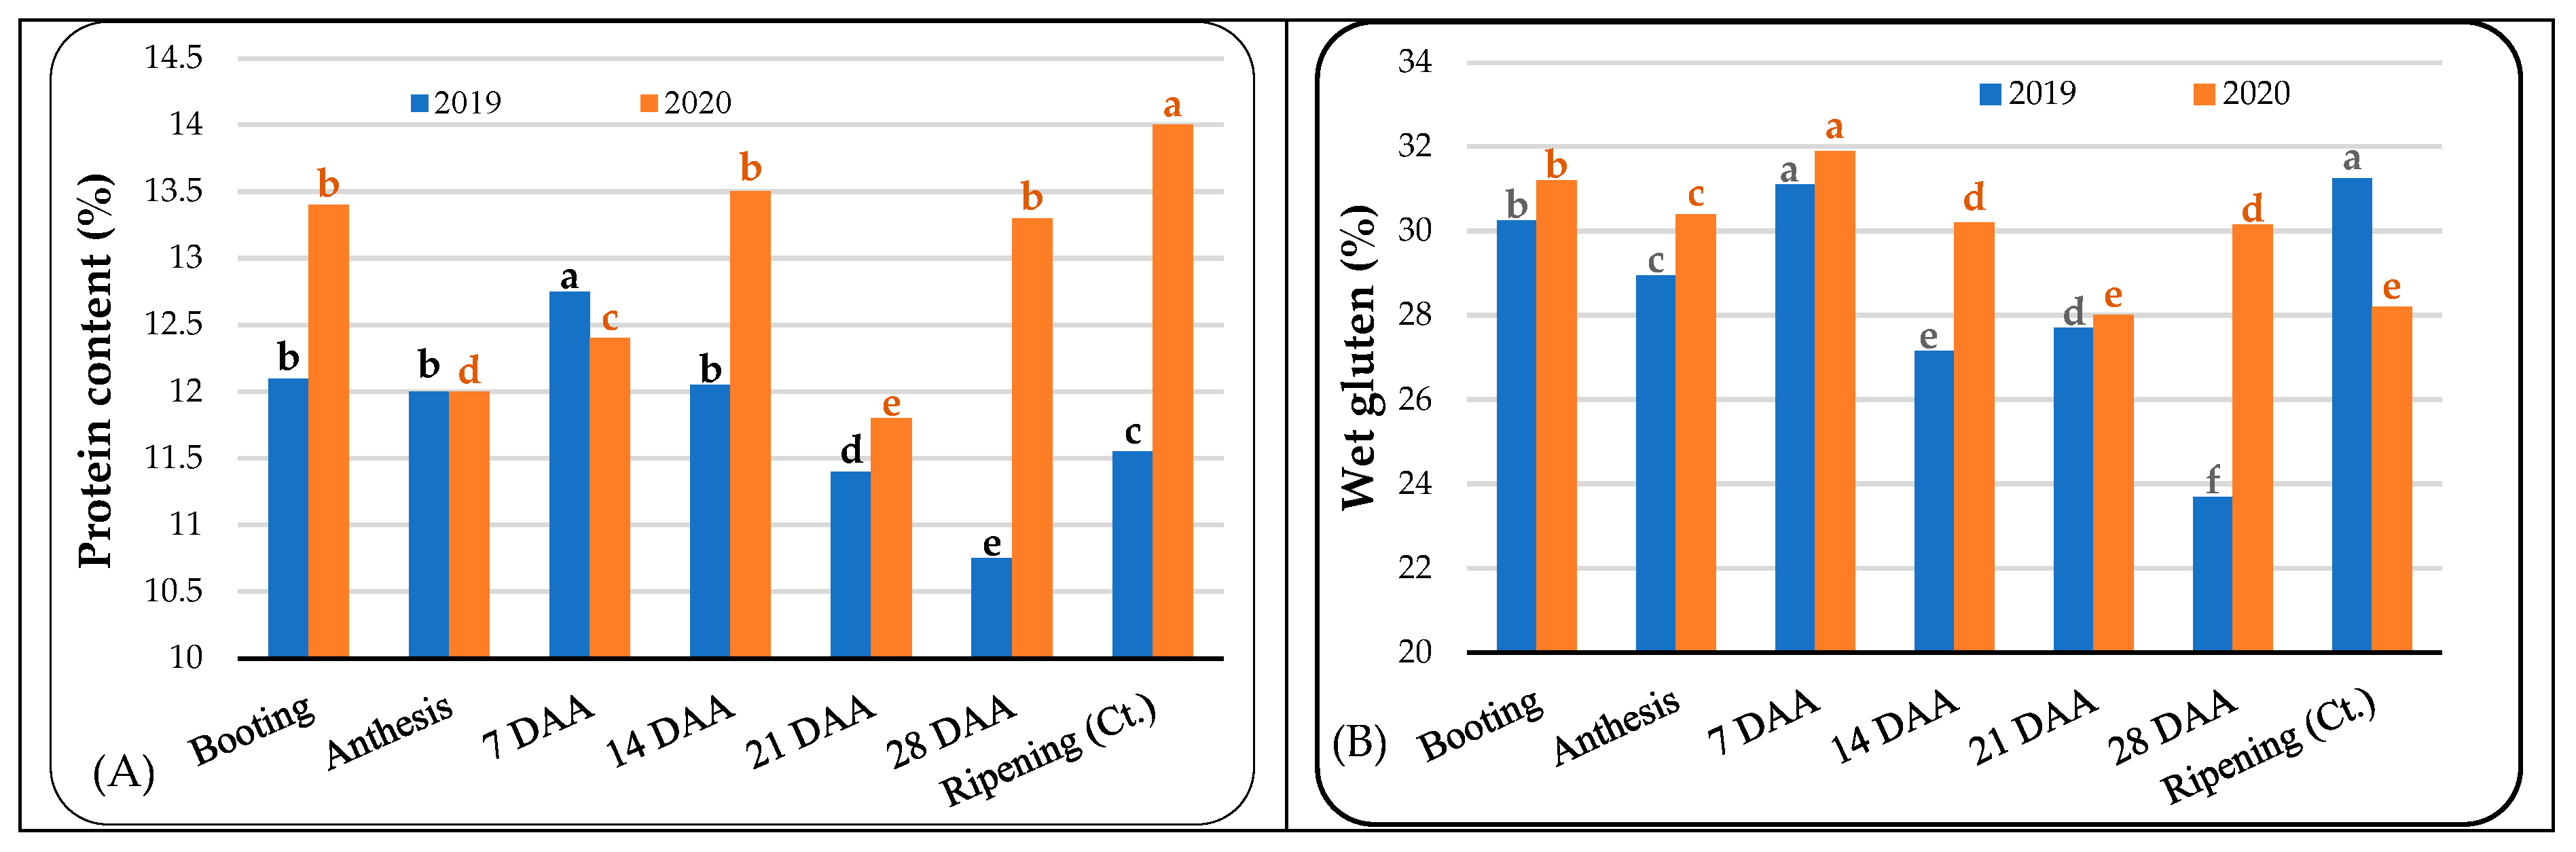
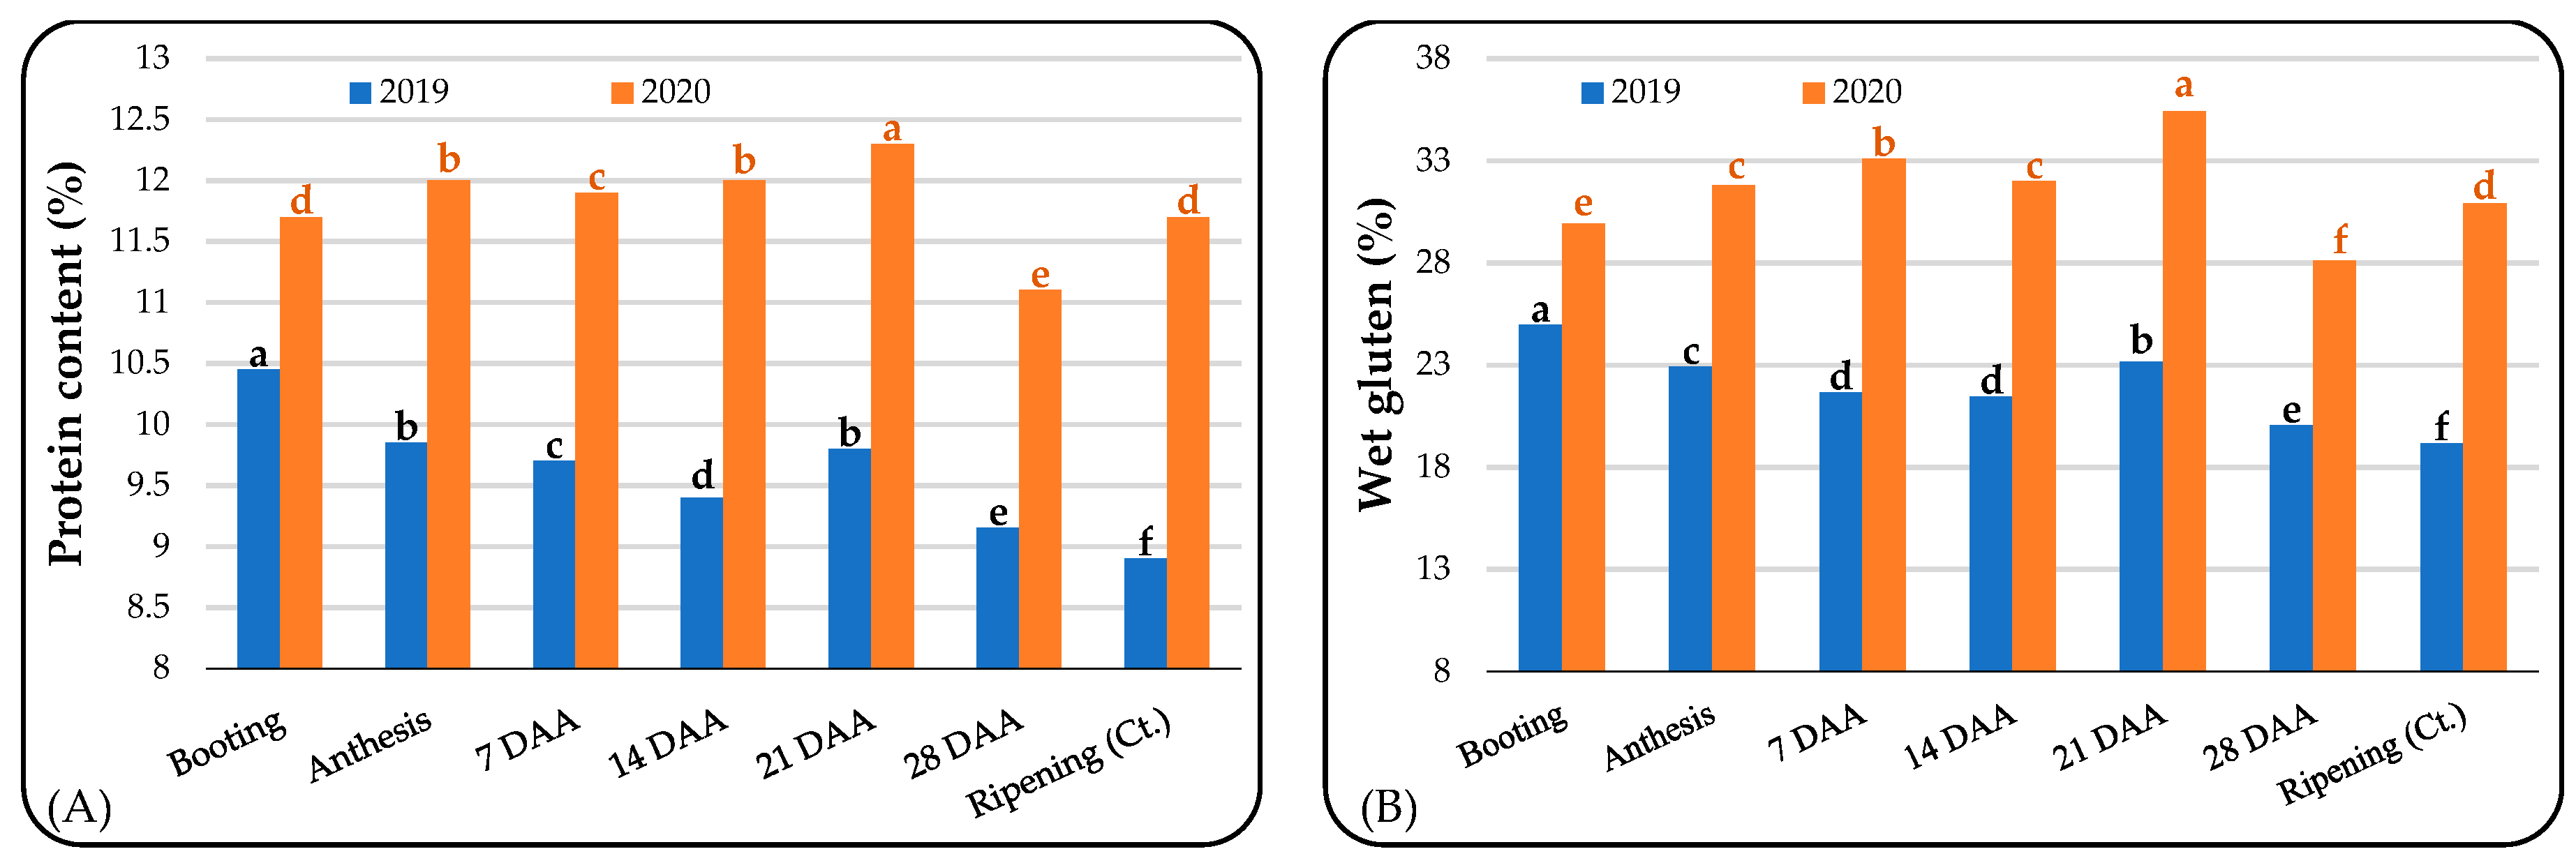
ANOVA showed the significant influence of flag leaf removal on the main yield components and photosynthetic pigments (Table 1). Grain number/spike (NGS) and weight of grain/spike (WGS), as two of the main yield components with a complex genetic determinism, are significantly influenced by climatic conditions, plant phenology stages, and the interaction between those for all of the studied genotypes. In the case of flag leaf photosynthetic pigments, the climatic conditions show no significant differences for these, except for the flag leaf carotenoid content in the case of the Codru variety. Regarding the plant vegetation stages of flag leaf removal, these showed significant differences between the time of flag leaf removal and the interaction of A × B.
As a consequence of flag leaf removal, the main yield components reacted by decreasing the number of grains/spikes and reducing the weight of the grains/spikes. The reaction of the wheat plants was different in the two experimental years (Figure 2A,B), which was caused by the climatic conditions that amplified the stress caused by flag leaf removal.
In the first experimental year, for the Ciprian variety, the removal of the flag leaf starting from the booting stage to 21 days after anthesis determined a decreasing number of grains per spike between 10.4 and 14% compared with the control plants, and the unfavorable climatic conditions exacerbated this decrease (Figure 2A). For the second experimental year, the removal of the flag leaf at the booting stage led to a decrease in the number of grains/spikes by 8% compared with the control plants. Flag leaf removal at the booting stage (2019) caused a decrease in the grain weight per spike by almost 32%, from 1.66 g/spike in the control plants to 1.13 g/spike in the booting stage (Figure 2B). Furthermore, this flag removal had a negative influence on the weight of the grains/spike characteristics, causing a decrease by ~43% compared with the control plants in the second experimental year.
Regarding the biochemical compounds that had a crucial role in photosynthesis and plant protection, the total carotenoid content of the flag leaf had a maximum concentration at the booting stage (88.02 mg/100 g DM) and 14 days after anthesis (88.96 mg/100 g DM) for the first experimental year (Figure 2C). Chl a had a maximum concentration in the flag leaves during the booting stage (566.44 mg/100 g DM), the concentration of these pigments subsequently having a continuous slight decrease until 21 days after anthesis (451.71 mg/100 g DM) followed by a major decrease after this period. Chl b had a similar variation to Chl a, with a slight variation at anthesis and 14 days after anthesis.
A specific variation in the photosynthetic pigments can also be observed for the Ciprian variety in the second experimental year (Figure 2D); the highest carotenoid content (88.40 mg/100 g DM) and Chl b content (375.35 mg/100 g DM) were registered 14 days after anthesis, while the maximum Chl a content was recorded 7 days earlier (623.79 mg/100 g DM).
A high number of grains/spikes (49.46) were observed in the case of the flag leaf removal after 14 days after winter wheat plant anthesis (Figure 3A) in the first experimental year for the Andrada variety. The removal of the flag leaf in different vegetative stages had a slight effect on the number of grains/spikes in the Andrada variety, this quantitative characteristic being quite stable. In the second experimental year, the number of grains/spikes had a small variability: 40.4 grains/spike for control plants to 41.2 for plants where the flag leaves were removed in the booting stage.
For the weight of the grains/spikes (Figure 3B), the removal of the flag leaf caused a decrease in this characteristic from 9% to 5.8% if this is removed in the booting stage or 28 days after anthesis. For the second experimental year, the weight of the grains/spikes after the removal of flag leaf during anthesis caused a decrease in this characteristic by 11% compared to the control plants of the Andrada variety. The delayed flag leaf removal 7 and 14 days after anthesis determined the increasing weight of the grains/spikes by ~7.14%, while the delay of flag leaf removal until 21 and 28 days increased the weight of the grains/spikes from 17.0% to 20.13%.
The maximum carotenoid content in the flag leaf of the Andrada variety was registered in the first experimental year (Figure 3C) at 21 days after anthesis (90.20 mg/100 g DM). A concentration close to that mentioned was also recorded in the case of wheat flag leaf removal at 14 days after anthesis (87.09 mg/100 g DM), while at 28 days after anthesis, the level of the total carotenoid content was significantly reduced (3.21 mg/100 g DM). During plant flowering, the level of Chl a was registered as the maximum concentration (600.40 mg/100 g DM); for booting, 7 days after anthesis, 14 days after anthesis, and 21 days after anthesis—this type of chlorophyll was maintained at a closer level. A different behavior was observed in the case of Chl b, where the maximum concentration was observed at the booting stage (334.22 mg/100 g DM) followed by a linear and slight decrease to 21 days after anthesis.
In the second experimental year (Figure 3D), the concentration of the total carotenoids and Chl a was observed to have maximum values 14 days after anthesis (121.50 and 529.11 mg/100 g DM, respectively). A relatively constant Chl b concentration can be observed for the Andrada variety from the booting stage to 21 days after anthesis.
The number of grains/spikes was affected by the removal of the flag leaf in the booting stage, anthesis, and 7 days after anthesis compared with the control plants for the Codru variety (Figure 4A). The most severe effect on this characteristic was recorded when the flag leaf was removed 7 days after anthesis, causing a decrease in the number of grains/spike above 12.5% compared with the control plants. In the second experimental year, the number of grains/spikes was highly affected by removing the flag leaf 21 days after anthesis (39.21 grains/spikes), causing a decrease in this characteristic with ~7.6% compared with the control plants (42.43 grains/spikes).
The removal of the flag leaf both at the booting stage and 7 days after anthesis had a major impact on the weight of the grains/spikes, causing a decrease in the value of this characteristic between 23.4% and 22.5% compared with the control plants (Figure 4B).
Regarding the weight of the grains/spikes for 2020, the removal of the flag leaf 14 days after anthesis had a major impact, causing a reduction of 27.25% compared to the plants in the control (1.89 g/spike). A significant influence on the weight of the grains/spikes can also be observed in the case of flag leaf removal at the booting stage and 21 days after anthesis.
Additionally, in the first experimental year, the highest concentration of carotenoids in the flag leaf was registered 7 days after anthesis, as in the case of Chl a (90, 7 mg/100 g DM for total carotenoids and 597.9 mg/100 g DM for Chl a). A high level of carotenoids concentration was observed when the flag leaf was removed 21 days after anthesis (66.17 mg/100 g DM), while the Chl b concentration in the flag leaf was relatively stable from the booting stage to 21 days after anthesis (Figure 4C).
Chl a concentration in the flag leaf was highly registered in the flag leaf during the booting stage (681.7 mg/100 g DM) followed by 14 days after anthesis (632.7 mg/100 g DM) (Figure 4D). Additionally, a high concentration of Chl b and the total carotenoid content were observed 14 days after anthesis (288.81 mg/100 g DM and 256.28 mg/100 g DM, respectively), the level of the two photosynthetic pigments being maintained at a high level at 21 days after anthesis.

3.2. Grain Quality

The experimental year conditions determined a significant difference in the protein content for all of the studied winter wheat varieties (Table 2). Additionally, significant differences in the grain protein content were highlighted in the case of different vegetative stages of flag leaf removal and the interaction between the climatic conditions and plant phenology flag leaf removal. In the case of the wet gluten grain content, the climatic conditions have no significant influence, except for the Codru variety. Both the vegetative stages of flag leaf removal and the interaction A × B factors have a significant influence (p ≤ 0.01) on the wet gluten content.
The grain quality was also influenced by the flag leaf removal in different phenological stages. Under the climatic conditions of the first experimental year (Figure 5A), for the Ciprian variety, the removal of the flag leaves had a positive impact on the grain protein content, especially if these were removed from the booting stage (12.1%) to 14 days after anthesis (12.05%). The highest protein content was registered when the flag leaf was removed 7 days after anthesis (12.75%), and the smallest value of the protein content was observed 28 days after anthesis (10.75%). In 2020, the grain protein content varied widely, the highest value being registered when the flag leaf was removed at ripening (14%), followed by the booting stage (13.4%), and 14 days after anthesis (13.5%).
Regarding the wet gluten content for the Ciprian variety as an effect of flag leaf removal, the maximal grain gluten content was registered when the flag leaf was removed at the ripening stage (31.25%) for the first experimental year. Similar content can be observed for those plants whose flag leaves were removed in the early analyzed stages (booting, anthesis, and 7 DAA), while the minimum wet gluten content was determined by flag leaf removal at 28 DAA (23.7%). A smaller variability between different times of flag leaf removal for wet gluten content was registered in the case of the second experimental year (Figure 5B). Generally, the removal of the flag leaf had a positive impact on the wet gluten content, causing an increasing content compared with the ripening stage, except for the removal of flag leaf 21 DAA.
For the Andrada variety (Figure 6), the removal of the flag leaf at the booting stage had a significant influence on the grain protein content (10.5%) in the first experimental year. Compared with the control plants, the removal of the flag leaf at anthesis and 28 DAA improved the grain protein content (Figure 6A). A different protein accumulation in grain was observed in the case of flag leaf removal in the second experimental year, where the smallest protein content was recorded in the control plants in the ripening stage (9%). A positive influence on the grain protein content was observed by removing the flag leaf in different phenological stages compared with the control plants.
The wet gluten content was negatively influenced by the removal of the flag leaf 7 days after anthesis and 14 days after anthesis compared with the control plants under the conditions of the first experimental year, 2019 (Figure 6B). The removal of the flag leaf at the booting stage, anthesis, 21 DAA, and 28 DAA determined a slight increase in the wet gluten content compared with the ripening stage. A positive effect of flag leaf removal in different phenological stages on wet gluten content was also observed in the second experimental year, with over 2% of the wet gluten content being registered for booting (27.9%), anthesis (26.8%), and 14 DAA (26.3%).
The quality indices for the Codru variety regarding the protein content and the wet gluten content can be observed in Figure 7. For the grain protein content (Figure 7A), the removal of the flag leaf from the booting to 28 DAA had a positive influence on determining an increase in the protein content from 9.15% at 28 DAA to 10.45% for the booting stage. In 2020, the highest value for the protein content was registered in the case of flag leaf removal at 21 DAA (12.3%), followed by flag leaf removal at 14 DAA (12%) and at anthesis (12%). The same level of grain protein content (11.7%) was observed in the case of flag leaf removal in the booting stage at ripening, while at 7 DAA, the protein content was registered for 11.9%. The removal of the flag leaf at 28 DAA had a negative influence on the grain protein content, the level of this qualitative index waa slightly under that of the plants control (11.1%).
Regarding the wet gluten content (Figure 7B), the removal of the flag leaf in all of the studied stages before ripening had a positive influence comparative to the control plants (19.15%) for the first experimental year. A good level of wet gluten content is maintained in the case of flag leaf removal at the booting stage, anthesis, and 21 DAA (over 23%). The absence of flag leaf at 28 DAA (20.05%), 14 DAA (21.45%), and 7 DAA (21.65%) determined a slight increase in the wet gluten content compared to the control plants (19.15%).
For the second experimental year, the wet gluten content was influenced to the greatest extent by the removal of the flag leaf 21 DAA (35.4%) compared with the control (30.9%). Up to 30% of of the wet gluten was determined by the removal of flag leaf at anthesis (31.8%), 7 DAA (33.1%), and 14 DAA (32%). A slight decrease in the wet gluten content (28.1%) was observed in the case of flag leaf removal 28 DAA compared with the control, in addition to the flag leaf removal at the booting stage (29.9%).

3.3. Relationship between Analyzed Traits

Generally, between the different quantitative traits, there is a direct relationship more or less, which can be amplified by the environmental conditions and genetic determinism of those (Table 3).
In the case of the Ciprian variety, a strong positive relationship (p > 0.001) was observed in both experimental years between the main yield characteristics and between the photosynthetic flag leaf pigments. A negative relationship was observed in the case of yield components and biochemical compounds.
For the Andrada variety, the correlations between the analyzed traits depend on the year conditions. In the first experimental year, a positive relationship (p > 0.001) has been observed in the case of the number of grains/spikes and the grain-quality indices, in addition to the relationship between the analyzed flag leaf photosynthetic pigments and the grain protein content. The interactions between the genetic factors and the environmental conditions determined a strong positive relationship (p > 0.001) in the second experimental year between Chl b and Chl a and the total carotenoid content, respectively.
A strong positive relationship (p > 0.001) between the number of grains/spikes and the weight of grains/spikes was maintained for both experimental years in the case of the Codru variety. The same positive, strong relationship was observed between the two types of chlorophyll studied (0.90) and between Chl b and the total carotenoids content, in addition to the negative relationship for the weight of grains/spikes and the three types of photosynthetic pigments studied (0.58; 0.69; 0.70). A highly significant relationship (p > 0.001) was observed for Chl b and Chl a, respectively, for the total carotenoids’ content, in addition to the Chl b and grain-quality indices, for the second experimental year. Different intensities of the negative relationship between the number of grains/spikes and the weight of grains/spikes, respectively, with wet gluten content were observed underthe conditions of the second experimental year.

4. Discussion

The agronomic performance of the cultivars was revealed by the interaction of their genetic background and adaptability capacity to the environmental conditions. Three Romanian winter wheat genotypes were tested under field conditions with different flag leaf removal times from the booting stage to physiological maturity to determine their contribution to the final grain yield and the concentration levels of the main chlorophyll pigments. The flag leaf, as one of the main photosynthetic organs, especially in advanced plant stages, can play an important role in grain yield levels [51,52,53]. To quantify the contribution of different plant morphological traits, different methodologies were designed to establish their contribution to grain yield [54,55]. As a reaction to losing one of the most active parts of the plant regarding plant assimilation, the removal of the flag leaf at different stages had a major impact on the morphological traits of the plants. Two of these traits, with a high impact on grain yield, the number of grains/spikes and the weight of the grains/spikes, are highly influenced by the absence of the flag leaf.
The climatic conditions of the experimental year, in addition to the plant stages, and the interaction between these determines a significant influence on the number of grains/spikes and the weight of grain/spike traits for all of the studied genotypes (Table 1). Being two complex characteristics, the variations in these main yield traits involve many minor genetic characteristics whose expressiveness is limited by environmental factors. Regarding more specific characteristics, such as photosynthetic pigments (Ch la, Chl b, and carotenoids), which have a high heritability, year conditions have a limited influence, except for the total carotenoid content of the Codru variety. In the case of the B factor and the interaction between the year condition and plant phenophasis, these factors determine significant differences for Chl a, Chl b, and carotenoid content in flag leaves.
In the case of the Ciprian variety, the removal of the flag leaf in the booting stage can reduce the grain number and the weight of the grains/spikes for both experimental years (Figure 2A,B). Similar results were reported by [56], in which the authors observed that the absence of the flag leaf from the booting stage could reduce the grain yield by 30% in barley. The environmental conditions from the first experimental year highlighted that the removal of the flag leaf at 7 DAA determined a decrease in the weight of grains/spikes by 6% compared with the flag leaf removal during anthesis, [57] observing the same reaction in an experiment regarding the slight shading of wheat plants in different stages after anthesis mainly as a consequence of the flag leaf shading. Delayed flag leaf removal generally had a positive effect on the main yield components, some negative results being influenced by the unfavorable year conditions during the experimental period.
Photosynthetic pigments, such as Chl a, Chl b, and the total carotenoids, had a large variability during the two experimental years (Figure 2C,D), the climatic conditions having a considerable influence. In the first experimental year, the maximum concentration of Chl a and Chl b was registered in the booting stage in the Ciprian variety, followed by a slight linear decrease in these pigments until 21 DAA (Figure 2C). Fokar et al. [57] and Liu et al. [58] registered similar slight flag leaf senescence after anthesis in the case of optimal conditions, and this can be accelerated by heat and drought conditions, while [59] affirm that post-anthesis drought substantially accelerated the loss of chlorophyll. In a previous study [60], the authors observed that the chlorophyll content was highly maintained in the early grain-filling period, and their photosynthetic capacity gradually became lower after this period. Regarding the carotenoid content, during the first experimental year (Figure 2C), a high level was maintained from booting to 21 DAA (>65 mg/100 g DM) in flag leaf as a cellular defense mechanism to minimize the damage due to oxidative stress [61]. Additionally, Chl a, Chl b, and the total carotenoids’ content in the second experimental year had a specific variability (Figure 2D) because of the environmental conditions and the effort of plants to protect their productivity components during this critical period. As an effect of extended drought conditions, the maximum photosynthesis pigments were registered 7 DAA and 14 DAA, respectively, with similar results being reported by Ommen et al. [62] and Manivannan et al. [63] for wheat and sunflower also under stress conditions.
The removal of the flag leaf at 21 DAA had the same influence on the number of grains/spikes for the Andrada variety as the flag leaf removal at the booting stage, 28 DAA, and ripening stage (Figure 3A). The obtained results suggest that the number of grains/spikes is a quantitative characteristic with a variability set in a short period after the anthesis stage; after this period, the plants’ resources are concentrated for grain formation and filling. The large variation in this variety, both for the number of grains/spikes and the weight of the grains/spikes, can be influenced by the slow adaptability of the physiological and morphological mechanisms of the plant. The number of grains/spikes had a highly genetic determinism on this variety (>40 grains/spike) even under unfavorable conditions, such as those from the second experimental year (Figure 3A). For the Andrada variety, the maximum total carotenoids content was recorded at 14 DAA and 21 DAA in both of the experimental years, a high level (124.5 and 110.9 mg/100 g DM) was observed in the second experimental year as an effect of accentuated dryness conditions (Figure 3C,D). In previous research, the carotenoid content and the Chl a/b ratio were significantly increased by drought stress [64]. The Chl a and Chl b concentrations in the flag leaf had different behaviors for the two experimental years, and the maximum Chl a concentration was observed during anthesis (600.4 mg/100 g DM) for the first experimental year compared with the maximum Chl a concentration for the second experimental year (529.11 mg/100 g DM), registered after the removal of the flag leaf at 14 DAA.
The Codru variety is a very reactive genotype to the removal of the flag leaf, especially for the number of grains/spikes (Figure 4A) based on the amplitude of this characteristic (~9 grains/spikes). In the conditions of the first experimental year, the removal of the flag leaf at 7 DAA led to the minimum number of grains/spikes (44.91) and weight of the grains/spike (1.58 g/spike). A slight influence was observed by the removal of the flag leaf after 14 DAA for this yield component, with the variation in the number of grains/spikes and the weight of the grains/spikes being relatively low. For the second experimental year, the flag leaf removal at 14 DAA, in addition to the environmental conditions, had a major impact on the weight of the grains/spikes and the flag leaf removal at 21 DAA for the number of grains/spikes, respectively. The obtained results suggest that under drought conditions, the lack of a flag leaf near to anthesis can be supported easily by the plant through other active organs than in the case of advanced phenological stages. The maximum concentration of carotenoids in the flag leaves (90.7 mg/100 g DW) was registered at 7 DAA (Figure 4C). A relatively constant concentration of carotenoids in the flag leaves can be observed during anthesis, 14 DAA, and 21 DAA, which is in opposition to [65], who stated that after anthesis, the Chl a and Chl b concentration decreased significantly but also established that there are some genetic differences in the responses of flag leaf photosynthetic pigment content under different atmospheric ozone regimes. High levels of Chl a concentration in the flag leaves were observed in the booting stage (Figure 4D), which remained relatively high until 21 DAA, followed by a drastic decrease at 28 DAA, the same behavior being registered in the case of Chl b. For the total carotenoid content, the climatic conditions led to a higher concentration during the grain formation and filling period (at 14 DAA, 21 DAA, and 28 DAA). A higher level of carotenoid content at 28 DAA can be attributed to the slower filling rate of the grain for the Codru variety.
The ANOVA for the grain-quality characteristics (Table 2) shows that for the protein content that the climatic conditions, plant development stages, and the interactions between these had a significant influence (p > 0.01). In the case of the wet gluten content, the climatic conditions of the experimental year have no significant differences regarding the Ciprian and Andrada varieties compared with the Codru variety (p > 0.05).
Regarding the quality indices of the plant grains as an effect of flag leaf removal for the Ciprian variety, the specific climatic conditions of the experimental years had a particular effect on both the quality indices and their variability depending on the phenological stages of flag leaf removal. A low correlation between the flag leaf removal time and grain quality can be observed in the case of the Ciprian variety during these two experimental years. The variation in the protein and wet gluten content was associated with the conditions of short periods of drought, which influenced the biosynthesis of different enzymes that have an important role in the accumulation of starch and other biochemical compounds [66]. During the first experimental year, the removal of the flag leaf after 7 DAA until 28 DAA led to a gradual decrease in the protein content, which means that after 7 DAA, the foliar plant apparatus without a flag leaf cannot also support the grain development with the synthesis of quality components. Different behavior can be observed in the case of the second experimental year for the grain protein content, where the variability of these qualitative traits was much wider in response to the plant’s reaction to drought.
The grain’s wet gluten content was more stable than the grain’s protein content due to its particular synthesis process. For both experimental years, the grain’s wet gluten content was similar, except for 28 DAA in the first experimental year, where the biosynthesis of the gluten fraction was inhibited due to unfavorable environmental conditions [67].
In the case of the Andrada variety, the removal of the flag leaf at 7 DAA had a negative impact on both the protein and wet gluten content, the level of these two grain quality components increased after these phenological stages under the first experimental conditions. The highest protein and gluten contents were registered after flag leaf removal during the booting and anthesis stages, which means that the plant’s foliar systems were capable of assuming the attributes of the flag leaf. For the wet gluten content, the removal of the flag leaf, starting from booting to ripening, had a positive effect, postponing the removal of the flag leaf and weakening the relationship between them.
The reaction of the Codru variety regarding the protein and wet gluten content in the grain to flag leaf removal is more stable than for the other studied genotypes. For the first experimental year, both the protein and wet gluten content had a similar grain accumulation, which was negatively influenced by flag leaf removal, and the removal of the flag leaf during the early stages led to high grain-quality indices. Under the environmental conditions of the second experimental year, the correlations between the grain protein and wet gluten content are very close, with the variations in the levels of those being given by the genotype-specific constitution and its reaction to substitute the lack of a flag leaf.
The correlation between the analyzed traits shows the intensity of the relationships between these (Table 3), helping to understand how the plant’s intrinsic mechanism relates to the compensatory under limited conditions. Some of these characteristics have a known strong direct relationship (number of grains/spikes—the weight of the grains/spikes) or indirect (yield components—grain-quality indices) as found by [68], the intensity of these being adjusted by external factors. Generally, during these two experimental years, some of these direct relationships were maintained at the same intensity (p > 0.001 or p > 0.05) NGS and WGS; Chl a and Chl b; Chl a and the total carotenoid content; and the Chl b and total carotenoid content. In addition to this positive correlation, some negative correlation has been observed (p > 0.001, p > 0.01, and p > 0.05) between NGS or WGS and Chl a and Chl b and total carotenoid content, as in the case of [69], which found a negative correlation between the spike yield and flag leaf chlorophyll content in advanced generative stages. Additionally, a significant negative correlation has been observed between the main yield components (NGS; WGS) and grain quality (protein and wet gluten content). Regarding the relationship between the photosynthetic pigments and the grain-quality indices, these are specific to the year conditions and variety. For the Ciprian variety, a negative correlation was highlighted between the photosynthetic pigments and the grain protein content (p > 0.01 and p > 0.05, respectively) in the first experimental year, probably as a reaction to the drought-stress conditions during the grain-filling period [70]. Similar results further demonstrated a negative relationship between the chlorophyll index and the grain protein content, as observed under drought conditions by Javed et al. [71]. A different relationship between these traits was observed under the conditions of the second experimental year, when the relationship was positive (p > 0.001 and p > 0.01, respectively) as a reaction of the photosynthetic pigments to the light intensity and drought stress, which favors the accumulation of grain-quality indices [72]. A significant correlation was observed between Chl b and the grain-quality indices for both the Andrada and Codru varieties in the first experimental year (p > 0.001; p > 0.01; p > 0.05), while in the second experimental year, these correlations were missing in the case of the Andrada variety but were significant for the Codru variety (p > 0.001 for Chl b and protein content/wet gluten content, respectively, p > 0.01 for Chl a and protein content/wet gluten content).

5. Conclusions

Based on the obtained results, the removal of the flag leaf at the booting stage can reduce the grain yield capacity by more than 25%. The ability of the genotype to mitigate the effect of flag leaf loss is different from the three studied varieties; Andrada had an increasing potential to substitute the flag leaf role in grain yield potential. The climatic conditions can accentuate or reduce the lack of flag leaves by their degree of favorability. As a negative effect of flag leaf removal, the grain-quality indices slightly increased while reducing the grain yield capacity (negative correlation between the yield and grain yield quality). The dynamic of photosynthetic pigments in flag leaves is influenced by the environmental conditions and genetic determinism of these. During the experimental period, the Ciprian variety showed a relatively constant level of Chl a until 21 DAA and the Andrada variety for Chl b, while the Codru variety registered the highest carotenoid content, especially for the second experimental year.
The flag leaf has an important role in establishing the main yield components and yield quality, its contribution being accentuated by the favorability of the environmental conditions during each phenological stage. The genetic constitution of each studied variety had a specific response to the lack of the flag leaf for both leaf photosynthetic pigments and main grain yield components.

Author Contributions

Conceptualization, I.R., F.R. and D.H.; methodology, I.R.; N.T.; formal analysis, R.K.; investigation, I.R., D.H., I.B., E.M., N.T. and R.K.; resources, I.R. and R.K.; data curation, E.M., A.O. and L.M.; writing—original draft preparation, I.R., F.R., A.O., D.H. and I.B.; writing—review and editing I.R., R.K., A.O., D.H., I.B., E.M. and L.M.; visualization, R.K., F.R. and N.T.; supervision, I.R., D.H. and I.B. All authors have read and agreed to the published version of the manuscript.

Funding

This research received no external funding.

Data Availability Statement

Not applicable.

Conflicts of Interest

The authors declare no conflict of interest.

References

  1. Mickky, B.; Aldesuquy, H.; Elnajar, M. Effect of Drought on Yield of Ten Wheat Cultivars Linked with Their Flag Leaf Water Status, Fatty Acid Profile and Shoot Vigor at Heading. Physiol. Mol. Biol. Plants 2020, 26, 1111–1117. [Google Scholar] [CrossRef] [PubMed]
  2. Grote, U.; Fasse, A.; Nguyen, T.T.; Erenstein, O. Food Security and the Dynamics of Wheat and Maize Value Chains in Africa and Asia. Front. Sustain. Food Syst. 2021, 4, 617009. [Google Scholar] [CrossRef]
  3. Ray, D.K.; Mueller, N.D.; West, P.C.; Foley, J.A. Yield Trends Are Insufficient to Double Global Crop Production by 2050. PLoS ONE 2013, 8, e66428. [Google Scholar] [CrossRef] [PubMed] [Green Version]
  4. Tadesse, W.; Sanchez-Garcia, M.; Assefa, S.G.; Amri, A.; Bishaw, Z.; Ogbonnaya, F.C.; Baum, M. Genetic Gains in Wheat Breeding and Its Role in Feeding the World. Crop. Breed. Genet. Genom. 2019, 1, e190005. [Google Scholar] [CrossRef] [Green Version]
  5. Balla, K.; Karsai, I.; Bónis, P.; Kiss, T.; Berki, Z.; Horváth, Á.; Mayer, M.; Bencze, S.; Veisz, O. Heat Stress Responses in a Large Set of Winter Wheat Cultivars (Triticum Aestivum L.) Depend on the Timing and Duration of Stress. PLoS ONE 2019, 14, e0222639. [Google Scholar] [CrossRef] [PubMed]
  6. Ashraf, M.; Foolad, M.R. Roles of Glycine Betaine and Proline in Improving Plant Abiotic Stress Resistance. Environ. Exp. Bot. 2007, 59, 206–216. [Google Scholar] [CrossRef]
  7. Onyekachi, O.G.; Boniface, O.O.; Gemlack, N.F.; Nicholas, N. The Effect of Climate Change on Abiotic Plant Stress: A Review. In Abiotic and Biotic Stress in Plants; IntechOpen: London, UK, 2019. [Google Scholar] [CrossRef] [Green Version]
  8. Pandey, S.; Fartyal, D.; Agarwal, A.; Shukla, T.; James, D.; Kaul, T.; Negi, Y.K.; Arora, S.; Reddy, M.K. Abiotic Stress Tolerance in Plants: Myriad Roles of Ascorbate Peroxidase. Front. Plant Sci. 2017, 8, 581. [Google Scholar] [CrossRef] [Green Version]
  9. Bellard, C.; Bertelsmeier, C.; Leadley, P.; Thuiller, W.; Courchamp, F. Impacts of Climate Change on the Future of Biodiversity. Ecol. Lett. 2012, 15, 365–377. [Google Scholar] [CrossRef] [Green Version]
  10. Malinowski, R. Understanding of Leaf Development—The Science of Complexity. Plants 2013, 2, 396–415. [Google Scholar] [CrossRef]
  11. Du, B.; Liu, L.; Wang, Q.; Sun, G.; Ren, X.; Li, C.; Sun, D. Identification of QTL underlying the leaf length and area of different leaves in barley. Sci. Rep. 2019, 9, 4431. [Google Scholar] [CrossRef] [Green Version]
  12. Biswal, A.K.; Kohli, A. Cereal flag leaf adaptations for grain yield under drought: Knowledge status and gaps. Mol. Breed. 2013, 31, 749–766. [Google Scholar] [CrossRef]
  13. Liu, L.; Sun, G.; Ren, X.; Li, C.; Sun, D. Identification of QTL Underlying Physiological and Morphological Traits of Flag Leaf in Barley. BMC Genet. 2015, 16, 29. [Google Scholar] [CrossRef] [PubMed] [Green Version]
  14. Towfiq, S.I.; Abdulqader, S.H.; Ahmad, K.R.; Hama, S.J. Response of grain yield and its components to organic matter and removal of some photosynthetic organs of durum wheat (Triticum aestivum L.) in two years of Sulaimani—Iraq region. Int. J. Plant Anim. Environ. Sci. 2015, 5, 134–140. [Google Scholar] [CrossRef]
  15. Auriau, P.; Doussinault, G.; Jahier, J.; Lecompte, C.; Pierre, J.; Pluchard, P.; Rousset, M.; Saur, L.; Trottet, M. Le blé tendre. In Amélioration des Espèces Végétales Cultivées; Gallais, A., Bannerot, H., Eds.; INRA: Paris, France, 1992; pp. 22–38. [Google Scholar]
  16. Sylvester-Bradley, R.; Scott, R.K.; Wright, C.E. Physiology in the production and improvement of cereals. In HGCA Research Review No. 18; Soil Science Department: Cambridge, UK, 1990. [Google Scholar]
  17. Ma, J.; Xiao, Y.; Hou, L.; He, Y. Combining Protein Content and Grain Yield by Genetic Dissection in Bread Wheat under Low-Input Management. Foods 2021, 10, 1058. [Google Scholar] [CrossRef]
  18. Banitaba, A.; Naderi, M.; Javanmard, H.; Emami, B. Effect of flag leaf and awn removal on vegetative traits, grain yield and yield components of bread wheat (Triticum aestivum L.). Res. Agric. Sci. 2007, 2, 73–86. [Google Scholar]
  19. Alvaro, F.; Royo, C.; García del Moral, L.F.; Villegas, D. Grain filling and dry matter translocation responses to source–sink modifications in a historical series of durum wheat. Crop Sci. 2008, 48, 1523. [Google Scholar] [CrossRef] [Green Version]
  20. Cruz-Aguado, J.; Reyes, F.; Rodes, R.; Perez, I.; Dorado, M. Effect of source-to-sink ratio on partitioning of dry matter and 14 C-photoassimilates in wheat during grain filling. Ann. Bot. 1999, 83, 655–665. [Google Scholar] [CrossRef] [Green Version]
  21. Saeedipour, S.; Moradi, F. Comparison of the drought stress responses of tolerant and sensitive wheat cultivars during grain filling: Impact of invertase activity on carbon metabolism during kernel development. J. Agric. Res. 2011, 3, 32–44. [Google Scholar] [CrossRef] [Green Version]
  22. Blake, N.K.; Lanning, S.P.; Martin, J.M.; Sherman, J.D.; Talbert, L.E. Relationship of Flag Leaf Characteristics to Economically Important Traits in Two Spring Wheat Crosses. Crop Sci. 2007, 47, 491. [Google Scholar] [CrossRef]
  23. Liu, X.; Yin, B.; Hu, Z.; Bao, X.; Wang, Y.; Zhen, W. Physiological response of flag leaf and yield formation of winter wheat under different spring restrictive irrigation regimes in the Haihe Plain, China. J. Integr. Agric. 2021, 20, 2343–2359. [Google Scholar] [CrossRef]
  24. Vicente, R.; Vergara-Díaz, O.; Medina, S.; Chairi, F.; Kefauver, S.C.; Bort, J.; Serret, M.D.; Aparicio, N.; Araus, J.L. Durum wheat ears perform better than the flag leaves under water stress: Gene expression and physiological evidence. Environ. Exp. Bot. 2018, 153, 271–285. [Google Scholar] [CrossRef]
  25. Wazziki, E.H.; Yousfi, B.E.; Serghat, S. Contributions of three upper leaves of wheat, either healthy or inoculated by Bipolaris sorokiniana, to yield and yield components. Aust. J. Crop Sci. 2015, 9, 629–637. [Google Scholar]
  26. Kong, L.; Sun, M.; Xie, Y.; Wang, F.; Zhao, Z. Photochemical and antioxidative responses of the glume and flag leaf to seasonal senescence in wheat. Front. Plant Sci. 2015, 6, 358. [Google Scholar] [CrossRef] [PubMed] [Green Version]
  27. Kiliç, H.; Yağbasanlar, T. The Effect of Drought Stress on Grain Yield, Yield Components and Some Quality Traits of Durum Wheat (Triticum turgidum ssp. durum) Cultivars. Not. Bot. Horti Agrobot. 2010, 38, 164–170. [Google Scholar] [CrossRef]
  28. Huang, L.; Zhang, F.; Wang, W.; Zhou, Y.; Fu, B.; Li, Z. Comparative transcriptome sequencing of tolerant rice introgression line and its parents in response to drought stress. BMC Genom. 2014, 15, 1026. [Google Scholar] [CrossRef] [Green Version]
  29. Mou, H.M.; He, J.Q.; Xing, J.J.; Yao, S.J.; Tang, Y.; Wang, Z.Q.; Du, G.Y. Water changes in wheat spike during grain filling stage investigated by nuclear magnetic resonance. J. Agric. Eng. 2016, 32, 98–104. [Google Scholar]
  30. Zhang, L.; Zhang, C.; Du, B.; Lu, B.; Zhou, D.; Zhou, J.; Zhou, J. Effects of node restriction on cadmium accumulation in eight Chinese wheat (Triticum turgidum) cultivars. Sci. Total Environ. 2020, 725, 138358. [Google Scholar] [CrossRef]
  31. Liu, S.N.; Yu, F.Y.; Fu, Z.H.; Yang, J.Y.; Chen, M.L.; Fu, Y.H.; Li, Y.J.; Chang, H.Q.; Zhou, W.L.; Wang, X.G.; et al. Key factors affect selenite absorption in wheat leaf blades: pH, temperature, light intensity and leaf position. Plant Soil Environ. 2020, 66, 431–436. [Google Scholar] [CrossRef]
  32. Zhang, Z.; Zhang, Y.; Shi, Y.; Yu, Z. Optimized split nitrogen fertilizer increase photosynthesis, grain yield, nitrogen use efficiency and water use efficiency under water-saving irrigation. Sci. Rep. 2020, 10, 20310. [Google Scholar] [CrossRef]
  33. Quirino, B.F.; Noh, Y.S.; Himelblau, E.; Amasino, R.M. Molecular aspects of leaf senescence. Trends Plant Sci. 2000, 5, 278–282. [Google Scholar] [CrossRef]
  34. Fornari, E.Z.; Gaviraghi, L.; Basso, C.J.; Pinheiro, M.V.M.; Vian, A.L.; Santi, A.L. Relationship between photosynthetic pigments and corn production under nitrogen sources. Pesqui. Agropecu. Trop. 2020, 50, e63661. [Google Scholar] [CrossRef]
  35. Bojović, B.; Stojanović, J. Chlorophyll and carotenoid content in wheat cultivars as a function of mineral nutrition. Arch. Biol. Sci. 2005, 57, 283–290. [Google Scholar] [CrossRef]
  36. Niroula, A.; Khatri, S.; Timilsina, R.; Khadka, D.; Khadka, A.; Ojha, P. Profile of chlorophylls and carotenoids of wheat (Triticum aestivum L.) and barley (Hordeum vulgare L.) microgreens. J. Food Sci. Technol. 2019, 56, 2758–2763. [Google Scholar] [CrossRef] [PubMed]
  37. Havaux, M. Carotenoid oxidation products as stress signals in plants. Plant J. 2013, 79, 597–606. [Google Scholar] [CrossRef] [PubMed]
  38. Meléndez-Martínez, A.J.; Mapelli-Brahm, P.; Hornero-Méndez, D.; Vicario, I.M. Structures, nomenclature and general chemistry of carotenoids and their esters. In Foods: Physical, Chemical and Biological Properties; The Royal Society of Chemistry: London, UK, 2019; pp. 1–50. [Google Scholar] [CrossRef]
  39. Swapnil, P.; Meena, M.; Singh, S.K.; Dhuldhaj, U.P.; Harish; Marwal, A. Vital roles of carotenoids in plants and humans to deteriorate stress with its structure, biosynthesis, metabolic engineering and functional aspects. Curr. Plant Biol. 2021, 26, 100203. [Google Scholar] [CrossRef]
  40. Araus, J.L.; Slafer, G.A.; Reynolds, M.P.; Royo, C. Plant breeding and drought in C3 cereals: What should we breed for? Ann. Bot. 2002, 89, 925–940. [Google Scholar] [CrossRef]
  41. Maoka, T. Carotenoids as natural functional pigments. J. Nat. Med. 2020, 74, 1–16. [Google Scholar] [CrossRef] [Green Version]
  42. Ross, J. The Radiation Regime and Architecture of Plant Stands; Dr W. Junk Publishers: London, UK, 1981. [Google Scholar]
  43. Feng, B.; Liu, B.; Li, G.; Dong, S.T.; Wang, F.H.; Kong, L.A.; Zhang, J.W. Effect of Heat Stress on the Photosynthetic Characteristics in Flag Leaves at the Grain-Filling Stage of Different Heat-Resistant Winter Wheat Varieties. J. Agron. Crop Sci. 2013, 200, 143–155. [Google Scholar] [CrossRef]
  44. Tashiro, T.; Wardlaw, I.F. The response of high temperature shock and humidity changes prior to and during early stages of grain development in wheat. Funct. Plant Biol. 1990, 17, 551–561. [Google Scholar] [CrossRef]
  45. Prasad, P.V.V.; Djanaguiraman, M. Response of floret fertility and individual grain weight of wheat to high temperature stress: Sensitive stages and thresholds for temperature and duration. Funct. Plant Biol. 2014, 41, 1261–1269. [Google Scholar] [CrossRef] [Green Version]
  46. Yang, J.; Sears, R.G.; Gill, B.S.; Paulsen, G.M. Growth and senescence characteristics associated with tolerance of wheat alien amphiploids to high temperature under controlled conditions. Euphytica 2002, 126, 185–193. [Google Scholar] [CrossRef]
  47. Castro, M.; Peterson, C.J.; Rizza, M.D.; Dellavalle, P.D.; Vazquez, D.; Ibanez, V.; Ross, A. Influence of heat stress on wheat grain characteristics and protein molecular weight distribution. In Wheat Production in Stressed Environments; Buck, H.T., Nisi, J.E., Salomón, N., Eds.; Springer: Dordrecht, The Netherlands, 2007; pp. 365–371. [Google Scholar]
  48. Hu, S.; Ding, Y.; Zhu, C. Sensitivity and Responses of Chloroplasts to Heat Stress in Plants. Front. Plant Sci. 2020, 11, 375. [Google Scholar] [CrossRef] [PubMed] [Green Version]
  49. Sanchez-Bragado, R.; Elazab, A.; Zhou, B.; Serret, M.D.; Bort, J.; Nieto-Taladriz, M.T.; Araus, J.L. Contribution of the ear and the flag leaf to grain filling in durum wheat inferred from the carbon isotope signature: Genotypic and growing conditions effects. J. Integr. Plant Biol. 2014, 56, 444–454. [Google Scholar] [CrossRef] [PubMed]
  50. Wellburn, A.R. The Spectral Determination of Chlorophylls a and b, as Well as Total Carotenoids, Using Various Solvents with Spectrophotometers of Different Resolution. J. Plant Physiol. 1994, 144, 307–313. [Google Scholar] [CrossRef]
  51. Evans, L.T.; Wardlaw, I.F.; Fischer, R.A. Wheat. In Crop Physiology: Some Case Histories; Evans, L.T., Ed.; Cambridge University Press: Cambridge, UK, 1980; pp. 101–149. [Google Scholar]
  52. Araus, J.L.; Tapia, L. Photosynthetic gas exchange characteristics of wheat flag leaf blades and sheaths during grain filling. Plant Physiol. 1987, 85, 667–673. [Google Scholar] [CrossRef] [Green Version]
  53. Aggarwal, P.K.; Fischer, R.A.; Liboon, S.P. Source-sink relations and effects of post-anthesis canopy defoliation in wheat at low latitudes. J. Agric. Sci. 1990, 114, 93–99. [Google Scholar] [CrossRef]
  54. Mandea, V.; Mustăṭea, P.; Marinciu, C.M.; Serban, G.; Meluca, C.; Păunescu, G.; Isticioaia, S.F.; Dragomir, C.; Bunta, G.; Filiche, E.; et al. Yield components compensation in winter wheat (Triticum aestivum L.) is cultivar dependent. Rom. Agric. Res. 2019, 36, 7. [Google Scholar]
  55. Jebbouj, R.; El Yousfi, B. Barley yield losses due to defoliation of upper three leaves either healthy or infected at boot stage by Pyrenophora teres f. teres. Eur. J. Plant Pathol. 2009, 125, 303–315. [Google Scholar] [CrossRef]
  56. Xu, C.; Tao, H.; Wang, P.; Wang, Z. Slight shading after anthesis increases photosynthetic productivity and grain yield of winter wheat (Triticum aestivum L.) due to the delaying of leaf senescence. J. Integr. Agric. 2016, 15, 63–75. [Google Scholar] [CrossRef] [Green Version]
  57. Fokar, M.; Blum, A.; Nguyen, H.T. Heat tolerance in spring wheat. II. Grain filling. Euphytica 1998, 104, 9–15. [Google Scholar] [CrossRef]
  58. Liu, Y.; Li, M.; Li, J.; Li, X.; Yang, X.; Tong, Y.; Zhang, A.; Li, B.; Lin, J.; Kuang, T.; et al. Dynamic changes in flag leaf angle contribute to high photosynthetic capacity. Chin. Sci. Bull. 2009, 54, 3045–3052. [Google Scholar] [CrossRef]
  59. Martinez, D.E.; Luquez, V.M.; Bartoli, C.G.; Guiamet, J.J. Persistence of photosynthetic components and photochemical efficiency in ears of water-stressed wheat (Triticum aestivum). Physiol. Plant 2003, 119, 519–525. [Google Scholar] [CrossRef]
  60. Fan, Y.; Lv, Z.; Ge, T.; Li, Y.; Yang, W.; Zhang, W.; Ma, S.; Dai, T.; Huang, Z. Night-Warming Priming at the Vegetative Stage Alleviates Damage to the Flag Leaf Caused by Post-anthesis Warming in Winter Wheat (Triticum aestivum L.). Front. Plant Sci. 2021, 12, 706567. [Google Scholar] [CrossRef]
  61. Navabpour, S.; Jalali, P. Expression profiling of two sucrose transporter genes during post-anthesis in wheat. Zemdirb. Agric. 2019, 106, 265–272. [Google Scholar] [CrossRef] [Green Version]
  62. Ommen, O.E.; Donnelly, A.; Vanhoutvin, S.; van Oijen, M.; Manderscheid, R. Chlorophyll content of spring wheat flag leaves grown under elevated CO2 concentrations and other environmental stresses within the ESPACE-wheat project. Eur. J. Agron. 1999, 10, 197–203. [Google Scholar] [CrossRef]
  63. Manivannan, P.; Abdul Jaleel, C.; Sankar, B.; Kishorekumar, A.; Somasundaram, R.; Lakshmanan, G.M.A.; Panneerselvam, R. Growth, biochemical modifications and proline metabolism in Helianthus annuus L. as induced by drought stress. Colloids Surf. B Biointerfaces 2007, 59, 141–149. [Google Scholar] [CrossRef]
  64. Ali, Q.; Ali, S.; Iqbal, N.; Javed, M.T.; Rizwan, M.; Khaliq, R.; Shahid, S.; Perveen, R.; Alamri, S.A.; Alyemeni, M.N.; et al. Alpha-tocopherol fertigation confers growth physio-biochemical and qualitative yield enhancement in field grown water deficit wheat (Triticum aestivum L.). Sci. Rep. 2019, 9, 12924. [Google Scholar] [CrossRef] [Green Version]
  65. Zhu, X.K.; Gao, C.Y.; Zhang, R.B.; Liu, T.T.; Li, C.Y.; Guo, W.S.; Zhu, J.G.; Kobayashi, K. Effects of elevated atmospheric ozone concentration on flag leaf photosynthetic pigment contents of wheat. Ying Yong Sheng Tai Xue Bao 2012, 23, 2178–2184. (In Chinese) [Google Scholar]
  66. Deng, X.; Liu, Y.; Xu, X.; Liu, D.; Zhu, G.; Yan, X.; Wang, Z.; Yan, Y. Comparative Proteome Analysis of Wheat Flag Leaves and Developing Grains under Water Deficit. Front. Plant Sci. 2018, 9, 425. [Google Scholar] [CrossRef] [Green Version]
  67. Peng, Y.; Zhao, Y.; Yu, Z.; Zeng, J.; Xu, D.; Dong, J.; Ma, W. Wheat Quality Formation and Its Regulatory Mechanism. Front. Plant Sci. 2022, 13, 834654. [Google Scholar] [CrossRef]
  68. Laidig, F.; Piepho, H.P.; Rentel, D.; Drobek, T.; Meyer, U.; Huesken, A. Breeding progress, environmental variation and correlation of winter wheat yield and quality traits in German official variety trials and on-farm during 1983–2014. Theor. Appl. Genet. 2017, 130, 223–245. [Google Scholar] [CrossRef] [PubMed] [Green Version]
  69. Bahar, B. Relationships among flag leaf chlorophyll content, agronomical traits, and some physiological traits of winter wheat genotypes. Dufed 2015, 4, 1–5. [Google Scholar]
  70. Parida, A.K.; Dagaonkar, V.S.; Phalak, M.S.; Umalkar, G.V.; Aurangabadkar, L.P. Alterations in photosynthetic pigments, protein and osmotic components in cotton genotypes subjected to short-term drought stress followed by recovery. Plant Biotechnol. Rep. 2007, 1, 37–48. [Google Scholar] [CrossRef]
  71. Javed, A.; Ahmad, N.; Ahmed, J.; Hameed, A.; Ashraf, M.A.; Zafar, A.S.; Maqbool, A.; Al-Amrah, H.; Alatawi, H.A.; Al-Harbi, M.S.; et al. Grain yield, chlorophyll and protein contents of elite wheat genotypes under drought stress. J. King Saud Univ. Sci. 2022, 34, 102279. [Google Scholar] [CrossRef]
  72. Li, Y.; Wu, Y.; Hernandez-Espinosa, N.; Pena, R.J. The influence of drought and heat stress on the expression of end-use quality parameters of common wheat. J. Cereal Sci. 2013, 57, 73–78. [Google Scholar] [CrossRef]
Figure 1. Climatic condition during the experimental period.
Agronomy 12 02545 g001
Figure 2. The variation of morpho–biochemical traits of Ciprian variety to different flag leaf removal times (A,B) number of grains/spike, respectively weight of grains/spike; (C,D) photosynthetic pigments-2019, respectively 2020. Different letters in (A) and (B) figures, the significance is represented according to Duncan Test.
Agronomy 12 02545 g002
Figure 3. The variation of morpho-biochemical traits of Andrada variety to different flag leaf removal times (A,B) number of grains/spike, respectively weight of grains/spike; (C,D) photosynthetic pigments-2019, respectively 2020. Different letters in (A) and (B) figures, the significance is represented according to Duncan Test.
Agronomy 12 02545 g003
Figure 4. The variation of morpho- biochemical traits of Codru variety to different time removal flag leaf (A,B) number of grains/spike, respectively weight of grains/spike; (C,D) photosynthetic pigments-2019, respectively 2020. Different letters in (A) and (B) figures, the significance is represented according to Duncan Test.
Agronomy 12 02545 g004
Figure 5. The variation of grain-quality indices ((A) protein content; (B) wet gluten content) under different flag leaf removal stages in Ciprian variety. Different letters in (A) and (B) figures, the significance is represented according to Duncan Test.
Agronomy 12 02545 g005
Figure 6. The variation of grain-quality indices ((A) protein content; (B) wet gluten content) under different flag leaf removal stages in Andrada variety. Different letters in (A) and (B) figures, the significance is represented according to Duncan Test.
Agronomy 12 02545 g006
Figure 7. The variation of grain-quality indices ((A) protein content; (B) wet gluten content) under different flag leaf removal stages in Codru variety. Different letters in (A) and (B) figures, the significance is represented according to Duncan Test.
Agronomy 12 02545 g007
Table 1. ANOVA and significance of F test for the main yield components and photosynthetic pigments as a result of removed flag leaf.
Source of VariationNo of Grains/SpikeWeight of Grains/SpikeChl aChl bCarotenoids
Ciprian
Year (A)****nsnsns
Phenophasis (B)**********
A × B**********
Andrada
Year (A)****nsnsns
Phenophasis (B)**********
A × B**********
Codru
Year (A)****nsns**
Phenophasis (B)**********
A × B**********
Probability values: ** p ≤ 0.01; ns = not significant.
Table 2. ANOVA for grain-quality indices.
Source of VariationGrain Protein ContentWet Gluten Content
Ciprian
Year (A)**ns
Phenophasis (B)****
A × B****
Andrada
Year (A)**ns
Phenophasis (B)****
A × B****
Codru
Year (A)***
Phenophasis (B)****
A × B****
Probability values: * p ≤ 0.05; ** p ≤ 0.01; ns = not significant.
Table 3. Pearson correlation between analyzed traits for both experimental years.
Ciprian Variety
20192020
NGSWGSChl aChl bCarotenoidsProteinWet gluten
NGS-0.84 ***−0.110.02−0.110.280.14
WGS0.85 ***-−0.44 0−0.43 0−0.49 000.31−0.06
Chl a−0.81 000−0.72 000-0.91 ***0.97 ***−0.47 000.34
Chl b−0.78 000−0.75 0000.97 ***-0.92 ***−0.35 00.24
Carotenoids−0.78 000−0.60 0000.96 ***0.89 ***-−0.45 000.22
Protein −0.10−0.170.62 ***0.65 ***0.54 **-0.24
Wet gluten−0.34−0.60 0000.250.340.040.18-
Andrada Variety
2019NGSWGSChl aChl bCarotenoidsProteinWet gluten
NGS-0.54 **0.190.18−0.040.59 ***0.59 ***
WGS0.54 **-−0.35 0−0.42 0−0.100.000.14
Chl a0.42 *0.22-0.96 ***0.81 ***0.64 ***0.34
Chl b0.230.080.90 ***-0.67 ***0.65 ***0.36 *
Carotenoids0.51 **0.38 *0.88 ***0.60 ***-0.310.04
Protein 0.090.17−0.030.19−0.21-0.86 ***
Wet gluten−0.58 000−0.83 000−0.070.09−0.250.20-
Codru Variety
2019NGSWGSChl aChl bCarotenoidsProteinWet gluten
NGS-0.67 ***0.02−0.19−0.38 00.41 *0.11
WGS0.92 ***-−0.58 000−0.69 000−0.70 0000.210.06
Chl a−0.42 0−0.30-0.90 ***0.52 **0.340.34
Chl b−0.42 0−0.38 00.95 ***-0.74 ***0.46 **0.54 **
Carotenoids−0.44 0−0.210.93 ***0.79 ***-0.190.29
Protein −0.13−0.050.54 **0.66 ***0.47 **-0.84
Wet gluten−0.47 00−0.60 0000.50 **0.64 ***0.300.12-
*/0, **/00, ***/000 Significant difference at p = 0.05, 0.01 level, respectively, 0.001.
Publisher’s Note: MDPI stays neutral with regard to jurisdictional claims in published maps and institutional affiliations.

