Article

Ferrate-Modified Biochar for Greenhouse Gas Mitigation: First-Principles Calculation and Paddy Field Trails

1
Key Laboratory of Crop Physiology and Molecular Biology Ministry of Education of the People’s Republic of China, College of Agronomy, Hunan Agricultural University, Changsha 410128, China
2
College of Chemistry and Chemical Engineering, Central South University, Changsha 410083, China
3
College of Information and Network Center, Central South University, Changsha 410083, China
*
Authors to whom correspondence should be addressed.
Agronomy 2022, 12(11), 2661; https://doi.org/10.3390/agronomy12112661
Submission received: 17 August 2022 / Revised: 30 September 2022 / Accepted: 26 October 2022 / Published: 27 October 2022

Abstract

:
Modified biochars have attracted attention for reducing greenhouse gas emissions in paddy fields. However, material screening difficulties and lengthy effect validation periods have restricted their development. We proposed a theoretical calculation method to guide short-term field trials in this study. Utilizing first-principles calculations, we determined that sodium ferrate-modified biochar (Fe@C) would limit methane (CH4) and nitrous oxide (N2O) emissions. Field trials confirmed that Fe@C increased rice yields and active organic carbon content in soil and reduced methane emissions and the global warming potential. However, applying sodium ferrate alone significantly reduced N2O emissions. Correlation analysis showed that methane was significantly negatively correlated with yield and the soil carbon pool labile index. N2O was significantly negatively correlated with urease activity, and significantly positively correlated with the soil carbon pool management index. Therefore, Fe@C provides a high-yielding management measure that enhances soil labile organic carbon. Additionally, its effects were controlled by the proportion of sodium ferrate. Our work provides a new strategy to guide the design of paddy field experiments via theoretical calculations, greatly shortening research time and providing solutions for carbon sequestration and emissions reduction.

1. Introduction

According to the latest assessment from the Intergovernmental Panel on Climate Change (IPCC), climate change and food security are the most serious challenges to human survival in history [1]. CH4 and N2O, the second and third most abundant greenhouse gases, respectively, have 34 and 298 times the warming potential of CO2 [2]. Rice fields, which emit large amounts of CH4 and N2O, account for 58% and 51% of the emissions from global agricultural land, respectively [3,4,5]. China is a major consumer of rice, and its domestic agricultural production supplies more than 95% of its food and other important agricultural products [6]. Therefore, China should reduce greenhouse gas emissions from rice paddies if it intends to achieve its carbon neutrality target by 2060 [7]. Reducing greenhouse gas emissions from paddy while ensuring food production security is a vital strategy for combating climate change. The application of non-polluting abatement materials on agricultural fields can influence the carbon and nitrogen cycles by altering soil physicochemical and biological properties. Therefore, developing new materials is crucial for efficient carbon sequestration and emissions reduction.
Biochar has attracted attention for carbon sequestration and emissions reduction in rice fields because of its abundant specific surface area, excellent ion replacement capacity, plentiful organic carbon content, suitable chemical properties, and high thermal stability [8,9]. Prior studies have demonstrated that biochar can significantly reduce CH4 emissions and enhance soil carbon sinks for paddy ecosystems, which are mainly attributed to changes in CH4 production, oxidation, and transport [10,11,12,13,14]. These changes are caused by the physicochemical properties of biochar, which can change the physicochemical properties and resident microorganisms of paddy, and inhibit CH4 emissions [15,16]. However, other studies have noted that biochar can increase CH4 emissions [17]. Therefore, the effects of biochar input on CH4 and N2O in rice fields are inconsistent [18,19]. Owing to the complexity of raw materials, diverse preparation processes, and varied application environments, many results are disparate. Thus, biochar has not been convincingly promoted to the public for reducing emissions in agricultural fields. Biochar is known to have a significant effect on CH4 and N2O emissions. The causes of this condition from altering soil permeability (increasing porosity) [20], modifying soil moisture [21], improving pH [22], and changing soil texture (temperature and humidity; clay, silt, and sand grains) [23], modifying microbial communities associated with CH4 and N2O [24], and directly adsorbing NH4+ [25,26]. However, the negative charges of biochar have exhibited poor adsorption ability for the negative ions in the paddy (NO3, PO4, etc.). Soil enzymes are released by soil microorganisms, plant roots, and decomposing plant and animal residues. Enzymes are the most bioactive substances in the ecosystem and are involved in soil metabolism. Urease reflects the decomposition of soil urea, whereas peroxidase is indicative of soil toxicity [27,28]. The effect of biochar on soil enzyme activity was multifactorial [29]. Increased soil enzymatic activity may result from the promotion of enzymatic reactions via the adsorption of reaction substrates by biochar [30].
Due to the different opinions on effects of applied biochar on greenhouse gases. The modification of biochar with various materials (such as metal monomers and their oxides) has been promoted to reduce the emission of both CH4 and N2O. Iron oxides are commonly used as remediation agents for rice field soils and inhibit greenhouse gas emissions [31,32]. CH4 emissions from rice fields are influenced by the oxidation-reduction potential (Eh) of the soil; when the soil Eh is −150 to −100 mV, methanogens produce large amounts of CH4 [33]. Fe-modified biochar can maintain a low soil Eh and high levels of root-surface Fe films, in addition to improving the stability of the biochar itself [34]. Trivalent iron in the root-surface Fe film acts as an electron acceptor that accelerates organic carbon mineralization, then effectively slowing greenhouse gas emissions from rice soils [35]. Fe reduction can decrease the steady-state concentration of H2 and acetic acid in the soil, which effectively inhibits CH4 production and the competitive consumption of electrons. Thus, CH4-generating processes in the soil are strongly inhibited [36]. Sodium ferrate is a hexavalent iron salt with strong oxidizing properties. It can release large quantities of atomic oxygen and Fe(OH)3 after dissolving in water, which increases the oxygen in the soil and creates a good environment for aerobic soil bacteria. Moreover, sodium ferrate dissolves in water and quickly forms trivalent iron, which rapidly adheres to the surfaces of biochar. The resulting iron-rich biochar surface significantly enhances the negatively charged surface area of the char. This provides more sites for dipole–dipole interactions with greenhouse gases. Thus, it can effectively suppress greenhouse gas emissions. However, the reduction effects and mechanism of sodium ferrate-modified biochar for greenhouse gases are not clear.
Therefore, this study adopted combination methods of theoretical calculation predictions and field experimental verification. Theoretical calculations directly reflected the effect of carbon sequestration and emission reduction in sodium ferrate-modified biochar. This study specifically aimed to predict the abatement effect and mechanism of sodium ferrate-modified biochar using theoretical calculations and verify this prediction via relevant indicators during a field experiment. It provided a novel material research strategy for greenhouse gas reduction in rice fields.

2. Materials and Methods

2.1. The Theoretical Calculation

The first-principles calculations were executed via Vienna Ab initio Simulation Package (VASP) based on the projector augmented wave (PAW) method [37,38,39]. The graphene (C) and its ferric hydroxide modification (Fe@C) are used as the substrate for research. Exchange–correction interactions and van der Waals interactions were considered by Perdew, Burke, and Ernzerhof (PBE) type, and DFT-D3, respectively [40]. The energy cutoff for all calculations was set to 500 eV, and the energy and force of convergence criteria were set to 10−5 eV and 0.02 eV Å−1 per atom. The 15 Å vacuum layer was employed to prevent the influence from adjacent periodic unit cells. The k-points parameter of geometry optimization and DOS calculation was set to 3 × 3 × 1 and 11 × 11 × 1 with the Monkhorst–Pack method. The DFT+U formalism described the localized d electrons, and the U value of Fe was set to 4 eV [41]. The adsorption energy (Ea) formula was defined as
Ea = Egas + Esubstrate − E(gas-substrate),
where Egas, Esubstrate, and E(gas-substrate) represented the total energy of the CH4 or N2O, the substrates of C or Fe@C, and the energy of the CH4 or N2O adsorption on the different substrates. The differential charge density diagram was drawn by vesta [42].

2.2. Field Experiment Location

The experiment was conducted in Beishan Town, Changsha County, Hunan Province (112°56′15″ E, 27°54′55″ N). The test site is located in the middle of the East Asian monsoon region, which belongs to the subtropical monsoon humid climate, with mild climate, abundant heat, rainfall, sufficient sunshine, and four distinct seasons. It is 15–25 °C in spring, 18–36 °C in summer and 5–15 °C in winter. The annual rainfall is 1000–1200 mm. The rice variety is Yu Zhenxiang (regular medium-ripening late indica, with a fertility period of 114 days) purchased from Jin Se Nong Feng Company. Biochar was purchased from Henan Lize Environmental Protection Technology Co., Ltd. The main components are rice straw and rice husk. Sodium ferrate (the main component is sodium ferrate powder, content ≥99.5%, the molecular formula is Na2FeO4, purchased in Zhengzhou Zhenlai Chemical Products Co.). The basic properties of soil and biochar in the test site are shown in Table 1.

2.3. Experimental Design and Management

The experiment was conducted from May to October 2021 in a single-factor randomized group design with six treatments and three replications in a total of 18 plots, each with an area of 30 m2, and the plots were separated by field ridges and mulch to prevent fertilizer cascading. The experimental treatments were as follows, CK: no sodium ferrate and biochar, as control. BC: Only biochar was applied at a rate of 15 t ha−1. 2%Fe: Sodium ferrate only at 0.3 t ha−1. 4%Fe: Only sodium ferrate was applied at a rate of 0.6 t ha−1. BC + 2%Fe: Biochar and sodium ferrate were applied at the same time, the amount of biochar applied was 15 t ha−1 and the amount of sodium ferrate applied was 0.3 t ha−1. BC + 4%Fe: Biochar and sodium ferrate were applied at the same time, the amount of biochar applied was 15 t ha−1 and the amount of sodium ferrate applied was 0.6 t ha−1.
Sown on 15 May 2021, transplanted on 12 June and harvested on 15 September. The transplanting density was 15 cm × 25 cm, and protective rows were set up around the test area. Sodium ferrate and biochar were weighed and mixed and the ridge was made and then applied at once 2 days before the rice seedlings were transplanted, using machinery to turn them into the soil. Fertilizer application, irrigation, and other field management practices were consistent across all plots, with a single row and single irrigation. Nitrogen fertilizer (urea): 267 kg ha−1; phosphorus fertilizer (phosphorus pentoxide): 97.5 kg ha−1; potassium fertilizer (potassium chloride) 200 kg ha−1. The proportion of nitrogen fertilizer is applied as base fertilizer: tiller fertilizer: spike fertilizer = 5:3:2; phosphorus fertilizer is applied as base fertilizer at one time; potassium fertilizer is applied as 50% of base fertilizer and 50% of tiller fertilizer. Base fertilizer was applied 5 d before transplanting and tiller fertilizer was applied 7 d after transplanting. Drain the field 30 d after transplanting, and dry the field for 5 d, then rehydrate and apply spike fertilizer.

2.4. Methods of Sample Collection and Analysis

2.4.1. The Soil Chemical Properties Preparation and Quantification

Before the test and after rice harvest, 0–20 cm tillage layer soil was taken from each plot by a 5-point method and mixed into one soil sample. After the soil samples were dried naturally in the laboratory, the residual litter and roots were picked out and ground through a 0.25 mm sieve for the determination of soil chemical indexes. Total nitrogen was determined by the Kjeldahl method. Total phosphorus was determined by NaOH melting and molybdenum–antimony resistance colorimetry. Total potassium was determined by NaOH fusion-flame photometry. Effective nitrogen was determined by the alkali-hydrolyzed diffusion method. Effective phosphorus was determined by molybdenum–antimony resistance colorimetry. Effective potassium was determined by the neutral ammonium acetate extraction method [43].

2.4.2. Greenhouse Gas Acquisition and Measurement in Paddy Fields

A static closed chamber method was used for greenhouse gas sampling and analysis [44]. After rice transplanting, every 7 d, with a closed static box sampling, sampling box for the cylinder, made of glass fiber reinforced plastic material, box bottom square side length 55 cm, 120 cm high, in the rice planting before the plastic base fixed in each plot, the base has six cavities of rice, measurement with water into the bottom tank to seal. Greenhouse gas sampling time is fixed at 9:00–11:00 a.m. The sampling time is 0, 10, 20, and 30 min after the hood box, respectively, and 45 mL gas samples are taken each time. The gas samples were analyzed by Agilent 7890A (Agilent Techologies, Santa Clara, CA, USA) gas chromatograph, and the standard gases were provided by the National Center for Reference Materials. The gas emission rates were derived from the four gas sample concentration values by linear regression analysis. Calculating greenhouse gas emission fluxes from rice fields according to Equation (2).
F = ρ · 273 273 + T · H · dC dt
F is the emission flux. ρ is the density of CH4 and N2O at standard atmospheric pressure, 0.714 and 1.98 kg m−3, respectively. T is the average temperature inside the sampling box during the sampling process, °C. H is the net height of the box cover of the sampling box, m. dC/dt is the rate of change in the greenhouse gas concentration in the sampling box.
Calculation method of total emission and mean emission flux: total CH4 emission is the sum of emissions from each rice reproductive period. The mean value of emission flux is the ratio of total CH4 emission to the field date during the field period. The seasonal cumulative emissions are calculated as follows Equation (3).
C = ( F i + 1 + F i ) / 2 × ( t i + 1 t i ) × 24
C denotes total greenhouse gas emissions (kg ha−1). i indicates the number of tests, F is the greenhouse gas emission flux (mg m−2 h−1), ti+1 ti is the interval between two adjacent gas withdrawals, and 10−2 is the conversion unit.
Global Warming Potential (GWP): The warming potential of a system is generally expressed in terms of CO2 equivalent. On a timescale of 100a, the combined greenhouse effect per unit mass of CH4 and N2O is 34 and 298 times higher than that of CO2, respectively. The warming potential is equal to the product of the cumulative seasonal emissions and the warming factor. The warming potential is Equation (4) to the product of the cumulative seasonal emissions and the warming factor.
GWP = 34 (CH4) + 298 (N2O)
GWP represents the combined greenhouse effect of CH4 and N2O gas emissions (kg CO2 ha−1). (CH4) and (N2O) represent the total cumulative emissions of CH4 and N2O, respectively (kg ha−1). The emission intensity (GHGI) is the quotient of the warming potential and the yield.

2.4.3. Soil Acquisition and Soil Enzyme Activities Measurement

Soil samples were collected in layers from 0 to 20 cm in each plot during the tillering, gestation, flush, lactation, and maturity stages of rice. Mixed soil samples were collected from three points in each plot, picked up to remove crop roots and small stones, dried naturally, ground, and passed through a 0.1 mm sieve for the determination of soil urease and peroxidase activities. The urease activity was expressed as milligrams of NH3-N in 1 g of soil after 24 h using the indophenol blue colorimetric method [45]. The amount of hydrogen peroxide decomposed by the enzymatic reaction was expressed by the difference between the number of milliliters of hydrogen peroxide required before and after the titration of the enzymatic reaction with 0.02 mol L−1 potassium permanganate per gram of dry soil for 20 min using the KMnO4 titration method [46]. In the process of measuring soil enzymes activities, the sample soil was incubated at constant temperature.

2.4.4. Soil Acquisition and Soil Organic Carbon Measurement

Soil samples of 0–20 cm were collected in different plots of the field at the time of crop harvest. After pretreatment with soil enzymes, the samples were passed through a 0.25 mm sieve for the determination of soil organic carbon. Soil total organic carbon (TOC) was determined using a conventional method, namely the K2Cr2O7 oxidation method [47]. The sampling method and sampling time for soil labile organic carbon (LOC) were the same as those for organic carbon, and the determination method was based on the 0.333 mol L−1 potassium permanganate colorimetric method [48].
Soil carbon pool management indices were calculated according to Equation (5) to (9) using soils under the conditions without the application of sodium ferrate and biochar treatment as reference agricultural soils.
ROC (g kg−1) = TOC − LOC
CPI = Sample TOC/Reference TOC
CPL = LOC/ROC
CPLI = Sample CPI/Reference CPI
CPMI = CPI × CPLI
ROC, CPI, CPL, CPLI, and CPMI are the soil recalcitrant organic carbon, the soil carbon pool index, the soil labile organic carbon pool, the soil organic carbon pool labile index, and the soil carbon pool management index, respectively.

2.4.5. Yield Determination

At the rice maturity, each plot was harvested within 2 m2 (marked as yield measurement area after transplanting), manually threshed using a small threshing machine and then dried in the sun to obtain the sun-dried weight. Then take a small amount from it using the oven drying method (75 °C baking to constant weight) to determine the water content, so as to obtain the drying weight. The corrected water content was 13.5%, which was then converted into the actual yield.

2.5. Statistical Analyses

All data were collected using Excel 2013 (Microsoft Corporation, Redmond, USA). Origin 2021 (Origin Lab Corporation, Northampton, MA, USA) was used to draw the figures. The IBM SPSS statistics 20 software (International Business Machines Corporation, New York, NY, USA) was performed by Analysis of variance (ANOVA) and correlation analysis.

3. Results

3.1. Theoretical Prediction

Firstly, the adsorption abilities of substrates for CH4 and N2O were investigated. Previous studies have reported that the stronger adsorption ability is reflected by the more positive value of adsorption energy [49]. As shown in Figure 1a, the adsorption energies for CH4 and N2O on C or Fe@C are 0.13 and 1.41 or 0.21 and 2.11 eV, respectively. These results indicated that with the introduction of the iron compound, the Fe@C shows exceptional adsorption behavior on both CH4 and N2O. Then, we calculated the density of states (DOS) of different adsorption systems to describe the electronic properties of diverse elements. As shown in Figure 1b, there are no obvious orbital peak shifts during the CH4 adsorbed on both C and Fe@C than before, which implied that has not existed the distinct electronic exchange between CH4 and substrates. In the meantime, shifts in orbital peaks developed as the N2O was adsorbed to C or Fe@C (Figure 1c). Compared with C, Fe@C shows the more obvious orbital peak shifts which ascribe to the larger electronic exchange. These phenomena are also confirmed by electron charge density difference, which is used to describe the charge redistribution of adsorbed on CH4 and N2O by C or Fe@C. Consistent with the DOS results, there are no distinct regions of charge exchange during CH4 adsorption on C and Fe@C which means there main exists the physical adsorption between CH4 and substrates (Figure 1d,f). However, different from N2O-C systems, there are evidently depleted and accumulated areas of charge between N2O and Fe@C which demonstrates that the Fe@C can restrict the N2O with the physicochemical adsorption (Figure 1e,g). The results of the electron charge density difference are identical to the adsorption energy and DOS results which implied Fe@C will be an outstanding performance for CH4 and N2O restricted.

3.2. CH4 and N2O Emissions

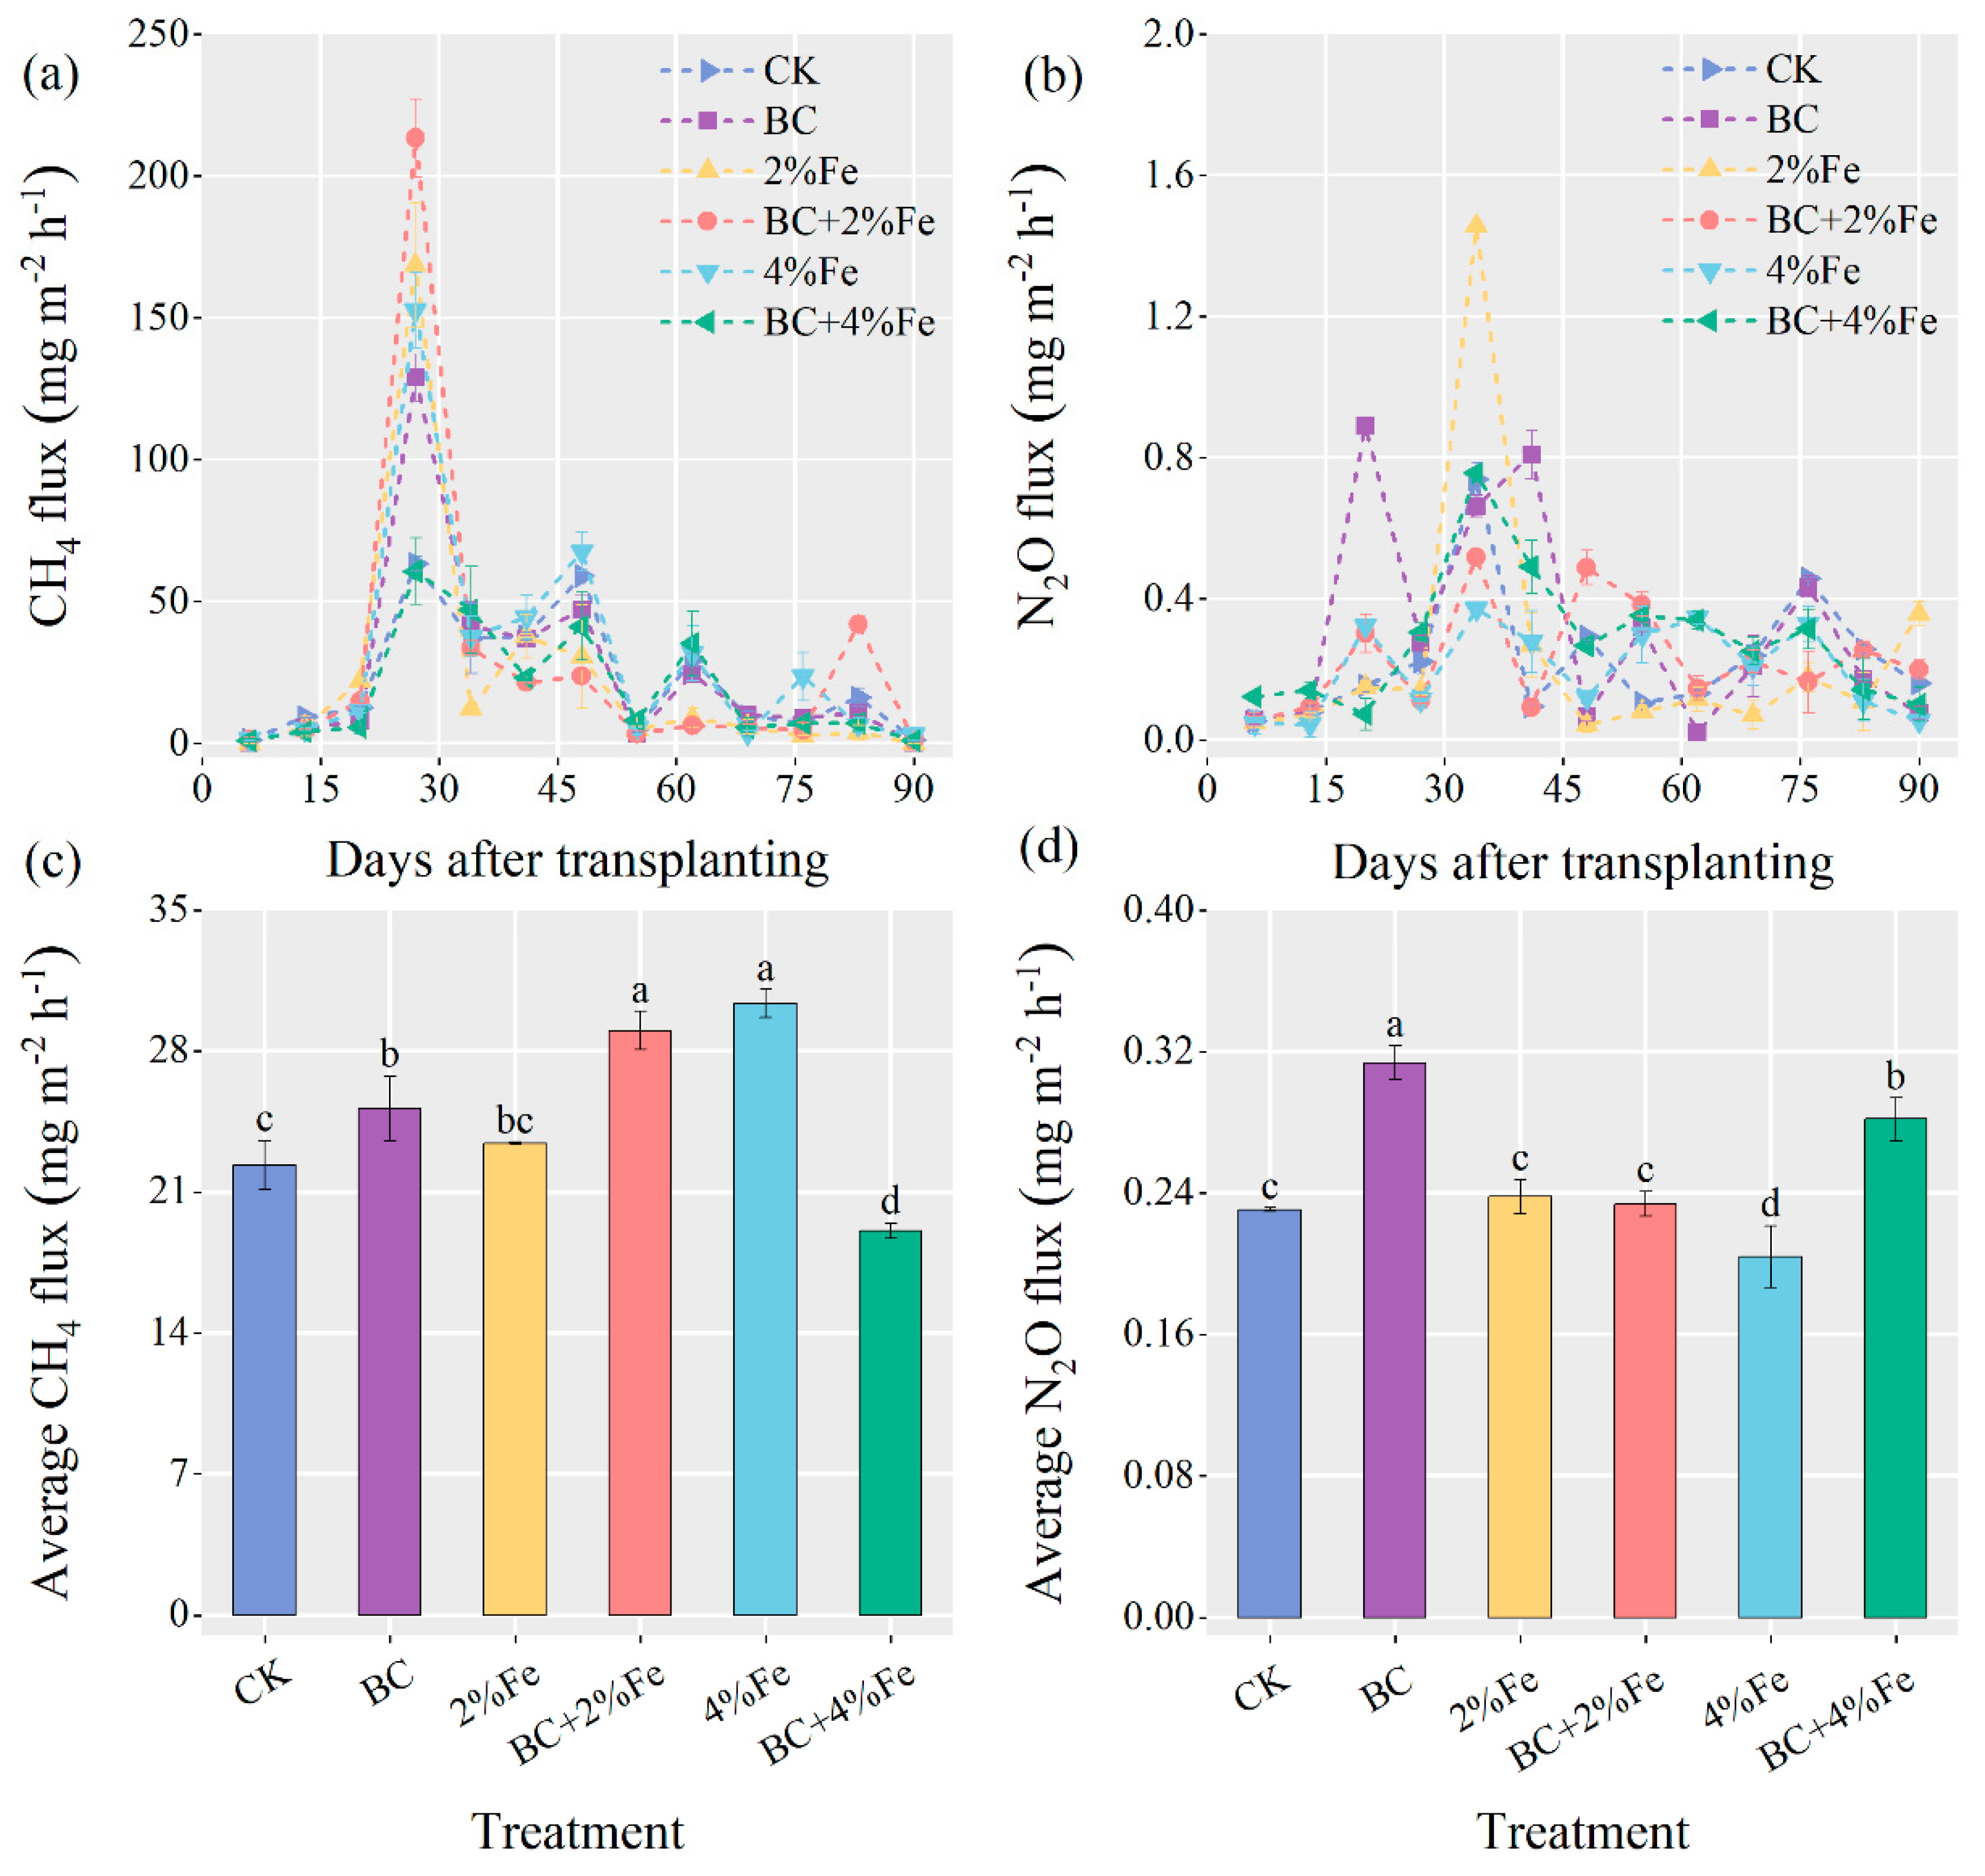
The CH4 emission flux varied greatly with the crop growing season (Figure 2a,c). From 0 to 20 d after transplantation, the CH4 emissions were low. There were two obvious peaks in CH4 emissions during 20–60 d after transplantation. The first was at approximately 28 d, and the second was at approximately 49 d. In the first emissions peak, the CH4 emission fluxes of all treatments reached their maximum value for the entire rice-growing season, ranging from 60.75 to 213.42 mg m−2 h−1. The CH4 emission fluxes of BC + 2%Fe were the largest, whereas those of BC + 4%Fe were the smallest. During the second emission peak, the CH4 emission flux of 4%Fe (67.60 mg m−2 h−1) was higher than that of all other treatments. Overall, 4%Fe (30.39 mg m−2 h−1) and BC + 4%Fe (19.09 mg m−2 h−1) showed the highest and lowest average CH4 fluxes, respectively. There is no significant difference in the average CH4 emission fluxes between BC + 2%Fe and 4%Fe.
N2O emission fluxes showed significant seasonal variations and continued to fluctuate until harvest (Figure 2b,d). The N2O emissions peaked at 15–45 d. BC showed two emission peaks during this period, whereas the remaining treatments had their highest emission values at 35 d. The CK, 2%Fe, and BC + 2%Fe treatments showed no significant differences in N2O emission fluxes. The highest and lowest mean N2O fluxes were observed under BC (0.31 mg m−2 h−1) and 4%Fe (0.2 mg m−2 h−1), respectively (Figure 2d).

3.3. Greenhouse Effect and Yield

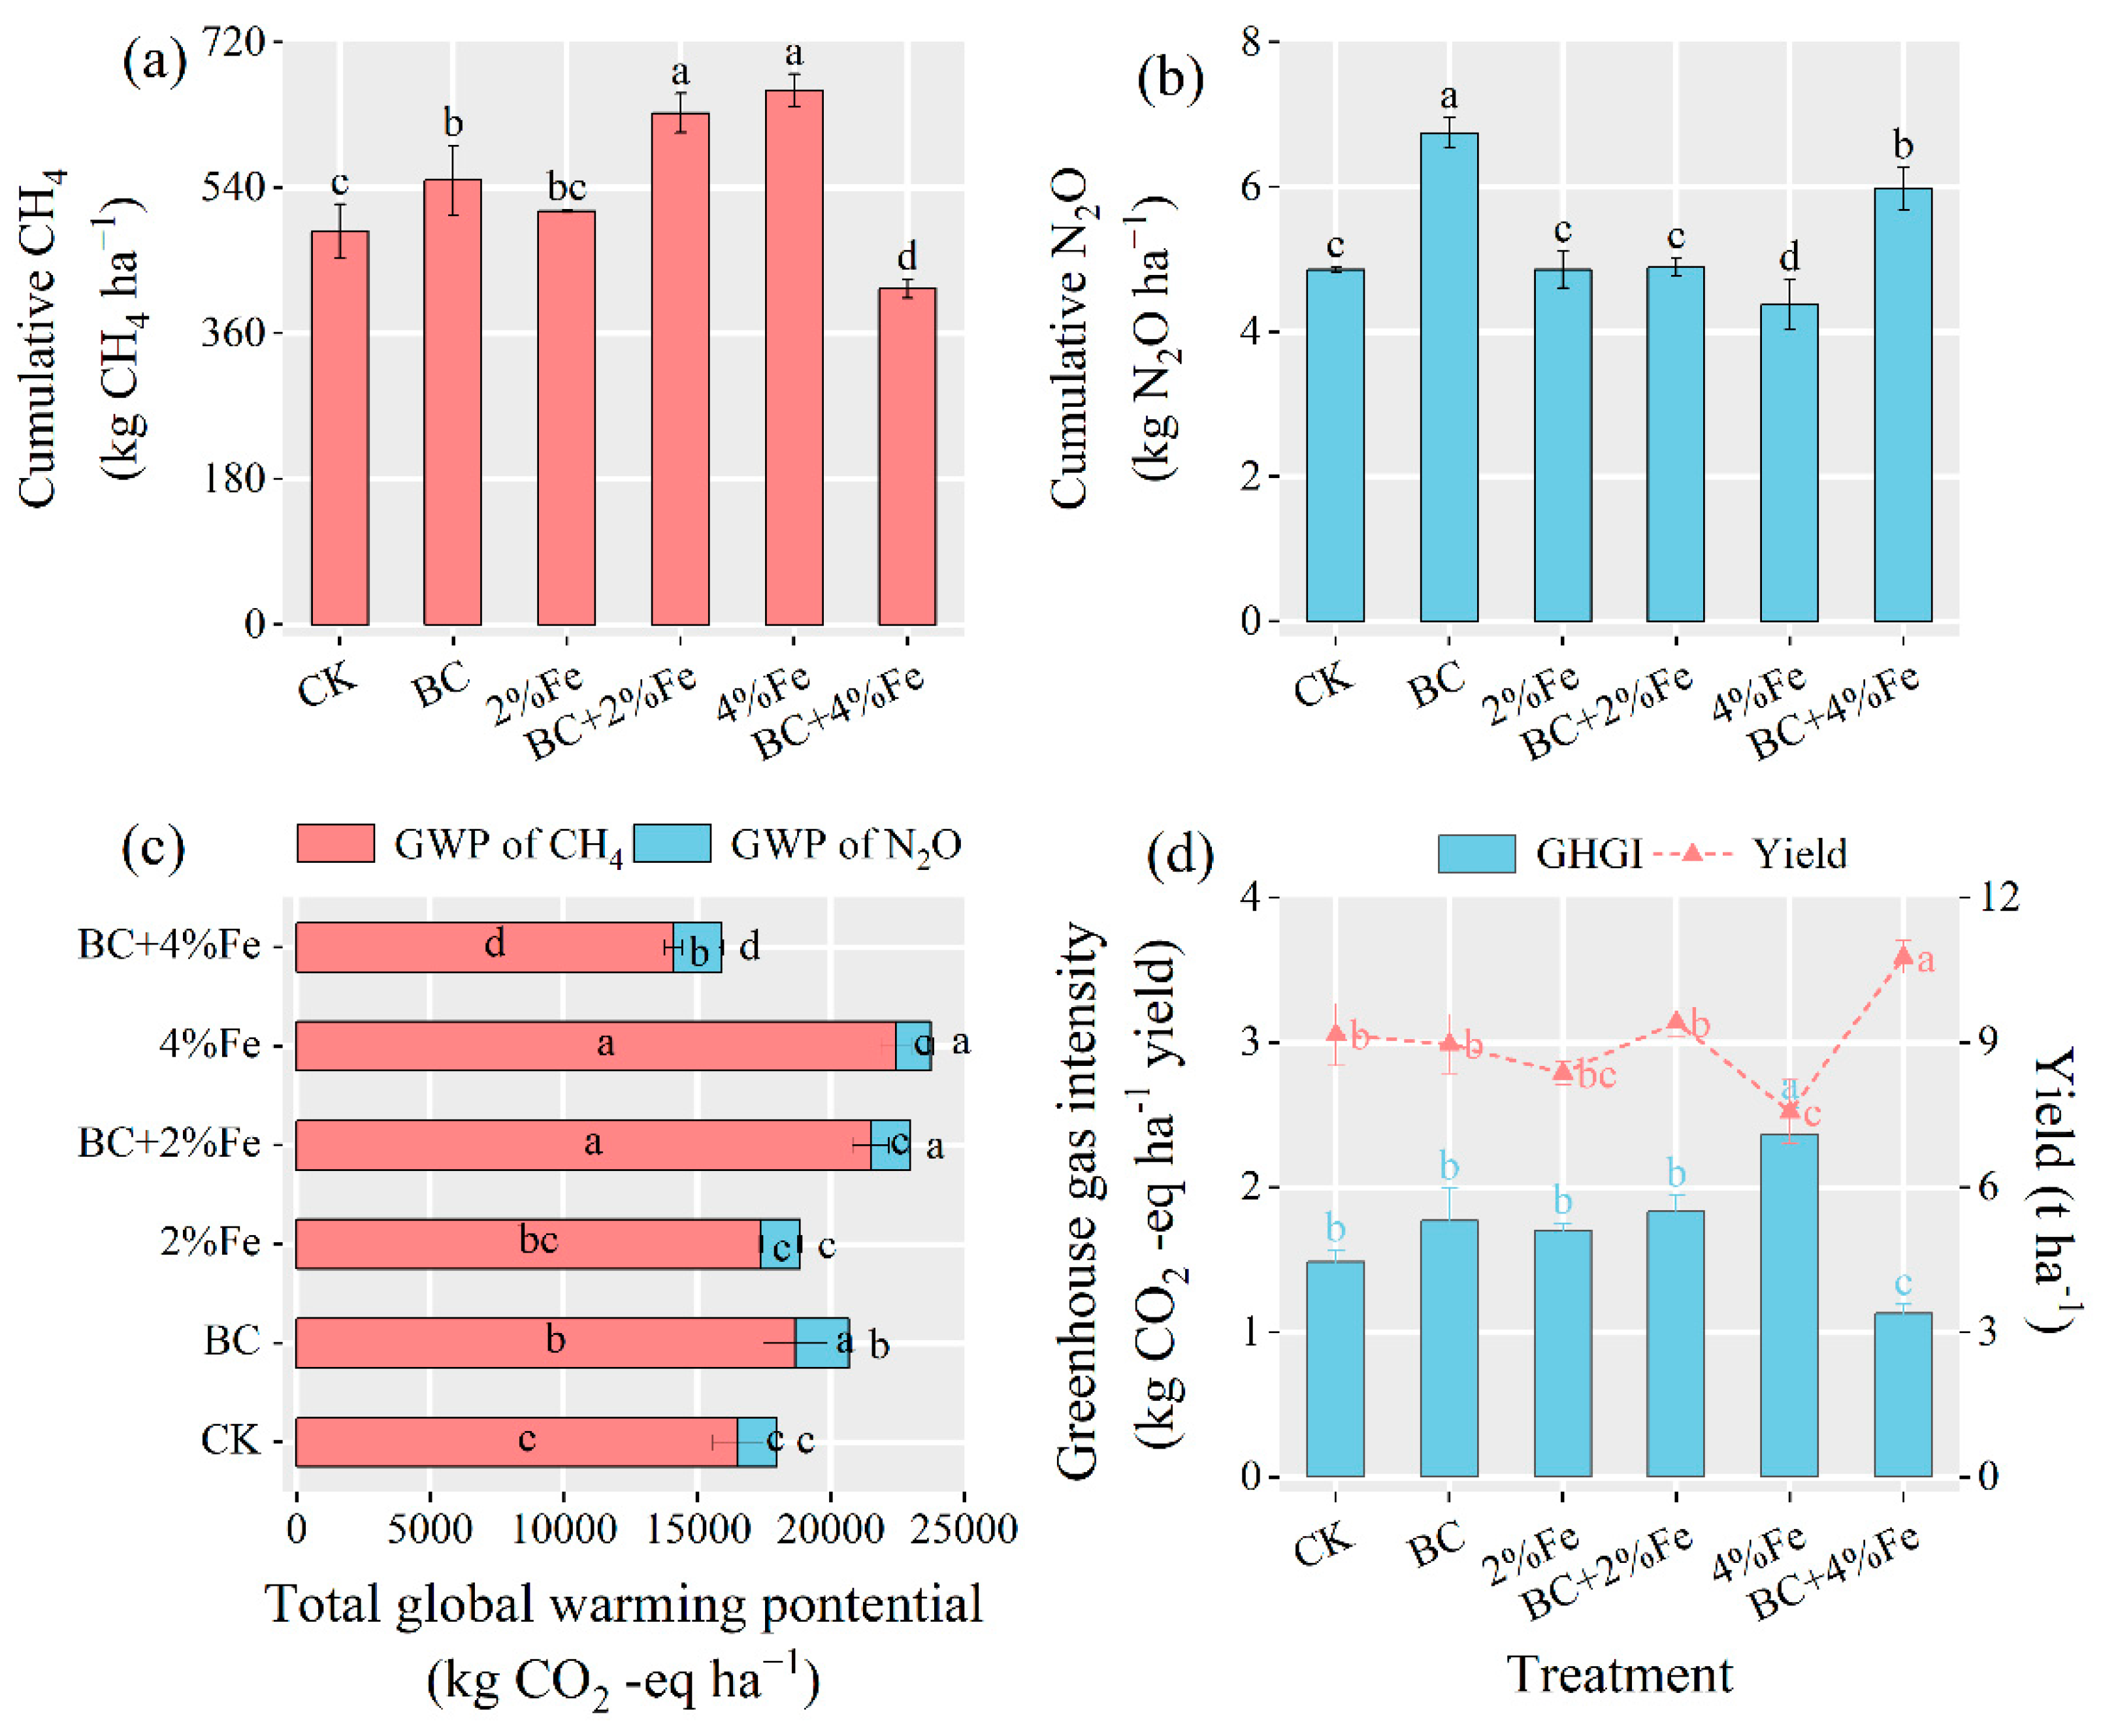
Cumulative CH4 and N2O emissions, GWP, GHGI, and yield differed among treatments (Figure 3). The cumulative CH4 under each treatment ranged from 415.31 to 660.15 kg ha−1. Among, 4%Fe (660.15 kg ha−1) and BC + 2%Fe (632.16 kg ha−1) exhibited higher cumulative CH4 values than others, and lower values were identified under BC + 4%Fe (415.31 kg ha−1) (Figure 3a). Additionally, the cumulative N2O values varied significantly among these treatments. The highest cumulative N2O emission was observed under BC (6.74 kg ha−1), followed by BC + 4%Fe (5.97 kg ha−1), and the lowest value was recorded for 4%Fe (4.37 kg ha−1) (Figure 3b). The total GWP showed a similar trend to the CH4 emissions, with low values observed for BC + 4%Fe (Figure 3c). Furthermore, the GHGI of BC + 4%Fe was the lowest and that of 4%Fe was the highest. In terms of yield, BC + 4%Fe (10.77 kg ha−1) provided the highest yield, whereas 4%Fe (7.57 kg ha−1) had the lowest (Figure 3d).

3.4. Soil Urease Activities

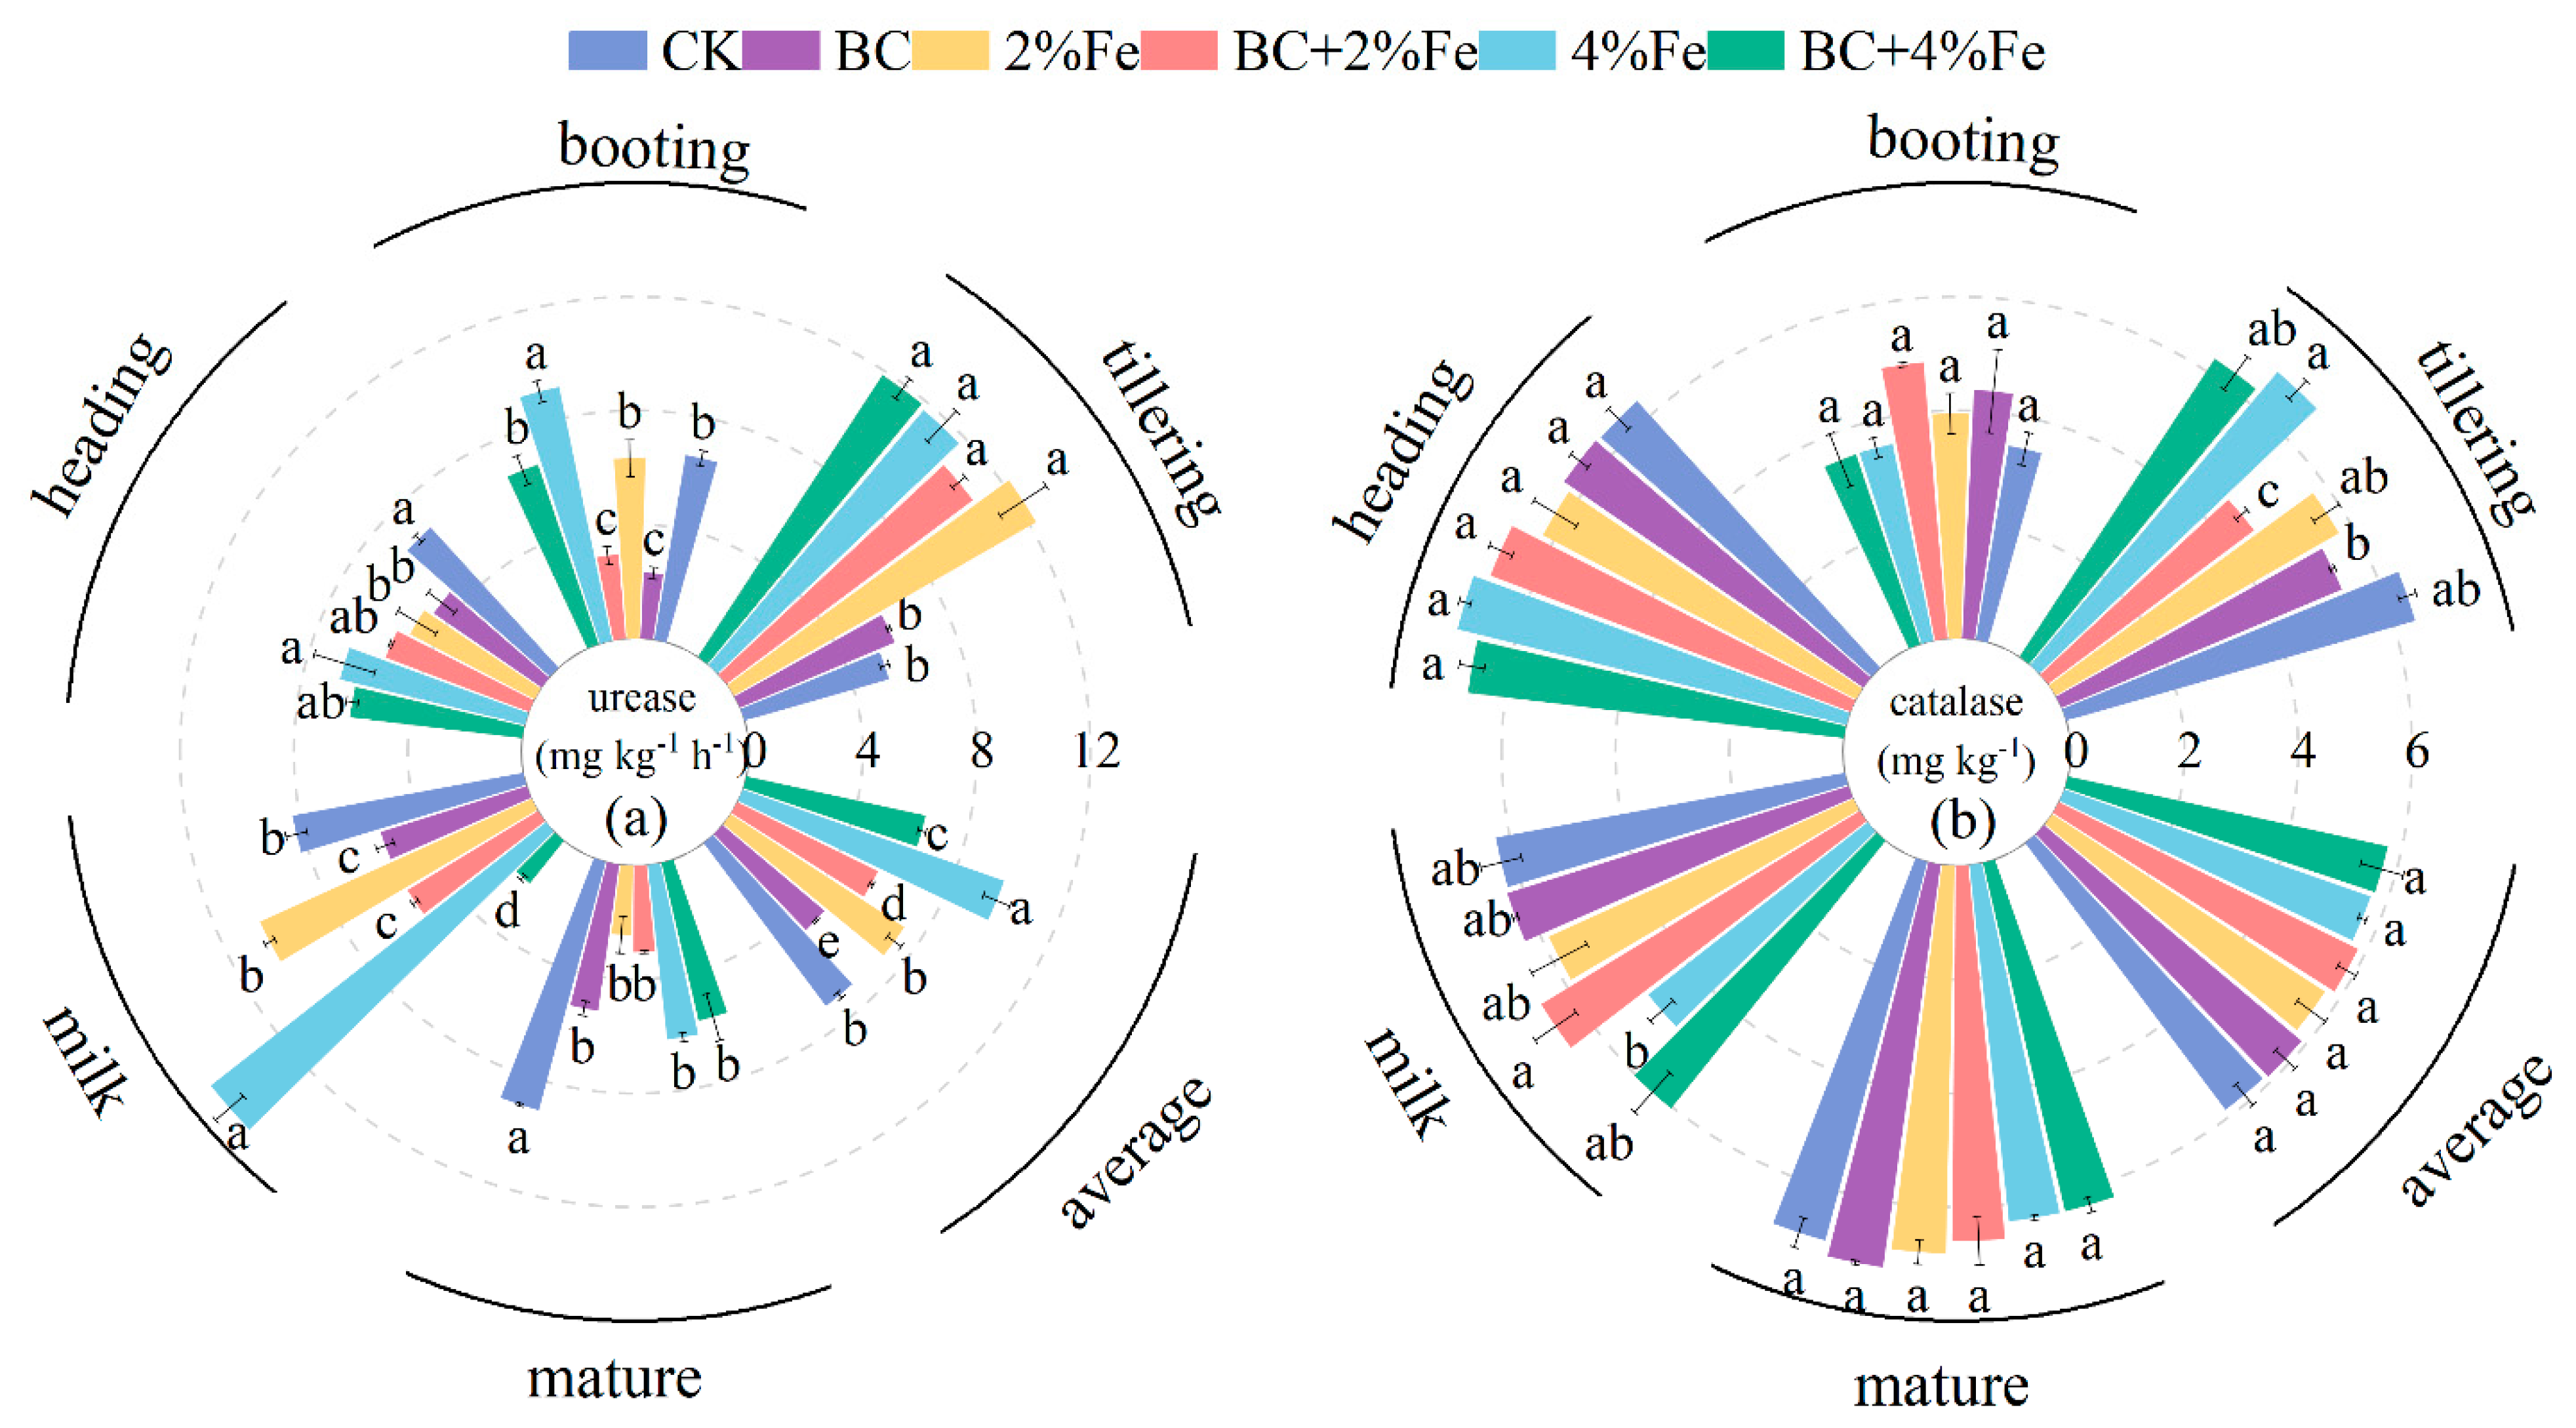
Urease activity fluctuated greatly throughout the growth stages (Figure 4a). Moreover, the changes in urease activity were not consistent among treatments throughout the growth period. In the CK treatment, urease activity increased steadily during the growth period and reached its highest level at maturity. The urease activity under BC + 4%Fe decreased continuously from the tillering stage to milk maturity but increased at maturity. The urease activity under 2%Fe and 4%Fe decreased with advancing growth stage, increased significantly at the milk maturity stage, and then decreased to its lowest level at the maturity stage. The urease activity under BC and BC + 2%Fe was the highest at the tillering stage and was lower but stable during later stages. The urease activity under 4%Fe was higher than that of other treatments from the tillering to milk maturity stage, whereas the urease activity under CK was the highest at the maturity stage. The 4%Fe treatment had the highest urease activity, whereas the BC + 4%Fe treatment had the lowest urease activity. The mean urease activity differed significantly between treatments, with 4%Fe having the highest urease activity, followed by CK, and 2%Fe. BC had the lowest urease activity.

3.5. Soil Catalase Activities

Catalase activity differed significantly at the tillering stage but not at other growth stages (Figure 4b). The soil catalase activity first decreased and then increased with the growth stage. It decreased from the tillering to booting stage, then increased, and tended to be moderate at the milk and maturity stages. Additionally, the enzymatic activity among all treatments tended to be consistent at each stage. The catalase activity of BC + 2%Fe slightly increased from the tillering to booting stage. The mean catalase activity of each treatment group was not significantly different.

3.6. Soil Organic Carbon

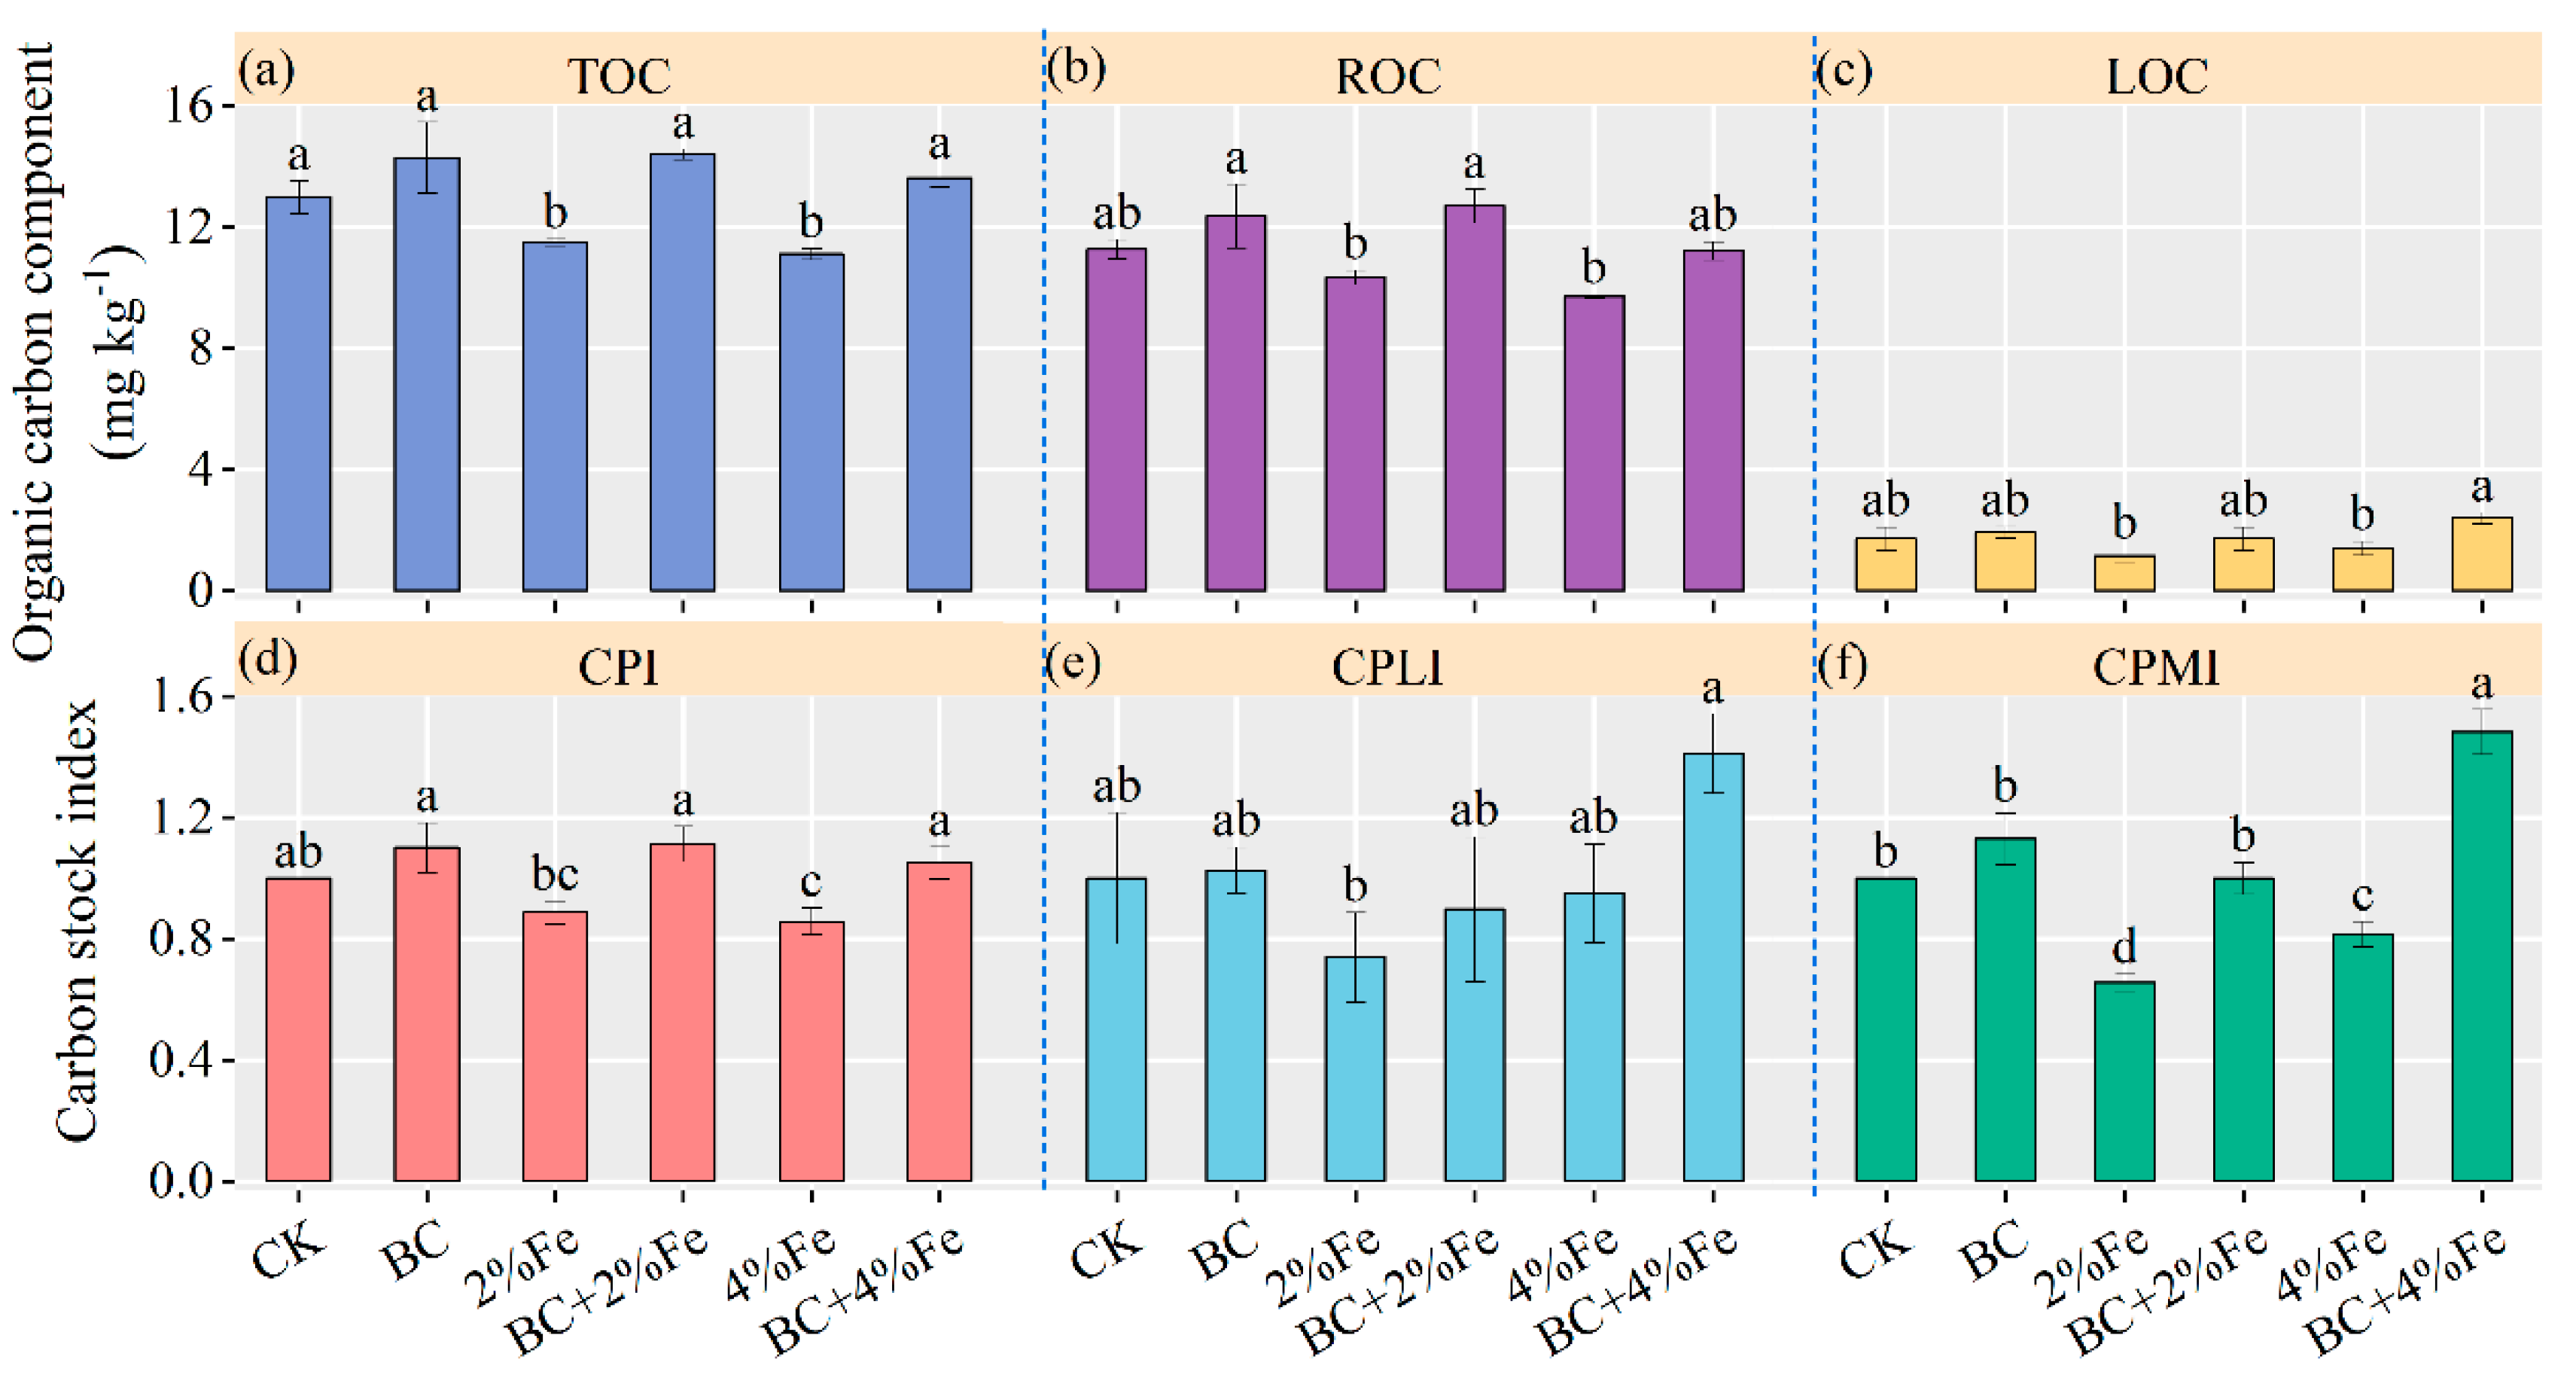
The dynamic changes in soil organic carbon and carbon pool characteristics during the rice maturation period are shown in Figure 5. The total organic carbon varied from 11.1 mg kg−1 to 14.28 mg kg−1 among the different treatments, with the highest value under BC (Figure 5a). Soil recalcitrant organic carbon had similar values to TOC, ranging from 9.7 mg kg−1 to 12.68 mg kg−1; BC + 2%Fe had the highest value (Figure 5b). However, the soil labile organic carbon differed, and BC + 4%Fe showed the highest value (Figure 5c). The proportion of LOC in TOC was lower than that in ROC. Dynamic changes in the carbon pool index and carbon pool labile index were also observed in different treatments (Figure 5d,e). BC + 2%Fe (1.11) exhibited the highest CPI value, whereas BC + 4%Fe (1.41) exhibited the highest CPLI. Moreover, the carbon pool management index differed significantly among the treatments, with the highest and lowest CPMI observed in BC + 4%Fe (1.48) and BC + 2%Fe (0.66), respectively (Figure 5f). The lowest CPI was observed in 4%Fe (0.85), and the lowest CPLI and CPMI values were found in 2%Fe.

3.7. Relationship Analysis of Greenhouse Gas Emissions, Yields, Organic Carbon Characteristics, and Soil Enzymes Activities

As shown in Figure 6, CH4 and N2O emissions were greatly influenced by yield and soil organic carbon. CH4 emissions were negatively correlated with yield and CPLI. N2O emissions were positively correlated with yield, TOC, LOC, CPI, and CPMI but negatively correlated with urease enzyme activity and GHGI. Furthermore, soil organic carbon characteristics were significantly negatively correlated with urease activity and negatively correlated with yield. GWP and GHGI were negatively correlated with CPLI.

4. Discussion

4.1. Soil Organic Carbon

Compared with that of the CK treatment, the SOC content significantly increased when biochar was applied alone or mixed with sodium ferrate, indicating that biochar promoted the accumulation of soil organic carbon (Figure 5a,c). This may be because biochar itself is rich in organic carbon, thus it directly increases the SOC content when applied to the soil [50]. Owing to the ROC, it degraded slowly in the soil; therefore, the SOC content of the rice fields increased over time [51]. These results were similar to those reported by Khan et al. [52]. However, compared with the CK treatment, all treatments with only Fe reduced the organic carbon content, indicating that the addition of sodium ferrate alone was not conducive to the accumulation of SOC (Figure 5). Under anaerobic conditions, sodium ferrate rapidly produces trivalent iron, which is subsequently reduced by biota or chemical reduction. Hence, the SOC protected by the trivalent iron may be released due to its reduction; this corroborates the increase in CH4 emissions from Fe application alone under these test conditions [53]. In terms of LOC, BC + 2%Fe and BC + 4%Fe increased it significantly, indicating that the simultaneous application of high amounts of sodium ferrate and biochar was beneficial for the accumulation of LOC. This may be because of the attachment of sodium ferrate-derived colloidal substances to the biochar changes the original properties of the biochar and stimulates the conversion of inert organic carbon to LOC [54].

4.2. Soil Enzymes

The present study found that the addition of biochar significantly reduced urease activity, but its effect on catalase was not significant. Decreased activity may result from the adsorption of enzyme molecules by biochar, which protects the binding sites for enzymatic reactions and prevents them from proceeding [55]. The highest enzymatic activity was reached with the 4% addition of sodium ferrate (Figure 4a,b). This could indicate that sodium ferrate stimulates soil urease activity, while indirectly indicating that the combined application of sodium ferrate and biochar has insignificant toxic effects on rice fields. Ergang et al. used modified biochar and found a similar decrease in urease activity [56]. Urease activity was also significantly lower in BC + 2%Fe and BC+4%F e than that in CK (Figure 4a). Furthermore, urease showed a significant negative correlation with N2O (−0.75 ***) and LOC (−0.48 *), whereas LOC showed a highly significant positive correlation with yield (0.65 **) and N2O (0.54 **) (Figure 6). These results indicate that urease in the soil can inhibit N2O and LOC, and the greater the accumulation of LOC, the more urase decreases N2O emissions and yield.

4.3. Trends of CH4 Emission Fluxes

Some studies have shown that sodium ferrate or biochar applications can reduce CH4 emissions from rice fields [10,31]. However, little research has been conducted on the effects of applying combined sodium ferrate and biochar on CH4 in rice fields. In this study, all treatments showed a consistent pattern of change at each fertility stage, with the first, highest peak in CH4 emissions approximately 28 d after transplantation (Figure 2a). This may be because rice plants grow luxuriantly during the tillering stage, with a high number of tillers, and rice roots and aeration tissues grow vigorously. Rice aeration tissues are the main pathway for CH4 emission to the atmosphere; thus, they facilitate emissions by increasing CH4 emission channels [57]. Simultaneously, rice is irrigated by long-term flooding during the tillering period, soil permeability is poor, and there is sufficient methanogenic substrate in the soil. Thus, soil methanogenic bacteria can produce large amounts of CH4. The second peak period occurred 49 d after transplantation. The spike fertilizer was applied at this time, which stimulated CH4 emissions [58]. CH4 emission fluxes gradually decreased and leveled off 63 d after transplantation owing to improved soil aeration caused by reduced moisture, which inhibited CH4 production and promoted CH4 oxidation.

4.4. Differences in Cumulative CH4 Emissions between Treatments

Consistent performance was observed in terms of average greenhouse gas emission fluxes and seasonal cumulative emissions from rice fields (Figure 2c,d and Figure 3a,b). Strictly speaking, no clear and consistent conclusion exists regarding the effects of biochar on CH4 emissions. Nevertheless, in this study, biochar application alone was found to have a facilitative effect on CH4 production (Figure 3a), compared with that of the control. Biochar contains nitrogen, and the experimental treatment did not reduce nitrogen (Table 1), which contributed to CH4 emissions [59]. Additionally, the application of 2%Fe and 4%Fe alone increased the cumulative CH4 emissions (Figure 3a). Compared with those of the CK treatment, BC + 2%Fe significantly promoted CH4 emissions, whereas BC + 4%Fe significantly reduced CH4 emissions. This suggests that sodium ferrate modified biochar does significantly reduce CH4 emissions; however, this may be related to the ratio of biochar to sodium ferrate. Biochar rapidly adsorbs Fe(OH)3 colloids generated from sodium ferrate, modifying the surface carbon pore structure of the biochar, thus enhancing emissions reduction. This coincides with the CH4 emissions reduction observed for the modified biochar [60,61].

4.5. Differences in N2O Emissions and Greenhouse Effect between Treatments

From 0 to 45 d, N2O emission fluxes increased in all treatments, probably because N2O emissions are highly sensitive to N fertilizer and soil moisture [62]. From 45 d to harvest, the N2O emissions gradually decreased as soil aeration improved owing to field moisture and nutrient reductions. Figure 3b shows the cumulative N2O emissions, which contrast with the results of Liu et al. [63]. Similar to the CH4 emissions, biochar application alone promoted N2O emissions, which increased following the addition of biochar to the soil [64]. Some studies on biochar have correlated the reduction in N2O emissions with urease activity, which was the main driver of the increase in N2O emissions in this case. In this study, 4%Fe was found to cause the most significant N2O reduction, which was also reported by Ciais et al. [35]. Greenhouse gas emission intensity is a comprehensive index of the greenhouse effect used to evaluate the greenhouse effects of the rice fields. The magnitude of GWP was mainly influenced by CH4, and the magnitude of GWP for all treatments was the same as the respective cumulative CH4 emissions. Compared with those of CK, the BC + 4%Fe treatment had the lowest gas emission intensity but the highest yield, indicating that the BC + 4%Fe treatment had the best combined greenhouse gas reduction and the best yield under the production conditions.

5. Conclusions

In summary, we demonstrated a method for theoretical calculations to shorten the study time in rice paddies by predicting the ability of sodium ferrate-modified biochar to adsorb CH4 and N2O through first-principles calculations. Guided by theoretical simulations, modifications were selected for carbon sequestration and reduction in the rice paddies. The field test data confirmed the advantages of sodium ferrate-modified biochar. Compared with that of CK, BC + 4%Fe reduced CH4 and increased the yield by 14.57% and 17.45%, respectively. Moreover, it increased the accumulation of LOC. This method, verified by theoretical calculations and rice field experiments, directly reflects the effects of carbon sequestration and emissions reduction via high-valent iron-modified biochar. This provides a new avenue for future research and the development of new materials for greenhouse gas reduction in rice fields.

Author Contributions

Z.F. and H.W. designed the experiments and provided theoretical calculation; W.Z. collected and analyzed the data, wrote the manuscript; W.Z., Y.Z., K.Z. and R.X. performed the experiments; H.W., P.L., Y.X. and Z.F. provided writing guidance; X.M. and Q.W. provided guidance of theoretical calculation. All authors have read and agreed to the published version of the manuscript.

Funding

This work was supported by the National Natural Science Foundation of China (41571293), Natural Science Foundation of Hunan Province (2021JJ30319), Graduate Research Innovation Project of Hunan Agricultural University.

Institutional Review Board Statement

Not applicable.

Informed Consent Statement

Not applicable.

Data Availability Statement

Not applicable.

Acknowledgments

This work was carried out in part using hardware and/or software provided by the High Performance Computing Center of Central South University.

Conflicts of Interest

The authors declare that they have no known competing financial interests or personal relationships that could have appeared to influence the work reported in this paper.

References

  1. Arias, P.; Bellouin, N.; Coppola, E.; Jones, R.; Krinner, G.; Marotzke, J.; Naik, V.; Palmer, M.; Plattner, G.-K.; Rogelj, J. Climate Change 2021: The Physical Science Basis. Contribution of Working Group I to the Sixth Assessment Report of the Intergovernmental Panel on Climate Change; Technical Summary; IPCC: Geneva, Switzerland, 2021. [Google Scholar]
  2. Yan, S.; Zhang, J.; Jiang, Y.; Deng, A. Win-win strategy for national food security and agricultural double-carbon goals. Sci. Agric. Sin. 2021, 54, 3892–3902. [Google Scholar]
  3. Hussain, S.; Peng, S.; Fahad, S.; Khaliq, A.; Huang, J.; Cui, K.; Nie, L. Rice management interventions to mitigate greenhouse gas emissions: A review. Environ. Sci. Pollut. Res. 2015, 22, 3342–3360. [Google Scholar] [CrossRef] [PubMed]
  4. Khan, A.; Tan, D.K.Y.; Munsif, F.; Afridi, M.Z.; Shah, F.; Wei, F.; Fahad, S.; Zhou, R. Nitrogen nutrition in cotton and control strategies for greenhouse gas emissions: A review. Environ. Sci. Pollut. Res. 2017, 24, 23471–23487. [Google Scholar] [CrossRef] [PubMed]
  5. Qi, L.; Niu, H.-D.; Zhou, P.; Jia, R.-J.; Gao, M. Effects of biochar on the net greenhouse gas emissions under continuous flooding and water-saving irrigation conditions in paddy soils. Sustainability 2018, 10, 1403. [Google Scholar] [CrossRef] [Green Version]
  6. Pachauri, R.K.; Allen, M.R.; Barros, V.R.; Broome, J.; Cramer, W.; Christ, R.; Church, J.A.; Clarke, L.; Dahe, Q.; Dasgupta, P. Climate Change 2014: Synthesis Report: Contribution of Working Groups I, II and III to the Fifth Assessment Report of the Intergovernmental Panel on Climate Change; IPCC: Geneva, Switzerland, 2014. [Google Scholar]
  7. Mallapaty, S. How China could be carbon neutral by mid-century. Nature 2020, 586, 482–484. [Google Scholar] [CrossRef]
  8. Cui, J.; Glatzel, S.; Bruckman, V.J.; Wang, B.; Lai, D.Y.F. Long-term effects of biochar application on greenhouse gas production and microbial community in temperate forest soils under increasing temperature. Sci. Total Environ. 2021, 767, 145021. [Google Scholar] [CrossRef] [PubMed]
  9. Shakoor, A.; Shahzad, S.M.; Chatterjee, N.; Arif, M.S.; Farooq, T.H.; Altaf, M.M.; Tufail, M.A.; Dar, A.A.; Mehmood, T. Nitrous oxide emission from agricultural soils: Application of animal manure or biochar? A global meta-analysis. J. Environ. Manag. 2021, 285, 112170. [Google Scholar] [CrossRef]
  10. Karhu, K.; Mattila, T.; Bergstrom, I.; Regina, K. Biochar addition to agricultural soil increased CH4 uptake and water holding capacity—Results from a short-term pilot field study. Agric. Ecosyst. Environ. 2011, 140, 309–313. [Google Scholar] [CrossRef]
  11. Wu, Z.; Zhang, X.; Dong, Y.; Li, B.; Xiong, Z. Biochar amendment reduced greenhouse gas intensities in the rice-wheat rotation system: Six-year field observation and meta-analysis. Agric. For. Meteorol. 2019, 278, 107625. [Google Scholar] [CrossRef]
  12. Scheer, C.; Grace, P.R.; Rowlings, D.W.; Kimber, S.; Van Zwieten, L. Effect of biochar amendment on the soil-atmosphere exchange of greenhouse gases from an intensive subtropical pasture in northern New South Wales, Australia. Plant Soil 2011, 345, 47–58. [Google Scholar] [CrossRef] [Green Version]
  13. Liu, J.; Shen, J.; Li, Y.; Su, Y.; Ge, T.; Jones, D.L.; Wu, J. Effects of biochar amendment on the net greenhouse gas emission and greenhouse gas intensity in a Chinese double rice cropping system. Eur. J. Soil Biol. 2014, 65, 30–39. [Google Scholar] [CrossRef]
  14. Xu, W.; Whitman, W.B.; Gundale, M.J.; Chien, C.C.; Chiu, C.Y. Functional response of the soil microbial community to biochar applications. GCB Bioenergy 2021, 13, 269–281. [Google Scholar] [CrossRef]
  15. Kubaczyński, A.; Walkiewicz, A.; Pytlak, A.; Grządziel, J.; Gałązka, A.; Brzezińska, M. Biochar dose determines methane uptake and methanotroph abundance in Haplic Luvisol. Sci. Total Environ. 2022, 806, 151259. [Google Scholar] [CrossRef] [PubMed]
  16. Jiang, Z.; Yang, S.; Pang, Q.; Xu, Y.; Chen, X.; Sun, X.; Qi, S.; Yu, W. Biochar improved soil health and mitigated greenhouse gas emission from controlled irrigation paddy field: Insights into microbial diversity. J. Clean. Prod. 2021, 318, 128595. [Google Scholar] [CrossRef]
  17. Wang, J.; Pan, X.; Liu, Y.; Zhang, X.; Xiong, Z. Effects of biochar amendment in two soils on greenhouse gas emissions and crop production. Plant Soil 2012, 360, 287–298. [Google Scholar] [CrossRef]
  18. Maroušek, J.; Rowland, Z.; Valášková, K.; Král, P. Techno-economic assessment of potato waste management in developing economies. Clean Technol. Environ. Policy 2020, 22, 937–944. [Google Scholar]
  19. Stavkova, J.; Maroušek, J. Novel sorbent shows promising financial results on P recovery from sludge water. Chemosphere 2021, 276, 130097. [Google Scholar] [CrossRef]
  20. Ayub, M.A.; Usman, M.; Faiz, T.; Umair, M.; Rizwan, M.; Ali, S.; Zia ur Rehman, M. Restoration of degraded soil for sustainable agriculture. In Soil Health Restoration and Management; Springer: Berlin/Heidelberg, Germany, 2020; pp. 31–81. [Google Scholar]
  21. Alghamdi, A.G. Biochar as a potential soil additive for improving soil physical properties—A review. Arab. J. Geosci. 2018, 11, 766. [Google Scholar] [CrossRef]
  22. Bashir, S.; Hussain, Q.; Jun, Z.; Qingling, F.; Houben, D.; Hongqing, H. Efficiency of KOH-modified rice straw-derived biochar for reducing cadmium mobility, bioaccessibility and bioavailability risk index in red soil. Pedosphere 2020, 30, 874–882. [Google Scholar] [CrossRef]
  23. Herawati, A.; Syamsiyah, J.; Baldan, S.; Arifin, I. Application of soil amendments as a strategy for water holding capacity in sandy soils. IOP Conf. Ser. Earth Environ. Sci. 2021, 724, 012014. [Google Scholar] [CrossRef]
  24. Pan, S.-Y.; Dong, C.-D.; Su, J.-F.; Wang, P.-Y.; Chen, C.-W.; Chang, J.-S.; Kim, H.; Huang, C.-P.; Hung, C.-M. The role of biochar in regulating the carbon, phosphorus, and nitrogen cycles exemplified by soil systems. Sustainability 2021, 13, 5612. [Google Scholar] [CrossRef]
  25. Zheng, H.; Wang, Z.; Deng, X.; Herbert, S.; Xing, B. Impacts of adding biochar on nitrogen retention and bioavailability in agricultural soil. Geoderma 2013, 206, 32–39. [Google Scholar] [CrossRef]
  26. Xu, N.; Tan, G.; Wang, H.; Gai, X. Effect of biochar additions to soil on nitrogen leaching, microbial biomass and bacterial community structure. Eur. J. Soil Biol. 2016, 74, 1–8. [Google Scholar] [CrossRef]
  27. Li, W.; Xiao, Q.; Hu, C.; Liu, B.; Sun, R. A comparison of the efficiency of different urease inhibitors and their effects on soil prokaryotic community in a short-term incubation experiment. Geoderma 2019, 354, 113877. [Google Scholar] [CrossRef]
  28. Pitts, G.; Allam, A.I.; Hollis, J.P. Beggiatoa: Occurrence in the rice rhizosphere. Science 1972, 178, 990–992. [Google Scholar] [CrossRef]
  29. Jing, Y.; Zhang, Y.; Han, I.; Wang, P.; Mei, Q.; Huang, Y. Effects of different straw biochars on soil organic carbon, nitrogen, available phosphorus, and enzyme activity in paddy soil. Sci. Rep. 2020, 10, 8837. [Google Scholar] [CrossRef]
  30. Tu, C.; Wei, J.; Guan, F.; Liu, Y.; Sun, Y.; Luo, Y. Biochar and bacteria inoculated biochar enhanced Cd and Cu immobilization and enzymatic activity in a polluted soil. Environ. Int. 2020, 137, 105576. [Google Scholar] [CrossRef]
  31. Li, Y.; Zhu, Z.; Wei, X.; Kuzyakov, Y.; Li, B.; Kim, P.J.; Wu, J.; Liu, S.; Ge, T. Sources and intensity of CH4 production in paddy soils depend on iron oxides and microbial biomass. Biol. Fertil. Soils 2022, 58, 181–191. [Google Scholar] [CrossRef]
  32. Luo, D.; Meng, X.; Zheng, N.; Li, Y.; Yao, H.; Chapman, S.J. The anaerobic oxidation of methane in paddy soil by ferric iron and nitrate, and the microbial communities involved. Sci. Total Environ. 2021, 788, 147773. [Google Scholar] [CrossRef]
  33. Conrad, R. Microbial ecology of methanogens and methanotrophs. In Advances in Agronomy; Sparks, D.L., Ed.; Academic Press: Cambridge, MA, USA, 2007; Volume 96, pp. 1–63. [Google Scholar]
  34. Liu, Y.; Luo, H.; Tie, B.; Li, D.; Liu, S.; Lei, M.; Du, H. The long-term effectiveness of ferromanganese biochar in soil Cd stabilization and reduction of Cd bioaccumulation in rice. Biochar 2021, 3, 499–509. [Google Scholar] [CrossRef]
  35. Ciais, P.; Wattenbach, M.; Vuichard, N.; Smith, P.; Piao, S.; Don, A.; Luyssaert, S.; Janssens, I.; Bondeau, A.; Dechow, R. The European carbon balance. Part 2: Croplands. Glob. Chang. Biol. 2010, 16, 1409–1428. [Google Scholar] [CrossRef]
  36. Fan, L.; Dippold, M.A.; Ge, T.; Wu, J.; Thiel, V.; Kuzyakov, Y.; Dorodnikov, M. Anaerobic oxidation of methane in paddy soil: Role of electron acceptors and fertilization in mitigating CH4 fluxes. Soil Biol. Biochem. 2020, 141, 107685. [Google Scholar] [CrossRef]
  37. Hohenberg, P.; Kohn, W. Inhomogeneous electron gas. Phys. Rev. 1964, 136, B864. [Google Scholar] [CrossRef] [Green Version]
  38. Kresse, G.; Furthmüller, J. Efficiency of ab-initio total energy calculations for metals and semiconductors using a plane-wave basis set. Comput. Mater. Sci. 1996, 6, 15–50. [Google Scholar] [CrossRef]
  39. Kresse, G.; Furthmüller, J. Efficient iterative schemes for ab initio total-energy calculations using a plane-wave basis set. Phys. Rev. B 1996, 54, 11169. [Google Scholar] [CrossRef]
  40. Perdew, J.P.; Burke, K.; Ernzerhof, M. Generalized gradient approximation made simple. Phys. Rev. Lett. 1996, 77, 3865–3868. [Google Scholar] [CrossRef] [Green Version]
  41. Zhou, J.; Sun, Q. Magnetism of phthalocyanine-based organometallic single porous sheet. J. Am. Chem. Soc. 2011, 133, 15113–15119. [Google Scholar] [CrossRef]
  42. Momma, K.; Izumi, F. VESTA 3 for three-dimensional visualization of crystal, volumetric and morphology data. J. Appl. Crystallogr. 2011, 44, 1272–1276. [Google Scholar] [CrossRef]
  43. Zhou, W.; Long, W.; Wang, H.; Long, P.; Xu, Y.; Fu, Z. Matter Production Characteristics and Nitrogen Use Efficiency under Different Nitrogen Application Patterns in Chinese Double-Cropping Rice Systems. Agronomy 2022, 12, 1165. [Google Scholar] [CrossRef]
  44. Zou, J.; Huang, Y.; Jiang, J.; Zheng, X.; Sass, R.L. A 3-year field measurement of methane and nitrous oxide emissions from rice paddies in China: Effects of water regime, crop residue, and fertilizer application. Glob. Biogeochem. Cycles 2005, 19. [Google Scholar] [CrossRef]
  45. Yang, X.; Liu, J.; McGrouther, K.; Huang, H.; Lu, K.; Guo, X.; He, L.; Lin, X.; Che, L.; Ye, Z. Effect of biochar on the extractability of heavy metals (Cd, Cu, Pb, and Zn) and enzyme activity in soil. Environ. Sci. Pollut. Res. 2016, 23, 974–984. [Google Scholar] [CrossRef] [PubMed]
  46. Sun, Y.; Sun, G.; Xu, Y.; Wang, L.; Lin, D.; Liang, X.; Shi, X. In situ stabilization remediation of cadmium contaminated soils of wastewater irrigation region using sepiolite. J. Environ. Sci. 2012, 24, 1799–1805. [Google Scholar] [CrossRef]
  47. Walkley, A.; Black, I.A. An examination of the Degtjareff method for determining soil organic matter, and a proposed modification of the chromic acid titration method. Soil Sci. 1934, 37, 29–38. [Google Scholar] [CrossRef]
  48. Li, Y.-M.; Duan, Y.; Wang, G.-L.; Wang, A.-Q.; Shao, G.-Z.; Meng, X.-H.; Hu, H.-Y.; Zhang, D.-M. Straw alters the soil organic carbon composition and microbial community under different tillage practices in a meadow soil in Northeast China. Soil Tillage Res. 2021, 208, 104879. [Google Scholar] [CrossRef]
  49. Zhou, G.; Zhao, S.; Wang, T.; Yang, S.-Z.; Johannessen, B.; Chen, H.; Liu, C.; Ye, Y.; Wu, Y.; Peng, Y. Theoretical calculation guided design of single-atom catalysts toward fast kinetic and long-life Li–S batteries. Nano Lett. 2019, 20, 1252–1261. [Google Scholar] [CrossRef]
  50. Song, B.; Almatrafi, E.; Tan, X.; Luo, S.; Xiong, W.; Zhou, C.; Qin, M.; Liu, Y.; Cheng, M.; Zeng, G. Biochar-based agricultural soil management: An application-dependent strategy for contributing to carbon neutrality. Renew. Sustain. Energy Rev. 2022, 164, 112529. [Google Scholar] [CrossRef]
  51. Zhang, M.; Cheng, G.; Feng, H.; Sun, B.; Zhao, Y.; Chen, H.; Chen, J.; Dyck, M.; Wang, X.; Zhang, J. Effects of straw and biochar amendments on aggregate stability, soil organic carbon, and enzyme activities in the Loess Plateau, China. Environ. Sci. Pollut. Res. 2017, 24, 10108–10120. [Google Scholar] [CrossRef]
  52. Khan, M.N.; Li, D.; Shah, A.; Huang, J.; Zhang, L.; Núñez-Delgado, A.; Han, T.; Du, J.; Ali, S.; Sial, T.A. The impact of pristine and modified rice straw biochar on the emission of greenhouse gases from a red acidic soil. Environ. Res. 2022, 208, 112676. [Google Scholar] [CrossRef]
  53. Han, L.; Sun, K.; Keiluweit, M.; Yang, Y.; Yang, Y.; Jin, J.; Sun, H.; Wu, F.; Xing, B. Mobilization of ferrihydrite-associated organic carbon during Fe reduction: Adsorption versus coprecipitation. Chem. Geol. 2019, 503, 61–68. [Google Scholar] [CrossRef]
  54. Yao, J.; Qin, S.; Liu, T.; Clough, T.J.; Wrage-Mönnig, N.; Luo, J.; Hu, C.; Ge, T.; Zhou, S. Rice root Fe plaque enhances oxidation of microbially available organic carbon via Fe (III) reduction-coupled microbial respiration. Soil Biol. Biochem. 2022, 167, 108568. [Google Scholar] [CrossRef]
  55. Primožič, M.; Podrepšek, G.H.; Pavlovič, I.; Škerget, M.; Knez, Ž.; Leitgeb, M. Enzyme immobilization onto biochar produced by the hydrothermal carbonization of biomass. Acta Chim. Slov. 2019, 66, 732–739. [Google Scholar] [CrossRef] [PubMed]
  56. Ergang, W.; Xing, Y.; Hanbo, C.; Sabry, M.S.; Binoy, S.; Song, X.; Hocheol, S.; Yong, L.; Rinklebe, J.; Deyi, H.; et al. Iron-modified biochar and water management regime-induced changes in plant growth, enzyme activities, and phytoavailability of arsenic, cadmium and lead in a paddy soil. J. Hazard. Mater. 2021, 407, 124344. [Google Scholar] [CrossRef]
  57. Bhattacharyya, P.; Dash, P.K.; Swain, C.K.; Padhy, S.R.; Roy, K.S.; Neogi, S.; Berliner, J.; Adak, T.; Pokhare, S.S.; Baig, M.J.; et al. Mechanism of plant mediated methane emission in tropical lowland rice. Sci. Total Environ. 2019, 651, 84–92. [Google Scholar] [CrossRef]
  58. Bodelier, P.L.E.; Laanbroek, H.J. Nitrogen as a regulatory factor of methane oxidation in soils and sediments. FEMS Microbiol. Ecol. 2004, 47, 265–277. [Google Scholar] [CrossRef]
  59. He, Y.; Yao, Y.; Jia, Z.; Chen, X.; Zhou, L.; Shao, J.; Liu, R.; Zhou, G.; Fu, Y.; Sun, X.; et al. Antagonistic interaction between biochar and nitrogen addition on soil greenhouse gas fluxes: A global synthesis. Glob. Chang. Biol. Bioenergy 2021, 13, 1636–1648. [Google Scholar] [CrossRef]
  60. Lu, Y.; Liu, Q.; Fu, L.; Hu, Y.; Zhong, L.; Zhang, S.; Liu, Q.; Xie, Q. The effect of modified biochar on methane emission and succession of methanogenic archaeal community in paddy soil. Chemosphere 2022, 304, 135288. [Google Scholar] [CrossRef]
  61. Khan, M.N.; Huang, J.; Shah, A.; Li, D.; Daba, N.A.; Han, T.; Du, J.; Qaswar, M.; Anthonio, C.K.; Sial, T.A.; et al. Mitigation of greenhouse gas emissions from a red acidic soil by using magnesium-modified wheat straw biochar. Environ. Res. 2022, 203, 111879. [Google Scholar] [CrossRef]
  62. Gupta, K.; Kumar, R.; Baruah, K.K.; Hazarika, S.; Karmakar, S.; Bordoloi, N. Greenhouse gas emission from rice fields: A review from Indian context. Environ. Sci. Pollut. Res. 2021, 28, 30551–30572. [Google Scholar] [CrossRef]
  63. Liu, Z.; Tang, J.; Ren, X.; Schaeffer, S.M. Effects of phosphorus modified nZVI-biochar composite on emission of greenhouse gases and changes of microbial community in soil. Environ. Pollut. 2021, 274, 116483. [Google Scholar] [CrossRef]
  64. Wu, F.; Jia, Z.; Wang, S.; Chang, S.X.; Startsev, A. Contrasting effects of wheat straw and its biochar on greenhouse gas emissions and enzyme activities in a Chernozemic soil. Biol. Fertil. Soils 2013, 49, 555–565. [Google Scholar] [CrossRef]
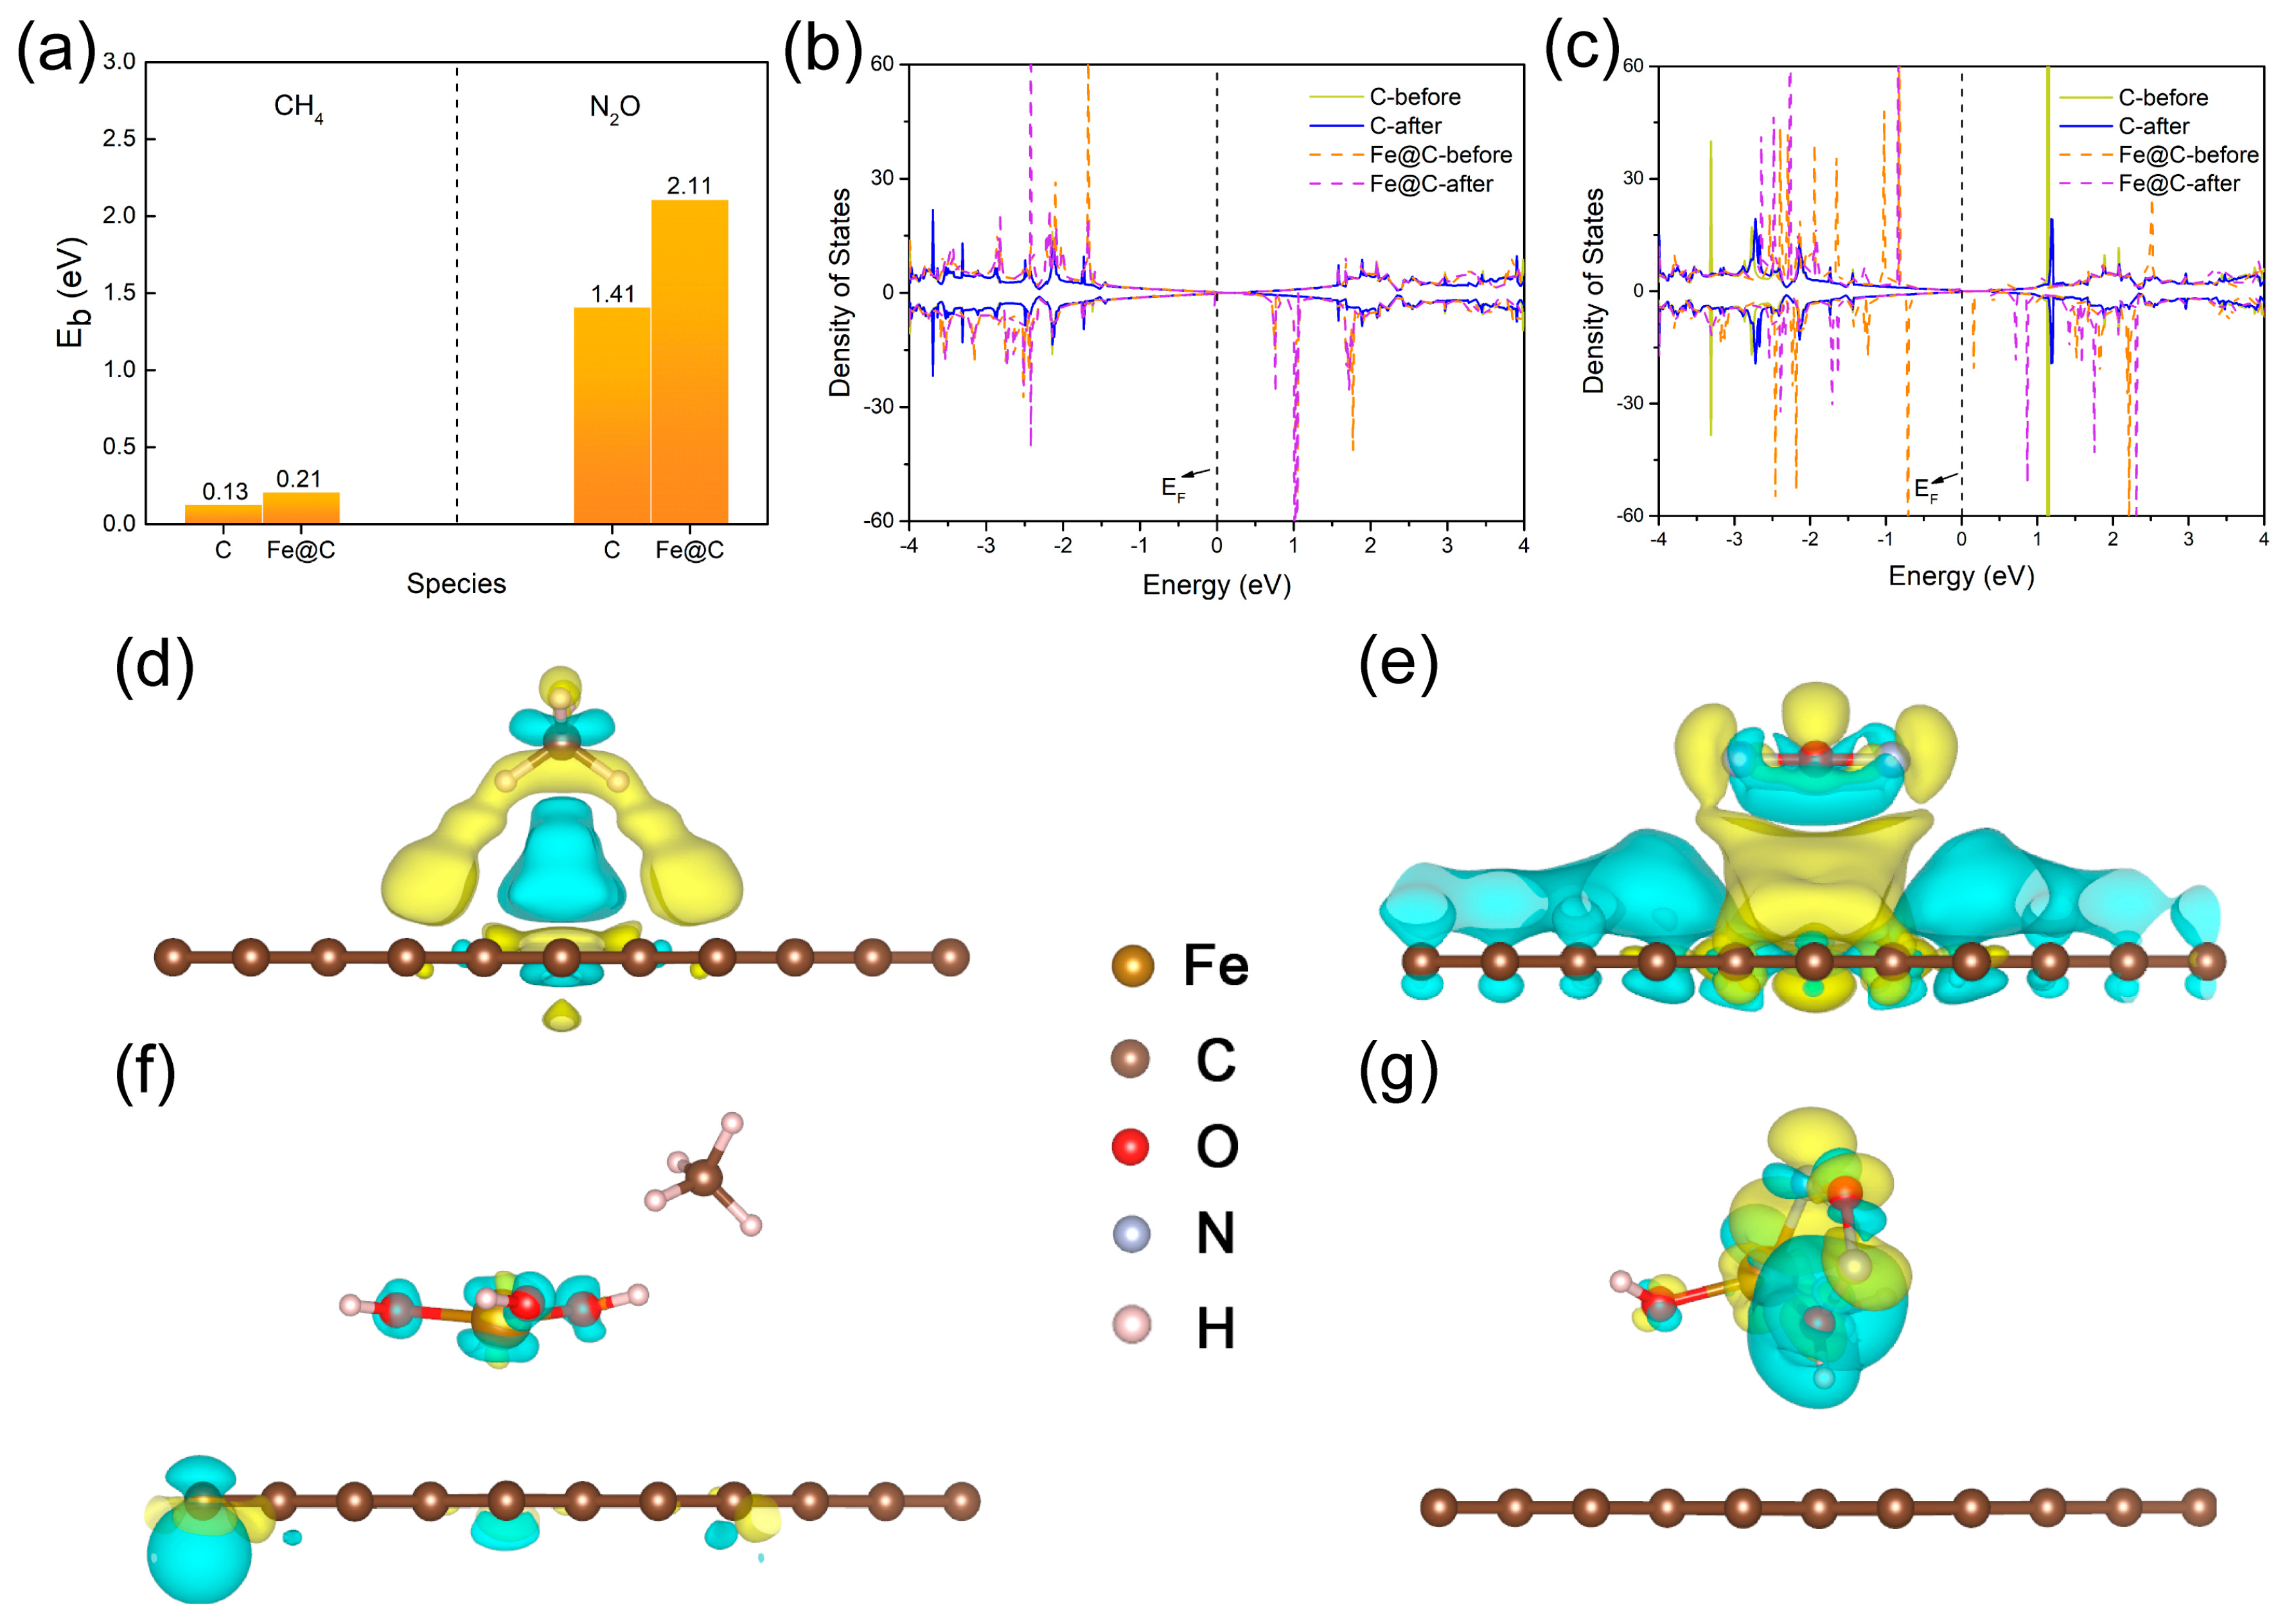
Figure 1. (a) Adsorption energies of CH4 and N2O on different substrates. The density of states of (b) CH4 and (c) N2O adsorbed on different substrates. The charge density difference for CH4−C (d), N2O−C (e), CH4-Fe@C (f), N2O−Fe@C (g). The isosurface is set to 4 × 10⁻⁵ e Å−3 (d,e) and 4 × 10⁻³ e Å−3 (f,g). Note that yellow and red are represented the charge accumulation and depletion.
Agronomy 12 02661 g001
Figure 2. Emission fluxes of CH4 and N2O under different treatments. (a) Trends in CH4 emission fluxes, (b) Trends in N2O emission fluxes, (c) Average CH4 emission flux, (d) Average N2O emission flux. The data are presented as mean (±standard error). Different lowercase letters indicate significant differences between different treatments at p < 0.05.
Agronomy 12 02661 g002
Figure 3. (a) Cumulative CH4 emissions, (b) Cumulative N2O emissions, (c) Global warming potential (GWP) for different treatments, (d) Yield and emission intensity (GHGI) of different treatments. The data are presented as mean (±standard error). Different lowercase letters indicate significant differences between different treatments at p < 0.05.
Agronomy 12 02661 g003
Figure 4. (a) Urease activity of paddy field under different treatments during the whole growth stage (b) Catalase activity of paddy field under different treatments during the whole growth period.The data are presented as mean (±standard error). Different lowercase letters indicate significant differences between different treatments at p < 0.05.
Agronomy 12 02661 g004
Figure 5. (a) Soil total organic carbon (TOC), (b) recalcitrant organic carbon (ROC), (c) labile organic carbon (LOC), (d) carbon pool index (CPI), (e) organic carbon pool labile index (CPLI), (f) carbon pool management index (CPMI) for different treatments. The data are presented as mean (±standard error). Different lowercase letters indicate significant differences between different treatments at p < 0.05.
Agronomy 12 02661 g005
Figure 6. Correlation analysis between different indicators. *, significant at the 0.05 probability level; **, significant at the 0.01 probability level; ***, significant at the 0.001 probability level, according to the LSD test. Different numbers represent correlation coefficients. GWP, global warming potential. GHGI, emission intensity. ROC, soil recalcitrant organic carbon. CPI, soil carbon pool index. CPLI, soil organic carbon pool labile index. CPMI, soil carbon pool management index.
Agronomy 12 02661 g006
Table 1. Chemical Properties of Soil and Biochar.
MaterialTN (g kg−1)TP (g kg−1)TK (g kg−1)AN (mg kg−1)RAP (mg kg−1)RAK (g kg−1)
Soil0.680.746.4577.3015.7713.50
Biochar0.265.7747.20176.00242.0022.00
TN, TP, TK, AN, RAP, and RAK represented total nitrogen, total phosphorus, total potassium, available nitrogen, rapidly available phosphorus, and rapidly available potassium, respectively.
Publisher’s Note: MDPI stays neutral with regard to jurisdictional claims in published maps and institutional affiliations.