Article

Identification of ‘Calanda’-Type Peach Genotypes Tolerant to Monilinia laxa (Aderh. & Ruhland) Honey

by
Joaquín Montenegro
1,†,
Vitus Ikechukwu Obi
1,†,
Juan Jose Barriuso
2 and
Yolanda Gogorcena
1,*
1
Estación Experimental de Aula Dei-CSIC, Avda. de Montañana 1005, 50059 Zaragoza, Spain
2
Facultad de Veterinaria, Universidad de Zaragoza, C/Miguel Servet 177, 50013 Zaragoza, Spain
*
Author to whom correspondence should be addressed.
These authors contributed equally to this work.
Agronomy 2022, 12(11), 2662; https://doi.org/10.3390/agronomy12112662
Submission received: 7 October 2022 / Revised: 21 October 2022 / Accepted: 25 October 2022 / Published: 27 October 2022
(This article belongs to the Special Issue Monilinia on Stone Fruit Species)

Abstract

:
One of the diseases that has the greatest negative effect on peach production is brown rot, produced by the fungus, Monilinia spp. The way to diminish this disease is the selection of genotypes with a high tolerance to Monilinia spp. while maintaining fruit quality. In this study, the tolerance to Monilinia laxa and agronomic and biochemical characteristics of forty-two hybrids derived from the ‘Andross’ × ‘Calante’ cross were studied under controlled conditions during two consecutive years, and compared with their parents. The assessment of tolerance to brown rot was estimated on inoculated fruit with M. laxa, recording the incidence of brown rot and colonization, lesion diameter and extent of colonization, to establish the severity of incidence and colonization. At harvest, physicochemical traits and antioxidant compounds (vitamin C, total phenolics, flavonoids and relative antioxidant capacity) were determined. We have found inverse relationships between fruit firmness, pH, titratable acidity and antioxidant contents with the disease symptoms in fruit. Our results confirm that the accumulation of antioxidants tends to reduce the lesion and colonization in inoculated fruit. Principal component analysis allowed the selection of two genotypes, AC-24 and AC-93, of ‘Calanda’-type peaches with a known standard quality, high antioxidant content and minimal susceptibility to brown rot.

1. Introduction

Peaches and nectarines are two of the most important fruit crops in the world with a global production of more than 24 million tonnes in 2020. The world production of this crop is concentrated in China, with a total production of 15 million tonnes, followed by the Mediterranean countries: Spain, Italy, Turkey and Greece [1]. Spain is the second peach producing country worldwide, with a production of 1,306,020 tonnes in 2020 [1]. Within the European Union, peach production is concentrated in the countries of its Mediterranean basin because the risk of damage to production due to frost being much lower than in the countries of northern Europe [2].
Brown rot is one of the most important fungal diseases in peaches that causes major production and economic losses in this crop. It has been reported that under favorable conditions it is responsible for up to 80% of the yield loss [3,4]. This disease is caused by three main species, Monilinia spp.; M. laxa (Aderhold & Ruhland) Honey, M. fructicola (G Winter) Honey, and M. fructigena (Aderhold & Ruhland) Honey [4,5,6]. According to Obi and references therein [4], until 2006 in Spain, M. laxa and M. fructigena were the two major brown rot fungal species on peaches. Subsequently, M. fructicola was discovered in orchards in the Ebro valley, Lérida, Spain [6], and spread all over Spain, displacing the native species, M. laxa [7]. Currently, in Spain, both species coexist in the orchards [5,8]. While M. fructicola and M. laxa can infect both healthy and wounded fruit, M. fructigena can infect only wounded fruit [5]. In the case of M. fructicola it has a higher incidence on healthy fruit, while M. laxa grows equally on both blossom and wounded and healthy fruit [9,10], which make this species important for ongoing and further studies.
Due to the enormous economic losses that this disease entails, it is of great importance to study the different ways of preventing or curing it. For the control of brown rot caused by Monilinia species, post-harvest treatments are of little use and the risks of effects of Monilinia spp on peaches in post-harvest is really low compared to that in the field [11]. Currently, preventive treatments used for the control of brown rot in pre-harvest are the use of synthetic pesticides, such as benzimidazoles, dicarboximides, demethylation, boscalid, cyprodinil, fluioxonil, fluopyram, pyraclostrobine, tebuconazole, etc. [12,13], that allow for higher yield and higher quality of peaches [5,14]. However, this trend is decreasing, whereas the need to find sustainable alternatives is increasing due to the resistance of certain strains of Monilinia spp. to these authorized pesticides, the enormous pressure from consumers to eat pesticide-free food, and environmental protection [15,16,17]. One of the ecological and competitive alternatives may be the use of biopreservatives in peaches. Recently, the effect of Bacillus amyloliquefaciens CPA-8 (CPA-8) or Penicillium frequentans 909 (Pf909) as biopreservative agents with a heating treatment against Monilinia spp. on peaches, nectarines and cherries has been evaluated in field assays [18].
Another accepted and sustainable alternative is the selection of peach cultivars with high resistance to brown rot [4,19]. This traditional breeding approach will allow obtain pesticide-free peaches with high fruit quality and with less probability to be damaged by Monilinia spp., which will also increase economic benefits [20]. Peach breeding programs try to identify and select the genotypes more tolerant to Monilinia spp. by screening individuals of a germplasm [21,22]. These programs may be supported by mathematical methods, which allow for the integration of several objectives such as the selection of peaches with high nutritional quality and those that are tolerant to Monilinia spp. [23].
Studying the injury parameters of the fruit allowed for the identification and selection of varieties with greater resistance to this disease [4,24,25], while the study of the physicochemical parameters allowed the identification of which are the bioactive compounds involved in the defense mechanism against Monilinia spp. In our laboratory, an in vivo method was developed and optimized to assess susceptibility levels in peach fruit of an isolated strain of M. laxa. (Aderhold & Ruhland) Honey [26]. Besides, it has been described that bioactive compounds such as polyphenols [22,27,28,29] or vitamin C have been shown to have a preventive effect against Monilinia spp. [30]. However, until now only a few peach cultivars tolerant to Monilinia spp. have been reported [22,24,26,29,30,31,32], probably because few regions of the peach peel and flesh genome have been detected to be associated with the response against M. laxa infection and colonization [33]. Peach breeders try to find sources of resistance in the peach background [22,31,34].
It is well known that the Bolinha peach variety, from Brazilian origin, presents a good resistance mechanism with less susceptibility to brown rot than other varieties [35]. It has been observed that the resistance to disease of ‘Bolinha’ [22,33] and other resistant sources [36,37] is transmitted to their descendants. Following this approach, in our laboratory, we have selected peach genotypes from a population derived from the cross of two commercial varieties, ‘Babygold 9′ × ‘Crown Princess’, based on their tolerance to M. laxa and their quality. Interestingly, there was a direct correlation between the amount of antioxidants such as anthocyanins and tolerance to M. laxa [29]. The present study has been carried out with forty-two hybrids derived from the ‘Andross’ × ‘Calante’ cross with differences in Monilinia laxa tolerance. The parents, as well as their descendants, produce clingstone non-melting flesh peaches. ‘Andross’ is a peach variety of American origin with a high sugar content and a medium harvest date, while ‘Calante’ is an appreciate peach variety derived from an Aragonese population ‘Amarillo Tardío’ [38]. This variety of peach is late ripening and is covered by the Protected Designation of Origin “Melocotón de Calanda” [39]. The progeny was also evaluated for agronomic and physicochemical properties (harvest date, fruit weight, fruit firmness, soluble solids content, pH, titratable acidity and ripening index), antioxidant compound contents (vitamin C, total phenolics, flavonoids and relative antioxidant capacity in flesh and peel), and disease infection. The main objective of this study was to select superior genotypes of ‘Calanda’-type peaches with the highest agronomical and biochemical fruit properties and tolerance to M. laxa and to establish a better antioxidant fruit composition for the tolerance to the disease.

2. Materials and Methods

2.1. Plant Materials

This study was carried out at the Aula Dei Experimental Station (CSIC) during two growing seasons (2014–2015) in a peach population established in 2002. A progeny of 104 hybrids obtained from the controlled biparental cross between two commercial peach varieties (Prunus persica (L.) Batsch): ‘Andross’ (female parent) and ‘Calante’ (male parent) (A × C) were evaluated during 3–4 years (2009–2013) for agronomical (yield and harvest date) and physicochemical basic traits (fruit weight, fruit firmness, soluble solids content, pH, titratable acidity and ripening index), antioxidant compounds (vitamin C, total phenolics, flavonoids and relative antioxidant capacity), and sugar contents. In 2014, a selection of forty-two genotypes with good performance and high fruit quality was evaluated for the tolerance to M. laxa and physicochemical properties. In 2015, a selection of eight individuals that presented lesion severity (LS) of lower than 40 mm were evaluated for a second season (Table S1). For the evaluation, the fruits were harvested at commercial maturity, considering the criteria of peel coloration, size, fruit form (suture and shoulder development), fruit firmness (softness of petiole zone), and ease of detachment from the tree [40]. All individuals were evaluated for tolerance to M. laxa, as well as for their agronomical, physicochemical basic traits and biochemical composition.

2.2. Preparation of Spores and Evaluation of Tolerance to Brown Rot

The procedure adopted was as described by Obi et al., in 2020 [26]. The original inoculum (isolate number: CPML02) provided by the plant pathology unit of IRTA, Lérida was used for the production of spores. Peach fruits were disinfected for four minutes by immersion in a solution of 1.6% ethyl alcohol, 1.6% sodium hypochlorite (commercial) and 0.005% of polysorbate (Tween 80) in distilled water. Peach fruits were inoculated with a small portion of the colony margin (3 mm) of PDA culture of M. laxa grown for six days. The inoculated fruits were stored in boxes and covered with a layer of sterilized transparent cellophane with both extremes sealed with adhesive tape. Samples were incubated for 4–6 days at 23 °C, with 40–60% relative humidity (RH) and a 12 h photoperiod. Finally, the spores were isolated and the concentration was adjusted using the hemocytometer cell-counting chamber (Neubauer) on a light microscope [26].
Before inoculation, fruits were disinfected as described above, rinsed in distilled water, and later dried at room temperature for twenty minutes. The evaluation for tolerance to M. laxa was carried out by inoculating twenty fruits per genotype, without artificial injury, on the equatorial position with 25 µL of 2.5 × 10³ spores mL−1 concentration. Five fruits were used as mock and were inoculated with distilled water as a control of infections. The fruits were placed in boxes with cardboard cells and incubated for 5 days in disinfected chambers at 23 °C with 50–60% humidity (Climatronic 2132-model growth incubator, Germany). The pathogenic activity was performed according to [26]. Brown rot incidence (BRI) was expressed as the percentage of infected fruits over the total inoculated fruits and colonization was expressed as the percentage of fruits with part colonization over the number of total inoculated fruits. Lesion Diameter (LD = diameter of the lesioned fraction) and Colonization Extent (CExt = diameter of the mycelium growth) were measured across the perpendicular section using a digital Vernier calliper (Digimatic Mitutoyo, Alico Industrial Equipment, Tamil-Nadu India). Lesion Severity (LS = (%BRI × LD)/100) and Colonization Severity (CS = (%C × CExt)/100) were calculated as reported previously [24].

2.3. Determination of the Physicochemical Fruit Quality Traits

Fruit weight (grams) was calculated from the total of 35 peach fruit samples harvested per genotype. The fruit firmness (FF) and soluble solids content (SSC) were assayed in 5–20 fruits according to [29] at harvest, and after storage in fruits inoculated or not to know the effect of incubation and inoculation. At harvest, firmness was measured in 10 fruits randomly selected from the total 35 harvested. Each fruit was cut off a section of fruit at 1 mm size and using a penetrometer fitted with an 8 mm diameter probe (Effegi-FT-327, Milan Italy) on opposite sides of the equator of each fruit. The results were expressed in Newtons (N). For the soluble solids content (SSC), pH and titratable acidity (TA), the same 10 fruits were peeled, cut and blended to get a peach juice. SSC was measured in a temperature-compensated refractometer (ATC-1, Atago; Tokyo, Japan) and expressed as (Brix). For pH and TA determination, 5 g of peach juice was diluted with 45 mL distilled water, and then initial pH and acidity were measured using an automatic pH analyzer (862 Compact Titrosampler, Metrohm; Herisau, Switzerland). The results were expressed as grams of malic acid per 100 g of fresh weight (FW). After five days of storage, fruit firmness and SSC were evaluated in those 5 fruits used as mock and in those 20 fruits inoculated with M. laxa.

2.4. Determination of Antioxidant Compounds

The extraction of the antioxidant compounds was carried out according to [29] with small modifications. Fruits were washed with deionized water, peeled and cut into very small pieces. Approximately, 5 g of flesh (2014 and 2015) and 3 g of peel (2015) were frozen in liquid nitrogen and stored at −20 °C until analysis. Three replicates for each determination were stored. For vitamin C determination, five milliliters of 5% HPO3 was added to the fruit samples before storage. For ascorbate (AsA) extraction, five milliliters of 5% HPO3 was added to the frozen fruit samples. For the extraction of total phenolics, flavonoids, and relative antioxidant capacity (RAC), a mixture of ten milliliters of HCl 0.5 N in methanol at 80% (v/v) was added to the samples. For the extraction of sugars, ten milliliters of miliQ water was added [41]. The samples were thawed at 4 °C on ice and homogenized using a Polytron blender (T25D UltraTurrax, IKA Works, Inc.; Wilmington, NC, USA) and centrifuged at 4 °C and 30,000 g for 20 or 40 min for the flesh and peel tissues, respectively. The volumes of extracts were measured in 15 mL Falcon tubes and kept at 4 °C until their determination.
All the antioxidant compounds were determined with the molecular absorption spectroscopy UV-Vis of the plate spectrophotometer (Biochrom Asys UVM340, Microplate Reader, Cambridge UK), with an optimized methodology for colorimetric reaction in 96-well plates, including three technical repetitions for all the determinations [41].
The AsA content was determined based on the oxidation–reduction reactions [42]; Fe(III) is reduced to Fe(II) in contact with L-Ascorbic acid and the formation of the Fe(II)-2,2′-bipyridyl complex. Fifty microliters of flesh or peel extracts was sequentially mixed in a microplate with fifty microliters of 44% (v/v) H3PO4, fifty microliters of 3.2% 2,2′-bipyridyl and fifty microliters of 1.2% FeCl3. Samples were measured at 525 nm absorbance after 90 min of incubation at 37 °C in darkness. Quantifications were calculated by the interpolation in ascorbic acid (AsA) standard curve of 8 points (0–150 mg/L) freshly prepared in parallel with the same reagents added to the samples. The results were expressed in milligrams of ascorbic acid per 100 g of fresh weight (mg AsA/100 g FW).
Total phenolics content was performed based on the Folin-Ciocalteau method [43]. Fifty μL of 12% Na2CO3 and a hundred μL of Folin-Ciocalteau reagent 0.2 N were mixed with fifty μL of flesh or peel extracts in a microplate. Samples were subsequently measured at 765 nm absorbance after 60 min of incubation at room temperature in darkness. Quantification was realized with a gallic acid standard curve of 8 points (0–50 mg/L) freshly prepared in parallel with the same reagents added to the samples. The result was expressed as mg gallic acid equivalent (GAE) per 100 g of fresh weight (mg GAE/100 g FW).
Flavonoids content was measured based on the method in [44]. A total of 50 μL of 1.5% NaNO2 was sequentially mixed with 50 μL of 3% AlCl3, 50 μL of 8% sodium hydroxide (NaOH) and 50 μL of flesh or peel extracts in a microplate. Finally, the samples were measured at 510 nm absorbance. Quantification was realized with a catechin standard curve of 8 points (0–140 mg/L) freshly prepared in parallel with the same reagents added to the samples. The results were expressed as milligrams of catechin equivalent per 100 g of fresh weight (mg CE/100 g FW).
The relative antioxidant capacity (RAC) was determined based on the reduction of 2,2-Diphenyl-1-picrylhydrazyl (DPPH) radicals as described [45]. The reaction start mixing 30 µL of diluted flesh or peel extracts ( (in HCl 0.5 N in MeOH 80%) with DPPH (in MeOH 80%) to a final concentration of 0.007%. The absorbance was measured at 535 nm absorbance after 30 min of incubation at room temperature and darkness. The quantification was realized based on the antioxidant Trolox content (C14H18O4), and the results expressed as milligrams of Trolox equivalents (TE) per 100 g of fresh weight (mg TE/100 g FW).

2.5. Statistical Analysis

The statistical analysis of data was carried out with the SPSS 26.0 software (SPSS Inc.; Chicago, IL, USA) program. The mean, maximum and minimum values and standard errors were calculated for each parameter and year of evaluation. To avoid biased analysis, the mean comparison was carried out independently with the eight genotypes evaluated for both years of analysis. The eight genotypes were analyzed with a linear model one-way ANOVA to compare genotypes, and a two-way ANOVA with year and genotype as the main factors. The differences were considered significant at p ≤ 0.05 and means were separated with the Duncan test. Normality for each parameter was checked with the Kolmogorov–Smirnov test (p ≥ 0.05) and transformed when necessary before the analysis. The linear relationship between parameters was realized with the Pearson correlation coefficient using the mean of the two years of study (2014–2015) where applicable. Finally, in 2014, a principal component analysis (PCA) of all variables was carried out in order to select the most tolerant genotypes to Monilinia infection from the forty-two evaluated genotypes. A second PCA was carried out with the eight selected genotypes evaluated during 2014 and 2015 to identify the genotypes with greater resistance to brown rot infection and with higher nutritional quality.

3. Results

The tolerance or susceptibility of genotypes derived from the cross between ‘Andross’ and ‘Calante’ was studied during two consecutive years, 2014 and 2015. In 2014, the tolerance of the 42 genotypes was evaluated and later, based on the severity of the lesion (LS), eight genotypes were selected with LS lower than 40 mm (Table S1). In 2015, we validated the tolerance to M. laxa and evaluated the nutritional compositions of the eight selected genotypes.
The parameters recorded in the two years of study were harvest date (HD), basic physicochemical quality fruit traits (fruit weight, fruit firmness, soluble solids content, pH, titratable acidity and ripening index) and disease parameters (% brown rot incidence, lesion diameter, lesion severity, % colonization, colonization extent and colonization severity). In addition to these parameters, contents of vitamin C, total phenolics, flavonoids and RAC were also measured in the flesh in 2014 and 2015 and in the peel in 2015.

3.1. Physicochemical Basic Fruit Traits on the Population and Effect of Storage and Inoculation

Minimum, maximum and mean ± standard error of the harvest date and the physicochemical basic fruit traits evaluated in 2014 and 2015 in all hybrids derived from the ‘Andross’ × ‘Calante’ cross are shown in Table 1. Mean values (2014–2015) in the A × C progeny were in between of those found in the parents, ‘Andross’ and ‘Calante’, both evaluated at the same seasons.
The physicochemical basic fruit traits of the eight selected genotypes evaluated in both seasons are shown in Table 2 and Table S2. Genotypes AC-35 and AC-82 were harvested earlier in comparison with the other genotypes. At harvest, the mean fruit weight ranged from 204.27 g (AC-104) to 251.52 g (AC-34). Considering data of both years, the genotype with the lowest fruit firmness at harvest was AC-82, but this was not significantly different from others (AC-34, AC-35 and AC-104), while genotype AC-11 had the highest fruit firmness. In general, the same differences among genotypes in FF were found at harvest and after storage. The ANOVA showed differences in SSC only after storage in fruit whether inoculated or not. Regarding fruit weight, SSC, pH, TA or RI measured at harvest, no significant differences were found among the eight genotypes.
In order to know if there was any interactive effect between storage and inoculation affecting fruit integrity, we have evaluated and compared fruit firmness and soluble solids contents at harvest and after storage and inoculation. Tables S3 and S4 show the mean FF and SSC values of all fruits determined at harvest or after storage in non-inoculated or inoculated fruits of the genotypes studied. In general, both traits were higher at harvest with a progressive decrease after incubation and with inoculation. Considering the forty-two genotypes studied in 2014 and the eight genotypes evaluated in 2015 (Table S3), fruit firmness and SSC were significantly higher at harvest than after 5 days of storage. In the same vein, the FF and SSC of incubated peaches were significantly higher than those inoculated with M. laxa.
Considering the eight genotypes studied during two seasons (Table S4), the fruit firmness and SSC at harvest were also significantly higher than that of incubated fruits. However, it seems that FF was not affected after inoculation with M. laxa, while SSC content was lower in inoculated fruits considering all the genotypes.

3.2. Evaluation of Tolerance/Susceptibility to M. laxa in the Years 2014–2015

Disease parameters measured after inoculation with M. laxa, including the minimum, maximum and mean value ± SE, of all genotypes and the parents for 2014 and 2015 are presented in Table 3 and Table S5. Except for %BRI and %C, the mean values of the disease parameters (LD, LS, CEx and CS) of the progeny were higher in 2014 than in 2015. All the parameters, except for %C, were higher in the progeny than in ‘Andross’ but were quite similar to those found in ‘Calante’. ‘Andross’ resulted in being less susceptible to Monilinia laxa than ‘Calante’ and all the individuals evaluated in the progeny.
The ANOVA of the disease parameters evaluated after inoculation with M. laxa during the two years on the selected eight genotypes is presented in Table 4. Overall, except for CExt, all the parameters (%BRI, LD, LS; %C and CS) were significantly lower in 2014 than in 2015, making the year of analysis an important factor to consider in the assessment of the tolerance/susceptibility to M. laxa. Genotypes were significantly different for LS, CExt and CS traits and the genotype, as a factor, was in interaction with the year of study. In 2014, the selected genotypes showed LS values below 40 mm (Table S1), whereas in 2015, only AC-24, AC-82 and AC-104 maintained LS values below 40 mm. Genotypes that showed tolerance in 2014 did not in 2015. Considering both years of study, five genotypes (AC-24, AC-35, AC-82, AC-93 and AC-104) maintained less than 40 mm lesion diameters (LS < 40 mm). Concerning colonization severity, CS, AC-24, AC-82 and AC-104 showed the lowest values during both seasons. In both years, AC-24 showed lower CS values than the rest of the genotypes. AC-11 had the highest LS (43.31 mm), CExt (45.85 mm) and CS (38.03 mm) values, being the most susceptible to Monilinia laxa infection. Based on disease parameters, AC-24 can be considered the genotype more tolerant to Monilinia laxa.

3.3. Biochemical Composition in Flesh

The antioxidant compound contents in the flesh of the forty-two genotypes studied in 2014 and the eight selected genotypes in 2015 are shown in Table 5 and Table S6. Contents of vitamin C, total phenolics, flavonoids and relative antioxidant capacity (RAC) evaluated in the progeny and the parents are shown in Table 5. In the progeny, vitamin C, total phenolics and flavonoids contents in flesh were higher in 2014 than in 2015, while the RAC was the opposite. Contents of all antioxidants in the progeny, in any of the studied year, were lower than those found in both parents, although contents of vitamin C were quite similar to ‘Calante’. ‘Andross’ was rich in vitamin C, while ‘Calante’ was superior in contents of total phenolics, flavonoids and relative antioxidant capacity.
Two-way ANOVA of vitamin C, total phenolics, flavonoids and relative antioxidant capacity (RAC) of flesh fruit contents in the eight selected genotypes evaluated during 2014 and 2015 are shown in Table 6. Significant differences were found in antioxidant contents in the flesh in the eight selected genotypes. It is important to note the great influence of year and genotype factors on the antioxidant compounds. All the contents in the flesh were higher in 2014 compared to those in 2015, except for RAC. Considering both years of the study, genotypes AC-35, AC-61 and AC-93 had the highest antioxidant contents and RAC in flesh tissue, while AC-104 had the lowest antioxidant values.
To test if peel composition may influence tolerance or susceptibility to M. laxa, we have measured antioxidant contents in the flesh and peel tissues in 2015. The contents of vitamin C, total phenolics, flavonoids and RAC determined in both tissues are shown in Table S7. Values for these parameters were significantly higher in the peel than in flesh. Genotype AC-11 had the highest values in peel for total phenolics content (73.15 mg GAE/100 g FW), flavonoids (83.42 mg CE/100 g FW) and RAC (200.51 mg TE/100 g FW), while AC-104 had the lowest values for total phenolics content (39.25 mg GAE/100 g FW) and RAC (135.23 mg TE/100 g FW). Interestingly, the total phenolic contents of AC-35 in the flesh was higher than in the flesh and peel of other genotypes.

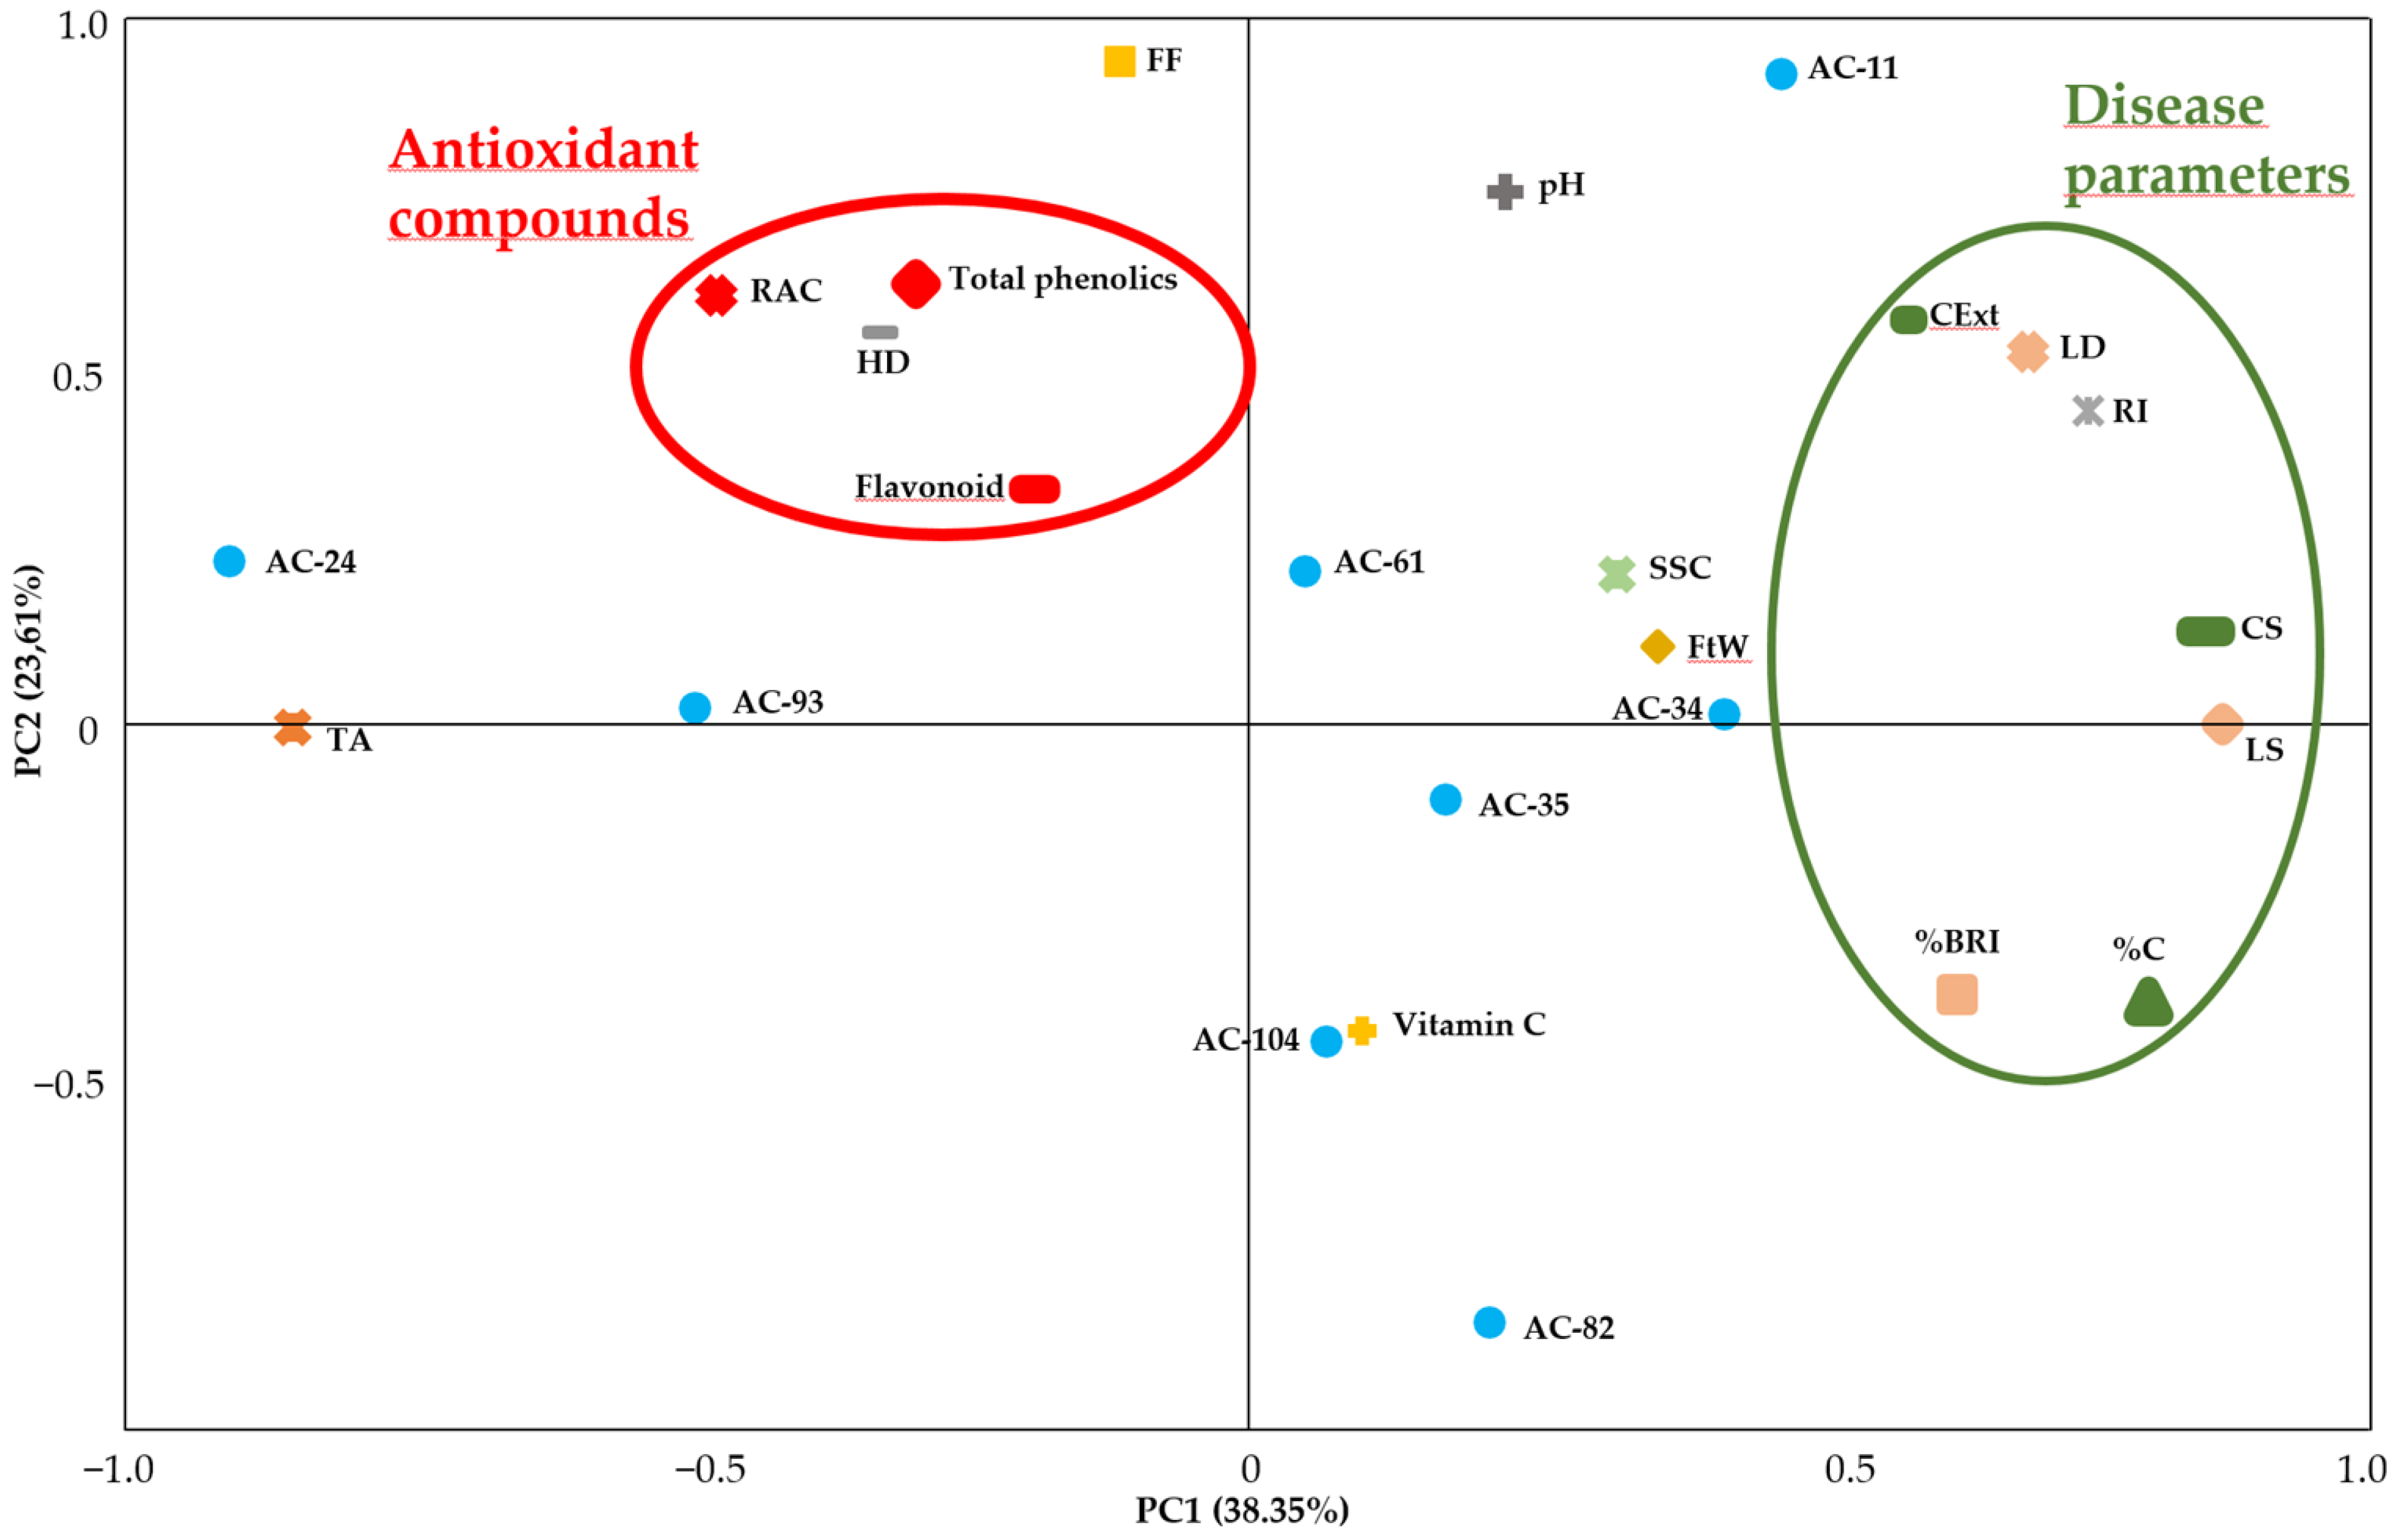
3.4. Selection of Genotypes with Better Quality Characteristics and Higher Tolerance to M. laxa

A principal component analysis (PCA) was carried out to interpret the results obtained after the evaluation of the progeny in 2014. The variables included were the agronomical and physicochemical traits, antioxidant contents and disease parameters recorded in 2014.
Figure 1 shows a model that fits four components explaining 81.78% of the total variance, where PC1 explains mostly disease parameters, 37.79% of the total variance, and PC2 explains physicochemical traits and antioxidant contents, 18.42% of the total variance. Some physicochemical traits and the antioxidant parameters are plotted in the opposite side to the disease parameters. According to this distribution, we were able to select the genotypes with the highest antioxidant contents and agronomic quality that behaved more resistant to M. laxa. Eight genotypes (AC-11, AC-24, AC-34, AC-35, AC-61, AC-82, AC-93 and AC-104) were selected that adjusted the selection criteria; they had high levels of agronomical and physicochemical traits, high antioxidant contents and had higher M. laxa tolerance compared to the other genotypes. Based on the agronomical and fruit quality traits, these genotypes were plotted in the negative quadrants of PC1 and PC2, except the genotype AC-93. All were re-examined for their agronomical performance quality, antioxidant content and tolerance to M. laxa in 2015.
The PCA with the selected genotypes and the disease parameters, antioxidant content and physicochemical traits studied in 2014 and 2015 is represented in Figure 2. This PCA shows a model that fits four components explaining 94.76% of the total variance, where PC1 explains 38.35% of the total variance, mainly fruit weight (FtW), acidity and disease parameters, and PC2 explains 23.61% of the total variance, mainly firmness and antioxidant content. As was the case in 2014, physicochemical traits (fruit firmness, titratable acidity), total phenolics and flavonoids contents and relative antioxidant capacity (RAC) are projected in opposition to the disease parameters. Thus, genotypes with higher antioxidant content, fruit firmness and acidity may have a higher tolerance to M. laxa. The eight genotypes were distributed throughout PC1 according to their tolerance to M. laxa. Of all genotypes studied in both seasons, genotypes AC-24 and AC-93 have the highest antioxidant contents (except for vitamin C), acidity and fruit firmness and thus a higher tolerance to M. laxa.

4. Discussion

The present study is of great interest for the selection of clingstone non-melting peach cultivars of the ‘Calanda’ type with tolerance to M. laxa infection. The average harvest date in the studied ‘Andross’ × ‘Calante’ population (248 Julian days, 5 September) was considered to be late harvested progeny (> 15 August). Harvest date in this progeny is an intermediate of the parents, as ‘Andross’ has a medium average of 211 Julian days and ‘Calante’ has a later date of 279 Julian days [30]. In non-melting ‘Calanda’-type peach breeding programs, it is of great interest to reduce the harvesting date, but maintaining the qualities and Aragonese Protected Designation of Origin requirements [46].
Furthermore, it is important to control any interactive effect between storage and inoculation affecting fruit integrity that later could interfere with the interpretation of the results. In this study, we have evaluated and compared fruit firmness and soluble solids content at harvest and after storage in fruits inoculated or not (Tables S3 and S4) to control if storage conditions modify these fruit physicochemical properties. Results showed that FF and SSC values were significantly lower in fruits after five days of storage. Decreasing fruit firmness and SSC has been described in postharvest conditions in nectarines [47] and peaches [48,49] and it can be due to the production of ethylene. However, our previous study reported the opposite [29]; we found in this population that FF was higher after storage. It is possible that the differences could be due to the genetic background of the studied populations or due to other reasons often related to harvest operations, including weather conditions, which could explain the difference.
To assess the damage of M. laxa on peaches, the disease parameters analyzed were the percentage of brown rot incidence (%BRI), Lesion Diameter (LD), Lesion Severity (LS), the Percentage of Colonization (%C), the Extent of Colonization (CExt) and Colonization Severity (CS). Here, we have found that the symptoms of the disease in all genotypes were lower in 2014 than in 2015, with the exception of the colonization extent. Differences between years have been reported in another study carried out in other peach progenies evaluated in similar orchard conditions [29]. We believe that the disparity in the symptoms between the studied years can be attributed to the biochemical peach composition, since the inoculation of M. laxa was ex situ on disinfected fruit and under temperature- and humidity-controlled conditions [26]. A plausible reason for observing more susceptibility in 2015 may be due to an unusually rainy spring in the year of study, as illustrated in Figure S1. We cannot rule out that external climatic conditions such as temperature, rainfall and relative humidity may influence fruit properties, and even provoke structural changes in the peel or cuticular chemical composition at earlier fruit maturity stages [50,51]. It was reported that any crack in the peel favors the incidence of Monilinia spp. in the fruit [50,51]. Additionally, as reviewed in Mustafa [52], certain cultural practices may promote spore germination within the cracks of ripe fruits. Although the fruits were inoculated with the same amount of M. laxa, we do not know if this disparity found between years may be due to levels of cuticle fracturing or breakage, as described in other studies carried out on stone fruit [50,53]. In this sense, in the future, further attention should be paid to studies emphasizing relevant structural physicochemical changes in the cuticula as a natural barrier involved in the tolerance–susceptibility mechanism.
In peach breeding programs dealing with fungal tolerance, it is very important to know the correlation between the disease parameters and the physicochemical fruit traits. In this work, we have studied the relationship between the agronomical and physicochemical traits of all the studied F1 progeny derived from two commercial peach varieties, ‘Andross’ and ‘Calante’, and their tolerance or susceptibility to M. laxa. As expected, we found a positive and significant correlation between all disease parameters, as was reported previously [26,29,30] (Table S8). A high correlation was obtained between %BRI and disease severity parameters (LS and CS, r = 0.758, r = 0.703, p ≤ 0.01, respectively). This means that the incidence of M. laxa in the population determines disease severity. The correlation between LD and CExt parameters (r = 0.691, p ≤ 0.01) was very informative, because these two parameters determine the tolerance or susceptibility of a genotype from a pathological point of view [54,55] as reported in other studies in peaches and nectarines [29,56]. However, none of the above-mentioned studies established the correlation between %C and severity (LS and CS, r = 0.811, r = 0.885, p ≤ 0.01, respectively), which indicates that the higher the percentage of M. laxa colonization the higher disease severity in the progeny.
All agronomic and physicochemical parameters evaluated in the eight genotypes (AC-11, AC-24, AC-34, AC-35, AC-61, AC-82, AC-93 and AC-104) were lower in 2014 than in 2015, with the exception of RAC. Different pre-harvest environmental conditions such as temperature, rainfall, as discussed above (Figure S1), and solar radiation can influence peach quality [57]. The physicochemical traits and antioxidant contents were slightly higher than those reported within the same population, but evaluated in a previous study [58]. The more probable reason behind this was that the genotypes were evaluated 3–5 years after planting (2005–2007) and that the methodology used in this study is much more accurate now, as discussed by Saidani and coworkers [41]. Contents reported here were also slightly higher than those published in other studies carried out on other peach progenies grown under the same environmental conditions [29,59]. This may not only be due to the different genetic background of the peach progenies, but also to climatic factors within the years of study, to crop management or simply to the age of the trees [60].
As expected, negative correlations between pH and TA (r = −0.717, p ≤ 0.01) and TA vs. ripening index, RI, (r = −0.879, p ≤ 0.01) have been reported in other peach studies [29,56,59]. In the A × C population, total phenolics were strongly positively correlated with flavonoids contents and RAC in flesh tissue (r = 0.892, r = 0.479, p ≤ 0.01, respectively). These correlations have been discussed as described in other studies carried out with peaches and nectarines [41,58]. However, the correlations obtained in the flesh of this population between vitamin C content and total phenolics and flavonoids contents (r = 0.370, r = 0.454, p ≤ 0.01, respectively) were not obtained in the aforementioned study. Consistent with previous studies [29,41], the antioxidant contents (vitamin C, total phenolics and flavonoids) were significantly higher in the peel than in the flesh. Antioxidant contents in the peel, especially flavonoids and total phenolics, were lower than those reported in our previous study in other populations evaluated in 2013 and 2015 [29], as is the case with the study conducted with the progenitors [41]. According to Saidani et al. [41] and Obi et al. [30], the most abundant phenolic compounds in the parentals ‘Andross’ and ‘Calante’, both in the flesh and in the peel, are hydroxycinnamic acids (neochlorogenic and chlorogenic acids) and flavanols (procyanidin dimer and (+)-catechin). The content of hydroxycinnamic acid is higher in ‘Calante’ than in ‘Andross’, while the content of flavanols is higher in ‘Andross’ than in ‘Calante’. Further studies should be carried out in order to disentangle which phenolics may give the tolerance to the selected genotypes.
In breeding programs, the search for inverse correlations between physicochemical traits or antioxidant compound contents with disease severity is of great importance when selecting genotypes with a high quality and low susceptibility to M. laxa. In the present study, the correlation of the physicochemical parameters and the content of antioxidant compounds was significantly negative with the disease parameters (Table S9). The pH, TA and RI are parameters to be considered when selecting peaches with a higher tolerance. In this study, pH has a negative correlation with %BRI (r = −0.286, p ≤ 0.05) and TA has a negative correlation with CExt (r = −0.330, p ≤ 0.05). These correlations can be explained with the results found in Obi et al. [56], where certain ranges of pH and TA that can favor, hinder or even inhibit M. laxa growth in peach. Fruit firmness at harvest has a negative influence on the percentage of colonization and extent of colonization, the higher the firmness, the lower the percentage of colonization and extent of colonization (r = −0.485, r = −0.414, p ≤ 0.01). This relationship was not found previously in other peach progenies [29], but rather this tolerance is more dependent on the characteristics or genetic background of the studied genotypes [32]. Interestingly, firmness was positively correlated with total phenolics in flesh and peel and flavonoids content in flesh (r = 0.510, r = 0.802, r = 0.458, p ≤ 0.01, p ≤ 0.05), indicating that the higher the firmness, the higher the antioxidant contents. This could be positive to the particular genetic performance of this population, because for selection of clingstone non-melting peach progeny, firmness is associated with a high nutritional quality of these fruits. In addition, the study has shown that the higher the content of antioxidant compounds (total phenolics and flavonoids) and RAC, the higher the tolerance to M. laxa. According to this, the antioxidant contents were higher in 2014 than in 2015 (Table 6), while the disease parameters were the opposite, being lower in 2014 than in 2015 (Table 4). Total phenolics is a highly relevant factor when selecting peaches with some tolerance to M. laxa, as phenolic compounds have been shown to be positively correlated with tolerance to brown rot [22,36,51]. Other studies have associated hydroxycinnamic acids such as neochlorogenic and chlorogenic acids present in peach flesh and peach peel with a high antioxidant capacity that results in a high tolerance to M. laxa growth [27], describing specifically a negative correlation between hydroxycinnamic acids and M. laxa growth (r = −0.900, chlorogenic acid, r = −0.850, neochlorogenic acid). Results obtained in this study can be complemented with other similar studies, where inverse correlations were found between the content of antioxidant compounds, such as anthocyanins or vitamin C, with M. laxa susceptibility [29,30]. Finally, we also observed a negative correlation between RAC and certain disease parameters such as CExt, LD and LS (r = −0.392, r = −0.370, r = −0.299, p ≤ 0.01, p ≤ 0.05). These correlations have not been reported in other studies carried out on eight commercial peaches [30].
The principal component analysis (PCA) of agronomic, biochemical and disease parameters evaluated in the forty-two selected genotypes in 2014 clearly separated the eight genotypes, which had LS < 40 mm and contained high antioxidant contents. The PCA with only the eight selected genotypes allowed us to identity two genotypes, AC-24 and AC-93, with the highest titratable acidity and antioxidant contents and the lowest disease symptoms, which is consistent with the correlations discussed above.

5. Conclusions

To our knowledge, this is the first study carried out to establish the tolerance or susceptibility to M. laxa in a population derived from the ‘Andross’ × ‘Calante’ cross. Based on the analysis carried out in this study, it is confirmed that titratable acidity and antioxidant compounds contents, especially total phenolics and flavonoids, contribute to the control of brown rot disease in peach. The PCA with the 42 genotypes studied in 2014 has allowed us to select eight genotypes for reassessment in 2015. Taken together, with the results of the eight selected genotypes and the projection in the PCA we identified AC-24 and AC-93 as candidate genotypes with higher agronomic and biochemical fruit quality and fewer symptoms of brown rot caused by the fungus M. laxa. These genotypes are susceptible to be considered as pre-breeding materials to be propagated in new experimental field orchards to evaluate the performance for production of ‘Calanda’-type peaches with high fruit quality and tolerance to brown rot caused by M. laxa under the Aragon Protected Designation of Origin regulations.

Supplementary Materials

The following supporting information can be downloaded at: https://www.mdpi.com/article/10.3390/agronomy12112662/s1, Figure S1: Monthly average precipitation (bars) and temperatures (lines) recorded during the study years 2014 and 2015 at the Aula Dei Experimental Station (Zaragoza, Spain). Source: Meteorological data INTRANET EEAD-CSIC; Table S1: Incidence parameters of M. laxa in the forty-two genotypes derived from the ‘Andross’ × ‘Calante’ cross in 2014 and in the eight genotypes evaluated in 2015. Data are mean ± standard error of each studied year (2014–2015). The eight genotypes selected in 2014 with LS < 40 mm are shown in bold; Table S1 (continued). Colonization parameters of M. laxa in the forty-two genotypes derived from the ‘Andross’ × ‘Calante’ cross in 2014 and in the eight genotypes evaluated in 2015. Data are mean ± standard error of each studied year (2014–2015). The eight genotypes selected in 2014 with LS < 40 mm are shown in bold; Table S2. Physicochemical basic quality traits in eight selected genotypes derived from the ‘Andross’ × ‘Calante’ cross evaluated during 2014. Data are mean ± standard error (N = 5–20). At harvest, FF was measured in 10 fruits; SSC, pH and TA parameters were evaluated in a mixed pool of 10 fruits. In storage, FF and SSC were measured in 5 fruits non-inoculated and in 20 fruits inoculated; Table S2 (continued). Physicochemical basic quality traits in eight selected genotypes derived from the ‘Andross’ × ‘Calante’ cross evaluated during 2015. Data are mean ± standard error (N = 5–20). At harvest, FF was measured in 10 fruits; SSC, pH and TA parameters were evaluated in a mixed pool of 10 fruits. In storage, FF and SSC were measured in 5 fruits non-inoculated and in 20 fruits inoculated; Table S3. Fruit firmness (FF) and soluble solids content (SSC) in flesh of the 42 genotypes selected from the ‘Andross’ × ‘Calante’ population during the two years of study (2014–2015). FF and SSC were measured at harvest and after incubation (non-inoculated or inoculated). Data are mean ± standard error (SE). For each genotype, the number of fruits analyzed were 5–20. N represents the total number of fruits evaluated in both growing seasons; Table S4. Fruit firmness (FF) and soluble solids content (SSC) in flesh of the 8 genotypes selected from the ‘Andross’ × ‘Calante’ population during the two years of study (2014–2015). FF and SSC were measured at harvest and after incubation (non-inoculated or inoculated). Data are mean ± standard error (SE). For each genotype, the number of fruits analyzed were 5–20. N represents the total number of fruits evaluated in both growing seasons; Table S5. Diseases parameters after inoculation with Monilinia laxa in the cultivars studied. N represents the number of the biological replications studied each year (2014–2015). Mean values ± standard error (SE) of the parents ‘Andross’ and ‘Calante’ evaluated in 2014 and 2015; Table S6. Antioxidant compounds contents and relative antioxidant capacity in flesh tissue of the cultivars studied. N represents the number of the biological replications studied each year (2014–2015). Mean values ± standard error (SE) of the parents ‘Andross’ and ‘Calante’ evaluated in 2014 and 2015. Table S7. Antioxidant compound contents in the flesh and the peel of 8 genotypes selected from ‘Andross’ × ‘Calante’ population evaluated in 2015. For each genotype, means are from N = 3 replicates; Table S8. Pearson’s bivariate correlations of all disease parameters in the population studied in 2014–2015 (N = 50); Table S9. Pearson’s bivariate correlations of some physicochemical compounds with all disease parameters in the population studied in 2014–2015 (N = 50).

Author Contributions

J.J.B. and Y.G. devised the study objectives and designed the experiment. V.I.O. carried out the experiment, performed the statistical analysis and drafted the manuscript. J.M. contributed to, the statistical analysis, write the paper, and prepare figures and tables. J.J.B. helped with the experimental facilities and supervised the research. Y.G. conceived the experiment, supervised the research, write and edit the paper, help with the statistical analysis and provided funds. All authors have read and agreed to the published version of the manuscript.

Funding

This research was supported by the Spanish Ministry of Economy and Competitiveness grants AGL2014-52063R, AGL2017-83358-R (MCIU/AEI/FEDER/UE) and the Government of Aragón with grants A44, A09_20R, co-financed with FEDER funds; and the CSIC grant 2020AEP119. J.M. was the recipient of a pre-doctoral contract awarded by the Government of Aragon (2020–2024).

Data Availability Statement

Not applicable here.

Acknowledgments

We thank J. Usall of the (IRTA Lleida) for providing the original inoculum of the M. laxa; to J. Torrens (Agromillora Group) and M.A. Moreno (EEAD-CSIC) for providing plant materials; and to L. Agreda and R. Giménez (EEAD-CSIC) for technical assistance. The Research Center and Food Technology of Aragón (CITA) allowed us the use of its plant protection facilities. We acknowledge support of the article processing charge by MDPI through the CSIC Open Access Program.

Conflicts of Interest

The authors declare no conflict of interest.

References

  1. FAOSTAT. Food and Agricultural Organization of the United Nations. 2020. Available online: https://www.fao.org/faostat/en/#data/QCL/visualize (accessed on 4 August 2022).
  2. Charrier, G.; Ngao, J.; Saudreau, M.; Méglio, T. Effects of environmental factors and management practices on microclimate, winter physiology, and frost resistance in trees. Front. Plant Sci. 2015, 6, 259. [Google Scholar] [CrossRef] [Green Version]
  3. Hong, C.; Holtz, B.A.; Morgan, D.P.; Michailides, T.J. Significance of thinned fruit as a source of the secondary inoculum of Monilinia fructicola in California nectarine orchards. Plant Dis. 1997, 81, 519–524. [Google Scholar] [CrossRef] [Green Version]
  4. Obi, V.I.; Barriuso, J.J.; Gogorcena, Y. Peach brown rot: Still in search of an ideal management option. Agriculture 2018, 8, 125. [Google Scholar] [CrossRef] [Green Version]
  5. Rungjindamai, N.; Jeffries, P.; Xu, X.M. Epidemiology and management of brown rot on stone fruit caused by Monilinia laxa. Eur. J. Plant Pathol. 2014, 140, 1–17. [Google Scholar] [CrossRef]
  6. Villarino, M.; Egüen, B.; Melgarejo, P.; Lamarca, N.; Segarra, J.; Usall, J.; Melgarejo, P.; de Cal, A. Occurrence of Monilinia laxa and M. fructigena after introduction of M. fructicola in peach orchards in Spain. Eur. J. Plant Pathol. 2013, 137, 835–845. [Google Scholar] [CrossRef]
  7. De Cal, A.; Egüen, B.; Melgarejo, P. Vegetative compatibility groups and sexual reproduction among Spanish Monilinia fructicola isolates obtained from peach and nectarine orchards, but not Monilinia laxa. Fungal Biol. 2014, 118, 484–494. [Google Scholar] [CrossRef]
  8. Villarino, M.; Melgarejo, P.; De Cal, A. Growth and aggressiveness factors affecting Monilinia spp. survival peaches. Int. J. Food Microbiol. 2016, 224, 22–27. [Google Scholar] [CrossRef]
  9. Mari, M.; Casalini, L.; Baraldi, E.; Bertolini, P. Susceptibility of apricot and peach fruit to Monilinia laxa during phenological stages. Postharvest Biol. Technol. 2003, 30, 105–109. [Google Scholar] [CrossRef]
  10. Papavasileiou, A.; Testempasis, S.; Michailides, T.J.; Karaoglanidis, G.S. Frequency of brown rot fungi on blossoms and fruit in stone fruit orchards in Greece. Plant Pathol. 2015, 64, 416–424. [Google Scholar] [CrossRef]
  11. Bernat, M.; Segarra, J.; Casal, C.; Torres, R.; Teixidó, N.; Usall, J. Identification of fungal population in the environment and on surfaces of stone fruit packinghouses. Eur. J. Plant Pathol. 2017, 148, 723–731. [Google Scholar] [CrossRef]
  12. Egüen, B.; Melgarejo, P.; De Cal, A. Sensitivity of Monilinia fructicola from Spanish peach orchards to thiophanate-methyl, iprodione, and cyproconazole: Fitness analysis and competitiveness. Eur. J. Plant Pathol. 2015, 141, 789–801. [Google Scholar] [CrossRef]
  13. Casals, C.; Torres, R.; Teixidó, N.; De Cal, A.; Segarra, J.; Usall, J. Brown rot on stone fruit: From epidemiology studies to the development of effective control strategies. Sci. Hortic. 2022, 301, 111096. [Google Scholar] [CrossRef]
  14. Holb, I.J.; Schnabel, G. Differential effect of triazoles on mycelial growth and disease measurements of Monilinia fructicola isolates with reduced sensitivity to DMI fungicides. Crop Prot. 2007, 26, 753–759. [Google Scholar] [CrossRef]
  15. Aiello, D.; Restuccia, C.; Stefani, E.; Vitale, A.; Cirvilleri, G. Postharvest biocontrol ability of Pseudomonas synxantha against Monilinia fructicola and Monilinia fructigena on stone fruit. Postharvest Biol. Technol. 2019, 149, 83–89. [Google Scholar] [CrossRef]
  16. Egüen, B.; Melgarejo, P.; De Cal, A. The effect of fungicide resistance on the structure of Monilinia laxa populations in Spanish peach and nectarine orchards. Eur. J. Plant Pathol. 2016, 145, 815–827. [Google Scholar] [CrossRef]
  17. Mari, M.; Di Francesco, A.; Bertolini, P. Control of fruit postharvest diseases: Old issues and innovative approaches. Stewart Postharvest Rev. 2014, 10, 1–4. [Google Scholar] [CrossRef]
  18. Casals, C.; Guijarro, B.; De Cal, A.; Torres, R.; Usall, J.; Perdrix, V.; Hilscher, U.; Ladurner, E.; Smetsf, T.; Teixidó, N. Field validation of biocontrol strategies to control brown rot on stone fruit in several European countries. Pest Manag. Sci. 2021, 77, 2502–2511. [Google Scholar] [CrossRef]
  19. Kreidl, S.; Edwards, J.; Villalta, O.N. Assessment of pathogenicity and infection requirements of Monilinia species causing brown rot of stone fruit in Australian orchards. Australas. Plant Pathol. 2015, 44, 419–430. [Google Scholar] [CrossRef]
  20. Usall, J.; Ippolito, A.; Sisquella, M.; Neri, F. Physical treatments to control postharvest diseases of fresh fruits and vegetables. Postharvest Biol. Technol. 2016, 122, 30–40. [Google Scholar] [CrossRef]
  21. Rubos, A.; Thomidis, T.; Tsipouridis, C.; Navrozidis, E.; Michailidou, O. Susceptibility of peach—Nectarine cultivars on brown rot infections. Ann. Univ. Oradea Fascicle Environ. Protect. 2008, 13, 214–217. [Google Scholar]
  22. Gradziel, T.M.; Wang, D. Evaluation of brown rot resistance and its relation to enzymatic browning in clingstone peach germplasm. J. Am. Soc. Hortic. Sci. 1993, 118, 675–679. [Google Scholar] [CrossRef]
  23. Quilot-Turion, B.; Ould-Sidi, M.-M.; Kadrani, A.; Hilgert, N.; Génard, M.; Lescourret, F. Optimization of parameters of the ‘Virtual Fruit’ model to design peach genotype for sustainable production systems. Eur. J. Agron. 2012, 42, 34–48. [Google Scholar] [CrossRef]
  24. Martínez-García, P.J.; Parfitt, D.E.; Bostock, R.M.; Fresnedo-Ramírez, J.; Vazquez-Lobo, A.; Ogundiwin, E.A.; Gradziel, T.M.; Crisosto, C.H. Application of genomic and quantitative genetic tools to identify candidate resistance genes for brown rot resistance in peach. PLoS ONE 2013, 8, e78634. [Google Scholar] [CrossRef]
  25. Baró-Montel, N.; Torres, R.; Casals, C.; Teixidó, N.; Segarra, J.; Usall, J. Developing a methodology for identifying brown rot resistance in stone fruit. Eur. J. Plant Pathol. 2019, 154, 287–303. [Google Scholar] [CrossRef]
  26. Obi, V.; Barriuso, J.J.; Moreno, M.Á.; Giménez, R.; Gogorcena, Y. Optimizing protocols to evaluate brown rot (Monilinia laxa) susceptibility in peach and nectarine fruits. Australas. Plant Pathol. 2017, 46, 183–189. [Google Scholar] [CrossRef] [Green Version]
  27. Villarino, M.; Sandín-España, P.; Melgarejo, P.; De Cal, A. High chlorogenic and neochlorogenic acid levels in immature peaches reduce Monilinia laxa infection by interfering with fungal melanin biosynthesis. J. Agric. Food Chem. 2011, 59, 3205–3213. [Google Scholar] [CrossRef]
  28. Oliveira-Lino, L.; Mercier, V.; Faoro, F.; Bassi, D.; Bornard, I.; Quilot-Turion, B. Brown rot strikes Prunus fruit: An ancient fight almost always lost. J. Agric. Food Chem. 2016, 64, 4029–4047. [Google Scholar] [CrossRef] [Green Version]
  29. Obi, V.; Barriuso, J.J.; Usall, J.; Gogorcena, Y. Breeding strategies for identifying superior peach genotypes resistant to brown rot. Sci. Hortic. 2019, 246, 1028–1036. [Google Scholar] [CrossRef] [Green Version]
  30. Obi, V.; Montenegro, J.; Barriuso, J.J.; Saidani, F.; Aubert, C.; Gogorcena, Y. Is the tolerance of commercial peach cultivars to brown rot caused by Monilinia laxa modulated by its antioxidant content? Plants 2020, 9, 589. [Google Scholar] [CrossRef]
  31. Dos Santos, J.; Raseira, M.C.B.; Zanandrea, I. Resistance to brown rot in peach plants. Bragantia 2012, 71, 219–225. [Google Scholar] [CrossRef] [Green Version]
  32. Gradziel, T.M. Changes in susceptibility to brown rot with ripening in three clingstone peach genotypes. J. Am. Soc. Hortic. Sci. 1994, 119, 101–105. [Google Scholar] [CrossRef]
  33. Fu, W.; da Silva Linge, C.; Gasic, K. Genome-wide association study of brown rot (Monilinia spp.) tolerance in peach. Front. Plant Sci. 2021, 12, 1–14. [Google Scholar] [CrossRef]
  34. Baró-Montel, N.; Eduardo, I.; Usall, J.; Casals, C.; Arús, P.; Teixidó, N.; Torres, R. Exploring sources of resistance to brown rot in an interspecific almond × peach population. J. Sci. Food Agric. 2019, 99, 4105–4113. [Google Scholar] [CrossRef] [Green Version]
  35. Feliciano, A.; Feliciano, A.J.; Ogawa, J.M. Monilinia fructicola resistance in the peach cultivar Bolinha. Phytopathology 1987, 77, 776–780. [Google Scholar] [CrossRef]
  36. Pacheco, I.; Bassi, D.; Eduardo, I.; Ciacciulli, A.; Pirona, R.; Rossini, L.; Vecchietti, A. QTL mapping for brown rot (Monilinia fructigena) resistance in an intraspecific peach (Prunus persica L. Batsch) F1 progeny. Tree Genet. Genomes 2014, 10, 1223–1242. [Google Scholar] [CrossRef]
  37. Dini, M.; Raseira, M.C.B.; Scariotto, S.; Ueno, B. Breeding peaches for brown rot resistance in Embrapa. Agronomy 2022, 12, 2306. [Google Scholar] [CrossRef]
  38. Monteagudo, A.; Font i Forcada, C.; Estopañán, G.; Dodd, R.S.; Alonso, J.M.; Rubio-Cabetas, M.J.; Fernandez i Marti, Á. Biochemical analyses and expression of cold transcription factors of the late PDO ‘Calanda’ peach under different post-harvest conditions. Sci. Hortic. 2018, 238, 116–125. [Google Scholar] [CrossRef]
  39. B. O. A. (Boletín Oficial de Aragón). Núm. 288. Available online: http://www.melocotondecalanda.com (accessed on 4 September 2022).
  40. Crisosto, C.H. Stone fruit maturity indices: A descriptive review. Postharvest News Inf. 1994, 5, 68. [Google Scholar]
  41. Saidani, F.; Giménez, R.; Aubert, C.; Chalot, G.; Betrán, J.; Gogorcena, Y. Phenolic, sugar and acid profiles and the antioxidant composition in the peel and pulp of peach fruits. J. Food Compos. Anal. 2017, 62, 126–133. [Google Scholar] [CrossRef] [Green Version]
  42. Okamura, M. An improved method for determination of l-ascorbic acid and l-dehydroascorbic acid in blood plasma. Clin. Chim. Acta 1980, 103, 259–268. [Google Scholar] [CrossRef]
  43. Singleton, V.L.; Rossi, J.A. Colorimetry of total phenolics with phosphomolybdic phosphotungstic acid. Am. J. Enol. Vitic. 1965, 16, 144–158. [Google Scholar]
  44. Zhishen, J.; Mengcheng, T.; Jianming, W. The determination of flavonoid contents in mulberry and their scavenging effects on superoxide radicals. Food Chem. 1999, 64, 555–559. [Google Scholar] [CrossRef]
  45. Brand-William, W.; Cuvelier, M.; Berset, C. Use of a free radical method to evaluate antioxidant activity. LWT-Food Sci. Tecnol. 1995, 28, 25–30. [Google Scholar] [CrossRef]
  46. Llácer, G.; Badenes, M.L. Peach breeding in Spain. Acta Hortic. 2012, 63–68. [Google Scholar] [CrossRef]
  47. Anthony, B.R.; Phillips, D.J.; Badr, S.; Aharoni, Y. Decay control and quality maintenance after moist air heat treatment of individually plastic-wrapped nectarines. J. Am. Soc. Hortic. Sci. 1989, 114, 946–949. [Google Scholar] [CrossRef]
  48. Casals, C.; Teixidó, N.; Viñas, I.; Llauradó, S.; Usall, J. Control of Monilinia spp. on stone fruit by curing treatments. Part I. The effect of temperature, exposure time and relative humidity on curing efficacy. Postharvest Biol. Technol. 2010, 56, 19–25. [Google Scholar] [CrossRef]
  49. Zhou, T.; Xu, S.; Sun, D.W.; Wang, Z. Effects of heat treatment on postharvest quality of peaches. J. Food Eng. 2002, 54, 17–22. [Google Scholar] [CrossRef]
  50. Gradziel, T.M.; Bostock, R.M.; Adaskaveg, J.E. Resistance to brown rot disease in peach is determined by multiple structural and biochemical components. Acta Hortic. 2003, 622, 347–352. [Google Scholar] [CrossRef]
  51. Oliveira-Lino, L.; Quilot-Turion, B.; Dufour, C.; Corre, M.-N.; Lessire, R.; Génard, M.; Poësel, J.-L. Cuticular waxes of nectarines (Prunus persica L. Batsch) during fruit development in relation to surface conductance and susceptibility to Monilinia laxa. J. Exp. Bot. 2020, 71, 5521–5537. [Google Scholar] [CrossRef]
  52. Mustafa, M.H.; Bassi, D.; Corre, M.N.; Oliveira-Lino, L.; Signoret, V.; Quilot-Turion, B.; Cirilli, M. Phenotyping brown rot susceptibility in stone fruit: A literature review with emphasis on peach. Horticulturae 2021, 7, 115. [Google Scholar] [CrossRef]
  53. Kappel, F.; Sholberg, P.L. Screening sweet cherry cultivars from the Pacific Agri-Food Research Centre Summerland breeding program for resistance to brown rot (Monilinia fructicola). Can. J. Plant Sci. 2008, 88, 747–752. [Google Scholar] [CrossRef]
  54. Xu, X.M.; Guerin, L.; Robinson, J.D. Effects of temperature and relative humidity on conidial germination and viability, colonization and sporulation of Monilinia fructigena. Plant Pathol. 2001, 50, 561–568. [Google Scholar] [CrossRef]
  55. Burnett, A.L.; Lalancette, N.; McFarland, K.A. Effect of QoI fungicides on colonization and sporulation of Monilinia fructicola on peach fruit and blossom blight cankers. Plant Dis. 2010, 94, 1000–1008. [Google Scholar] [CrossRef]
  56. Obi, V.; Barriuso, J.; Gogorcena, Y. Effects of pH and titratable acidity on the growth and development of Monilinia laxa (Aderh. & Ruhl.) in vitro and in vivo. Eur. J. Plant Pathol. 2018, 145, 815–827. [Google Scholar] [CrossRef] [Green Version]
  57. Lopresti, J.; Goodwin, I.; McGlasson, B.; Holford, P.; Golding, J. Variability in size and soluble solids concentration in peaches and nectarines. Hortic. Rev. 2014, 42, 253–311. [Google Scholar] [CrossRef]
  58. Cantín, C.M.; Moreno, M.Á.; Gogorcena, Y. Evaluation of the antioxidant capacity, phenolic compounds, and vitamin C content of different peach and nectarine [Prunus persica (L.) Batsch] breeding progenies. J. Agric. Food Chem. 2009, 57, 4586–4592. [Google Scholar] [CrossRef]
  59. Abidi, W.; Cantín, C.M.; Jiménez, S.; Giménez, R.; Moreno, M.Á.; Gogorcena, Y. Influence of antioxidant compounds, total sugars and genetic background on the chilling injury susceptibility of a non-melting peach (Prunus persica (L.) Batsch) progeny. J. Sci. Food Agric. 2015, 95, 351–358. [Google Scholar] [CrossRef] [Green Version]
  60. Milatović, D.; Nikolić, D.; Durović, D. Variability, heritability and correlations of some factors affecting productivity in peach. Hortic. Sci. 2010, 37, 79–87. [Google Scholar] [CrossRef]
Figure 1. Principal Component Analysis (PCA) of forty-two genotypes from the ‘Andross’ × ‘Calante’ population evaluated in 2014 and the studied variables. The eight selected genotypes are represented as (AC-). Open circles correspond to the rest of the evaluated genotypes. Relevant traits are labeled. The red oval groups the antioxidant parameters (vitamin C, total phenolics, flavonoids and RAC), the green the disease parameters (%BRI, LD, LS, %C, CExt and CS) and the blue square the eight selected genotypes. Abbreviations as indicates in Table 1, Table 3 and Table 5.
Agronomy 12 02662 g001
Figure 2. Principal Component Analysis (PCA) of eight genotypes from the ‘Andross’ × ‘Calante’ population evaluated in 2014 and 2015 and the studied variables. The genotypes are represented as (AC-). The red oval groups the antioxidant parameters and the green the disease parameters of the eight selected genotypes. Abbreviations as indicates in Table 1, Table 3 and Table 5.
Agronomy 12 02662 g002
Table 1. Physicochemical basic quality traits at harvest in flesh tissue of all the genotypes studied. N represents the number of the biological replications studied each year (2014–2015). Minimum, maximum, mean values ± standard error of all genotypes derived from the ‘Andross’ × ‘Calante’ cross and both parents ‘Andross’ and ‘Calante’ evaluated in 2014 and 2015. For each fruit parameter, the number of fruits analyzed was 10 fruits for FF. SSC, pH and TA were measured from a pool of 10 fruits per genotype.
Progeny‘Andross’‘Calante’
201420152014–20152014–2015
Parameters *N (2014–2015)MinimumMaximumMean ± SEMean ± SEMean ± SEMean ± SEMean ± SE
Harvest date (HD)42-8222266248 ± 2.38254 ± 4.70249 ± 2.15241 ± 3.50278 ± 0.50
Fruit weight (FtW)41-8158.82364.00210.80 ± 5.55249.97 ± 7.62217.19 ± 5.22166.55 ± 4.55295.05 ± 9.40
Fruit firmness (FF)274-6014.2166.1538.72 ± 0.6233.89 ± 1.1337.86 ± 0.58 28.12 ± 2.3145.26 ± 1.51
SSC42-88.4013.0011.00 ± 0.1811.26 ± 0.5311.04 ± 0.17 14.15 ± 0.3814.55 ± 0.32
pH42-83.804.044.38 ± 0.063.90 ± 0.034.30 ± 0.054.31 ± 0.033.65 ± 0.03
Titratable acidity (TA)42-80.240.860.41 ± 0.010.63 ± 0.040.45 ± 0.020.35 ± 0.010.72 ± 0.02
Ripening index (RI)42-812.8040.9627.60 ± 0.8918.25 ± 1.2626.11 ± 0.9140.69 ± 0.8320.09 ± 0.81
Units and abbreviations: Fruit firmness (Newton, N); Soluble solids content (SSC, °Brix); Titratable acidity (%); Ripening index (SSC/TA); SE = Standard error;. * Statistics were not conducted here between years because the number of samples were biased between years (2014 vs. 2015).
Table 2. Physicochemical basic quality traits in eight selected genotypes derived from the ‘Andross’ × ‘Calante’ cross evaluated during the two years of study (2014–2015). Data are mean values of N = 2–36 replications (see also Table S2). At harvest, FF was measured in 10 fruits; SSC, pH and TA parameters were evaluated in a mixed pool of 10 fruits. In storage, FF and SSC were measured in 5 fruits that were non-inoculated and in 20 fruits that were inoculated.
GenotypeHDFtWFF
Harvest
FF
Incubated
FF
Inoculated
SSC
Harvest
SSC
Incubated
SSC
Inoculated
pHTARI
AC-11258 b235.2548.76 c36.20 c31.56 f10.8010.19 abcd10.09 cd4.780.46 28.75
AC-24262 b216.4639.99 b28.13 a26.36 cd10.759.28 ab10.66 d4.310.65 18.29
AC-34258 b251.5234.70 ab30.33 ab29.00 e12.4012.00 e10.86 d4.110.51 25.81
AC-35235 a225.5732.60 ab30.04 ab24.20 bc11.0511.39 cde9.53 bc4.030.49 22.74
AC-61258 b222.5637.40 b35.40 c28.05 de11.4511.78 de10.45 d4.230.49 23.28
AC-82226 a237.9627.76 a26.12 a22.97 b10.9010.90 bcde10.21 cd4.000.50 22.39
AC-93262 b236.8640.34 b33.42 bc32.24 f10.009.90 abc9.26 b3.850.61 16.65
AC-104262 b204.2732.83 ab26.36 a18.72 a9.259.07 a8.27 a4.15 0.48 19.20
One-way ANOVA was carried out for lineal model on raw data followed by the Duncan test. In columns, different letters indicate significant differences. Abbreviations and units: Harvest day (HD, days); Fruit firmness (FF, Newton, N); Soluble solids content (SSC, Brix); Titratable acidity (TA, %); Ripening index (RI, SSC/TA).
Table 3. Diseases parameters after inoculation with Monilinia laxa. N represents the number of the biological replications studied each year (2014–2015). Minimum, maximum, mean values ± standard error of all the progeny derived from ‘Andross’ × ‘Calante’ cross and both parents ‘Andross’ and ‘Calante’ evaluated in 2014 and 2015. Data of all genotypes presented in Table S1. For each genotype and trait, means are from N = 20 fruits.
Progeny‘Andross’‘Calante’
201420152014–20152014–2015
Parameters #N (2014–2015)MinimumMaximumMean ± SEMean ± SEMean ± SEMean ± SEMean ± SE
% Brown rot incidence42-845.00100.0090.26 ± 1.8393.75 ± 3.1090.82 ± 1.6270.00 ± 30.0087.50 ± 12.50
Lesion diameter690-1507.1979.8952.51 ± 0.6845.84 ± 0.6551.32 ± 0.5733.28 ± 2.6053.55 ± 3.48
Lesion severity690-1504.6776.6348.69 ± 0.6843.47 ± 0.6947.76 ± 0.58 30.29 ± 3.1950.07 ± 4.02
% Colonization42-820.00100.0071.75 ± 3.3789.38 ± 4.9574.57 ± 3.06 90.00 nd65.00 ± 35.00
Colonization extent543-14311.6771.9449.91 ± 0.5440.71 ± 0.6447.99 ± 0.4739.93 ± 0.84 nd 51.73 ± 3.36
Colonization severity543-1434.0368.7339.47 ± 0.6437.29 ± 0.7339.01 ± 0.5335.94 ± 0.76 nd 47.52 ± 4.63
Abbreviations and units: Brown rot incidence (BRI, %); Lesion diameter (LD, mm); Lesion severity (LS, mm); Colonization (C, %); Colonization extent (CExt, mm); Colonization severity (CS, mm); LS or CS = [% (BRI or C)] × (LD or CExt)]; SE = Standard error; nd: not colonization in 2014. #Statistics were not conducted between years because the number of samples were biased (2014 vs. 2015).
Table 4. Effect of the year and genotype on the disease parameters in the eight selected genotypes from the ‘Andross’ × ‘Calante’ population evaluated during the two years of study (2014–2015).
%BRILDLS%CCExtCS
Principal factors
Year
201473 a39.71 a30.22 a41 a40.1119.80 a
201594 b45.84 b 43.48 b89 b40.7137.29 b
Genotypes
AC-118448.3943.31 d6945.85 c38.03 c
AC-246540.8429.17 a5035.58 a24.57 a
AC-349344.6241.77 cd7540.49 abc32.47 b
AC-358644.0038.69 bcd6843.89 bc36.42 bc
AC-6182 45.6240.83 cd6243.55 bc35.36 bc
AC-828841.8236.71 bc7534.87 a26.45 a
AC-939038.8735.86 bc6339.18 ab33.05 b
AC-1048341.8734.59 b6340.59 abc27.76 a
Interaction
2014
AC-116945.7931.48 bcd3854.21 d20.33 cdef
AC-244540.0618.02 a2032.46 ab6.49 a
AC-348541.3035.11 cde5540.83 abc22.46 defg
AC-356538.5225.04 ab3544.31 c15.51 bcd
AC-616538.2124.73 ab2944.03 c12.95 abc
AC-829539.9837.98 de9030.74 a 27.67 fgh
AC-938033.8827.10 bc2540.87 abc10.22 ab
AC-1048041.19 32.95 bcd4046.83 cd18.73 cde
2015
AC-1110049.8249.82 f10043.34 c43.34 j
AC-248541.26 35.07 cde8036.36 abc29.09 gh
AC-3410047.7347.43 f9540.29 abc38.27 ij
AC-3510047.5647.56 f10043.74 c43.74 j
AC-6110049.6949.69 f9543.43 c41.26 j
AC-828044.01 35.21 cde6041.06 bc24.63 efgh
AC-9310042.8642.86 ef10038.76 abc38.76 ij
AC-10485 42.50 36.13 de8537.65 abc32.01 hi
Significance
Year **********ns***
Genotype nsns***ns******
Year × Genotype ns*** *****
*** p ≤ 0.001; ** p ≤ 0.01; * p ≤ 0.05; ns: not significant. Two-way ANOVA was carried out for a linear model of raw data followed by the Duncan test. In columns, different letters indicate significant differences. Abbreviations and units are the same as in Table 3.
Table 5. Antioxidant compound contents and relative antioxidant capacity in flesh tissue of all the genotypes studied. N represents the number of the biological replications studied each year (2014–2015). Minimum, maximum, mean values ± standard error of all the hybrids derived from the ´Andross’ × ´Calante’ cross and both parents, ‘Andross’ and ‘Calante’, evaluated in 2014 and 2015. For each genotype, means are from N = 2–6 replicates.
Progeny‘Andross’‘Calante’
201420152014–20152014–2015
Parameters *N (2014–2015)MinimumMaximumMean ± SEMean ± SEMean ± SEMean ± SEMean ± SE
Vitamin C84-230.7219.5310.50 ± 0.467.45 ± 0.569.84 ± 0.4014.91 ± 1.1110.72 ± 0.81
Total phenolics84-2477.6496.2758.80 ± 1.7451.25 ± 2.4457.12 ± 1.4977.09 ± 3.7793.65 ± 16.80
Flavonoids115-2211.4558.9028.29 ± 0.9422.77 ± 1.4127.40 ± 0.8453.92 ± 7.5687.90 ± 16.46
RAC84-2414.83117.9143.72 ± 2.0491.74 ± 2.6354.39 ± 2.5589.41 ± 2.71122.87 ± 13.94
Units: Vitamin C (mg AsA/100 g FW); Total phenolics (mg GAE/100 g FW); Flavonoids (mg CE/100 g FW); RAC (mg TE/100 g FW). * Statistics were not conducted between years because the number of samples were biased (2014 vs. 2015). Abbreviations: RAC = Relative antioxidant capacity; SE = Standard error; GAE = Gallic acid equivalent; CE = Catechin equivalents; TE = Trolox equivalent; FW = Fresh weight.
Table 6. Antioxidant compound contents and relative antioxidant capacity in the flesh of eight genotypes selected from the ‘Andross’ × ‘Calante’ population evaluated during the two years of study (2014–2015). For each genotype, means are from N = 2–3 replicates each year.
Vitamin CTotal PhenolicsFlavonoidsRAC
Principal factors
Year
20148.52 b65.88 b28.72 b51.43 a
20157.45 a51.25 a22.77 a 91.74 b
Genotype
AC-116.41 a60.04 c24.39 bc 83.80 c
AC-246.34 a58.16 c26.50 bc77.11 bc
AC-345.72 a57.41 c23.25 b71.21 ab
AC-358.38 b66.44 d31.45 de75.72 bc
AC-6110.44 c65.71 d35.00 e70.95 ab
AC-8211.41 c42.95 b22.95 b65.33 a
AC-937.80 b68.22 d29.05 cd94.76 d
AC-1046.58 a37.89 a15.62 a66.03 a
Interaction
2014
AC-117.03 cd64.05 fg25.39 cd59.81 cd
AC-246.99 cd88.21 i36.93 e86.53 ef
AC-346.90 cd63.26 fg26.46 d36.86 ab
AC-359.21 ef63.54 fg36.42 e40.10 ab
AC-619.86 fg71.78 h34.65 e48.60 bc
AC-8210.67 fgh 44.93 c23.45 bcd30.53 a
AC-9311.27 gh87.00 i35.06 e72.09 d
AC-1046.23 bcd44.23 bc15.50 a36.91 ab
2015
AC-116.00 abcd57.37 def23.39 bcd99.80 fg
AC-245.92 abc38.13 ab16.07 ab70.84 d
AC-344.93 abc53.51 d18.44 abc94.12 ef
AC-357.82 de68.38 gh26.49 d99.47 fg
AC-6110.82 fgh61.66 efg35.23 e85.85 ef
AC-8211.90 h41.62 bc22.45 abcd88.53 ef
AC-934.32 a55.70 de23.04 bcd109.87 g
AC-1046.82 cd33.66 a15.73 a85.45 e
Significance
Year ************
Genotype ************
Year × Genotype ************
*** p ≤ 0.001. Two-way ANOVA was carried out for lineal model on raw data followed by the Duncan test. In columns, different letters indicate significant differences. Abbreviations and units are the same as in Table 5.
Publisher’s Note: MDPI stays neutral with regard to jurisdictional claims in published maps and institutional affiliations.

