Article

Estimating Sheet Flow Velocities Using Quinine as a Fluorescent Tracer: Bare, Mulched, Vegetated and Paved Surfaces

by
Soheil Zehsaz
1,2,*,
João L. M. P. de Lima
1,2,
M. Isabel P. de Lima
1,2,
Jorge M. G. P. Isidoro
1,3 and
Ricardo Martins
4
1
MARE–Marine and Environmental Sciences Centre/ARNET-Aquatic Research Network, Pole MARE–UCoimbra, Polo II University of Coimbra, Rua Sílvio Lima, 3030-790 Coimbra, Portugal
2
Department of Civil Engineering, Faculty of Sciences and Technology, University of Coimbra, Rua Luís Reis Santos, 3030-788 Coimbra, Portugal
3
Department of Civil Engineering, Institute of Engineering, University of Algarve, 8005-139 Faro, Portugal
4
RISCO–Research Center for Risks and Sustainability in Construction, Department of Civil Engineering, University of Aveiro, 3810-193 Aveiro, Portugal
*
Author to whom correspondence should be addressed.
Agronomy 2022, 12(11), 2687; https://doi.org/10.3390/agronomy12112687
Submission received: 30 August 2022 / Revised: 20 October 2022 / Accepted: 25 October 2022 / Published: 29 October 2022
(This article belongs to the Section Water Use and Irrigation)

Abstract

:
When direct flow velocity measurements are not feasible, the use of tracers can be a valuable tool. In the present study, both laboratory and field experiments were conducted to evaluate the applicability of quinine as a fluorescent tracer for estimating mean sheet flow velocities in different ambient light and surface morphology conditions. Quinine excels in low-light conditions when exposed to UVA light. This tracer was compared with dye and thermal tracers, all in liquid form. In these tracing techniques the tracers were injected into the flow, after which surface velocity was estimated by tracking the leading edge of the tracer plumes and applying a correction factor to calculate the mean velocity (in a water column). The visibility of the tracers was evaluated by measuring the relative luminance and contrast ratio of the quinine and dye tracer plumes. Results show that the quinine tracer can be used to estimate sheet flow velocities over a wide variety of soil and urban surfaces; it has better visibility in comparison to the dye tracer but, in some conditions, lower visibility than the thermal tracer. Although quinine is invisible under bright ambient light conditions, this tracer technique requires low-cost experimental setup and is useful in low-light conditions (e.g., night; twilight; shielded environments).

1. Introduction

Although deep and large waterbodies, such as rivers, can be monitored with flow measuring stations and systems (e.g., flow level gauges), some technical and logistic challenges (e.g., limited access, steep slopes, very shallow water depths, heavy suspended sediment loads) create difficulties in conducting direct flow velocity measurements [1,2,3,4,5]. The difficulties also extend to estimating shallow overland flow velocities, in particular for sheet flow on surfaces with the presence of mulch or vegetation. However, the accurate measurement of such flow velocities, either in urban or rural basins, is an important issue in most hydraulic and hydrologic studies. It can help, e.g., to better describe and model several processes, such as water quality (pollutant transport), water storage, hillslope erosion and the dynamics of sediment transport.
A common approach for estimating surface flow velocities is to monitor the advection using flow velocity tracing techniques. The most popular techniques rely on tracers such as colour dyes (e.g., [6,7,8,9,10]), drifting/floating particles (e.g., [11,12]), salts and electrolytes (e.g., [10,13,14]) or radioactive isotopes (e.g., [15]). Applications of such techniques, in the laboratory and the field, have been the focus of many studies (e.g., [6,8,13,16,17,18,19,20,21]). Additionally, a few recent studies have explored the use of thermal tracers to estimate shallow overland flow velocities in laboratory and field conditions, relying on infrared-thermography-based approaches (e.g., [9,10,12,14,22,23]).
The abovementioned flow velocity estimation methods assess different variables. For example, in the salt tracing method, the electric conductivity (EC) of the salt solution passed through EC sensors (installed at known downstream distances of the injection point) is measured over time; this allows us to estimate the flow mean velocity (e.g., [13]). In studies using isotopes, the oxygen and hydrogen isotopic compositions (δ18O and δ2H) in water molecules are used to trace the movements of water in the rivers or catchments (e.g., [15]). However, for other tracers (e.g., dye and thermal tracers), the methodological frameworks have many similarities. By injecting dye and thermal tracers into the flow, the estimation of shallow flow velocities is based on the determination of the travel time of the leading edge of the tracer’s plume along a defined length, which provides an estimate of the flow surface velocity [22,24]. The mean velocity (in a water column) can then be determined by multiplying the surface’s leading edge velocity by a correction factor (α), which is case-specific and a function of flow discharge, sediment load, surface morphology and diffusion, amongst other variables (e.g., [12,17,24,25]).
In general, the quality of the detection of the tracers added to the flow is important for the success of the measurements. To a certain extent, by increasing the quantity of the injected liquid tracer, one improves its detection rate during the experimental procedure. However, the use of a large tracer volume may have a significant impact on the flow field hydrodynamics, therefore introducing errors in the velocity estimates. Moreover, some tracer constituents may negatively impact the quality of the water and the environment. Thus, there has been a continued search for tracers exhibiting the least impact on both the flow hydraulics and the environment. Consequently, thermal tracer techniques that use hot/cold water as the flow velocity tracer are rather advantageous over other approaches as it does not impact the environment. However, the high cost of the thermographic cameras that are needed for detecting the thermal tracer could restrict its applicability.
Fluorescent dye tracers are also common in hydrology (e.g., [24,26,27,28,29]). Several nontoxic and noncarcinogenic dyes, e.g., uranine, rhodamine WT, eosin, CI Direct Yellow 96, as well as other optical brighteners can be easily accessible. These tracers are common tools to identify connections between groundwater supply points (e.g., sinkholes and karst windows) and discharge points (e.g., springs and wells) [27,28]. In these studies, passive collectors, such as activated carbon packages or unbleached cotton, are used to detect the fluorescent tracer by positioning them at monitoring points. Some of these fluorescent tracers, such as rhodamine WT, perform well under sunlight, while others need to be detected with the help of collectors and fluorometers [30]. Since in hydrological studies the quantity of fluorescent tracers used is insignificant, its environmental impact due to contamination is tolerable (e.g., [27,28,31]).
Recently, de Lima et al. [29] presented a proof of concept for using quinine as a fluorescent tracer for surface flows over bare soil. This study used a quinine solution that was injected into the flow and reported that, in comparison with the colour dye and thermal tracer techniques: (i) the main advantages of using the fluorescent tracer technique are the high visibility of the injected tracer under ultraviolet A (UVA) light for low-luminosity conditions, less environmental damage and low-cost; (ii) the main disadvantage is that the fluorescent tracer is not visible under sunny or luminous conditions.
In the present paper, the use of quinine as a fluorescent tracer was extended to the estimation of the velocity of sheet flows over different mulched and vegetated soils and paved urban surfaces, for different ambient light (day, twilight, night) conditions, based on both laboratory and field experiments. Our results were compared with dye and thermal tracer estimates. The objectives of this study include: (i) evaluating the applicability of quinine as a fluorescent tracer (under UVA light) when estimating mean sheet flow velocities (in a water column) in different ambient light and surface morphology conditions; (ii) evaluating the visibility of the quinine tracer against dye and thermal tracers, for similar flow, surface and light conditions; (iii) assessing in which conditions, regarding surface morphology and light, can the use of the quinine fluorescent tracer be advantageous.

2. Materials and Methods

This study is a follow-up of the exploratory small-scale laboratory experiments that were carried out on a soil flume by de Lima et al. [29] for testing quinine as a flow velocity fluorescent tracer. The present laboratory and field experimental conditions and methodology are described in the next sections.

2.1. Laboratory Measurement Setup

A schematic representation of the laboratory experimental setup used for estimating sheet flow velocities based on different liquid tracers is shown in Figure 1.
The variables and materials used for this set of experiments were:
(a)
A rectangular soil flume (3.0 m long and 0.3 m wide) adjusted to a constant slope of 5% (≈2.86°). The flume was prepared with a soil layer of 62 mm depth, with a bulk density of 1100 kg/m3.
(b)
An upstream water supply system that included a constant head tank and a feeder box, which applied a known constant upstream flow of approximately 0.14 L/s over the flume’s soil surface. The measuring frame was defined at 1.0 m distance from the upstream flume section (incoming flow section).
(c)
Different surfaces: (i) bare soil; (ii) soil covered with rice straw mulch levels of 0.5, 1.0 and 2.0 ton/ha. These straw mulch levels were used in experiments conducted in other studies (e.g., [32,33]).
(d)
Different flow velocity tracers (Section 2.3).
(e)
A tubular ultraviolet lamp UVA (BLB light bulb), used for the detection of the fluorescent quinine tracer, with properties: nominal power of 36 W; UVA irradiance @ 20 cm; 315–400 nm; 350 mW/cm2.
(f)
Optical and infrared sensors (Section 2.4).
The soil used in the flume experiments had a sandy loam texture, with sand, silt and clay contents of, respectively, 79%, 10% and 11%, and a brownish colour. This type of soil was used in previous studies, e.g., [9,29,34]. It was collected (40°10′46.9″ N, 8°24′54.4″ W) from the right bank of river Mondego, on the outskirts of the city of Coimbra, Portugal.
Analysis of the images of the scanned area (i.e., the area recorded by the cameras, or measuring frame; see Figure 1) using the Image Colour Extract PHP online image processing tool [35] showed that the percentage of the area covered by the different mulch levels was: mulch 0.5 ton/ha, 11%; mulch 1 ton/ha, 25%; and mulch 2 ton/ha, 48%. For simplicity, each image was converted to a black and white scale and, subsequently, the percentage of area covered by each colour (black/white) was calculated.

2.2. Field Measurement Setup

The field experiments were carried out in an urban paved parking lot and in a Pine and Eucalyptus forest site, both in the vicinity of the Department of Civil Engineering of the Faculty of Sciences and Technology of the University of Coimbra (40°11′08.8″ N, 8°24′51.1″ W). A schematic view of the experimental field setup is shown in Figure 2.
In the field, different surfaces were tested (Figure 3): (i) paved surface (concrete tiles with 0.15 m × 0.1 m); (ii) soil surface covered with (1) vegetation with an average height of 0.15 m, (2) vegetation with an average height of 0.1 m, and (3) vegetation with an average height of 0.05 m. The paved surface and the vegetated surface had a slope of 20% (≈11.3°) and 25% (≈14°), respectively.
To guarantee that all field experiments on vegetated surfaces would be conducted for the same conditions of soil, slope and type of vegetation, a test area was selected and a scissor was used to cut the vegetation to the defined average height (Figure 4). This process does not disturb the soil surface. Within the measuring frame, the percentage coverage of the soil surface by the vegetation was calculated by the same method applied for estimating the mulch coverage (Section 2.1). The soil in the area where the field experiments were conducted has a loamy sand texture [36].
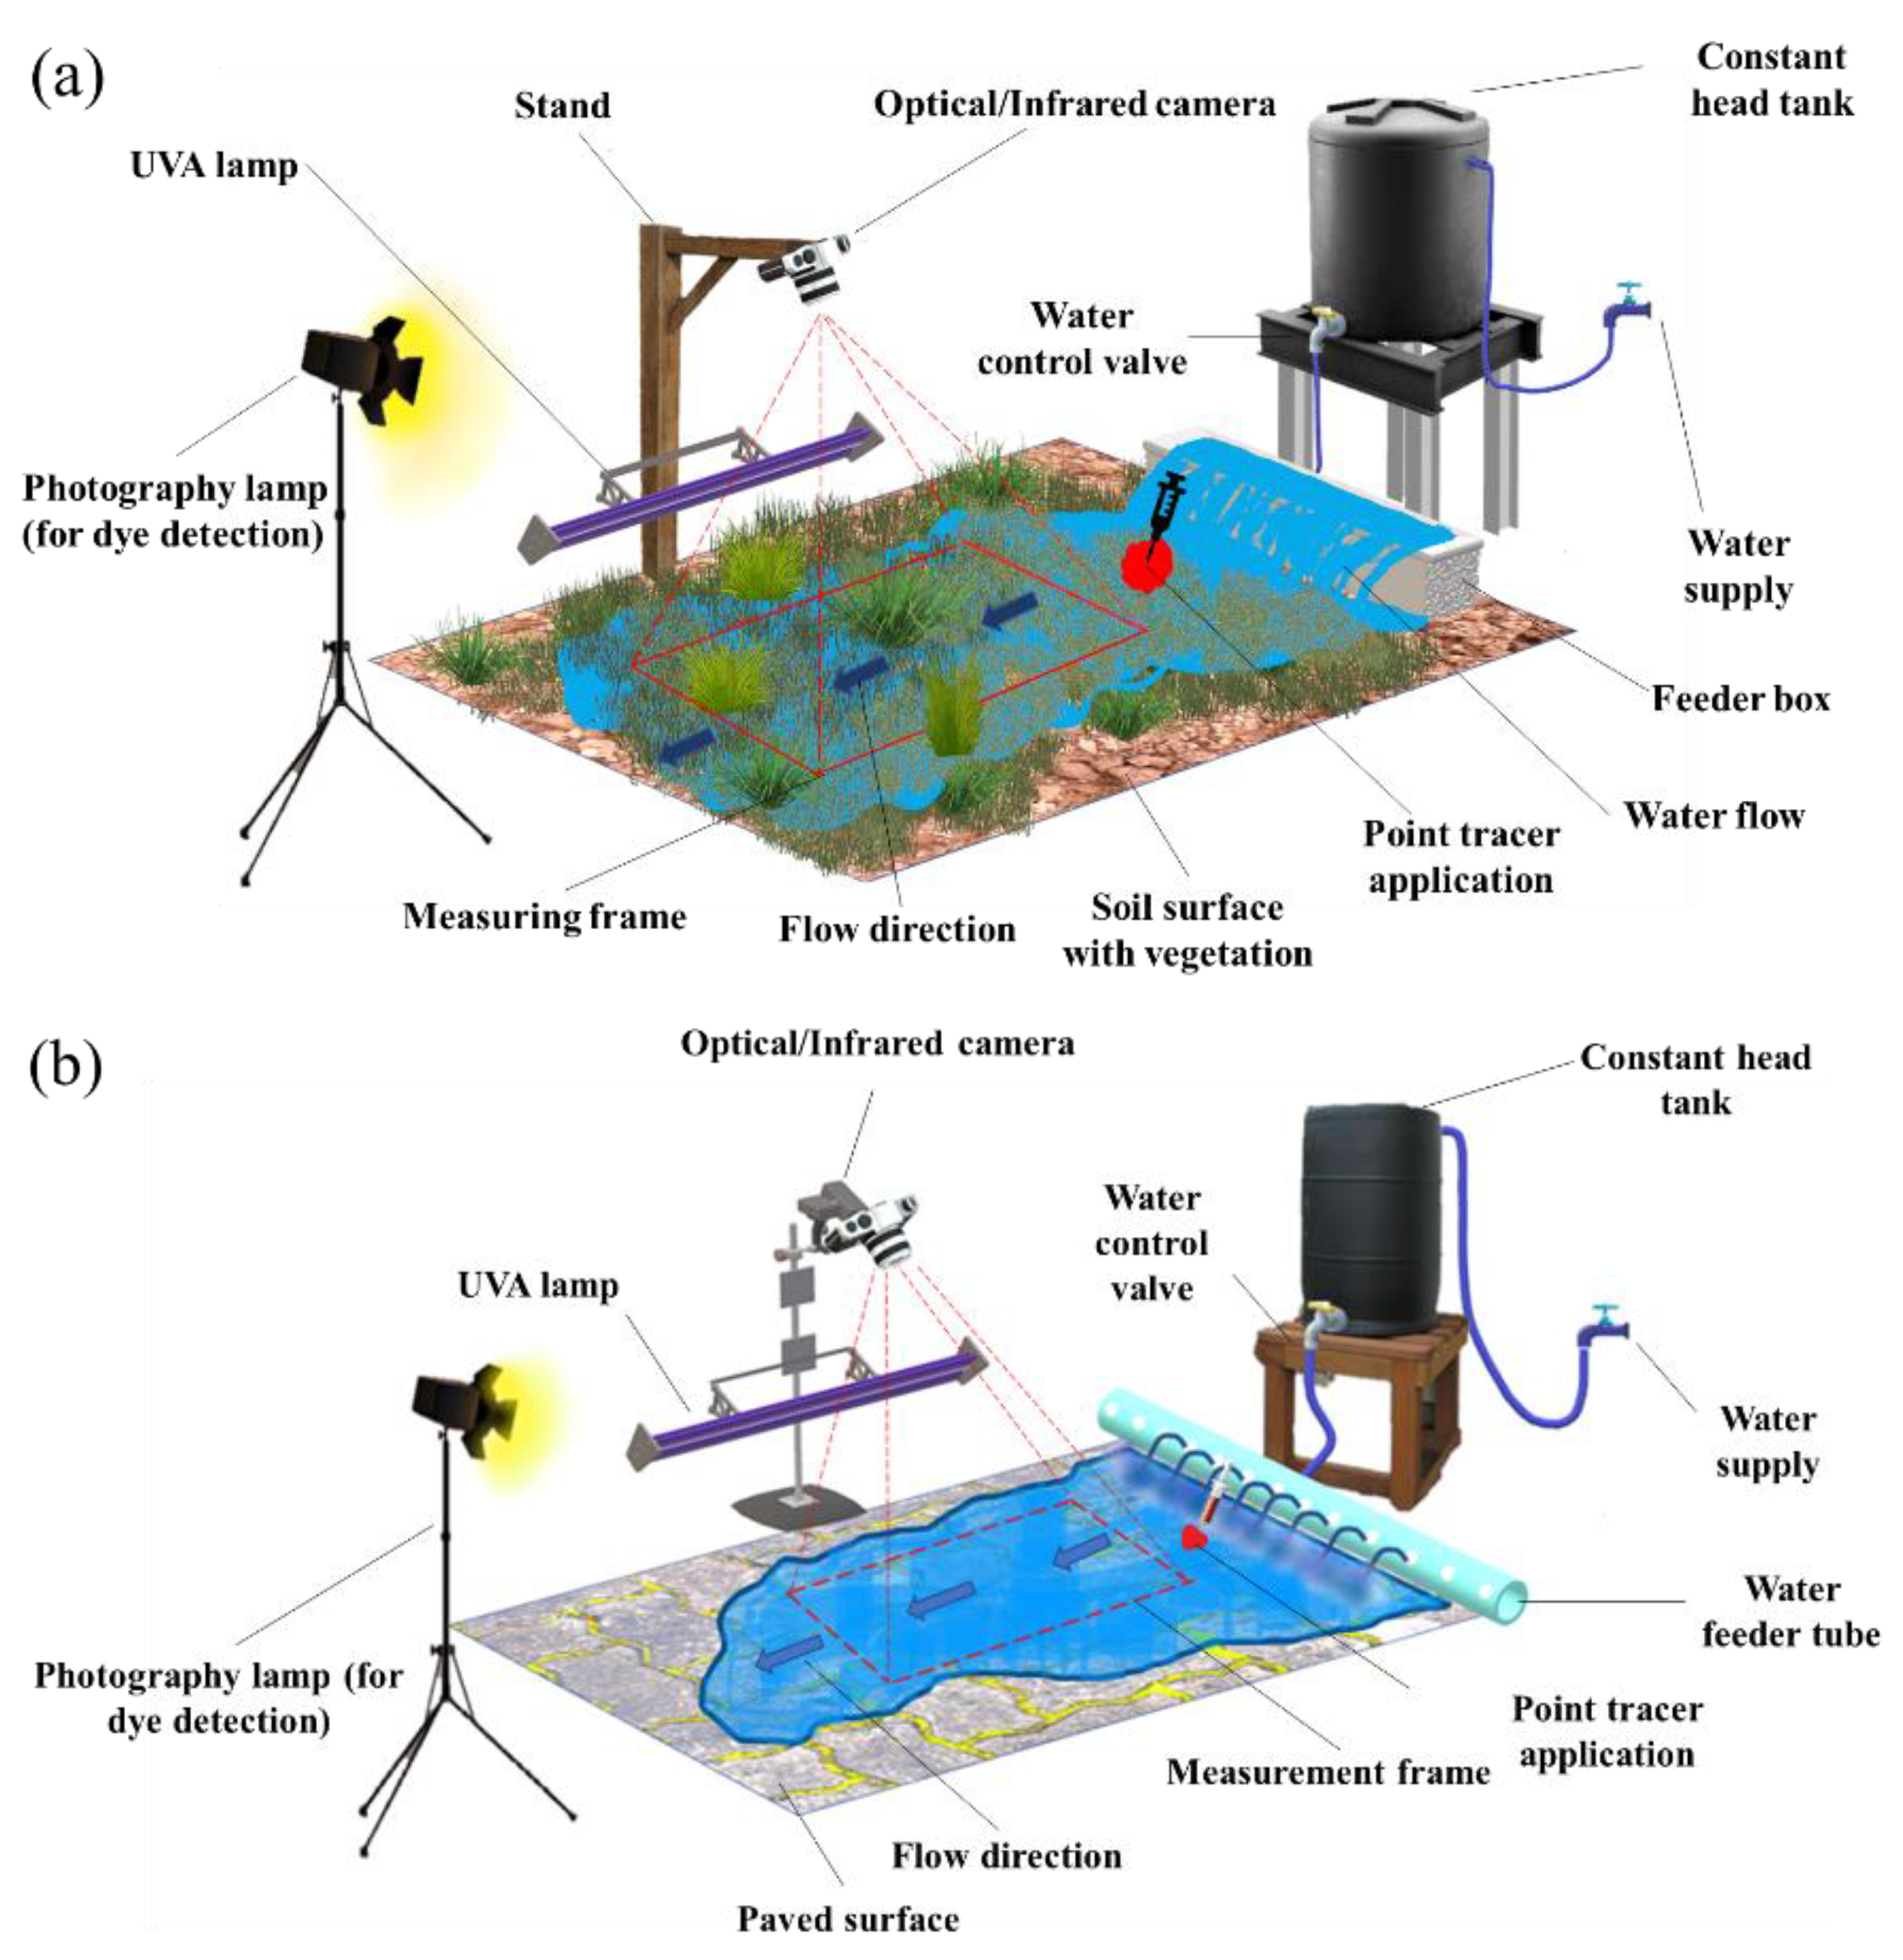
In this field setup, a surface water supply system was installed 0.5 m upslope of the measuring frame (Figure 2). The system was connected to a tap, allowing the application of a known constant flow over the measuring frame: ≈0.21 L/s for the paved surfaces and ≈0.4 L/s for the vegetated surfaces. Two parallel wooden bars, deployed along the flow direction and distanced 0.3 m from each other, were used to guide the water flow through the measuring frame. To detect the quinine tracer, the same type of ultraviolet lamp used in the laboratory (Section 2.1) was used outdoors. Additionally, during daylight, a removable tent (consisting of a simple structure supporting a black plastic) was used to cover the measuring system and shade the measuring frame; this was necessary to create darker light conditions, which allowed us to easily detect the quinine tracer during the day.

2.3. Tracers

In the experiments, three tracers were used for estimating the velocity of sheet flows. All tracers were applied in liquid form: fluorescent tracer, colour dye tracer, and thermal tracer. For all the experiments and tracers, the tracer volume added/injected into the flow was 10 mL. The procedures used to apply the tracers in the laboratory and field experiments and to estimate the flow velocities are described in Section 2.5 and Section 2.6, respectively.

2.3.1. Fluorescent Quinine

A quinine solution was used as a fluorescent tracer. Quinine is known as a bitter plant alkaloid, which is extracted from the cinchona tree and has been, and continues to be, used in medicine for treatment purposes (e.g., [37,38]) and in soft drinks. Recent regulations on the use of quinine as a food additive in beverages allow a maximum concentration of 83 mg/L in the US [39] and of 100 mg/L in the European Union [40].
Preliminary tests were carried out to ascertain the concentration of quinine in water to be used as a tracer. It is well known that tonic water glows under UVA light with a vivid blue colour due to the fluorescence of quinine, so the tests were started using a concentration of quinine in distilled water of 100 mg/L, which is close to the concentration found in tonic water. However, the solution fluorescence is strongly dependent on pH, with even a small difference in the pH making a difference in its glow. Thus, as the pH of the solution affects the fluorescence [41], hydrochloric acid (HCl) was used to prepare different solutions (i.e., solutions of different pH and quinine concentrations) and determine which would exhibit the strongest glow. This was found for quinine solutions with a pH of 3.7 and a quinine concentration of 80 mg/L, thus, this was the combination used. For the experiments described in this paper, quinine in the form of monohydrochloride dihydrate 99% (ACROS Organics™) was used. This form of quinine has no ecotoxicological effects on the environment, and is not likely to be mobile in soil due to its low water solubility [42].

2.3.2. Colour Dye

For the colour dye tracer solution, a red food colouring (ingredients: carmoisine dye (E122), ponceau dye 4R (E124), yellow dye (E104) and acetic acid (E260)) was used once it had been diluted with tap water to a concentration of 20 mL/L.

2.3.3. Thermal

For the thermal tracer experiments, water was heated in a kettle to a temperature of approximately 80 °C. Prior to the addition of the tracer to the flow, the temperature of the water flowing overland was on average around 21.0 °C.

2.4. Video Recording Systems

Real and thermal video snapshots of the measuring frame were used to estimate the leading edge velocities of the tracer plumes. The visible wavelength videos were obtained using a 12.80 × 9.60 mm2 ISOCELL 2L2 (S5K2L2) CMOS sensor cropped to 4290 × 2800 pixels for the photographs, and 1920 × 1080 pixels for the video frames. The thermal videos were recorded using a FLIR DUO PRO R infrared camera (resolution: 336 × 256 pixels; accuracy: +/−5 °C or 5% of readings in the –25 °C to +135 °C range; spectral range: 7.5–13.5 μm). For all of the experiments, the cameras were deployed in fixed positions; however, the positions of the optical camera and the infrared camera were different, in order to capture the same measuring frame. Both cameras were attached to a metal support structure and fixed, respectively, at 0.65 m and 1.5 m (in the laboratory) and 0.65 m and 2.0 m (in the field) above the soil surface (Figure 1 and Figure 2) with the sensors of the cameras parallel to the soil surface.
The infrared video camera produces a 2D visual image by detecting the invisible (to the human eye) infrared energy emitted from the water and wet soil surface. Considering that the imaging scale of the infrared camera is based on the temperature emissivity coefficients of the materials, and that the water and wet soil emissivity coefficients are very similar (maximum of 15%), for the working spectral range of the infrared camera, it can be assumed that the associated errors are negligible [9,29].
During the indoor and outdoor experiments, at twilight and night, a lamp (40 W incandescent light bulb) allowed us to visualise the dye tracer, whereas to visualise the fluorescent tracer, it was essential that we used an ultraviolet (UVA) lamp (Section 2.1) installed beside the flume and the field experiment setup. For experiments conducted during the day, the installation was covered with black plastic to create darker light conditions and improve the visibility of the quinine tracer when exposed to UVA light.

2.5. Experimental Procedure

In the laboratory and field experiments, the three flow velocity tracer techniques (Section 2.3) were tested for the same soil/surface, slope gradient, and discharge conditions, for all types of surface identified in Section 2.1 and Section 2.2 (i.e., bare, mulched and vegetated soil surfaces and paved surface). Over each surface, during the measurements, the flow was driven by the upslope surface flow feeder system. The discharge was measured using the volumetric method at the downstream outlet of the flume in the laboratory and at the upstream inlet in the field experiments. The topsoil was dry at the beginning of the tests but, prior to the measurements, the flow was left to run over the surface for a few minutes (about 15 min) to wet/saturate the surface; this ensured the establishment of a steady-state flow. In this condition, since the time of each tracer application test lasted a very short time (10–12 s, which is related to the movement of each tracer plume within the measuring frame), the error of having lateral or vertical infiltration interrupting the steady-state flow was expectedly very low.
In the laboratory experiments, in order to avoid soil surface erosion, a small amount of hydraulic cement (Portland cement) was spread over the surface and left to dry before starting the experiments. In the field experiments, the presence of dense rooting of the vegetation and small stone obstacles prevented soil erosion.
Optical and infrared video cameras (Section 2.4) were used to assess the movement of the tracers added to the flow. The tracers were applied at a specific point of the surface flow with the help of a syringe (Figure 1 and Figure 2). To minimise the interference of the injected tracer’s volume (10 mL) in the surface flow velocity measurements, the tracers were applied approximately 0.2 m upslope of the measuring frame. Measurements of the movement of the tracer plumes across the measuring frame were recorded (three replicates) in separate videos (i.e., optical and infrared videos) for each tracer type and experimental setting (flume or field surface). The conducting of three replicates per experiment applies to both the laboratory and field experiments and the different tracers and surface classes.
The field experiments were conducted on separate days for each surface (Table 1), during (a) day, (b) twilight and (c) night conditions. The twilight measurements started about 5 min after sunset and finished before 30 min after sunset. The day and night measurements were completed, respectively, 1 h before and 1 h after sunset (Table 1).

2.6. Velocity Estimation Method

The leading edge velocity of the tracer plume was assessed based on the analysis of the video snapshots of the measuring frame, as illustrated in Figure 5. The two snapshots corresponding to the instants when the leading edge of tracer plume was arriving (t0) and leaving (t1) the measuring frame, respectively, were identified, as well as the time lapse between them. These snapshots are superimposed in Figure 5. Thus, by tracking the leading edge of the tracer, the surface velocity (Vtr) of the flow was estimated based on its travel distance (L) and travel time (t1t0).
In overland sheet flows the velocity is not uniform. The flow moves faster on the surface of the water column, and consequently, the tracer will arrive at the end point of the measuring frame faster [8]. Thus, the surface velocity is always higher than the mean velocity of the flow.
The mean flow velocity can be calculated from the volumetric method by measuring the flow depth and discharge, as in Equation (1) [17]. However, it can be challenging to measure very small water depths in sheet flows [43].
U = Q h b
where U is the mean flow velocity (m/s), Q is the discharge (m3/s), h is the water (flow) depth (m), and b is the flow width (m). The flow width was considered equal to the flume width in the laboratory experiments (Section 2.1) and to the measuring frame width in the field experiments (Section 2.2).
Assuming that the flow surface velocity is known, which can be approximated by the leading edge velocity of the tracer plume (Vtr), the mean flow velocity in a water column can also be estimated by applying a correction factor (α) to the surface velocity (e.g., [9,12,17,24,25,44,45,46,47,48]):
U = α V t r
There have been numerous studies estimating α or mean overland flow velocities on various soil surfaces conditions using the dye tracing method. However, no significant research has been conducted to explore this issue on mulched, vegetated or paved urban surfaces. In the present study, three different tracers have been used to evaluate flow velocities on these types of surfaces; however, since all tracers have almost the same density, the effect of the tracer density on the estimation of the correction factor was ignored. Moreover, it is expected that the type of surface (mulched, vegetated or urban paved surfaces) could also affect the estimation of α, but a detailed study of such impact goes beyond the scope of this study. The main objective of this study was to evaluate the applicability of quinine as a fluorescent flow velocity tracer for different experimental conditions, in comparison with the traditional dye tracer method and the more recent thermal tracer method, and not to conduct a detailed study on estimating the correction factor α. For this reason, no attempts were made to estimate the correction factor values for each particular case based on experimental data; instead, α was estimated based on results reported in recent studies under approximately similar conditions. Considering the range of discharge, slope and Reynolds number calculated in this study, Equation (3), which was suggested by Zang et al. [24] for sediment-free surfaces, was used to estimate α.
α = 0.003 0.133 log S + 0.168 log R e
where S is the slope gradient (m/m) and Re is the Reynolds number.
The Reynolds number was calculated as:
R e = q ρ μ
where q is the unit discharge of the flow (m2/s), ρ is the density of the fluid (kg/m3) and μ is the dynamic viscosity of the fluid (Pa.s).

2.7. Image Processing Method

The MATLAB image processing toolbox was used to analyse the video frames. For comparing the quality of the visualisation of the fluorescent and dye tracers, the relative luminance (Y) of the tracers and contrast ratios (C) were determined. For any colour space image, Y is known as the relative luminance of a certain point (or pixel). The relative luminance is described by normalised values that range from 0 for the darkest (black) colour to 1 for the brightest (white) colour, and can be calculated by the following equation [49,50,51,52].
Y = 0.212 R 1 + 0.715 G 1 + 0.0722 B 1
where R1, G1 and B1 (RGB1) refer to the linear values of the standard RGB colour space (sRGB), which can be computed by [50]:
sRGB = { R ,   G ,   B } 8 bit / 225
Then, the following is applied:
RGB 1 = sRGB / 12.92 ,   if   sRGB 0.03928
RGB 1 = ( ( sRGB + 0.055 ) / 1.055 ) 2.4 ,   if   sRGB > 0.03928
The quinine tracer can only be visualised in dark light conditions (Section 2.3), thus the relative luminance Y of the quinine tracer plume is higher than the surrounding colours, in the measuring frame. These dark conditions lead to a better visualisation of the tracer plume, whereas for the dye tracer the opposite is verified. Since the dye tracer is darker than the soil surface and mulch, lower values of Y in bright conditions have better visual results. Therefore, to have comparable results between the two tracers, the contrast ratio for both tracers was calculated. Contrast defines the difference in luminance between two colours. The Web Content Accessibility Guidelines (WCAG) recommends Equation (9) for calculating the contrast ratio C between foreground and background colours [50].
C = ( Y 1 + 0.05 ) / ( Y 2 + 0.05 )
where Y1 and Y2 are the relative luminance of the foreground and background colours (Y1 > Y2). Contrast ratios can range from 1 to 21.
Figure 6 illustrates the definition of the total area of the measuring frame (AT), the tracer’s plume area at each time step (Atr), the background colour (for the estimation of average relative luminance Y2 of the background colour) within the measuring frame, and the cross-section A–A that was used to study the Y of the tracer (quinine and dye) along a transect transversal to the flow direction. In general, the cross-section A–A is associated with the pixel that exhibits the highest tracer Y at each time step; the contrast ratio of the tracer (quinine and dye) is also determined for the same cross-section. This study considered a time step Δt = 1 s for selecting images that show the movement of the tracers.
For the thermal videos, the FLIR Tools® thermography software was used to import, edit and analyse thermal images [53].

3. Results and Discussion

3.1. Laboratory Experiments

Examples of snapshot images obtained during the laboratory experiments for the bare soil and mulched soil surfaces (for different mulch cover levels) are shown in Figure 7, illustrating the differences between the quality of the visualisation of the fluorescent (quinine), dye and thermal tracers. For runoff over the bare soil and mulched soil surface, with mulch cover of 0.5 and 1 ton/ha, all tracers were observed clearly while they were moving downslope, after being injected into the flow; these soil mulching rates were found to cover a percentage area of the soil surface, respectively, 11% and 25%, for the conditions of the experiments. However, for the soil surface with a mulch cover of 2 ton/ha (area coverage of 48%), only the thermal tracer was visible. Thus, the thermal tracer was the only tracer that allowed us to acquire estimates of the flow velocities, despite the high coverage of the soil by mulch. Comparisons of the application of dye and quinine tracers to study the flow over mulched soil surfaces (0.5 and 1 ton/ha mulch) showed that the quinine tracer had slightly better visual results for the tested conditions.
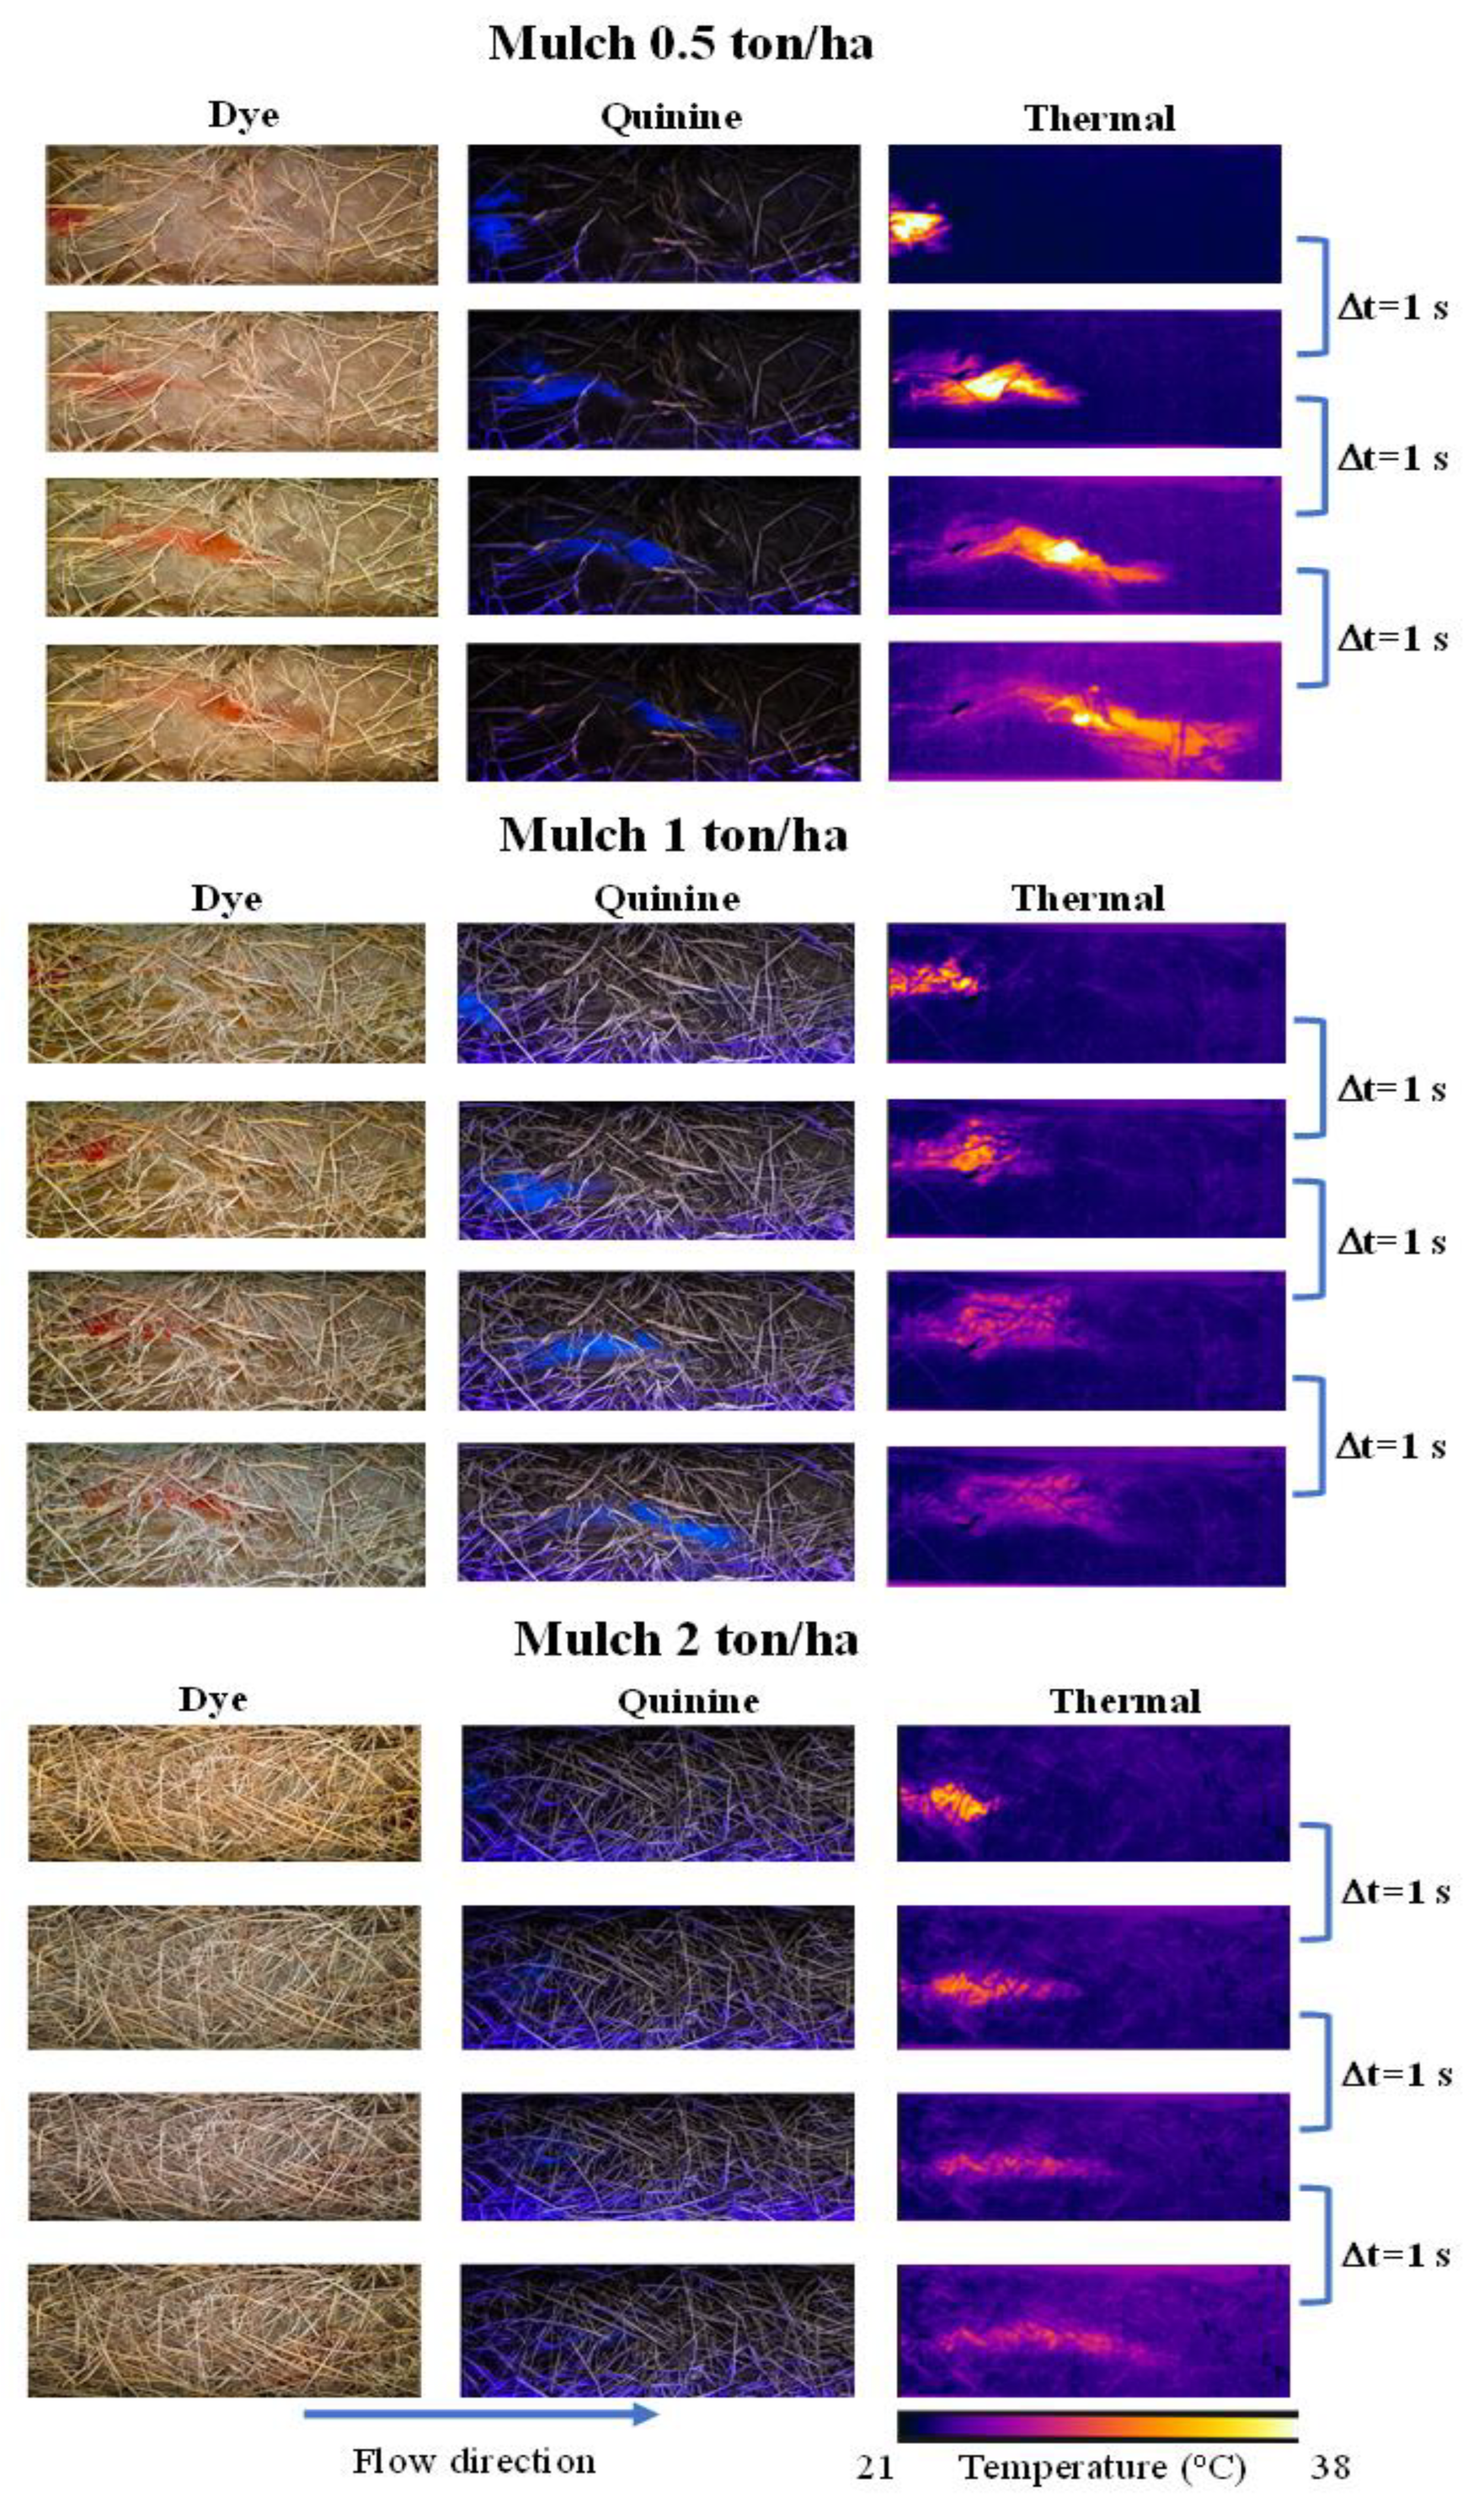
Examples of chronological sequences of images (time lapse of 1 s) of the measuring frame showing the movement of the different tracers are presented in Figure 8. All mulch soil cover levels tested are represented in Figure 8. The thermal tracer leading edge movement is better shaped in all mulch cover levels when compared to the other tracers. For the soil surface mulch cover level of 2 ton/ha, the dye and the quinine tracers did not show reliable results (due to poor visibility of the tracers caused by the presence of the mulch) for estimating flow velocities over the soil surface. However, the quinine tracer plume leading edge movement is better defined and better shaped compared to the dye tracer plume, and the tracer does not leave any mark or residue in the measuring frame. In the images captured for the quinine tracer, despite the dark environment (Section 2), the mulch can be clearly seen, which is due to the fluorescent light reflection over the wet mulch.

3.2. Field Experiments

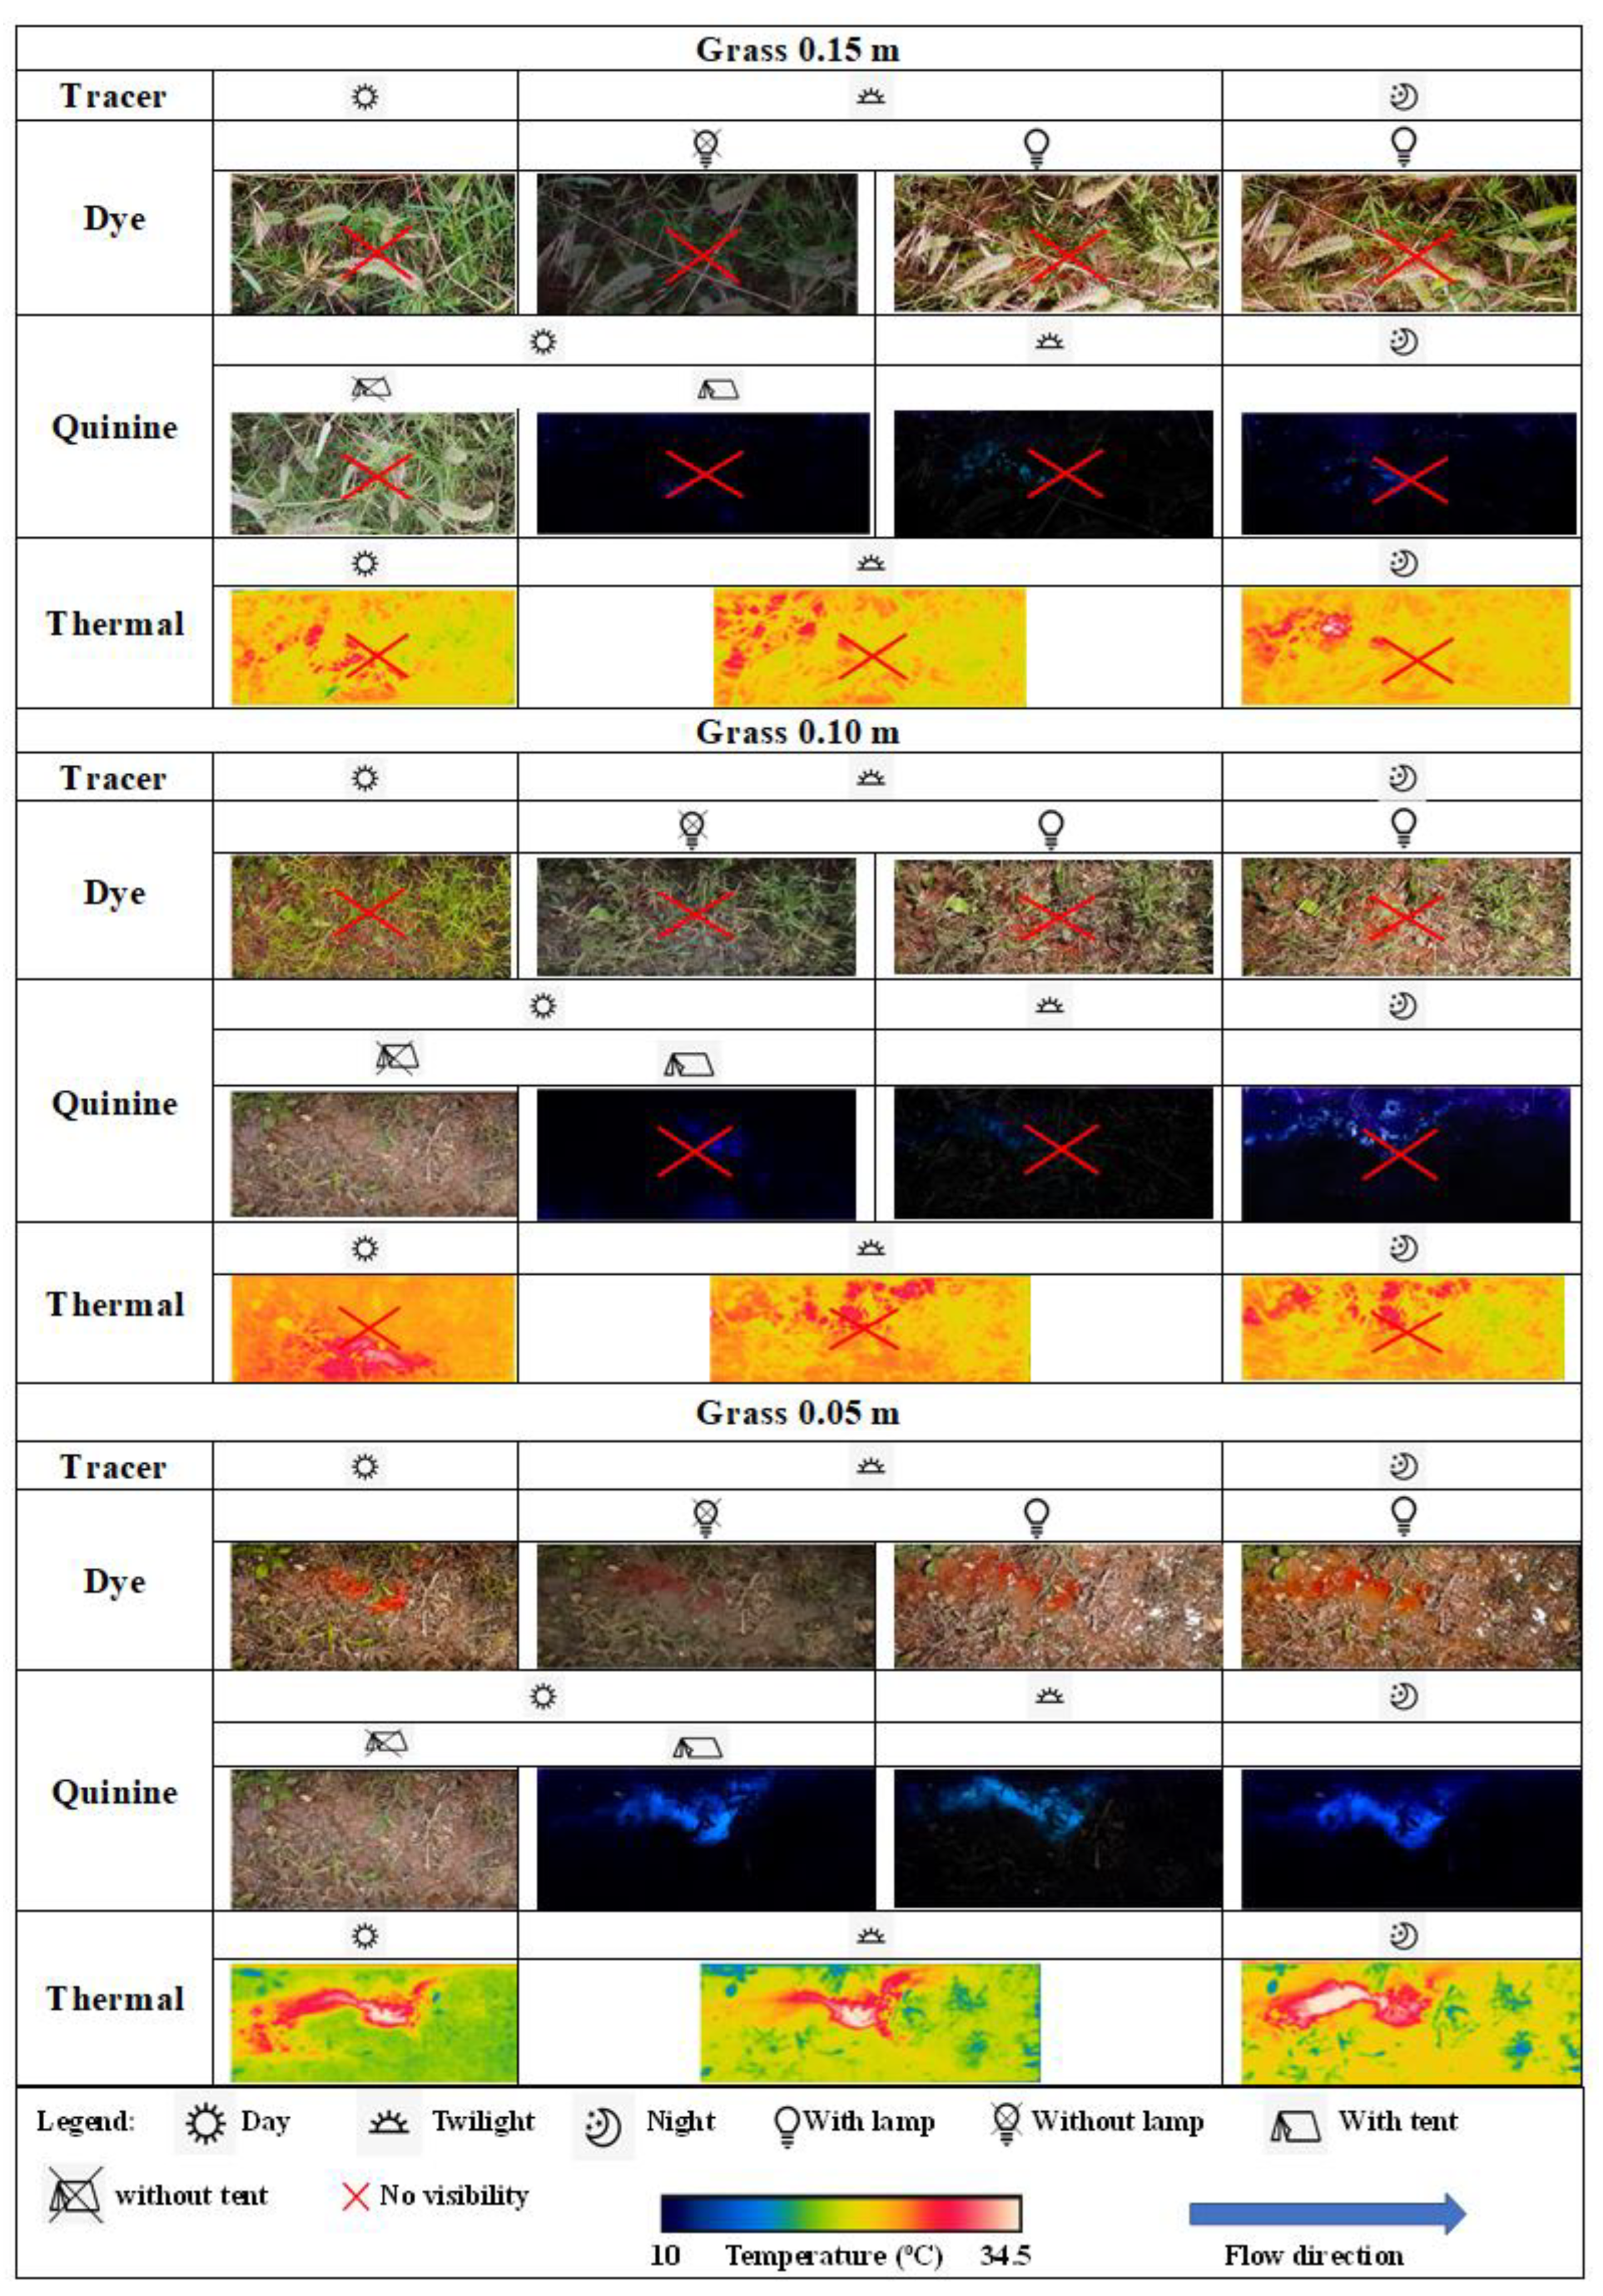
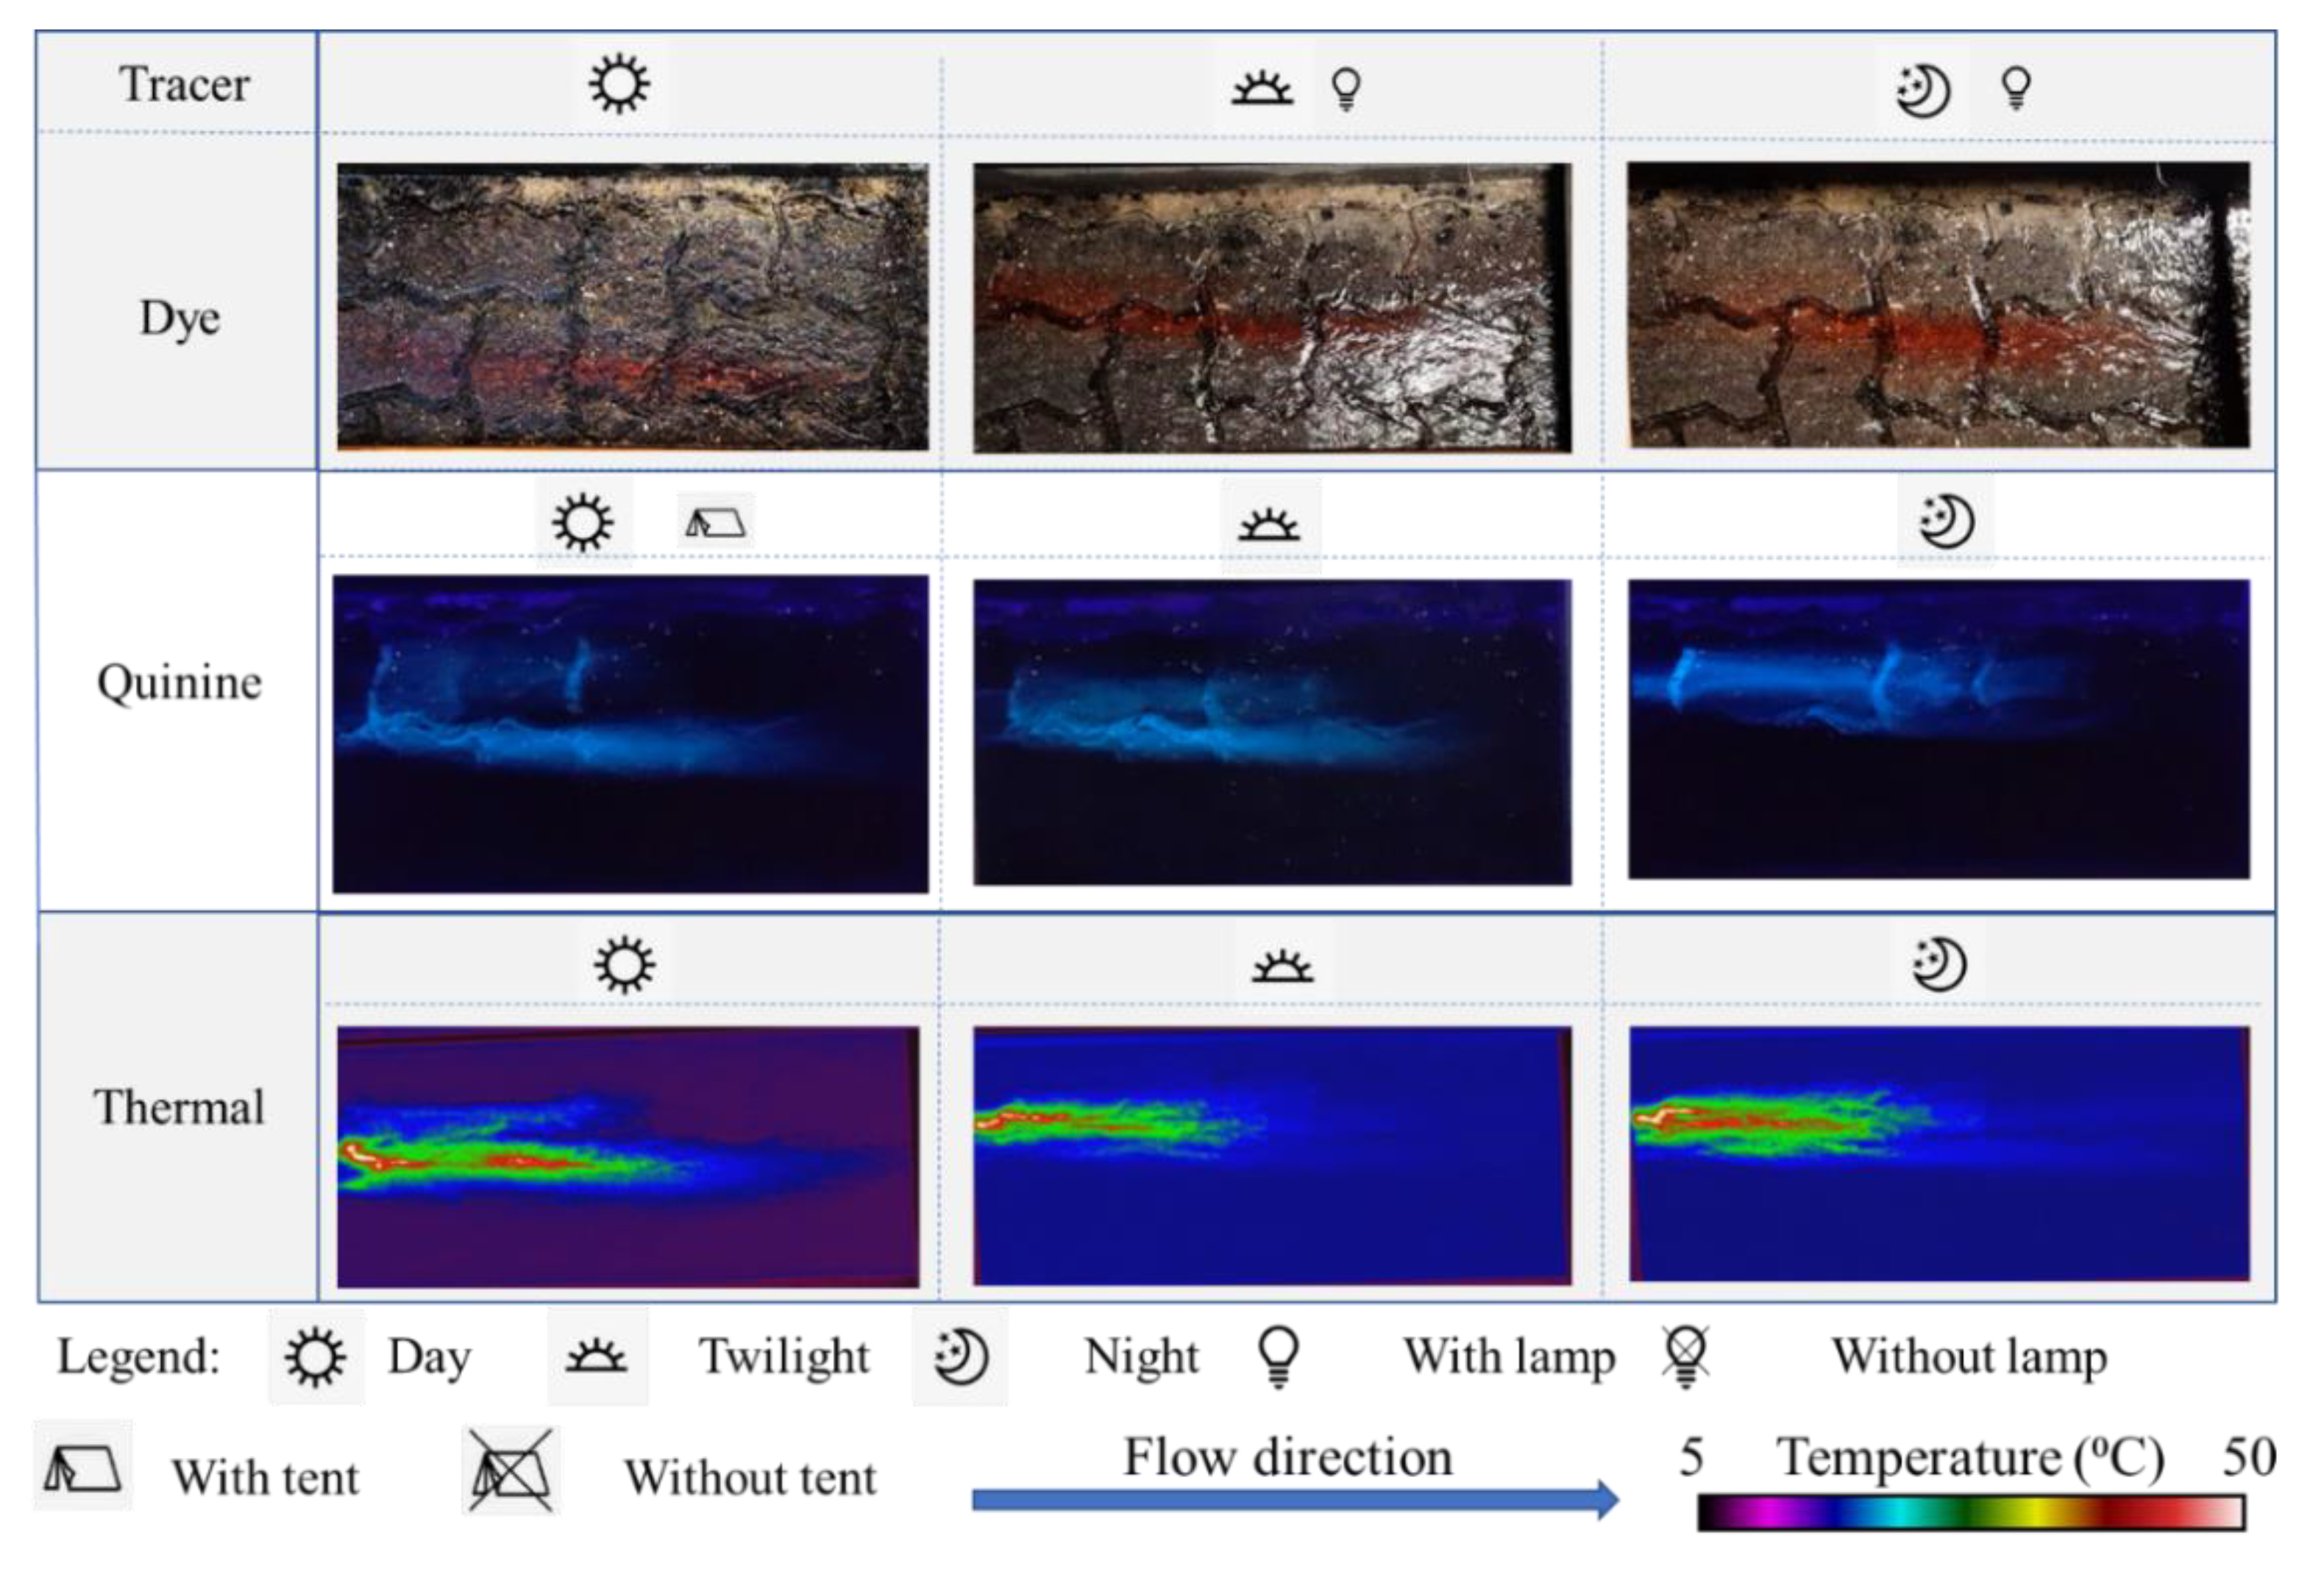
The differences between the fluorescent (quinine), dye and thermal tracer video snapshots and the results obtained for the vegetated soil and paved surfaces (field experiments) are illustrated in Figure 9 and Figure 10, respectively. The quality of visualisation of the tracers over different surfaces and lighting conditions is illustrated in these images.
For the vegetated surfaces with high (i.e., taller) vegetation cover (height of 0.15 and 0.10 m), neither of the tracers were clearly visible. The reason is because the dye and quinine tracers hide under dense vegetation canopies and shades and could not be captured by the cameras. Additionally, the thermal tracer (hot water) is not traceable under tall vegetation covers because the infrared camera detects instead the temperature of the grass/vegetation covering on the surface and flow water. However, over the soil covered by vegetation of 0.05 m of height and over paved surfaces all tracers were visible. By comparing the tracers in different light conditions, it can be stated that: (i) during the day, the quinine can only be seen if the ambient light is dimmed (e.g., if a removable tent is used to conduct the observations) and UVA light is available; (ii) the dye is well observed during the day whereas during the twilight and night time it is necessary to use artificial lighting systems; (iii) the thermal tracer has no lighting restrictions and can be used during day or night.

3.3. Comparison of Flow Velocity Estimates

The values of the estimated Reynolds number (Re) and correction factor (α) used to obtain mean velocities from the tracer plume leading edge velocities are presented in Table 2 for flow over a soil surface with vegetation of 0.05 m height. As explained, no results could be extracted from the images of the flow over soil surfaces with vegetation of 0.10 m and 0.15 m height (Figure 9).
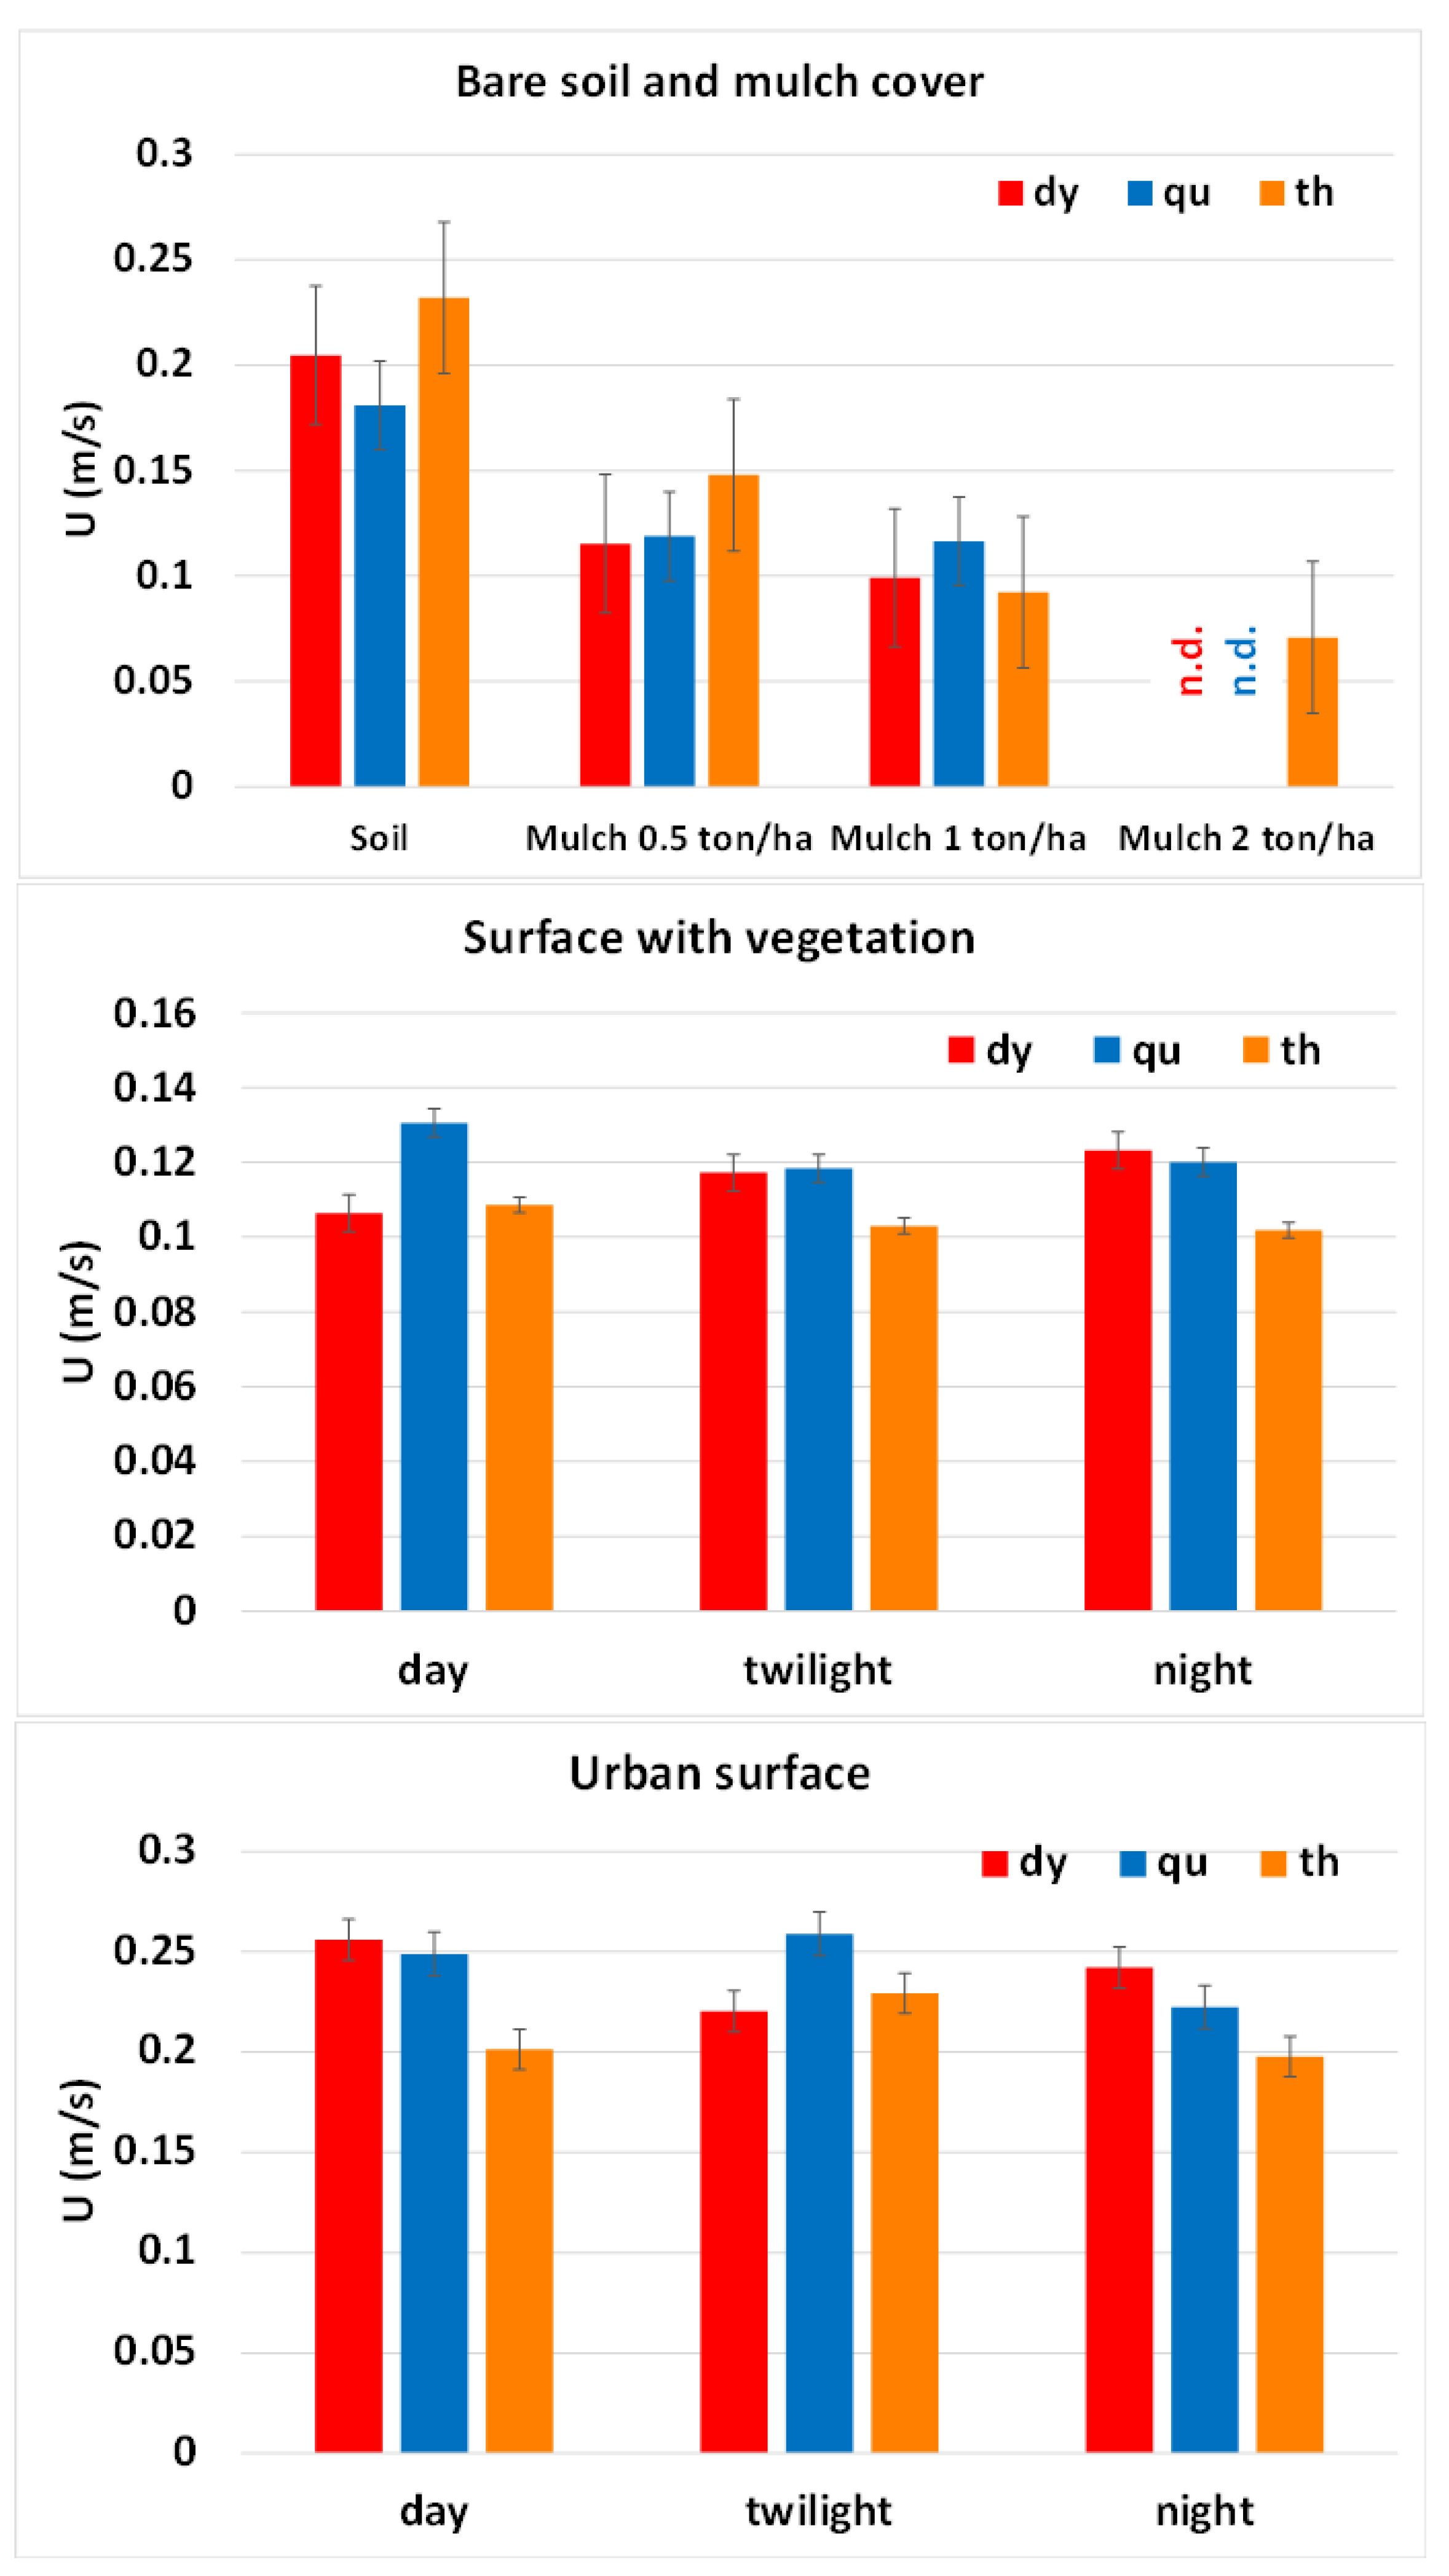
The mean flow velocities (U) obtained by applying Equations (2)–(4) (see Section 2.6) to the data obtained from the laboratory and field experiments are presented in Table 3 for three experimental replicates; the mean and standard deviation (S.D.) for the three replicates are also shown. These results, which were obtained for the three tracer techniques, are plotted in Figure 11.
For all surfaces (bare, mulched and vegetated soil, and paved surface), and for comparable light conditions, flow discharge and volume of tracer used, Figure 11 shows that the mean velocities (U), estimated by all tracer techniques (dye, quinine and thermal), are similar. Nevertheless, our results suggest that, overall, by increasing the amount of mulch (from bare soil up to 2 ton/ha of mulch), the overland flow velocities decreased. This is because, for the sheet flow depths observed, the hydraulic roughness increases with increasing mulch density, which leads to lower velocities. For the mulch cover of 2 ton/ha, the dye and quinine tracers were not visible; therefore, data (n.d.) are not available for this case.
For the field (vegetated and paved surfaces) experiments carried out during the day, since daylight is not favourable for visually detecting the quinine tracer in the flow, a removable tent was used to shade the quinine tracer experiment setup and potentiate the glow of quinine when exposed to UVA light. On the other hand, during low and dark light conditions (twilight and night) it was impossible to visualise the dye tracer unless an artificial light was used.

3.4. Comparison of the Tracer Visibility

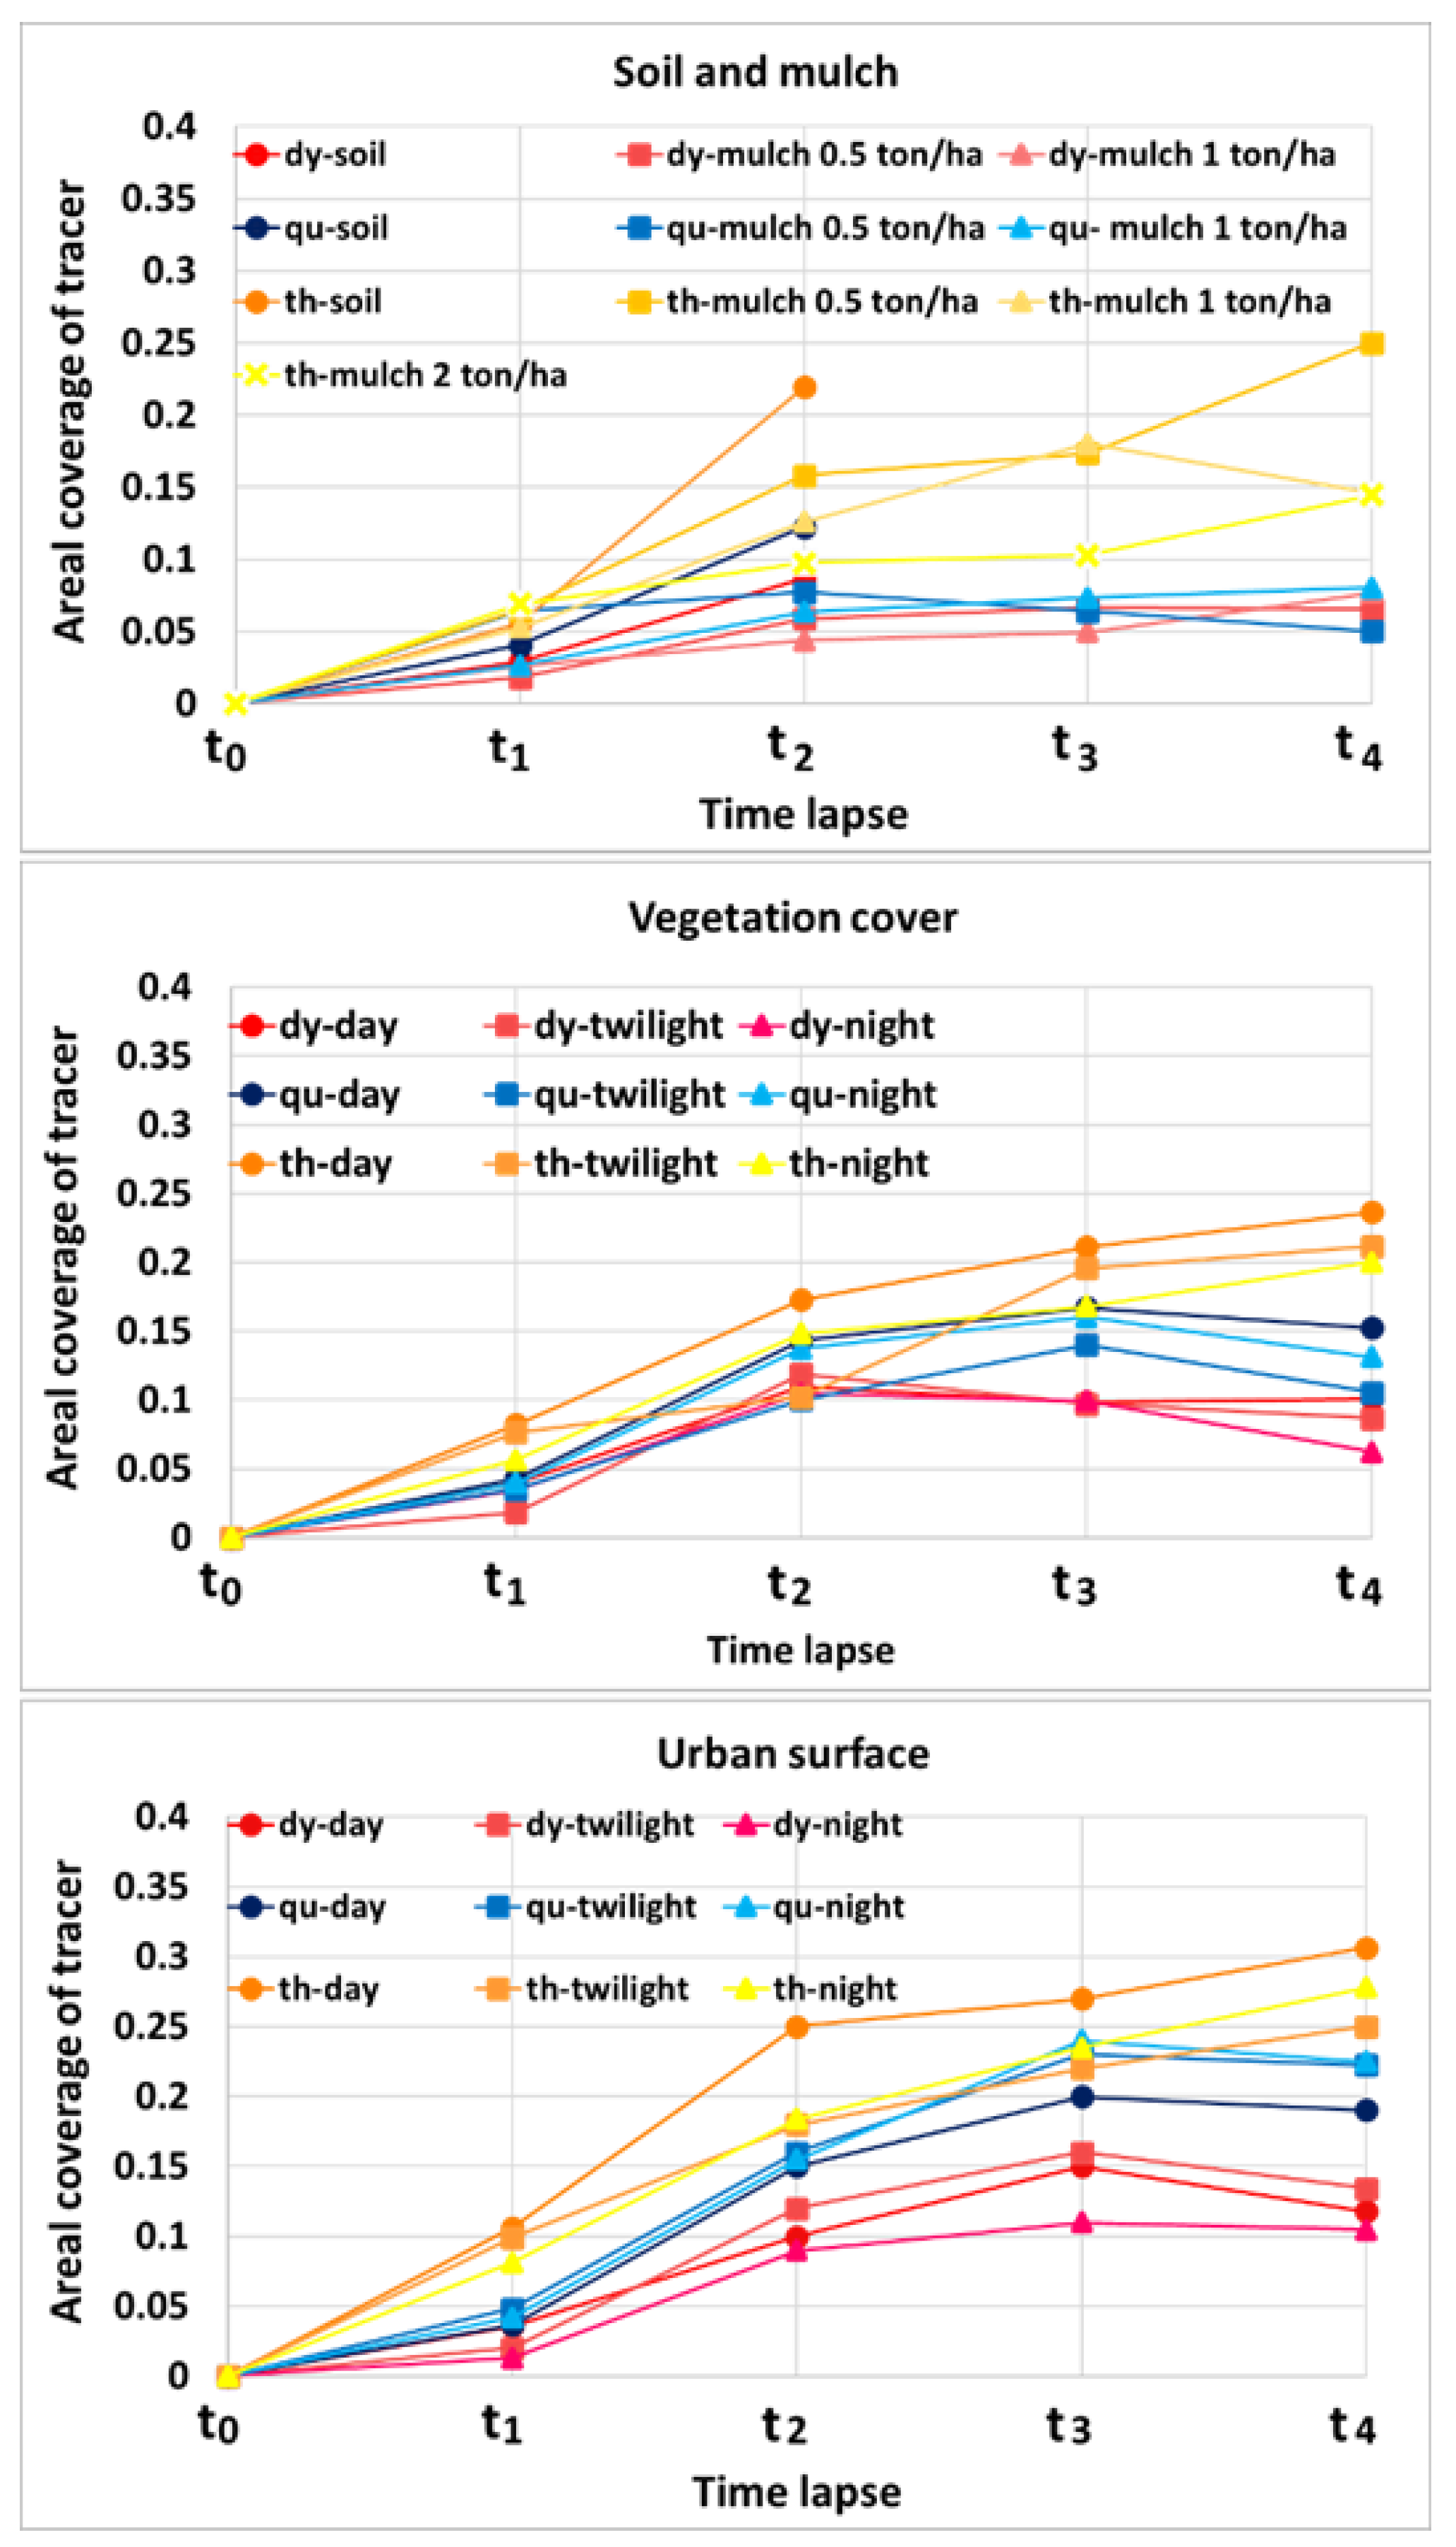
To further explore the outcomes from the different tracer experiments, the areal coverage of each tracer’s plume within the measuring frame (horizontal projection; see Figure 5 and Figure 6) was plotted over time, for time steps Δt = 1 s (Figure 12). In Figure 12, the results for each surface type/condition are plotted separately, to facilitate the comparison of results between the different tracers.
Figure 12 allows us to appraise the permanence of the injected tracer plume in the measuring frame and subsequently evaluate how much of the tracer is observed over time in that area (until the leading edge leaves the measuring frame). The tracer plumes can be well detected following the moment when the tracer is applied, i.e., while it has the maximum concentration in the overland flow (i.e., before tracer diffusion in the flow). During the time that the flow moves downstream through the measuring frame (due to diffusion and subsequent decrease in tracer concentration), it can be difficult to continue observing sharply the leading edge of the tracer plume, even before it leaves the measuring frame (which covers a travel length of 0.55 m and 0.60 m, respectively, in the laboratory and field experiments). In Figure 12, t0 is the time when the tracer is entering the measuring frame. During the time lapse from t0 to t4t = 1 s; thus, a time lapse of 4 s), for bare soil and mulched surfaces, the dye and quinine tracers have relatively similar results in terms of areal coverage. However, this figure shows that the area covered by the thermal tracer expands more due to thermal convection and diffusion. Owing to the remaining temperature difference between the thermal tracer plume and the flow, the tracer can still be well observed and tracked in the measuring frame. Nevertheless, because of the high diffusion of the thermal tracer, a greater volume of injected tracer can make it difficult to track the leading edge of the tracer. For the bare soil surface, after t2, the leading edges of all tracers had already left the measuring frame, which is due to the higher velocities over the bare soil surface (Figure 11). For vegetated and urban paved surfaces, the thermal tracer had the highest and the dye tracer had the lowest dispersion over the flow. This phenomenon might be due to the small differences in densities for all tracers; specifically, for the thermal tracer, heat convection can be another reason for higher tracer diffusion in the flow.
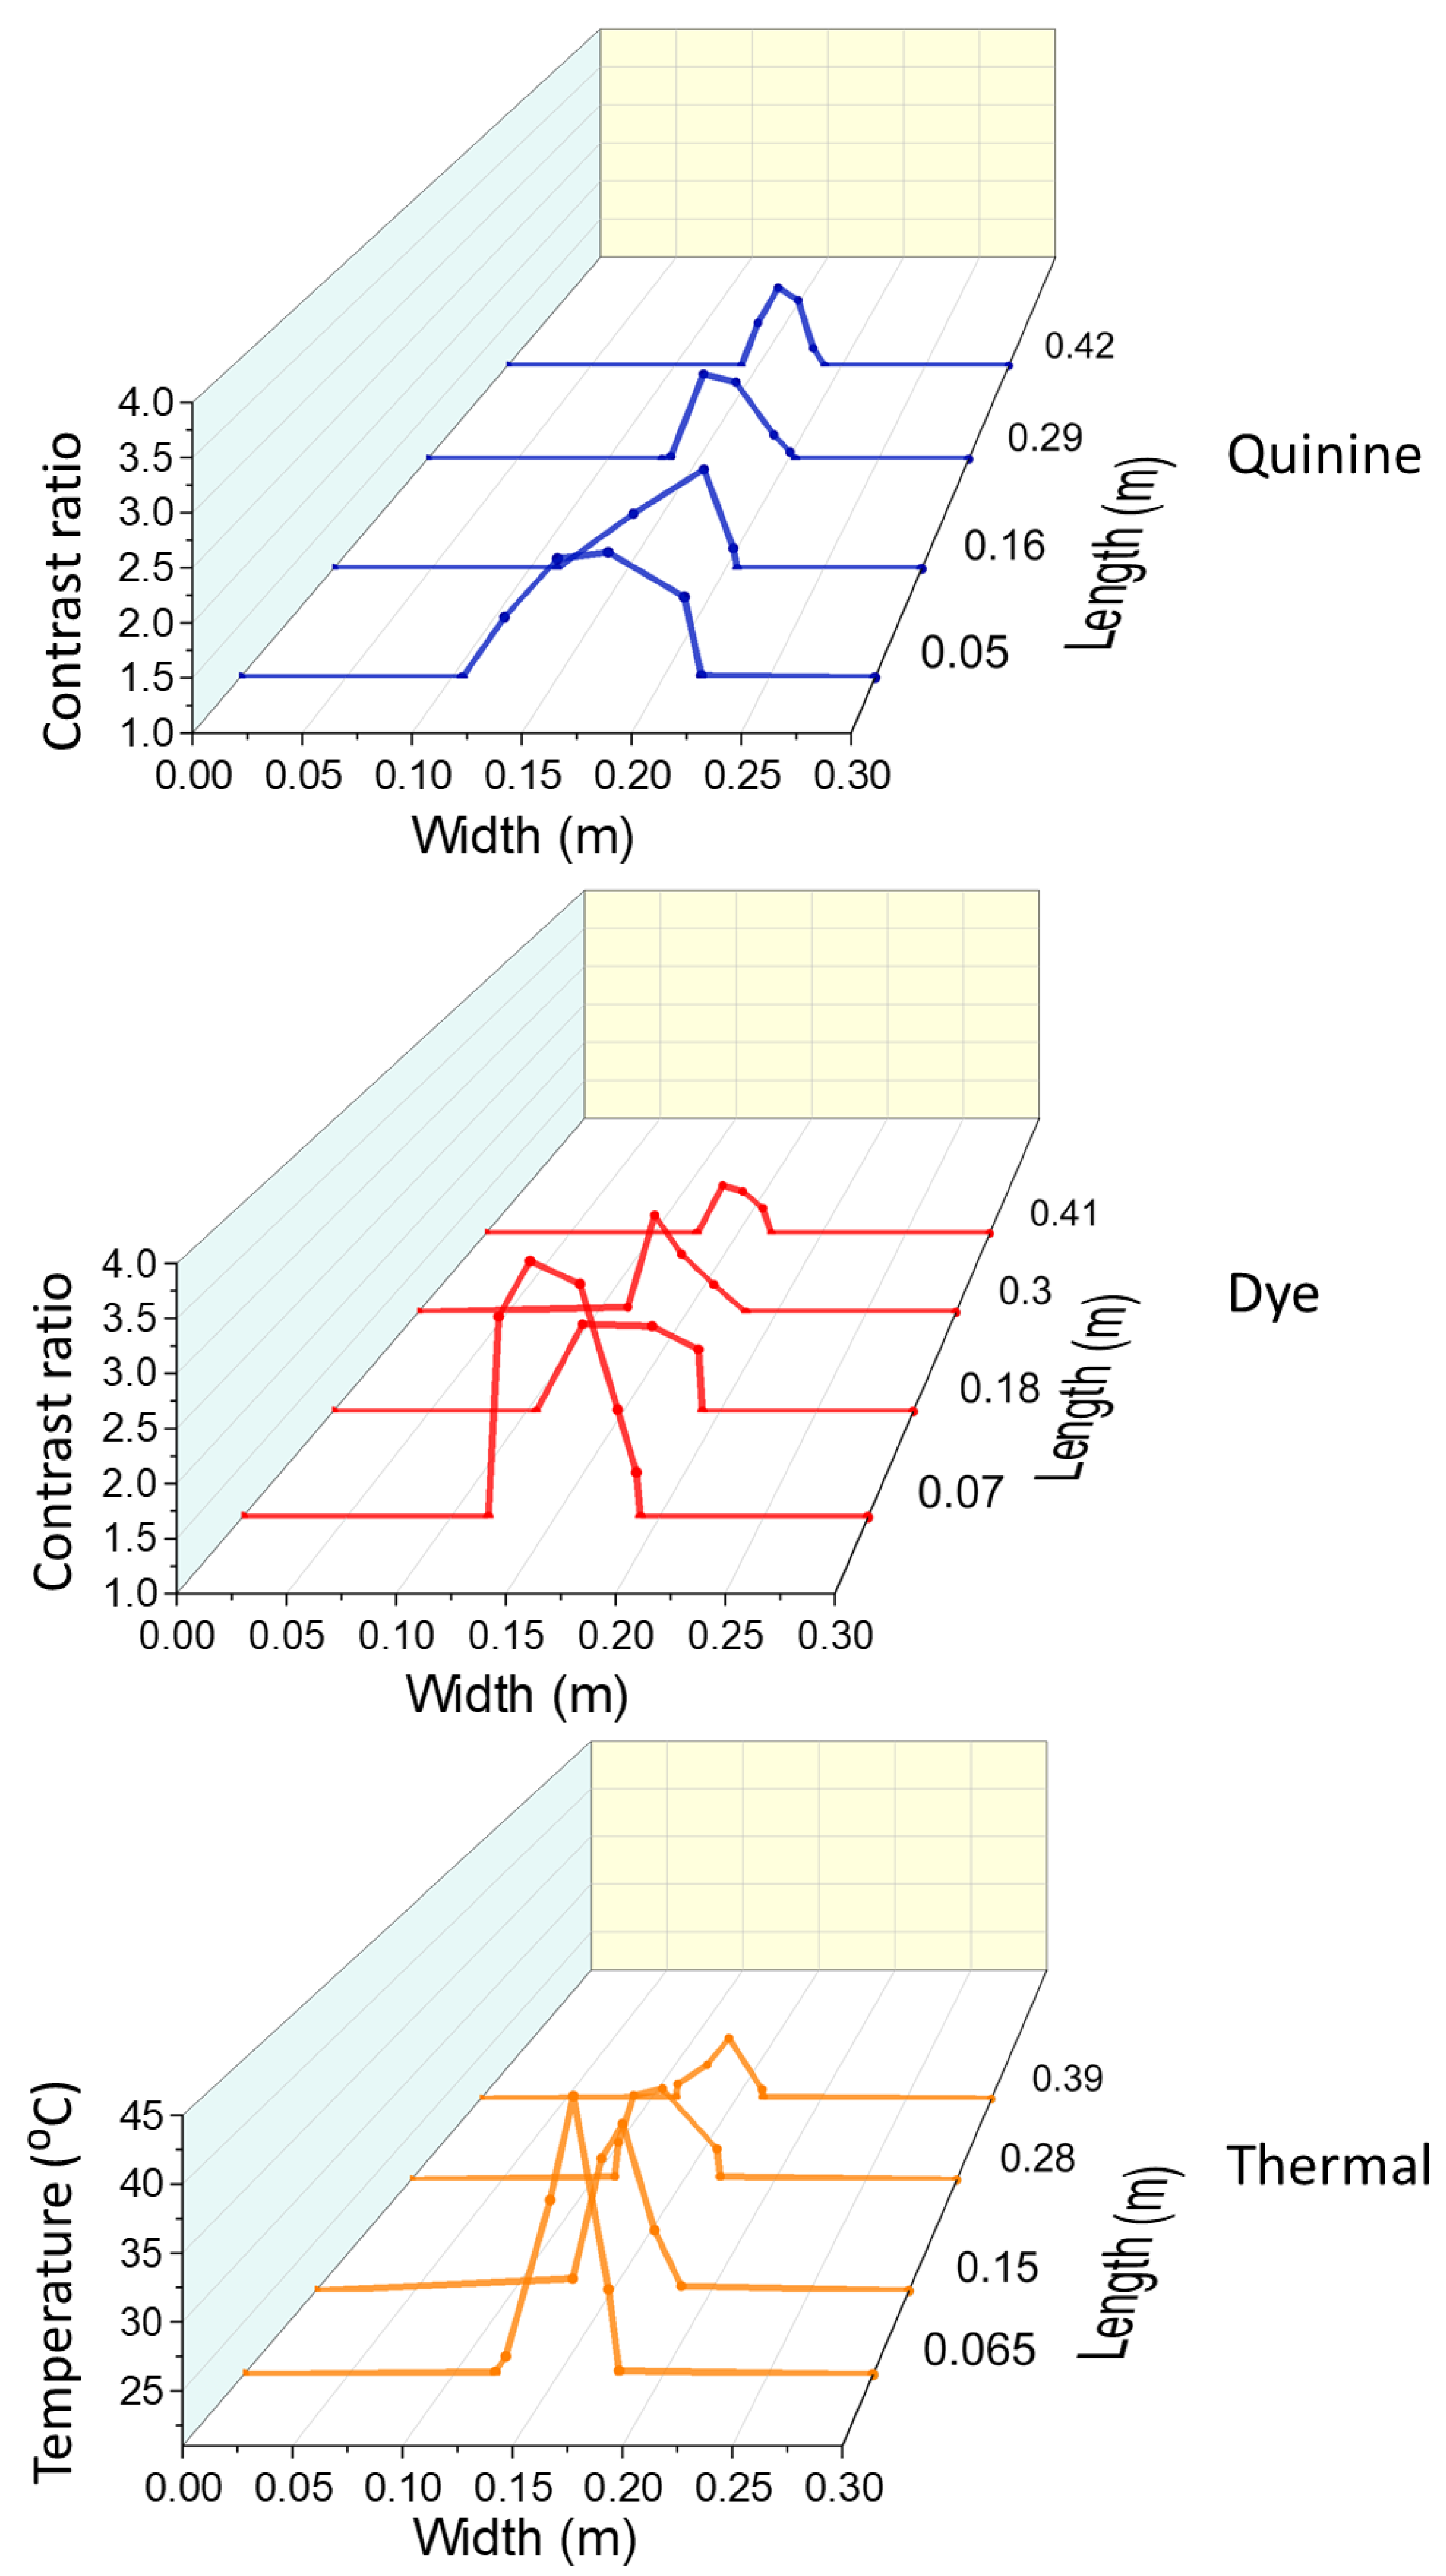
For the mulch surface cover of 0.5 ton/ha, Figure 13 shows plots of the relative luminance for the quinine and dye tracer and the temperature variation for the thermal tracer, at each time step Δt = 1 s, along the width of the measuring frame. As shown in Figure 6 and using Equations (5)–(8), at each time step Δt, the maximum relative luminance was detected, and the relative luminance (Y) along the defined cross-section was able to be plotted.
The “symmetrical” results of the relative luminance between the quinine and dye tracer, in Figure 13, are because of the colour differences in these two tracers. The relative luminance has a normalised value from 0 for the darkest (black) to 1 for the brightest (white) colour. The quinine tracer has a higher luminance at the beginning (closer to 1) due to the fluorescence characteristics of this tracer and it decreases over time (closer to 0), whereas for the dye it is almost the opposite. The dye tracer has a darker colour and, over time, as the dye tracer becomes dilute, its colour becomes lighter, resulting in an increase in the relative luminance value. Additionally, there is a difference in the luminance of the tracers and their background in the measuring frame. The quinine has a higher luminance than the background (almost black because of the shaded environment), and the dye has a lower luminance than its background (soil or mulch). Therefore, the contrast ratio can better explain the visualisation. The highest is the luminance difference between the tracer and the background colour, the greater the contrast ratio difference, which leads to a better visualisation. According to Figure 6 and Equation (9), the contrast ratio (C) was plotted for the same time steps (Figure 14). Since the contrast ratio of the tracers can be shown in the same graph, it enables an easier comparison between the visibility of the tracers.
Figure 13 and Figure 14 illustrate that both the Y and C, for the quinine and dye tracer, and the temperature, for the thermal tracer, dropped during the movement of the tracers over the surface, which is explained by diffusion and mass transport. The relative luminance values for the quinine tracer are smaller in comparison to the values estimated for the dye tracer because the quinine tracer has a blue colour whereas the dye tracer is red. According to Equation (5), the blue colour has less effect on relative luminance than the red colour component. For the quinine tracer, the relative luminance and contrast ratio decreased, respectively, by 22% and 11.87%, during the time lapse between t1 and t4, whereas, for the dye, these values are 78% and 58%. The decrease in the relative luminance and decrease in contrast ratio from t1 to t4 led to the lower visibility of the quinine and dye tracers. This larger difference in the visibility of the dye tracer in comparison with the quinine tracer highlights the quinine tracer’s capability of maintaining its visibility under UVA light, and therefore, to maintain its tracing features. Note that, for both tracers, favourable light conditions were provided during the experiments: the dye cannot be observed in dark conditions unless using an artificial light source, and the fluorescent tracer cannot be observed in bright light conditions unless using a tent or providing a dark environment.
Furthermore, the thermal tracer temperature dropped from 43 °C to 26 °C, which is close to the temperature of the surface (21 °C); thus, it is difficult to track the exact point of the leading edge of the hot tracer plume. Partly, this drop in temperature is explained by the very small amount (10 mL) of thermal tracer that was applied, in order to minimise flow disturbance. Hence, for the same time interval from t1 to t4, the fluorescent tracer seems to remain more visible than the dye and thermal tracer. In addition, the thermal tracer leaves a thermal mark spread over the surface that takes some time to fade due to the heating of the soil surface as the thermal tracer passes over it.
It is expected that the decay in relative luminance (or decay in contrast) is directly related to the tracer concentration (quinine and dye) in the flow, which results from the dispersion patterns caused by the sheet flow hydrodynamics. Additionally, Figure 12, Figure 13 and Figure 14 reveal that the fluorescent tracer plume expanded slightly more than the dye tracer. Nevertheless, due to the smaller decrease in Y and C for the quinine tracer in comparison to the dye tracer, the fluorescent quinine tracer has better visibility over time within the measuring frame.

3.5. Fluorescent Quinine Tracer: Main Advantages and Limitations

Results from the experiments conducted in this study reveal the limitations and advantages of using quinine as a shallow/sheet flow velocity tracer. Figure 15 highlights the field conditions that are favourable for using the fluorescent quinine tracer, which is then more suitable than other tracers, and the conditions that prevent its use.

4. Conclusions

In this study, experiments were conducted to test and compare the capability of different tracers (fluorescent, dye and thermal) for measuring sheet flow velocities in the laboratory and the field, under various conditions (light and micromorphology).
The major conclusions from this study are:
  • Despite the quinine tracer’s fluorescence characteristics when exposed to UVA light, in daylight conditions the quinine tracer cannot be visually noticed unless a tent (i.e., a shading system, to dim the sunlight) is used. In dark conditions (twilight, night, etc.) the dye is not visible unless using an artificial light source. The thermal tracer can be used in all ambient light conditions due to the capability of infrared cameras for detecting heat; therefore, the performance of the thermal tracer technique is not affected by ambient light limitations.
  • As observed in the conducted laboratory and field experiments, the quinine tracer is better visualised than the dye tracer, which is confirmed by the relative luminance and contrast ratio revealed by these two tracers.
  • By considering the specifications of the fluorescent tracer (quinine concentration and pH of the solution, volume of tracer used), the restrictions of using the fluorescent quinine as a tracer are: (i) impossible to use in bright light conditions; (ii) not suitable to use in presence of dense or tall vegetation cover or dense mulch, i.e., when the vegetation/mulch offers a percentage surface coverage that exceeds about 25–30%.
  • The main advantages of using fluorescent quinine as a tracer are: (i) simple experimental setup requirement (e.g., UVA lamp, a normal optical camera, and water with quinine, which are all inexpensive and easily accessible materials); (ii) the high visibility of the injected tracer under low-luminosity conditions (e.g., field measurements in dark conditions, at night, twilight, shielded environments or close conduits); (iii) it is nontoxic to the environment, due to the very low concentration needed to produce high fluorescence (around 80 mg/L, which is also used, e.g., for human consumption in tonic water).
Future work should include, e.g., a detailed study of the applicability and performance of the quinine tracer in flows with different sediment loads for various flow conditions, and the study of modifications in this technique that could improve the accuracy and quality of measurements undertaken with quinine tracers.

Author Contributions

S.Z., J.L.M.P.d.L. and J.M.G.P.I. conceived and designed the experiments; S.Z. performed the experiments; S.Z., J.L.M.P.d.L. and M.I.P.d.L. analysed the data; S.Z. and J.L.M.P.d.L. wrote the paper; J.L.M.P.d.L., J.M.G.P.I., M.I.P.d.L. and R.M. revised the manuscript. All authors have read and agreed to the published version of the manuscript.

Funding

This research was funded through the Portuguese Fundação para a Ciência e a Tecnologia (FCT), involving: project ASHMOB (CENTRO-01-0145-FEDER-029351, funded by FEDER and national funds (OE); project MUSSELFLOW (PTDC/BIA-EVL/29199/2017, supported by national funds (PIDDAC); project MEDWATERICE (PRIMA/0006/2018; with the support of PRIMA Programme), supported by national funds (PIDDAC); projects UIDB/04292/2020 and UIDP/04292/2020 granted to MARE—Marine and Environmental Research Center, strategic project UIDB/04450/2020 granted to RISCO—Research Centre for Risks and Sustainability in Construction, and project LA/P/0069/2020 granted to the Associate Laboratory ARNET—Aquatic Research Network, supported by national funds. The author Soheil Zehsaz was granted a PhD fellowship from FCT (Ref. 2020.07183.BD).

Data Availability Statement

Not applicable.

Acknowledgments

The authors acknowledge the Laboratory of Hydraulics, Water Resources and Environment of the Department of Civil Engineering of the University of Coimbra, where the experimental work was conducted with the help of Bruno Matos and the Food Engineering Department of the Institute of Engineering (University of Algarve) where the preliminary quinine fluorescent tests were conducted with the help of Vera Gonçalves and Patricia Nunes.

Conflicts of Interest

The authors declare no conflict of interest.

References

  1. Calkins, D.; Dunne, T. A salt tracing method for measuring channel velocities in small mountain streams. J. Hydrol. 1970, 11, 379–392. [Google Scholar] [CrossRef]
  2. Comiti, F.; Mao, L.; Wilcox, A.; Wohl, E.E.; Lenzi, M.A. Field-derived relationships for flow velocity and resistance in high-gradient streams. J. Hydrol. 2007, 340, 48–62. [Google Scholar] [CrossRef]
  3. Jodeau, M.; Hauet, A.; Paquier, A.; Le Coz, J.; Dramais, G. Application and evaluation of LS-PIV technique for the monitoring of river surface velocities in high flow conditions. Flow Meas. Instrum. 2008, 19, 117–127. [Google Scholar] [CrossRef] [Green Version]
  4. Tazioli, A. Experimental methods for river discharge measurements: Comparison among tracers and current meter. Hydrol. Sci. J. 2011, 56, 1314–1324. [Google Scholar] [CrossRef]
  5. Tauro, F.; Grimaldi, S.; Petroselli, A.; Porfiri, M. Fluorescent particle tracers for surface flow measurements: A proof of concept in a natural stream. Water Resour. Res. 2012, 48, W06528. [Google Scholar] [CrossRef]
  6. Horton, R.E.; Leach, H.R.; Van Vliet, R. Laminar sheet-flow. Eos Trans. Am. Geophys. Union 1934, 15, 393–404. [Google Scholar] [CrossRef]
  7. Emmett, W.W. The Hydraulics of Overland Flow on Hillslopes; US Government Printing Office: Washington, DC, USA, 1970; Volume 662. [Google Scholar] [CrossRef]
  8. Abrahams, A.D.; Parsons, A.J.; Luk, S.H. Field measurement of the velocity of overland flow using dye tracing. Earth Surf. Process. Landf. 1986, 11, 653–657. [Google Scholar] [CrossRef]
  9. de Lima, J.L.M.P.; Abrantes, J.R.C.B. Using a thermal tracer to estimate overland and rill flow velocities. Earth Surf. Process. Landf. 2014, 30, 1293–1300. [Google Scholar] [CrossRef]
  10. Abrantes, J.R.; Moruzzi, R.B.; Silveira, A.; de Lima, J.L.M.P. Comparison of thermal, salt and dye tracing to estimate shallow flow velocities: Novel triple-tracer approach. J. Hydrol. 2018, 557, 362–377. [Google Scholar] [CrossRef]
  11. Tauro, F.; Grimaldi, S.; Petroselli, A.; Rulli, M.C.; Porfiri, M. Fluorescent particle tracers in surface hydrology: A proof of concept in a semi-natural hillslope. Hydrol. Earth Syst. Sci. 2012, 16, 2973. [Google Scholar] [CrossRef] [Green Version]
  12. Mujtaba, B.; de Lima, J.L. Laboratory testing of a new thermal tracer for infrared-Based PTV technique for shallow overland flows. Catena 2018, 169, 69–79. [Google Scholar] [CrossRef]
  13. Lei, T.; Chuo, R.; Zhao, J.; Shi, X.; Liu, L. An improved method for shallow water flow velocity measurement with practical electrolyte inputs. J. Hydrol. 2010, 390, 45–56. [Google Scholar] [CrossRef]
  14. Schuetz, T.; Weiler, M.; Lange, J.; Stoelzle, M. Two-dimensional assessment of solute transport in shallow waters with thermal imaging and heated water. Adv. Water Resour. 2012, 43, 67–75. [Google Scholar] [CrossRef]
  15. Zhou, J.; Liu, G.; Meng, Y.; Xia, C.; Chen, K.; Chen, Y. Using stable isotopes as tracer to investigate hydrological condition and estimate water residence time in a plain region, Chengdu China. Sci. Rep. 2021, 11, 2812. [Google Scholar] [CrossRef]
  16. Abrahams, A.D.; Atkinson, J.F. Relation between grain velocity and sediment concentration in overland flow. Water Resour. Res. 1993, 29, 3021–3028. [Google Scholar] [CrossRef]
  17. Li, G.; Abrahams, A.D.; Atkinson, J.F. Correction factors in the determination of mean velocity of overland flow. Earth Surf. Process. Landf. 1996, 21, 509–515. [Google Scholar] [CrossRef]
  18. Giménez, R.; Govers, G. Flow detachment by concentrated flow on smooth and irregular beds. Soil Sci. Soc. Am. J. 2002, 66, 1475–1483. [Google Scholar] [CrossRef]
  19. Li, Z.B.; Lu, X.K.; Ding, F.W. Experimental study on dynamic processes of soil erosion on loess slope. J. Soil Water Conserv. 2002, 16, 5–7. [Google Scholar]
  20. Tatard, L.; Planchon, O.; Wainwright, J.; Nord, G.; Favis-Mortlock, D.; Silvera, N.; Ribolzi, O.; Esteves, M.; Huang, C.H. Measurement and modelling of high-resolution flow-velocity data under simulated rainfall on a low-slope sandy soil. J. Hydrol. 2008, 348, 1–12. [Google Scholar] [CrossRef] [Green Version]
  21. Wirtz, S.; Seeger, M.; Ries, J.B. Field experiments for understanding and quantification of rill erosion process. Catena 2012, 91, 21–34. [Google Scholar] [CrossRef]
  22. de Lima, R.L.; Abrantes, J.R.; de Lima, J.L.M.P.; de Lima, M.I.P. Using thermal tracers to estimate flow velocities of shallow flows: Laboratory and field experiments. J. Hydrol. Hydromech. 2015, 63, 255–262. [Google Scholar] [CrossRef] [Green Version]
  23. Abrantes, J.R.; Moruzzi, R.B.; de Lima, J.L.M.P.; Silveira, A.; Montenegro, A.A. Combining a thermal tracer with a transport model to estimate shallow flow velocities. Phys. Chem. Earth Parts A/B/C 2019, 109, 59–69. [Google Scholar] [CrossRef]
  24. Zhang, G.H.; Luo, R.T.; Cao, Y.; Shen, R.C.; Zhang, X.C. Correction factor to dye-measured flow velocity under varying water and sediment discharges. J. Hydrol. 2010, 389, 205–213. [Google Scholar] [CrossRef]
  25. Li, G.; Abrahams, A.D. Effect of saltating sediment load on the determination of the mean velocity of overland flow. Water Resour. Res. 1997, 33, 341–347. [Google Scholar] [CrossRef]
  26. Gilley, J.E.; Finkner, S.C.; Doran, J.W.; Kottwitz, E.R. Adsorption of bromide tracers onto sediment. Appl. Eng. Agric. 1990, 6, 35–38. [Google Scholar] [CrossRef]
  27. Buzády, A.; Erostyák, J.; Paál, G. Determination of uranine tracer dye from underground water of Mecsek Hill, Hungary. J. Biochem. Biophys. Methods 2006, 69, 207–214. [Google Scholar] [CrossRef]
  28. Leibundgut, C.; Maloszewski, P.; Külls, C. Tracers in Hydrology; Wiley-Blackwell: Hoboken, NJ, USA; John Wiley & Sons Ltd.: Hoboken, NJ, USA, 2009. [Google Scholar] [CrossRef]
  29. de Lima, J.L.M.P.; Zehsaz, S.; de Lima, M.I.P.; Isidoro, J.M.; Jorge, R.G.; Martins, R.G. Using Quinine as a Fluorescent Tracer to Estimate Overland Flow Velocities on Bare Soil: Proof of Concept under Controlled Laboratory Conditions. Agronomy 2021, 11, 1444. [Google Scholar] [CrossRef]
  30. Jones, W.K. Water tracing in karst aquifers. In Encyclopedia of Caves; Academic Press: Cambridge, MA, USA, 2019; pp. 1144–1155. [Google Scholar] [CrossRef]
  31. Aley, T.; Fletcher, M.W. The water tracer’s cookbook. Mo. Speleol. 1976, 16, 1–32. [Google Scholar]
  32. Montenegro, A.A.A.; Abrantes, J.R.C.B.; de Lima, J.L.M.P.; Singh, V.P.; Santos, T.E.M. Impact of mulching on soil and water dynamics under intermittent simulated rainfall. Catena 2013, 109, 139–149. [Google Scholar] [CrossRef]
  33. Abrantes, J.R.C.B.; Prats, S.A.; Keizer, J.J.; de Lima, J.L.M.P. Effectiveness of the application of rice straw mulching strips in reducing runoff and soil loss: Laboratory soil flume experiments under simulated rainfall. Soil Tillage Res. 2018, 180, 238–249. [Google Scholar] [CrossRef]
  34. de Lima, J.L.M.P.; Singh, V.P.; de Lima, M.I.P. The influence of storm movement on water erosion: Storm direction and velocity effects. Catena 2003, 52, 39–56. [Google Scholar] [CrossRef]
  35. Gelotte, K. Image Color Extract, Cool PHP Tools. Available online: https://www.coolphptools.com/color_extract (accessed on 21 August 2021).
  36. Abrantes, J.R.; de Lima, J.L.M.P.; Prats, S.A.; Keizer, J.J. Assessing soil water repellency spatial variability using a thermographic technique: An exploratory study using a small-scale laboratory soil flume. Geoderma 2017, 287, 98–104. [Google Scholar] [CrossRef]
  37. Diener, H.C.; Dethlefsen, U.; Dethlefsen-Gruber, S.; Verbeek, P. Effectiveness of quinine in treating muscle cramps: A double-blind, placebo-controlled, parallel-group, multicentre trial. Int. J. Clin. Pract. 2002, 56, 243–246. [Google Scholar] [PubMed]
  38. Geto, A.; Amare, M.; Tessema, M.; Admassie, S. Polymer-modified glassy carbon electrode for the electrochemical detection of quinine in human urine and pharmaceutical formulations. Anal. Bioanal. Chem. 2012, 404, 525–530. [Google Scholar] [CrossRef]
  39. Food and Drug Administration (FDA). Food and Drugs. Available online: https://www.accessdata.fda.gov/scripts/cdrh/cfdocs/cfcfr/CFRSearch.cfm?fr=172.575 (accessed on 11 June 2020).
  40. EFSA Panel on Food Contact Materials, Enzymes, Flavourings and Processing Aids (CEF). Scientific Opinion on Flavouring Group Evaluation 35, Revision 1 (FGE. 35Rev1): Three quinine salts from the Priority list from chemical group 30. EFSA J. 2015, 13, 4245. [Google Scholar] [CrossRef] [Green Version]
  41. Moorthy, J.N.; Shevchenko, T.; Magon, A.; Bohne, C. Paper acidity estimation: Application of pH-dependent fluorescence probes. J. Photochem. Photobiol. A Chem. 1998, 113, 189–195. [Google Scholar] [CrossRef]
  42. Thermo Fisher Scientific. Safety Data Sheet Quinine Monohydrochloride Dihydrate 99%. Available online: https://www.alfa.com/en/msds/?language=EN&subformat=AGHS&sku=H33474 (accessed on 18 February 2021).
  43. Bunte, K.; Poesen, J. Effects of rock fragment size and cover on overland flow hydraulics, local turbulence and sediment yield on an erodible soil surface. Earth Surf. Process. Landf. 1994, 19, 115–135. [Google Scholar] [CrossRef]
  44. Aziz, N.M.; Scott, D.E. Experiments on sediment transport in shallow flows in high gradient channels. Hydrol. Sci. J. 1989, 34, 465–478. [Google Scholar] [CrossRef] [Green Version]
  45. Dunkerley, D. Estimating the mean speed of laminar overland flow using dye injection-uncertainty on rough surfaces. Earth Surf. Process. Landf. 2001, 26, 363–374. [Google Scholar] [CrossRef]
  46. Ali, M.; Sterk, G.; Seeger, M.; Stroosnijder, L. Effect of flow discharge and median grain size on mean flow velocity under overland flow. J. Hydrol. 2012, 452, 150–160. [Google Scholar] [CrossRef]
  47. Pan, C.; Shangguan, Z.; Ma, L. Assessing the dye-tracer correction factor for documenting the mean velocity of sheet flow over smooth and grassed surfaces. Hydrol. Process. 2015, 29, 5369–5382. [Google Scholar] [CrossRef]
  48. Polyakov, V.; Li, L.; Nearing, M.A. Correction factor for measuring mean overland flow velocities on stony surfaces under rainfall using dye tracer. Geoderma 2021, 390, 114975. [Google Scholar] [CrossRef]
  49. Stone, M.C. A Field Guide to Digital Color; AK Peters: Netik, MA, USA, 2016. [Google Scholar] [CrossRef]
  50. Caldwell, B.; Cooper, M.; Reid, L.G.; Vanderheiden, G.; Chisholm, W.; Slatin, J.; White, J. Web Content Accessibility Guidelines (WCAG) 2.0; WWW Consortium (W3C): Cambridge, MA, USA, 2008; Volume 290. [Google Scholar]
  51. Poynton, C. Digital Video and HD: Algorithms and Interfaces, 2nd ed.; Morgan Kaufmann Publishers: San Francisco, CA, USA, 2012. [Google Scholar] [CrossRef]
  52. Mag-isa, A.E.; Lee, C.K.; Kim, S.M.; Kim, J.H.; Oh, C.S. Rapid determination of the number of graphene layers by using relative luminance. Carbon 2015, 94, 646–649. [Google Scholar] [CrossRef]
  53. FLIR Systems. Infrared Training Center (ITC): Infrared Thermography Manual for the Construction and Renewable Energy Market; FLIR Systems AB: Wilsonville, OR, USA, 2011. [Google Scholar]
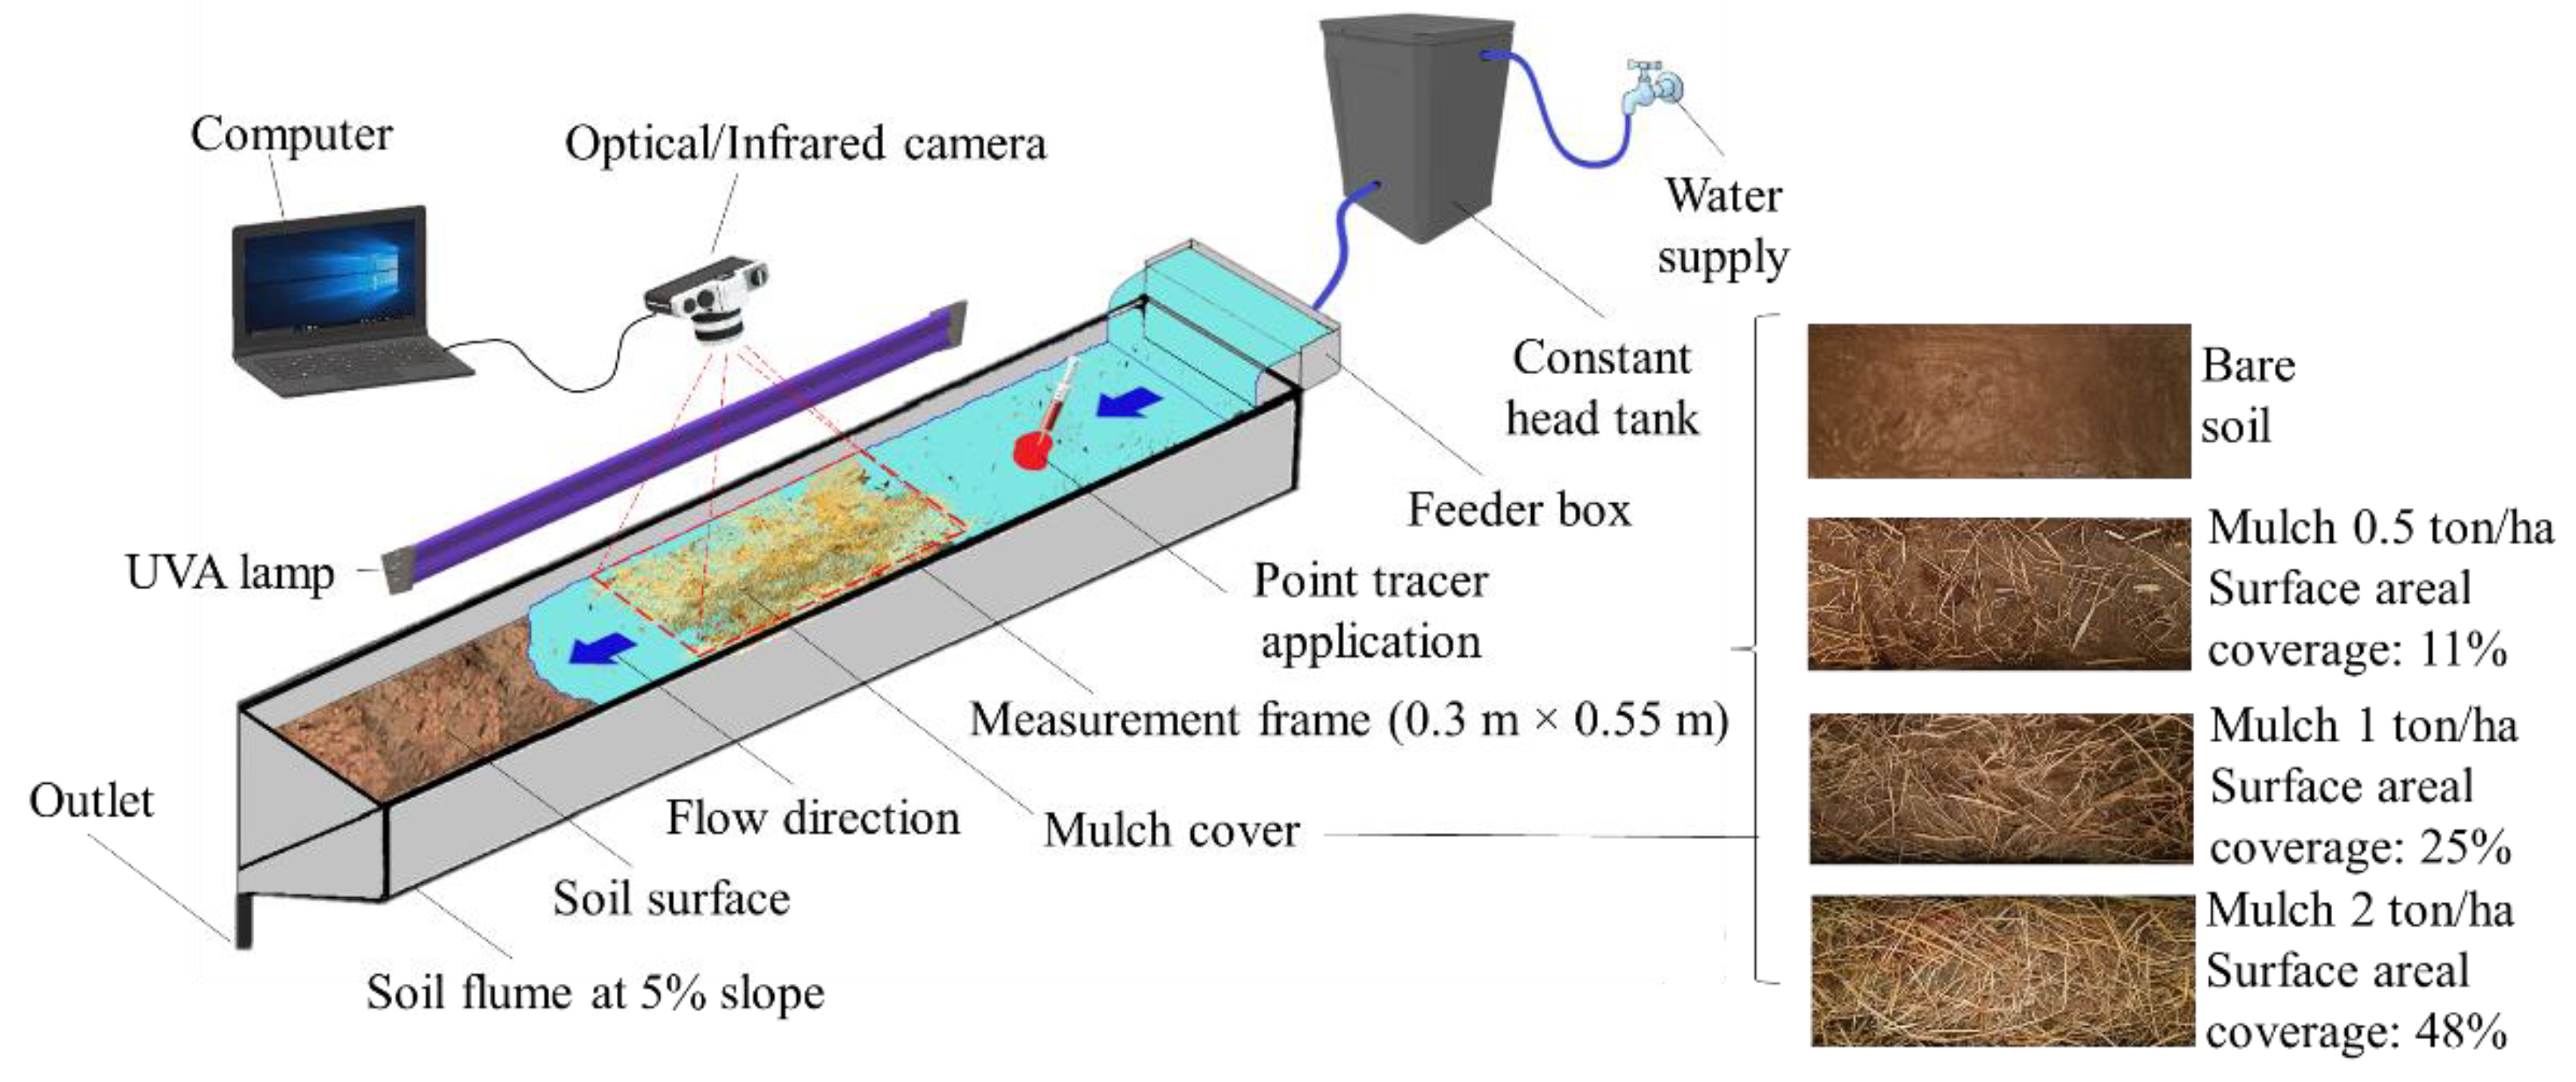
Figure 1. Schematic representation (not to scale) of the laboratory soil flume setup for measuring sheet flow velocities using fluorescent quinine, dye, and thermal tracers. The measuring frame is 0.30 m × 0.55 m. Sample views of the tested bare and mulched soil surfaces are also shown.
Agronomy 12 02687 g001
Figure 2. Schematic representation (not to scale) of the field experimental setup for fluorescent (quinine), dye and thermal tracer measurements: (a) rural surface (vegetated soil surface), (b) urban surface (paved surface). The measuring frame is 0.3 m × 0.6 m.
Agronomy 12 02687 g002
Figure 3. Surfaces tested in the field: vegetated soil surface with (a) vegetation with an average height of 0.15 m, (b) vegetation with an average height of 0.1 m, (c) vegetation with an average height of 0.05 m and (d) paved surface.
Agronomy 12 02687 g003
Figure 4. Illustration of the different heights of the vegetation covering the soil in the field experiments: average height of 0.15 m (top), 0.10 m (middle) and 0.05 m (bottom). A scissor was used to cut the vegetation to the desired height.
Agronomy 12 02687 g004
Figure 5. Sketch of the one-step method of estimating the tracer leading edge velocity Vtr of surface flow over the distance L. This sketch superimposes the two snapshot images that correspond to the tracer’s plume leading edge entering and leaving the measuring frame and identifies the time lapse between them (t1t0).
Agronomy 12 02687 g005
Figure 6. Conceptual illustration of the of total measuring frame area (AT), tracer plume area at time t (Atr), selected cross-section A–A for studying the relative luminance Y along a transversal transect, and identification of the reference background colour to calculate the contrast ratio C for the tracer. This methodology was applied for the analysis of the quinine and dye tracers, at each time step.
Agronomy 12 02687 g006
Figure 7. Snapshot imaging of the dye tracer (left), the fluorescent quinine tracer under ultraviolet light (centre) and the thermal tracer (right), for the bare soil (first row) and soil covered with mulch of 0.5 ton/ha (second row), 1 ton/ha (third row) and 2 ton/ha (forth row). The flow direction in all images is from left to right. Each image covers a longitudinal distance of 0.55 m. Data are from laboratory experiments.
Agronomy 12 02687 g007
Figure 8. Chronological sequence of snapshots from laboratory tests, with a time lapse of 1 s, showing the movement of overland flow velocity tracers: dye tracer (yop), quinine tracer (middle) and thermal tracer (bottom). The flow direction in all images is from left to right. Each image covers a longitudinal distance of 0.55 m.
Agronomy 12 02687 g008
Figure 9. Comparison between imaging of the dye tracer (top), the quinine tracer exposed to ultraviolet light (centre) and the thermal tracer (bottom) added to sheet flow over soil with vegetation covers of different heights. The flow direction in all images is from left to right. Each image covers a longitudinal distance of 0.6 m.
Agronomy 12 02687 g009
Figure 10. Comparison between imaging of the dye tracer (top), the quinine tracer exposed to ultraviolet light (centre), and the thermal tracer (bottom) added to sheet flow over an urban paved surface. The flow direction in all images is from left to right. Each image spans a longitudinal distance of 0.6 m.
Agronomy 12 02687 g010
Figure 11. Comparison of mean flow velocities estimated from the leading edge velocity of three tracer plumes (dy, dye; qu, quinine; th, thermal) for sheet flows over bare soil and soil with mulch covers of 0.5, 1 and 2 ton/ha (top), soil surface with vegetation cover of 0.05 m height (centre) and urban paved surface (bottom). The notation “n.d.” indicates no data.
Agronomy 12 02687 g011
Figure 12. Areal coverage of each tracer’s plume (dye, quinine and thermal) within the measuring frame, over time (Δt = 1 s), for sheet flows over the different surfaces studied in the laboratory experiments (top) and field experiments (centre and bottom).
Agronomy 12 02687 g012
Figure 13. For the mulched soil surface of 0.5 ton/ha, relative luminance variation of the quinine (top) and dye (centre) tracers, and temperature variation of the thermal tracer (bottom) at each time step Δt = 1 s, across the width of the measuring frame.
Agronomy 12 02687 g013
Figure 14. Contrast ratio variation of quinine (top) and dye (centre) tracers, and temperature variation of the thermal tracer (bottom) at each time step Δt = 1 s along the width and length of the measuring frame, for the mulched soil surface of 0.5 ton/ha.
Agronomy 12 02687 g014
Figure 15. For surface flow velocity estimates: (a) favourable conditions for using the fluorescent quinine tracer technique in the field; and (b) conditions preventing the use of the quinine technique in the field.
Agronomy 12 02687 g015
Table 1. Field experimental conditions: type of surface, discharge, slope gradient, and meteorological information.
SurfaceDayVegetation Height (m)Discharge (L/s)Slope Gradient (%)Air Temperature (°C)Flow Water Temperature (°C)Sunset Time (hh:mm)
Vegetated soil10.150.4025232020:51
20.100.3925232120:52
30.050.4025222120:53
Paved1-0.2120252020:51
Table 2. Calculated correction factors (α) applied to leading edge tracer velocities for estimating mean flow velocities for the different surfaces studied in the laboratory and field experiments.
SurfaceQ (L/s)S (%)Reα
Bare soil and mulched surface0.1454740.62
Vegetated surface (vegetation height of 0.05 m)0.402513950.60
Urban paved surface0.21207020.57
Table 3. Surface flow velocity estimates based on the application of dye, fluorescent and thermal tracers to sheet flow over bare soil, soil with mulch cover and vegetation cover, and urban paved surfaces. Mean values and standard deviations (S.D.) are for three replicates (laboratory and field experiments).
Bare Soil and Mulch CoverSurface with 0.05 m Vegetation CoverUrban Surface
SurfaceTest numberMean Velocity U (m/s)Observation timeTest numberMean Velocity U (m/s)Observation timeTest numberMean Velocity U (m/s)
DyeQuinineThermalDyeQuinine (with tent)ThermalDyeQuinine (with tent)Thermal
Bare soil10.2050.1790.230Day (1 h before the sunset)10.1030.1280.104Day (1 h before the sunset)10.2570.2570.197
20.1930.1830.23420.1080.1320.10120.2550.2620.205
30.2160.181-30.1080.1310.12030.2570.228-
Mean0.2050.1810.232Mean0.1060.1310.109Mean0.2560.2490.201
S.D.0.0100.0020.002S.D.0.0020.0020.008S.D.0.0010.0150.004
Dye (with light)QuinineThermal Dye (with light)QuinineThermal
0.5 ton/ha mulch10.1170.1330.175Twilight (during the 30 min after the sunset)10.1160.1200.097Twilight (during the 30 min after the sunset)10.2090.2540.222
20.1210.1430.14020.1170.1180.10220.2270.2570.236
30.1080.0810.12830.1190.1180.11030.2240.265-
Mean0.1150.1190.148Mean0.1170.1180.103Mean0.2200.2590.229
S.D.0.0060.0270.020S.D.0.0010.0010.005S.D.0.0080.0050.007
Dye (with light)QuinineThermal Dye (with light)QuinineThermal
1 ton/ha mulch10.0790.1100.098Night (1 h after the sunset)10.1240.1190.101Night (1 h after the sunset)10.2330.2040.188
20.1140.1250.10320.1200.1190.10520.2470.2290.188
30.1050.1150.07630.1250.1230.10030.2460.2340.217
Mean0.0990.1160.092Mean0.1230.1200.102Mean0.2420.2220.198
S.D.0.0150.0060.012S.D.0.0020.0020.002S.D.0.0060.0130.013
2 ton/ha mulch1--0.071
2--0.070
3--0.071
Mean--0.071
S.D.--0.001
Publisher’s Note: MDPI stays neutral with regard to jurisdictional claims in published maps and institutional affiliations.