Abstract
Coffee waste is an organic material that can potentially be used in agricultural systems as an organic amendment. This study investigated the effects of the application of three concentrations of coffee waste (1%, 2%, and 4% w/v), used as an organic amendment, on soil free-living nematode communities, and in two different soil types (clay and sandy loam). Coffee waste incorporation did not appear to be toxic to the soil’s free-living nematodes; on the contrary, it favored the nematode populations; this increase was greater in the sandy loam soil type. Our results show that the abundance of the cp-1 bacteria-feeding nematodes can be used as an indicator of the soil’s enrichment or depletion phase. Panagrolaimus was the most promising genus to describe quality differentiations that occur in the soil system. Three months after coffee waste application, Panagrolaimus was found to be dominant in all coffee waste applications, indicating that the soil was in a phase of enrichment. Six months after the application, nematode community structure indices (enrichment and structure) showed that coffee waste was decomposed in the 1 and 2% treatments and that these systems were in a stage of nutrient depletion. In terms of agricultural practices, when a coffee waste dose is lesser than 4%, a second application is recommended before 6 months to avoid soil degradation.
1. Introduction
According to the International Coffee Organization, global coffee consumption for the year 2020/21 is estimated at 167.26 million bags (1 bag of coffee = 60 kg), an increase of 1.9% over 164.13 million bags recorded in the year 2019/20 [1]. A large amount of residue is produced mainly from coffee shops and domestic production [2]. This economic sector consumes about 50% of the world’s coffee in the production of instant coffee, generating about 6 million tons of coffee waste (CW) every year [2]. Thus, the amount of CW produced is high and it is mainly discarded in the trash, consequently ending in landfills, or discarded in the sewage system from where the residue ends up directly in water bodies [3].
Although large quantities of organic waste are recycled, their disposal rates are still high; therefore, more innovative recovery methods are required for these rates to be reduced [4]. CW has attracted the attention of industry and research because it contains large amounts of organic compounds (i.e., fatty acids, lignin, cellulose, hemicellulose, and other polysaccharides) [5], while its use as compost in agriculture has also been investigated [6,7,8]. When CW is incorporated into the soil system, in open-field conditions, the applied amounts are similar to those of manures and other organic amendments (10 t ha−1 max) [9,10]. In greenhouse experiments, the applied quantities are usually much higher (700 t ha−1) [11,12,13,14,15,16,17]. The form of the applied CW is also important, though. Composted CW, even at low doses, has been found to improve the status of nutrients that are important for the plant (Mg, Mn, K, and Na), while the use of fresh CW may cause a decrease in mineral elements [14]. Additionally, fresh CW application might limit plant growth, due to some type of toxicity effect [10,17]; however, such toxicity problems could be solved either by low doses of CW incorporation [13] or by mixing products such as ash or inorganic fertilizers with CW before application [18]. Other studies described the completion of soil N assimilation between microorganisms and plant roots by fresh CW application [19]. Most of these experiments focused on the impact of CW on the soil–plant system, only considering the starting and ending points of the experiment. Consequently, there is a gap in this type of experimental design, because many soil parameters may appear to have different values over time [11].
Soil nematodes are considered to be useful soil health and quality indicators [20]. The study of the soil community both in terms of trophic groups and life strategies gives a better insight into the structure of the soil food web and hence the nutritional state of the soil [21], and thus it can be used as an index to evaluate the effects of CW on soil health and quality. Soil nematodes are classified into five trophic groups: bacterial feeders, fungal feeders, plant feeders, omnivores, and predators [22]. Nematodes in the soil range from fast-reproducing and enrichment opportunists, categorized low on the colonizer–persister (cp) scale (cp-1), to slow-growing predators and omnivores, which are categorized at the top of the cp scale (cp-4 or 5); this indicates that specific nematode genera grow at higher or lower rates according to both the cultivation system practiced and the type of crop [20]. Additionally, the estimation of soil nematode indices based on the cp values is used to monitor the metabolic footprint changes in the soil during various management practices, which is a metric of metabolic activity and ecosystem function [23]. The incorporation of organic amendments into the soil system, such as green manure and botanical extracts, has been proved to significantly reduce the numbers of plant parasitic nematodes, while boosting the abundance of bacterial and fungal-feeding nematodes [21,24]. However, to this day no research aiming to examine the effects of CW application on the communities of free-living soil nematodes has been conducted. It is an ecological topic of great interest in the case of CW use as an organic amendment in the future.
This study aimed to investigate the effects of different CW application rates on the soil nematode community in two different soil types (clay and sandy loam) at two post-application time intervals (three and six months after the application). We also attempted to identify if any genera that could be used as indicators of the nutritional status of the soil. We hypothesized that CW application significantly alters the composition and structure of the soil nematode community. We also hypothesized that the effect of CW incorporation would be identical in both sampling periods. The nematode analysis included genera recognition, trophic groups classification, the structure of the nematode community, and the calculation of the nematological indices.
2. Materials and Methods
Coffee waste was collected from random coffee shops in the Thessaloniki region (Northern Greece). CW was first spread on a plastic surface and then covered with another transparent plastic surface with air openings on both sides to dry under the sun. The dry material was sieved at ≤2 mm. For the needs of our experiment, two different soil types, soil C (clay) and soil SL (sandy loam), were collected from agricultural fields of Thermi, Thessaloniki. The soils were subjected to the breaking of large aggregates, removal of stones, and sieving ≤1 cm. The physicochemical characteristics of the two soils and the applied CW are given in Table 1 and Table 2, respectively.

Table 1.
Mean values (± St. Error) of the soil physicochemical variables in the two soil types.
Table 2.
Physicochemical properties of the applied coffee waste.
Three different rates of CW (0.01 v/v (CW-1%); 0.02 v/v (CW-2%); 0.04 v/v (CW-4%)) and the respective control (0 v/v (CW-0%)) were applied οn both soil types with five replicates per treatment. We applied the CW as fresh material to observe any potential toxicity effects on the soil nematode community. The mixtures and control soils were placed in 80 pots of 5 L (4 treatments × 5 replicates × 2 soil types × 2 samplings). The pots were placed outdoors based on a randomized split-plot design and the only type of irrigation they received was natural precipitation (i.e., rainfall). We contracted two destructive samplings (of 5 pots per treatment and per soil type for a total of 40 pots each sampling period) the first 3 months after application (3ΜAA) and another second one 6 months after application (6ΜAA).
2.1. Laboratory Methods
2.1.1. Nematode Extraction and Analysis
Nematodes were extracted from 150 mL of each soil sample that was previously subjected to gentle breaking up of soil aggregates by hand. For extraction, Cobb’s sieving and decanting method was used as modified by S’Jacob and van Bezooijen [25], wherein a cotton wool filter is used in the last step. After counting the total number of nematodes, they were fixed with 4% formaldehyde, and later 100 nematodes were randomly selected from each sample and identified to genus level with the identification key of Bongers [26]. Nematode genera were assigned to trophic groups according to [22], and classified along the colonization–persistence gradient (c–p values) following Bongers [27] and Bongers and Bongers [28]. Regarding nematode functional indices, the maturity index (MI) for the free-living nematodes and the plant parasitic index (PPI) for the plant-feeding nematodes were estimated, both indicating the successional stage of communities, according to Bongers [27]. The enrichment index (EI) and the channel index (CI), indicating the enrichment of soil and the dominant decomposition pathway, respectively, were calculated according to Ferris et al. [29]. The structure index (SI) was also calculated based on Bongers [26]. Finally, we used the NINJA (nematode-indicator joint analysis) online platform for the calculation of metabolic footprints and the extraction of the soil food web graph [30].
2.1.2. Physicochemical Analyses
Soil samples were sieved with a 2 mm sieve and left to dry for 48 h at 25 °C. The chemical analysis included soil texture analysis, pH, CaCO3, organic matter, nitrate N (NO3-N), available P, and concentrations of K, Ca, and Mg macronutrients as well as B, Fe, and Zn micronutrients. The above-mentioned parameters were determined as follows: soil texture analysis was conducted according to the Bouyoucos method, pH was measured in a soil-distilled water paste (1:1), %CaCO3 was determined with the acid neutralization method, organic matter was evaluated with potassium dichromate, nitrate (NO3−)-N and ammonium (NH4+)-N were determined by using KCl 0.5 mol/L, while extractable P was measured according to the Olsen method. The concentrations of Ca, Mn, Mg, K, Fe, B, Cu, and Zn were determined by ICP (Perkin Elmer Optical Emission Spectrometer, OPTIMA 2100 DV, Waltham, MA, USA) [31].
Coffee waste was put into an oven at 75 °C for 48 h to dry. Afterward, it was placed in porcelain bowls and incinerated in a furnace at 515 °C for 5 h. The ash was then dissolved with 3 mL HCl 6 N and finally diluted with distilled water to reach the volume of 50 mL. Total Ca, P, Cu, S, Fe, Zn, K, Cd, Mg, Co, Mn, Cr, Na, Pb, Ni, and C concentrations were determined by the ICP method [31]. Total N was evaluated by the Kjeldahl method, while B was determined according to the method of azomethine-H [32].
2.2. Statistical Analyses
In order to determine the effect of soil, different treatments, and the interaction of the two variables (CW and soil type) in the community of free-living soil nematodes, we applied two two-way ANOVA (one for each sampling) in order to have a closer look on each time period independently and to also have more readable tables and figures. However, we applied a three-way ANOVA to investigate the impact of time, too. Where statistically significant effects were identified, post hoc analyses (Fisher LSD) were performed. The STATISTICA program was used for statistical analyses.
3. Results
The abundance of the nematode trophic groups under different treatments, (3ΜAA), is presented in Figure 1. Bacterial feeders were the most abundant among nematode trophic groups, followed by fungivores, non-parasitic plant feeders, and plant parasitic nematodes, in both soil types. Very low numbers of predators and omnivorous genera were recorded. Soil SL exhibited higher numbers of all free-living nematode groups compared to soil C. Even though the CW application had no significant effect on the total nematode abundance, the bacterial feeders in all treatments were significantly increased compared to the control in both soil types regardless, but no significant differences were recorded among the treatments 3MAA (Figure 1). Fungal feeders’ and non-parasitic plant feeders’ abundances were not affected significantly by CW application. Plant parasitic nematodes in soil C were very few and were not affected by the CW incorporation; on the contrary, in soil SL the plant parasitic abundances of the control samples were elevated, and the application of CW resulted in a significant decrease in their numbers (CW-1% (−78.6%), CW-2% (−85.7%), CW-4% (−81.3%)).
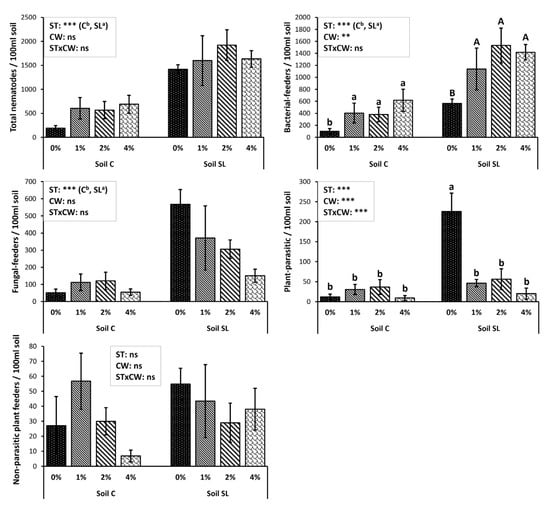
Figure 1.
Mean abundance values (± St. Error) of nematode trophic groups under different treatments and results of repeated-measures ANOVA regarding “Coffee Waste” (CW), “soil type” (ST), and their interactive effect (STxCW) 3MAA (months after application). In the case of significant interactive effect, different letters (a, b) indicate significant differences among treatments based on Fisher’s LSD post hoc test (**: p < 0.01; ***: p < 0.001; ns: p > 0.05, for all cases n = 5). When interactive effect was not significant, small (a, b) and capital letters (A, B) were used to identify the differences among treatments in each soil type. The letter “a” (or A) always points to the highest value.
The abundance of nematode trophic groups under different treatments 6MAA, is presented in Figure 2. The total nematode numbers were significantly higher at 6MAA than they were at 3MAA (Table S1) and the effects of both the soil type and the CW were significant. Soil SL again presented the highest nematode abundances. Nevertheless, only in the case of the CW-4% treatment, the total nematode abundance as well as those of the bacterial and fungal feeders were still significantly higher, in relation to the control (Figure 2). The plant parasitic nematodes at 6MAA followed the same pattern as that recorded at 3MAA (Table S1); in soil C they were still very few, while in soil SL the application of CW resulted once more in a significant decrease in their numbers. It also showed that a higher CW concentration tended to increase the effectiveness against plant parasitic nematodes. The interaction between soil type and CW was statistically significant in non-parasitic plant-feeders, showing that in soil SL, CW application reduced their numbers significantly in 6MAA. However, non-parasitic plant-feeders did not significantly differ in the case of soil C. Omnivores and predators showed higher abundances in relation to the first sampling, but their numbers were still too low for any worth-noticing statistical analysis.
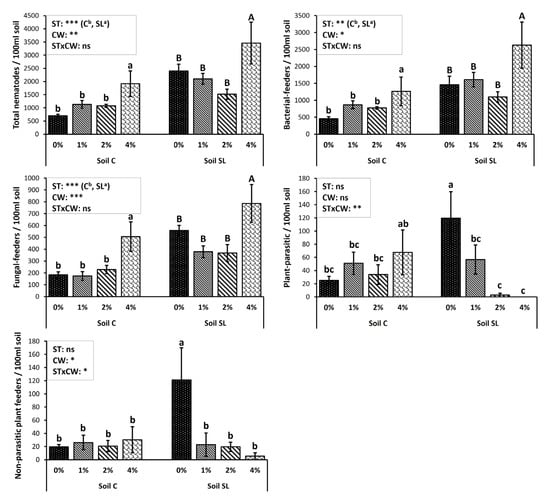
Figure 2.
Mean abundance values (± St. Error) of nematode trophic groups under different treatments and results of repeated-measures ANOVA regarding “Coffee Waste” (CW), “soil type” (ST), and their interactive effect (STxCW) 6MAA (months after application). In the case of significant interactive effect, different letters (a, b, c) indicate significant differences among treatments based on Fisher’s LSD post hoc test (*: p < 0.05; **: p < 0.01; ***: p < 0.001; ns: p > 0.05, for all cases n = 5). When interactive effect was not significant, small (a, b) and capital letters (A, B) were used to identify the differences among treatments in each soil type. The letter “a” (or A) always points to the highest value.
In the control samples of both soil types, bacterial-feeders were the dominant group in 3MAA, and the incorporation of CW resulted in an even further increase in their % contribution (Figure 3a); the highest percentages of the bacterial-feeders’ abundance were recorded in the CW-4% treatment. Noteworthy was the fact that the trophic group’s structure in both soils in the CW-4% was almost identical (Figure 3a), although, judging from the control, the initial nematode community completely differed.
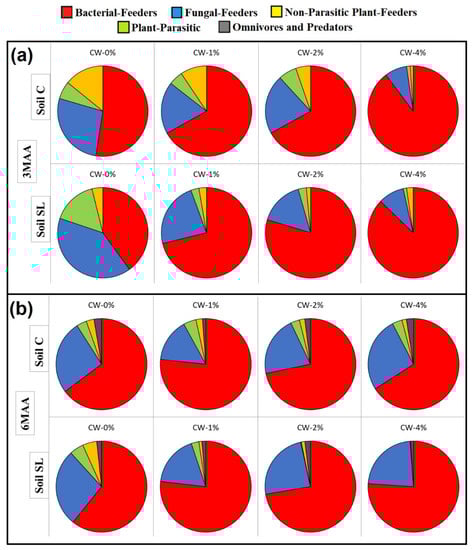
Figure 3.
Percentage contribution of the trophic groups at different treatments at (a) 3MAA and at (b) 6MAA (MAA: months after application). For all cases n = 5.
The structure of the nematode community in terms of trophic groups in both soil types was similar in the control samples (CW = 0%) at 6MAA (Figure 3b); the bacterial-feeders were still the dominant group. The percentage contribution in all treatments did not differ compared to the control at 6MAA, as it was recorded at 3MAA. This could be attributed to the increased percentage contribution of fungal-feeders in the treated samples. Yet, once again, the CW-4% samples of both soil types presented a similar structure of the nematode community.
The composition of the nematode community at 3MAA and at 6MAA (MAA: months after application) under different treatments is given in the rank abundance graphs (Figure 3). The genera that we recorded were the bacterivores Rhabditis, Mesorhabditis, Acrobeles, Acrobeloides, Chiloplacus, Eucephalobus, Panagrolaimus, Plectus, and Cervidellus, the fungivores Ditylenchus, Filenchus, Aphelenchus, and Aphelenchoides, the ectoparasite Bitylenchus, the semi-endoparasite Helicotylenchus, and finally the non-parasitic plant feeder Malenchus. Only two omnivorous genera were found, but in low numbers: Thonus and Dorydorella.
Panagrolaimus sp. was the dominant genus when CW was applied in both of the soil types at 3MAA (Figure 4). At 6MAA in the case of the control, and when low quantities of CW were applied, Chiloplacus sp. was shown to be the dominant genus (Figure 5). When CW = 4% was applied, Panagrolaimus sp. was again the dominant genus even at 6MAA.
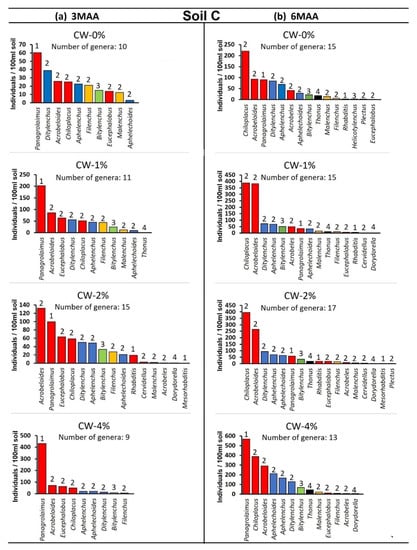
Figure 4.
(a,b) Rank abundance graphs for nematode genera at different treatments in the case of soil C at (a) 3MAA and at (b) 6MAA (MAA: months after application). Genera are ranked from the most to the least abundant. The numbers above bars indicate the c–p value of each genus. For all cases n = 5.
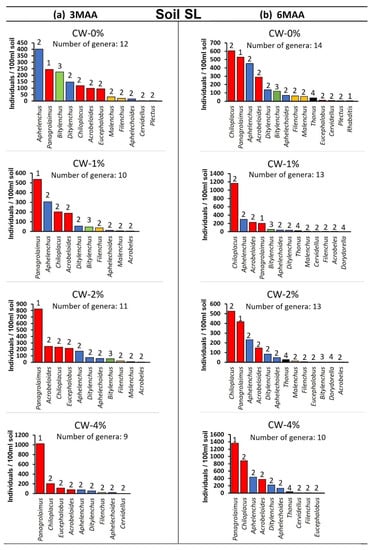
Figure 5.
(a,b). Rank abundance graphs for nematode genera at different treatments in the case of soil SL at (a) 3MAA and at (b) 6MAA (MAA: months after application). Genera are ranked from the most to the least abundant. The numbers above bars indicate the c–p value of each genus. For all cases n = 5.
At 3MAA, the control samples presented differences regarding the nematode community composition; in soil C, the dominant genus was Panagrolaimus sp. (cp-1 bacterivore), while in soil SL, Aphelenchus sp. (cp-2 fungivore) was the one presenting the highest numbers. The application of CW resulted in the overdominance of Panagrolaimus in both soil types, especially in the CW-4% sample. At 6MAA, the composition of the control samples differed in relation to that recorded at 3MAA; Chiloplacus sp. (cp-2 bacterivore) was the dominant genus. This pattern was also observed in the CW-1% and CW-2% samples, whereas in the CW-4% samples Panagrolaimus was still the dominant genus.
The MI, EI, CI, SI, and PPI values were estimated at 3MAA, and are presented in the Supplementary Material (Table S2). The application of CW did not affect MI, PPI, and SI compared to the control. The EI values were increased with CW incorporation (the CW-4% sample presented the highest numbers); on the contrary, CI was significantly decreased in the CW-treated samples (the CW-4% sample presented the lowest values). Finally, PPI was the only index that was significantly influenced by the soil type, as soil SL presented higher values (Table S2).
The MI, EI, CI, SI, and PPI values were estimated at 6MAA, and are presented in the Supplementary Material (Table S3). SI was the only index that was not affected either by soil type or CW application. The MI and CI values of the treated samples did not differ compared to the control; nevertheless, the CW-4% treatment had the lowest values. PPI showed a similar pattern, but the CW-4% samples had significantly lower values compared to the control. The EI values were found to be significantly lower in the CW-1% samples compared to the control and the other treatments. The MI and CI values were significantly higher in the soil C samples, whereas soil SL presented higher values of EI and PPI.
The bacterivore footprint values increased in all CW-treated samples compared to the control at 3MAA (Table S4). On the contrary, at 6MAA only the CW-4% values still differed significantly compared to the control and the other treatments. The fungivore footprint was less influenced by CW application (Table S1) as CW-4% (at 3MAA) was the only treatment presenting significantly lower values compared to the control (Table S4). The time factor showed significant effects on fungivore footprint (Table S1); it also showed significant interaction with CW (Table S1).
The food web analysis according to the EI/SI ratio of the CW treatments and the control for both samplings is presented in Figure 6. In the first sampling (at 3MAA), all CW treatments and the control were ordinated in the upper left quadrant, indicating that all soil samples were in a stage of enrichment (Figure 6a). On the contrary, in the second sampling (at 6MAA), the CW-1% and CW-2% samples were ordinated in the lower left quadrant, indicating that these soil samples passed into a depletion phase; the control and the CW-4% samples were still in a stage of enrichment (Figure 6b).
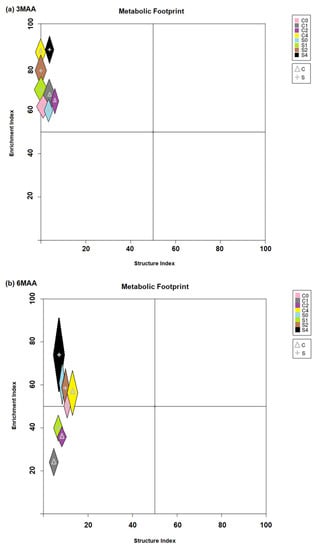
Figure 6.
(a,b). Food web analysis according to the ordination of the samples based on the EI and SI values of different treatments at (a) 3MAA and at (b) 6MAA (MAA: months after application). The crosses point to the mean value of the ratio and the colored areas show the respective standard deviation. Different colors show a different treatment. For all cases n = 5.
4. Discussion
Our results show that the initial nematode community abundance and structure differed between the two soil types. The soil SL had higher soil free-living nematode numbers than soil C, which could be attributed to the differences in pore size between the two soil types. Generally, higher clay content in the soil results in smaller pore size [33], thus affecting soil nematodes that usually need bigger pores to move [34]. As expected, the bacterial-feeding nematodes had the highest numbers in both soil types. On the contrary, we did not find any significant number of predators or omnivores in any of our soil systems. This could be the outcome of the previous agricultural conventional practices that had a significant impact on the soil nematode community [35]. Since predators and omnivores are very sensitive to disturbances, their absence was an indication that the community in our pot experiment had a very loose and disturbed structure due to agricultural practices [36]. Additionally, the composition of the two soil type communities differed, as soil SL presented an increased abundance of the plant-feeding nematode Bitylenchus. These plant-feeders probably co-existed with the roots of the plants from the last cultivation season and their presence in the pots could be explained by their ability to survive a sufficient period outside their host [37].
All CW applications increased the total soil nematode abundance in both soil types at 3MAA. The incorporation of CW, which is an organic amendment with a high C/N ratio, significantly increased the abundance of the bacterial-feeding nematodes in all treatments in relation to the controls, in both soil types. Coffee waste contains both easily and slowly degradable materials (e.g., cellulose, hemicellulose, tannins, and fibers [38]), which can be used as a carbon and nitrogen source by microorganisms, rapidly increasing the number of bacteria [39]. Changes in the bacteria population will be reflected in changes in the bacteria-feeding nematode numbers [40]. Interestingly, the higher the CW application rate, the greater the percentage increase in the bacterial-feeders in the soil nematode composition (over 200% in the CW-4% samples) in both soil types. The genus Panagrolaimus, which belongs to the cp-1 group, was the one that increased the most and dominated the soil nematode composition in all treatments. Of particular interest is the fact that when CW was applied at a 4% concentration, the percentage trophic group structure in both soil types was the same at 3MAA, although the controls had quite different community structures from each other.
The cp-1 nematode group genera (e.g., Rhabditidae, Diplogastridae, and Panagrolaimidae [28]) are active under conditions of high microbial activity; they are considered enrichment opportunists because they respond positively and rapidly to disturbances, as a result of enrichment by nutrients and the bloom of bacteria [41]. In our study, Panagrolaimus was the prevailing cp-1 genus in our control communities and it was therefore the one that benefited the most from the CW application. As all CW-treated pots showed a significant increase in the bacterial-feeder population, this was also reflected in elevated EI values (Tables S2 and S3), indicating nutrient enrichment [29] and a more intense bacterial metabolic footprint at 3MAA (Table S4). Amending with CW also altered the ratio of key groups of fungal- and bacterial-feeding nematodes, as revealed in the descending values of both CI [29] and MI [42], indicating shifts toward a decomposition pathway more dominated by bacteria (Tables S2 and S3).
Contrary to the bacterial feeders, the fungi-feeding nematodes were not significantly affected by CW application at 3MAA. Additionally, the fungivore footprint was significantly higher in the control pots compared to their respective CW-treated ones, indicating a greater flow rate of resources into the food web through the bacterial channel. This could be attributed to the fact that at 3MAA the availability of easily available C compounds is elevated after CW incorporation, and thus the degradation of the more complex organic material, related to the slower fungal-dominated decomposition pathways, is not the predominant one [43,44,45]. This is what caused the reduction in the fungivore footprint at 3MAA, as shown in Table S4.
In our second sampling, at 6MAA, our results indicate that the bacterial-feeders were still the dominant nematode group in the control plots, in both soil types, and their increasing abundance compared to the ones recorded at 3MAA was significant (Table S1). However, the composition of the community changed as the dominant genus was Chiloplacus, a cp-2 nematode, and not Panagrolaimus. This change is attributed to the recovery of the nematode community from the disturbance that was caused to the soil system during the preparation of the pot experiment [36,46]. Similar to the controls, the CW-1% and 2% applications had the same structure, presenting the dominance of Chiloplacus as well (Figure 5b). On the contrary, the CW-4% application was the only treatment that was still characterized by the dominance of the genus Panagrolaimus in both soil types. This is an indication that the incorporation of greater amounts of CW-4% in a soil system is a long-term disturbance for the soil system compared to CW-1% and 2%. Significant differences are also recorded in relation to the metabolic footprint values. The CW-4% treatment is the only one presenting significantly increased bacterivore and fungivore metabolic footprints (Table S4), suggesting that the flow rate of resources into the food web no longer occurs only through the bacterial channel (as recorded at 3MAA) but the size of the fungal contribution also increased with time (Table S1). The easily decomposable substrate that favors the increase in cp-1 Panagrolaimus is still available; nevertheless, studies have indicated that a change in the C/N ratio of the CW begins to shift the size of the fungal energy channel towards fungi and fungal-feeders [47,48,49], which agrees with our results which show that the increase in the fungivore footprint from the first (3MAA) to the second (6MAA) sampling was significant (Table S1). As no similar results were recorded in the CW-1% and 2% treatments, we concluded that at 6MAA even the slowly degradable fraction of CW was decomposed. Moreover, our results indicate that even though the CW-1% and 2% treatments had a similar nematode composition to the controls, in both soil types, in Figure 6b it was shown that these treatments shifted from the enrichment phase to the nutrient depletion phase. It is likely that the high C/N ratio of the CW eventually led to the depletion of nitrogen as it is immobilized in the microbial and nematode biomass [50], degrading the soil system even further and placing it under stress conditions. Eventually, this is expected to occur in the CW-4% treatment, when the nitrogen substrate descends [51]. Based on the low MI values in all treatments for the duration of the experiment, we concluded that the incorporation of CW did not favor the composition of the soil nematode community in terms of maturing it. This observation, along with the fact that the abundance of omnivores and predators was not increased significantly, indicated that the addition of CW constitutes a type of disturbance for the community and does not improve soil ecosystem stability. The fact that six months after CW application the nematode metabolic footprint exhibits a depletion of nutrients indicates that a more frequent than six-month application should be considered when applying less than 4%.
Another interesting finding of our study is related to the negative effect of CW application on the plant parasitic nematode abundance in the soil SL pots, on both sampling occasions. This is an indication that coffee waste could act as a potential nematicide against plant parasites. Several studies have shown that the incorporation of organic amendments (e.g., whey [36]) could also reduce the population of plant parasitic nematodes [36]. In the case of coffee waste, its phenolic acid and tannin content [5] could be responsible for the suppression of plant parasitic nematodes [52]. Since no previous recording of the use of coffee waste as nematicides has been published before, more tests and further investigation on this indication are needed.
Supplementary Materials
The following supporting information can be downloaded at: https://www.mdpi.com/article/10.3390/agronomy12112702/s1, Table S1: Factor and Interaction Effects on Total Nematodes (TNs), Bacterial feeders (BFs), Fungal feeders (FFs), Plant Parasitic Nematodes (PP), non-parasitic plant feeders (NPP), Bacterivore Footprint (BF), and Fungivore Footprint (FFt) (ANOVA and Fisher’s LSD post hoc comparisons; *: p < 0.05; **: p < 0.01; ***: p < 0.001; ns: not significant, for all cases n = 5); Table S2: Mean values of the maturity index (MI), enrichment index (EI), channel index (CI), plant parasitic index (PPI), and structure index (SI) under the different treatments, in both soil types, at 3MAA (MAA: months after application). The same letters at the top of the columns show the mean values that are not significantly different (ANOVA and Fisher’s LSD post hoc comparisons; for all cases n = 5); Table S3: Mean values of the maturity index (MI), enrichment index (EI), channel index (CI), plant parasitic index (PPI), and structure index (SI) under the different treatments at 6MAA. For each sampling occasion, within columns, means followed by the same letter are not significantly different (ANOVA and Fisher’s LSD post hoc comparisons; **: p < 0.01; ***: p < 0.001; ns: not significant, for all cases n = 5); Table S4: Mean values of the metabolic footprints under the different treatments at3MAA and 6MAA. For each sampling occasion, within columns, means followed by the same letter are not significantly different (ANOVA and Fisher’s LSD post hoc comparisons; *: p < 0.05; **: p < 0.01; ***: p < 0.001; ns: not significant, for all cases n = 5).
Author Contributions
Conceptualization, N.M. and V.A.; investigation, P.K., E.T. and M.D.; methodology, P.K., M.D. and N.M.; supervision, N.M.; writing—original draft, P.K.; writing—review and editing, N.M., E.M.P. and V.A. All authors have read and agreed to the published version of the manuscript.
Funding
This research received no external funding.
Data Availability Statement
The data presented in this study are available upon request from the corresponding author.
Conflicts of Interest
The authors declare no conflict of interest.
References
- International Coffee Organization. World Coffee Consumption. 2022. Available online: http://www.ico.org/prices/new-consumption-table.pdf (accessed on 3 July 2022).
- Tokimoto, T.; Kawasaki, N.; Nakamura, T.; Akutagawa, J.; Tanada, S. Removal of lead ions in drinking water by coffee grounds as vegetable biomass. J. Colloid Interface Sci. 2005, 281, 56–61. [Google Scholar] [CrossRef] [PubMed]
- Fernandes, A.S.; Mello, F.V.C.; Filho, S.T.; Carpes, R.M.; Honório, J.; Marques, M.R.C.; Felzenszwalb, I.; Ferraz, E. Impacts of discarded coffee waste on human and environmental health. Ecotoxicol. Environ. Saf. 2017, 141, 30–36. [Google Scholar] [CrossRef] [PubMed]
- Randell, P.; Pickin, J.; Grant, B. Waste Generation and Resource Recovery in Australia. Reporting Period 2010/11. Final Report Version 2.6; Blue Environment Pty Ltd: Docklands, Australia, 2014. [Google Scholar]
- Pujol, D.; Liu, C.; Gominho, J.; Olivella, M.À.; Fiol, N.; Villaescusa, I.; Pereira, H. The chemical composition of exhausted coffee waste. Ind. Crops Prod. 2013, 50, 423–429. [Google Scholar] [CrossRef]
- Cervera-Mata, A.; Pastoriza, S.; Rufián-Henares, J.A.; Párraga, J.; Martín-García, J.M.; Delgado, G. Impact of spent coffee grounds as organic amendment on soil fertility and lettuce growth in two Mediterranean agricultural soils. Arch. Agron. Soil Sci. 2018, 64, 790–804. [Google Scholar] [CrossRef]
- Cervera-Mata, A.; Martín-García, J.M.; Delgado, R.; Sánchez-Marañón, M.; Delgado, G. Short-term effects of spent coffee grounds on the physical properties of two Mediterranean agricultural soils. Int. Agrophys. 2019, 33, 205–216. [Google Scholar] [CrossRef]
- Afriliana, A.; Hidayat, E.; Yoshiharu, M.; Taizo, M.; Harada, H. Evaluation of Potency Spent Coffee Grounds for Make Black Compost. E3s Web Conf. 2020, 142, 04002. [Google Scholar] [CrossRef]
- Morikawa, C.K.; Saigusa, M. Recycling coffee grounds and tea leaf wastes to improve the yield and mineral content of grains of paddy rice. J. Sci. Food Agric. 2011, 91, 2108–2111. [Google Scholar] [CrossRef]
- Yamane, K.; Kono, M.; Fukunaga, T.; Iwai, K.; Sekine, R.; Watanabe, Y.; Iijima, M. Field evaluation of coffee grounds application for crop growth enhancement, weed control, and soil improvement. Plant Prod. Sci. 2014, 17, 93–102. [Google Scholar] [CrossRef]
- Kasongo, R.K.; Verdoodt, A.; Kanyankagote, P.; Baert, G.; Van Ranst, E. Coffee waste as an alternative fertilizer with soil improving properties for sandy soils in humid tropical environments. Soil Use Manag. 2011, 27, 94–102. [Google Scholar] [CrossRef]
- Kasongo, R.K.; Verdoodt, A.; Kanyankogote, P.; Baert, G.; Van Ranst, E. Response of Italian ryegrass (Lolium multiflorum Lam.) to coffee waste application on a humid tropical sandy soil. Soil Use Manag. 2013, 29, 22–29. [Google Scholar] [CrossRef]
- Cruz, R.; Baptista, P.; Cunha, S.; Pereira, J.A.; Casal, S. Carotenoids of lettuce (Lactuca sativa L.) grown on soil enriched with spent coffee grounds. Molecules 2012, 17, 1535–1547. [Google Scholar] [CrossRef] [PubMed]
- Cruz, R.; Gomes, T.; Ferreira, A.; Mendes, E.; Baptista, P.; Cunha, S.; Pereira, J.A.; Ramalhosa, E.; Casal, S. Antioxidant activity and bioactive compounds of lettuce improved by espresso coffee residues. Food Chem. 2014, 145, 95–101. [Google Scholar] [CrossRef] [PubMed]
- Cruz, R.; Morais, S.; Mendes, E.; Pereira, J.A.; Baptista, P.; Casal, S. Improvement of vegetables elemental quality by espresso coffee residues. Food Chem. 2014, 148, 294–299. [Google Scholar] [CrossRef] [PubMed]
- Cruz, R.; Mendes, E.; Torrinha, Á.; Morais, S.; Pereira, J.A.; Baptista, P.; Casal, S. Revalorization of spent coffee residues by a direct agronomic approach. Food Res. Int. 2015, 73, 190–196. [Google Scholar] [CrossRef]
- Hardgrove, S.J.; Livesley, S.J. Applying spent coffee grounds directly to urban agriculture soils greatly reduces plant growth. Urban For. Urban Green. 2016, 18, 1–8. [Google Scholar] [CrossRef]
- Ciesielczuk, T.; Rosik-Dulewska, C.; Poluszyńska, J.; Miłek, D.; Szewczyk, A.; Sławińska, I. Acute Toxicity of Experimental Fertilizers Made of Spent Coffee Grounds. Waste Biomass Valorization 2017, 9, 2157–2164. [Google Scholar] [CrossRef]
- Mimmo, T.; Del Buono, D.; Terzano, R.; Tomasi, N.; Vigani, G.; Crecchio, C.; Pinton, R.; Zocchi, G.; Cesco, S. Rhizospheric organic compounds in the soil–microorganism–plant system: Their role in iron availability. Eur. J. Soil Sci. 2014, 65, 629–642. [Google Scholar] [CrossRef]
- Ntalli, N.; Adamski, Z.; Doula, M.; Monokrousos, N. Nematicidal amendments and soil remediation. Plants 2020, 9, 429. [Google Scholar] [CrossRef]
- Monokrousos, N.; Argyropoulou, M.D.; Tzani, K.; Menkissoglou-Spiroudi, U.; Boutsis, G.; D’Addabbo, T.; Ntalli, N. The Effect of Botanicals with Nematicidal Activity on the Structural and Functional Characteristics of the Soil Nematode Community. Agriculture 2021, 11, 326. [Google Scholar] [CrossRef]
- Yeates, G.W.; Bongers, T.; De Goede, R.G.; Freckman, D.W.; Georgieva, S. Feeding habits in soil nematode families and genera—An outline for soil ecologists. J. Nematol. 1993, 25, 315. [Google Scholar]
- Ferris, H. Form and Function: Metabolic Footprints of Nematodes in the Soil Food Web. Eur. J. Soil Biol. 2010, 46, 97–104. [Google Scholar] [CrossRef]
- Ntalli, N.; Menkissoglu-Spiroudi, U.; Doitsinis, K.; Kalomoiris, M.; Papadakis, E.N.; Boutsis, G.; Dimou, M.; Monokrousos, N. Mode of action and ecotoxicity of hexanoic and acetic acids on Meloidogyne javanica. J. Pest Sci. 2020, 93, 867–877. [Google Scholar] [CrossRef]
- S’Jacob, J.J.; van Bezooijen, J. A Manual for Practical Work in Nematology; Department of Nematology, Wageningen Agricultural University: Wageningen, The Netherlands, 1984. [Google Scholar]
- Bongers, T. Systematisch gedeelte. In De Nematoden van Nederland: Vormgeving en technische realisatie, 2nd ed.; Uitgeverij Pirola: Schoorl, The Netherlands, 1994; pp. 67–383. [Google Scholar]
- Bongers, T. The Maturity Index: An Ecological Measure of Environmental Disturbance Based on Nematode Species Composition. Oecologia 1990, 83, 14–19. [Google Scholar] [CrossRef]
- Bongers, T.; Bongers, M. Functional diversity of nematodes. Appl. Soil Ecol. 1998, 10, 239–251. [Google Scholar] [CrossRef]
- Ferris, H.; Bongers, T.; de Goede, R.G.M. A Framework for Soil Food Web Diagnostics: Extension of the Nematode Faunal Analysis Concept. Appl. Soil Ecol. 2001, 18, 13–29. [Google Scholar] [CrossRef]
- Sieriebriennikov, B.; Ferris, H.; de Goede, R.G.M. NINJA: An automated calculation system for nematode-based biological monitoring. Eur. J. Soil Biol. 2014, 61, 90–93. [Google Scholar] [CrossRef]
- Chyla, M.A.; Zyrnicki, W. Determination of metal concentrations in animal hair by the ICP method: Comparison of various washing procedures. Biol. Trace Elem. Res. 2000, 75, 187–194. [Google Scholar] [CrossRef]
- Wolf, B. Communications in Soil Science and Plant Analysis Improvements in the azomethine—H method for the determination of boron. Commun. Soil Sci. Plant Anal. 1974, 5, 37–41. [Google Scholar] [CrossRef]
- Mangalassery, S.; Sjögersten, S.; Sparkes, D.L.; Sturrock, C.J.; Mooney, S.J. The effect of soil aggregate size on pore structure and its consequence on emission of greenhouse gases. Soil Tillage Res. 2013, 132, 39–46. [Google Scholar] [CrossRef]
- Schlüter, S.; Gil, E.; Doniger, T.; Applebaum, I.; Steinberger, Y. Abundance and Community Composition of Free-Living Nematodes as a Function of Soil Structure under Different Vineyard Managements. Appl. Soil Ecol. 2022, 170, 104291. [Google Scholar] [CrossRef]
- Talavera, M.; Thoden, T.C.; Vela-Delgado, M.D.; Verdejo-Lucas, S.; Sánchez-Moreno, S. The impact of fluazaindolizine on free-living nematodes and the nematode community structure in a root-knot nematode infested vegetable production system. Pest Manag. Sci. 2021, 77, 5220–5227. [Google Scholar] [CrossRef] [PubMed]
- Ntalli, N.; Tsiafouli, M.A.; Tzani, K.; Mavridi, O.; Oplos, C.; Menkissoglu-Spiroudi, U.; Monokrousos, N. Whey: The soil bio-community enhancer that selectively controls root-knot nematodes. Plants 2019, 8, 445. [Google Scholar] [CrossRef] [PubMed]
- Perry, R.N.; Moens, M. Survival of parasitic nematodes outside the host. In Genomics and Molecular Genetics of Plant-Nematode Interactions; Springer: Dordrecht, The Netherlands, 2011. [Google Scholar]
- Janissen, B.; Huynh, T. Chemical composition and value-adding applications of coffee industry by-products: A. review. Resour. Conserv. Recycl. 2018, 128, 110–117. [Google Scholar] [CrossRef]
- Gebremikael, M.T.; Steel, H.; Buchan, D.; Bert, W.; De Neve, S. Nematodes enhance plant growth and nutrient uptake under C and N-rich conditions. Sci. Rep. 2016, 6, 32862. [Google Scholar] [CrossRef]
- Liu, T.; Yu, L.; Xu, J.; Yan, X.; Li, H.; Whalen, J.K.; Hu, F. Bacterial traits and quality contribute to the diet choice and survival of bacterial-feeding nematodes. Soil Biol. Biochem. 2017, 115, 467–474. [Google Scholar] [CrossRef]
- Ferris, H.; Venette, R.; Scow, K. Soil management to enhance bacterivore and fungivore nematode populations and their nitrogen mineralisation function. Appl. Soil Ecol. 2004, 25, 19–35. [Google Scholar] [CrossRef]
- Bongiorno, G.; Bodenhausen, N.; Bunemann, E.K.; Brussaard, L.; Geisen, S.; Mader, P.; Quist, C.W.; Walser, J.C.; de Goede, R.G.M. Reduced tillage, but not organic matter input, increased nematode diversity and food web stability in European long-term field experiments. Mol. Ecol. 2019, 28, 4987–5005. [Google Scholar] [CrossRef]
- Wardle, D.A.; Bardgett, R.D.; Klironomos, J.N.; Setala, H.; van der Putten, W.H.; Wall, D.H. Ecological Linkages between aboveground and belowground biota. Science 2004, 304, 1629–1633. [Google Scholar] [CrossRef]
- de Graaff, M.-A.; Classen, A.T.; Castro, H.F.; Schadt, C.W. Labile soil carbon inputs mediate the soil microbial community composition and plant residue decomposition rates. New Phytol. 2010, 188, 1055–1064. [Google Scholar] [CrossRef]
- Vries, F.T.; de Bloem, J.; Quirk, H.; Stevens, C.J.; Bol, R.; Bardgett, R.D. Extensive management promotes plant and microbial nitrogen retention in temperate grassland. PLoS ONE 2012, 7, e51201. [Google Scholar] [CrossRef]
- Ugarte, C.M.; Zaborski, E.R.; Wander, M.M. Nematode indicators as integrative measures of soil condition in organic cropping systems. Soil Biol. Biochem. 2013, 64, 103–113. [Google Scholar] [CrossRef]
- Holtkamp, R.; Kardol, P.; Van der Wal, A.; Dekker, S.C.; Van der Putten, W.H.; de Ruiter, P.C. Soil food web structure during ecosystem development after land abandonment. Appl. Soil Ecol. 2008, 39, 23–34. [Google Scholar] [CrossRef]
- Zhang, Z.Y.; Zhang, X.K.; Xu, M.G.; Zhang, S.Q.; Huang, S.M.; Liang, W.J. Responses of soil micro-food web to long-term fertilization in a wheat-maize rotation system. Appl. Soil Ecol. 2016, 98, 56–64. [Google Scholar] [CrossRef]
- Guan, P.T.; Zhang, X.K.; Yu, J.; Cheng, Y.Y.; Li, Q.; Andriuzzi, W.S.; Liang, W.J. Soil microbial food web channels associated with biological soil crusts in desertification restoration: The carbon flow from microbes to nematodes. Soil Biol. Biochem. 2018, 116, 82–90. [Google Scholar] [CrossRef]
- Szili-Kovács, T.; Török, K.; Tilston, E.L.; Hopkins, D.W. Promoting microbial immobilization of soil nitrogen during restoration of abandoned agricultural fields by organic additions. Biol. Fertil. Soils 2007, 43, 823–828. [Google Scholar] [CrossRef]
- Nisa, R.U.; Tantray, A.Y.; Kouser, N.; Allie, K.A.; Wani, S.M.; Alamri, S.A.; Alyemeni, M.N.; Wijaya, L.; Shah, A.A. Influence of ecological and edaphic factors on biodiversity of soil nematodes. Saudi J. Biol. Sci. 2021, 28, 3049–3059. [Google Scholar] [CrossRef]
- Badra, T.; Elgindi, D.M. The relationship between phenolic content and Tylenchulus semipenetrans populations in nitrogen-amended citrus plants. Rev. De Nematol. 1979, 2, 161–164. [Google Scholar]


Publisher’s Note: MDPI stays neutral with regard to jurisdictional claims in published maps and institutional affiliations. |
© 2022 by the authors. Licensee MDPI, Basel, Switzerland. This article is an open access article distributed under the terms and conditions of the Creative Commons Attribution (CC BY) license (https://creativecommons.org/licenses/by/4.0/).