Article

Effects of the Decomposition of Mixed Plant Residues in Ecological Tea Garden Soil

College of Forestry, Guizhou University, Guiyang 550025, China
*
Author to whom correspondence should be addressed.
Agronomy 2022, 12(11), 2717; https://doi.org/10.3390/agronomy12112717
Submission received: 30 September 2022 / Revised: 28 October 2022 / Accepted: 29 October 2022 / Published: 2 November 2022
(This article belongs to the Section Soil and Plant Nutrition)

Abstract

:
(1) Background: Plant litter decomposition and its effect on soil nutrients are important parts of the ecosystem material cycle, and understanding these processes is key for species selection and allocation, to promote the effective use of litter in ecological tea gardens. (2) Methods: In situ decomposition was used in this study Changes in decomposition rate, element release, and soil properties during the decomposition of the mixed plant residues were measured. (3) Results: The decomposition rate (k) of the CCG (Camellia sinensis + Cinnamomum glanduliferum) mixed plant residue was significantly higher than that of the CS (Camellia sinensis) residue. The decomposition of the CCG, CPM (C. sinensis + Pinus massoniana), and CBL (C. sinensis + Betula luminifera) mixed plant residues showed an additive effect, whereas that of the CCL residue showed an antagonistic effect. The CBL mixed plant residue promoted the release of N; the decomposition of the CCG, CPM, CCL (C. sinensis + Cunninghamia lanceolata), and CBL residues promoted the release of TC (total carbon); and the decomposition of the CCG residue promoted the release of cellulose. After 428 d of decomposition, the four mixed plant residues had improved the soil nutrient contents to some extent. CCG and CBL residue decomposition resulted in greater improvements in soil nutrients. (4) Conclusions: The application of the mixture of material obtained by pruning C. glanduliferum, B. luminifera, and C. sinensis in an ecological tea garden accelerated the decomposition and nutrient release rates, increased soil nutrient contents, shortened the decomposition turnover period of plant residues, and accelerated the nutrient cycle of plant residues in the ecological tea garden.

1. Introduction

Plant residues make up an important nutrient pool in forest ecosystems. Nutrient release during decomposition plays an irreplaceable role in maintaining soil fertility, providing nutrients for plant growth, material circulation, and energy flow in the ecosystem [1]. In ecosystems, plant residues generally exist in the form of a mixture, which not only forms an environment for decomposition, but also affects specific microbial communities that feed on plant residues and the rate of plant residue decomposition and nutrient cycling. The release of elements during the decomposition of different plant residues, especially mixed plant residues, has a significant effect on soil characteristics and nutrients, and there is obvious mutual regulation between the nutrient contents of plant residues and soil properties [2,3]. Related studies have shown that the decomposition of mixed plant residues can promote the decomposition rate and release of elements [4], and its effect on improving soil nutrients is better than that of single plant residues [5,6]. However, mixed decomposition is not simply the accumulation of single plant residue decomposition; rather, extremely complex physical and chemical changes occur in the process of mixed decomposition, resulting in changes in biological processes.
Camellia sinensis is an important perennial woody evergreen plant in subtropical areas, and it is an economically important plant cultivated by humans. In the management of tea gardens, soil quality is gradually degraded as tea is repeatedly planted over many years, resulting in the occurrence of many diseases and insect pests, low yield and quality, high agricultural residues, and so on. The long-term growth of a single tree species lead to selective absorption, utilization, and return of soil nutrients (mainly litter decomposition) in woodland soil, inevitably leading to other polarizing conditions, such as nutrient imbalance, pH reduction, and changes in cation exchange capacity, thus reducing the stability of forest communities [7]. Therefore, following ecological principles to construct ecological tea gardens according to local conditions, promoting the revitalization of the green industry in tea gardens, and achieving improvements in the quality and efficiency of the tea industry have become main objectives in the management and construction of modern tea gardens. At present, there are many studies on the decomposition of mixed plant residues that can guide mixed forest construction and regulation, but there are few reports on the allocation and transformation of different plant combinations in the construction of ecological tea gardens.
In this study, an in situ decomposition method was used. Plant residues (obtained by pruning C. sinensis and collecting leaf litter from Cinnamomum glanduliferum, Betula luminifera, Cunninghamia lanceolata, and Pinus massoniana) from the Guizhou Jiu’an ecological tea garden were investigated, and the decomposition process of plant residues buried in the tillage soil layer was simulated to explore the decomposition rates and dynamic changes in element release and soil properties, revealing the elements released by the mixed decomposition of plant residues in ecological tea gardens and identifying the response mechanisms of soil properties. The results of this investigation will enrich the theory and practice of plant residue decomposition and provide data and a theoretical reference to support the study of the material cycle.

2. Materials and Methods

2.1. Study Area

The experimental area was located in Jiu’an township, Huaxi district, Guiyang city, Guizhou Province, China. The latitude ranged from N 26°31′8″ to 26°31′12″, and the longitude ranges from E 106°36′47″ to 106°36′50″ (Figure 1). The average annual temperature was 13.6 °C, the frost-free period was 260 d, average annual rainfall was 1000–1150 mm, elevation range was 1100–1446 m, the area had a subtropical plateau monsoon climate, and the soil type was mainly Orthic Acrisols. The main species in the ecological tea gardens were P. massoniana, C. lanceolata, C. glanduliferum, and B. luminifera.

2.2. Test Method

Plant residue collection: Material from C. sinensis pruning (including branches and leaves) were collected from the Jiu’an ecological tea garden in Huaxi, Guizhou Province, China. At the same time, leaf litter from P. massoniana, C. lanceolata, C. glanduliferum, and B. luminifera (collocated tree species in the tea garden) were collected.
Plant residue processing: Plant residues from the same tree species were evenly mixed and transported to the laboratory to dry at 65 °C to a constant weight.
Experimental method: By using the in situ decomposition method, plant residues dried to constant weight were placed into decomposition bags (size: 35 × 25 cm, pore diameter of 1 mm), with each bag divided into 40 g. The single treatment consisted of only C. sinensis (CS) residues, and the four mixed treatments (mixed at 1:1 in this study) consisted of C. sinensis-C. glanduliferum (CCG), C. sinensis-P. massoniana (CPM), C. sinensis-C. lanceolata (CCL), and C. sinensis-B. luminifera (CBL) residues. Decomposition bags were recovered every 2 months for a total of 6 recoveries during the entire research study; 3 bags were recovered from the same treatment each time, and a total of 18 bags were recovered from the same plant residue type. There were five kinds of treatments in the experimental design, and a total of 90 bags of samples were recovered. Before burying the bags, 3 bags of each treatment were left for inceptive nutrient analysis, for a total of 105 bags of samples. The inceptive nutrient contents of the plant residues were determined (Table 1).
Test layout: A decomposition field (range: 5 × 10 m) was set up in the flat and vegetation-free region in the Jiu’an ecological tea garden. The decomposition bags prepared in advance were placed in the decomposition field and buried in the soil layer between the rows of tea plants in the ecological tea garden at a depth of 20–25 cm, and then covered with the original soil. Each row was planted with the same plant residue type, and each decomposition bag was separated by 10 cm when placed. They were spread out in parallel and did not overlap with one another, to simulate a natural state. A row without a landfill of plant residues was selected as the control treatment for the experiment (Figure 2).

2.3. Decomposition Bag Collection and Index Testing

Decomposition bag collection: After the decomposition bags were arranged, they were taken every 2 months (we failed to recover the decomposition bags for the fourth sampling because of restrictions related to COVID-19, so the fourth decomposition stage was after 4 months, i.e., 184–305 d). Three bags were randomly removed for each plant residue type. After collecting decomposition bags and removing the roots and residues of other plants from the decomposition bags, the samples were dried to a constant mass in an oven at 65 °C, and dry mass data were recorded.
Soil sample collection: The soil samples were collected when the experiment was established and during the recovery of decomposition bags for a total of 7 times during the entire research study. When collecting the soil, the soil around the decomposition bags was collected according to the 5-point sampling method. Three bags were collected from the same treatment each sampling period, for a total of 21 bags of soil samples from 6 kinds of treatments (including 5 plant residue treatments and a control treatment), and a total of 126 bags were collected during the entire research study.
Index test: Plant residue chemical properties included contents of total carbon (TC), total nitrogen (TN), total phosphorus (TP), total potassium (TK), lignin, and cellulose. Soil chemical properties included the contents of soil organic carbon (SOC), soil total nitrogen (STN), soil total phosphorus (STP), soil total potassium (STK), soil hydrolyzed nitrogen (SAN), soil available phosphorus (SAP), and soil available potassium (SAK).
Index test methods: The concentrated sulfuric acid-potassium dichromate method was used to measure the carbon (C) contents, the semi-trace Kjeldahl method was used to measure the N contents, molybdenum-antimony anti-colorimetry was used to measure the P contents, and flame spectrophotometry was used to measure the potassium (K) contents. The contents of lignin and cellulose were determined using a biochemical kit from Beijing Solarbio Science & Technology Co., Ltd., Beijing, China.

2.4. Data Analysis

(1) Plant residue decomposition rate:
D = 1 M t / M 0 × 100 %
where D represents the decomposition rate of the plant residue, %; Mt represents the dry mass of the remaining sample of plant residue in the bag during sampling at time t, g; and M0 represents the initial dry mass of the plant residue without decomposition, g.
(2) Plant residue rate:
R = ( M t / M 0 ) × 100 %
where R represents the plant residue rate, %; Mt represents the dry mass of the remaining sample of plant residue in the bag during sampling at time t, g; and M0 represents the initial dry mass of the plant residue without decomposition, g.
(3) The decomposition coefficient in the Olson exponential model y = a e k t [8] is often used to describe the plant residue decomposition rate, where y represents the plant residue rate, %; k represents the decomposition coefficient; α is a fit parameter; and t represents the decomposition time of the plant residue, d.
(4) Decomposition half-life (50% decomposition):
t 0.5 = l n 0.5 / k
Decomposition turnover period (95% decomposition):
t 0.95 = l n 0.05 / k
(5) Nutrient release rate of plant residue:
E = C 0 × M 0 C t × M t / C 0 × M 0 × 100 %
where E represents the nutrient release rate of plant residue, %; C0 represents the initial nutrient content of the plant residue when it is not decomposed, g·kg−1; Ct represents the nutrient content of the remaining sample of plant residue in the bag during sampling at time t, g·kg−1; M0 represents the initial dry mass of the plant residue without decomposition, g; and Mt represents the dry mass of the remaining sample of plant residue in the bag during sampling at time t, g. When E is positive, net release occurs, and when E is negative, net enrichment occurs.
(6) Calculation of expected values of decomposition rate and nutrient release rate:
k w = 1 / 2  ×  k 1 + 1 / 2  ×  k 2
where kw represents the expected value of the decomposition rate and nutrient release rate; k1 represents the decomposition rate and nutrient release rate of species 1; k2 represents the decomposition rate and nutrient release rate of species 2; and 1/2 represents the weight ratio of two species in the mixed plant residue.

2.5. Data Processing

Data management and analysis were completed using SPSS 22.0 software (version number: 22.0.0.0.202), graphs were created using Origin 2018 software (version number: 9.5), and the plant residue decomposition curve was fitted by nonlinear regression analysis. The significance of the plant residue decomposition rate and nutrient content was tested by one-way ANOVA. The significant differences between the measured and expected values of the mass decomposition rate and nutrient release rate of the mixed plant residue were tested by independent t-tests. If there was a significant difference between the measured and expected values (p < 0.05), it indicated that there was a nonadditive effect among the components of the mixed plant residue. If the measured value was greater than the expected value, the nonadditive effect was positive (i.e., a synergistic effect), whereas a negative value indicated an antagonistic effect. If the difference between the measured and expected values was not significant (p > 0.05), there was an additive effect among the components of the mixed plant residue [9].

3. Results

3.1. Dynamic Change in the Mixed Decomposition Rate

3.1.1. Decomposition Rate

The decomposition rates of different plant residues in the ecological tea gardens varied with the passage of time (Figure 3). The five types of plant residues rapidly decomposed at the initial stage of decomposition, and the decomposition rates of the five types of plant residues significantly decreased after 62 d. The decomposition rates of the CCG and CBL treatments were the highest, that of the CS treatment was the second highest, and those of the CPM and CCL treatments were lowest, indicating that the addition of a broad-leaved plant residue decomposed more easily than the addition of a coniferous plant residue.

3.1.2. Decomposition Rate (k)

The results of the regression analysis showed that the correlation coefficients of the five kinds of plant residues reached very significant levels (Table 2). The decomposition rate (k) was higher in the CCG, CS, and CBL treatments, but lower in the CCL and CPM treatments. The half-life and turnover period of the CCG, CS, and CBL treatments were lower, whereas those of the CCL and CPM treatments were higher, which further indicated that the decomposition rates of residue from broad-leaved and coniferous trees differ during mixed decomposition. The half-lives of the five kinds of plant residues were longer than 1 year but less than 2 years, and the turnover period was more than 5 years, which has important implications for soil nutrient management in ecological tea gardens; that is, the contribution of plant residues to soil nutrients occurs mainly in the first two years, and the contribution rates of different species vary, which is of great significance to the allocation of plants in tea gardens.

3.2. Dynamics of Element Release in the Process of Mixed Decomposition

3.2.1. Dynamic Changes in Nutrient Contents of Plant Residues

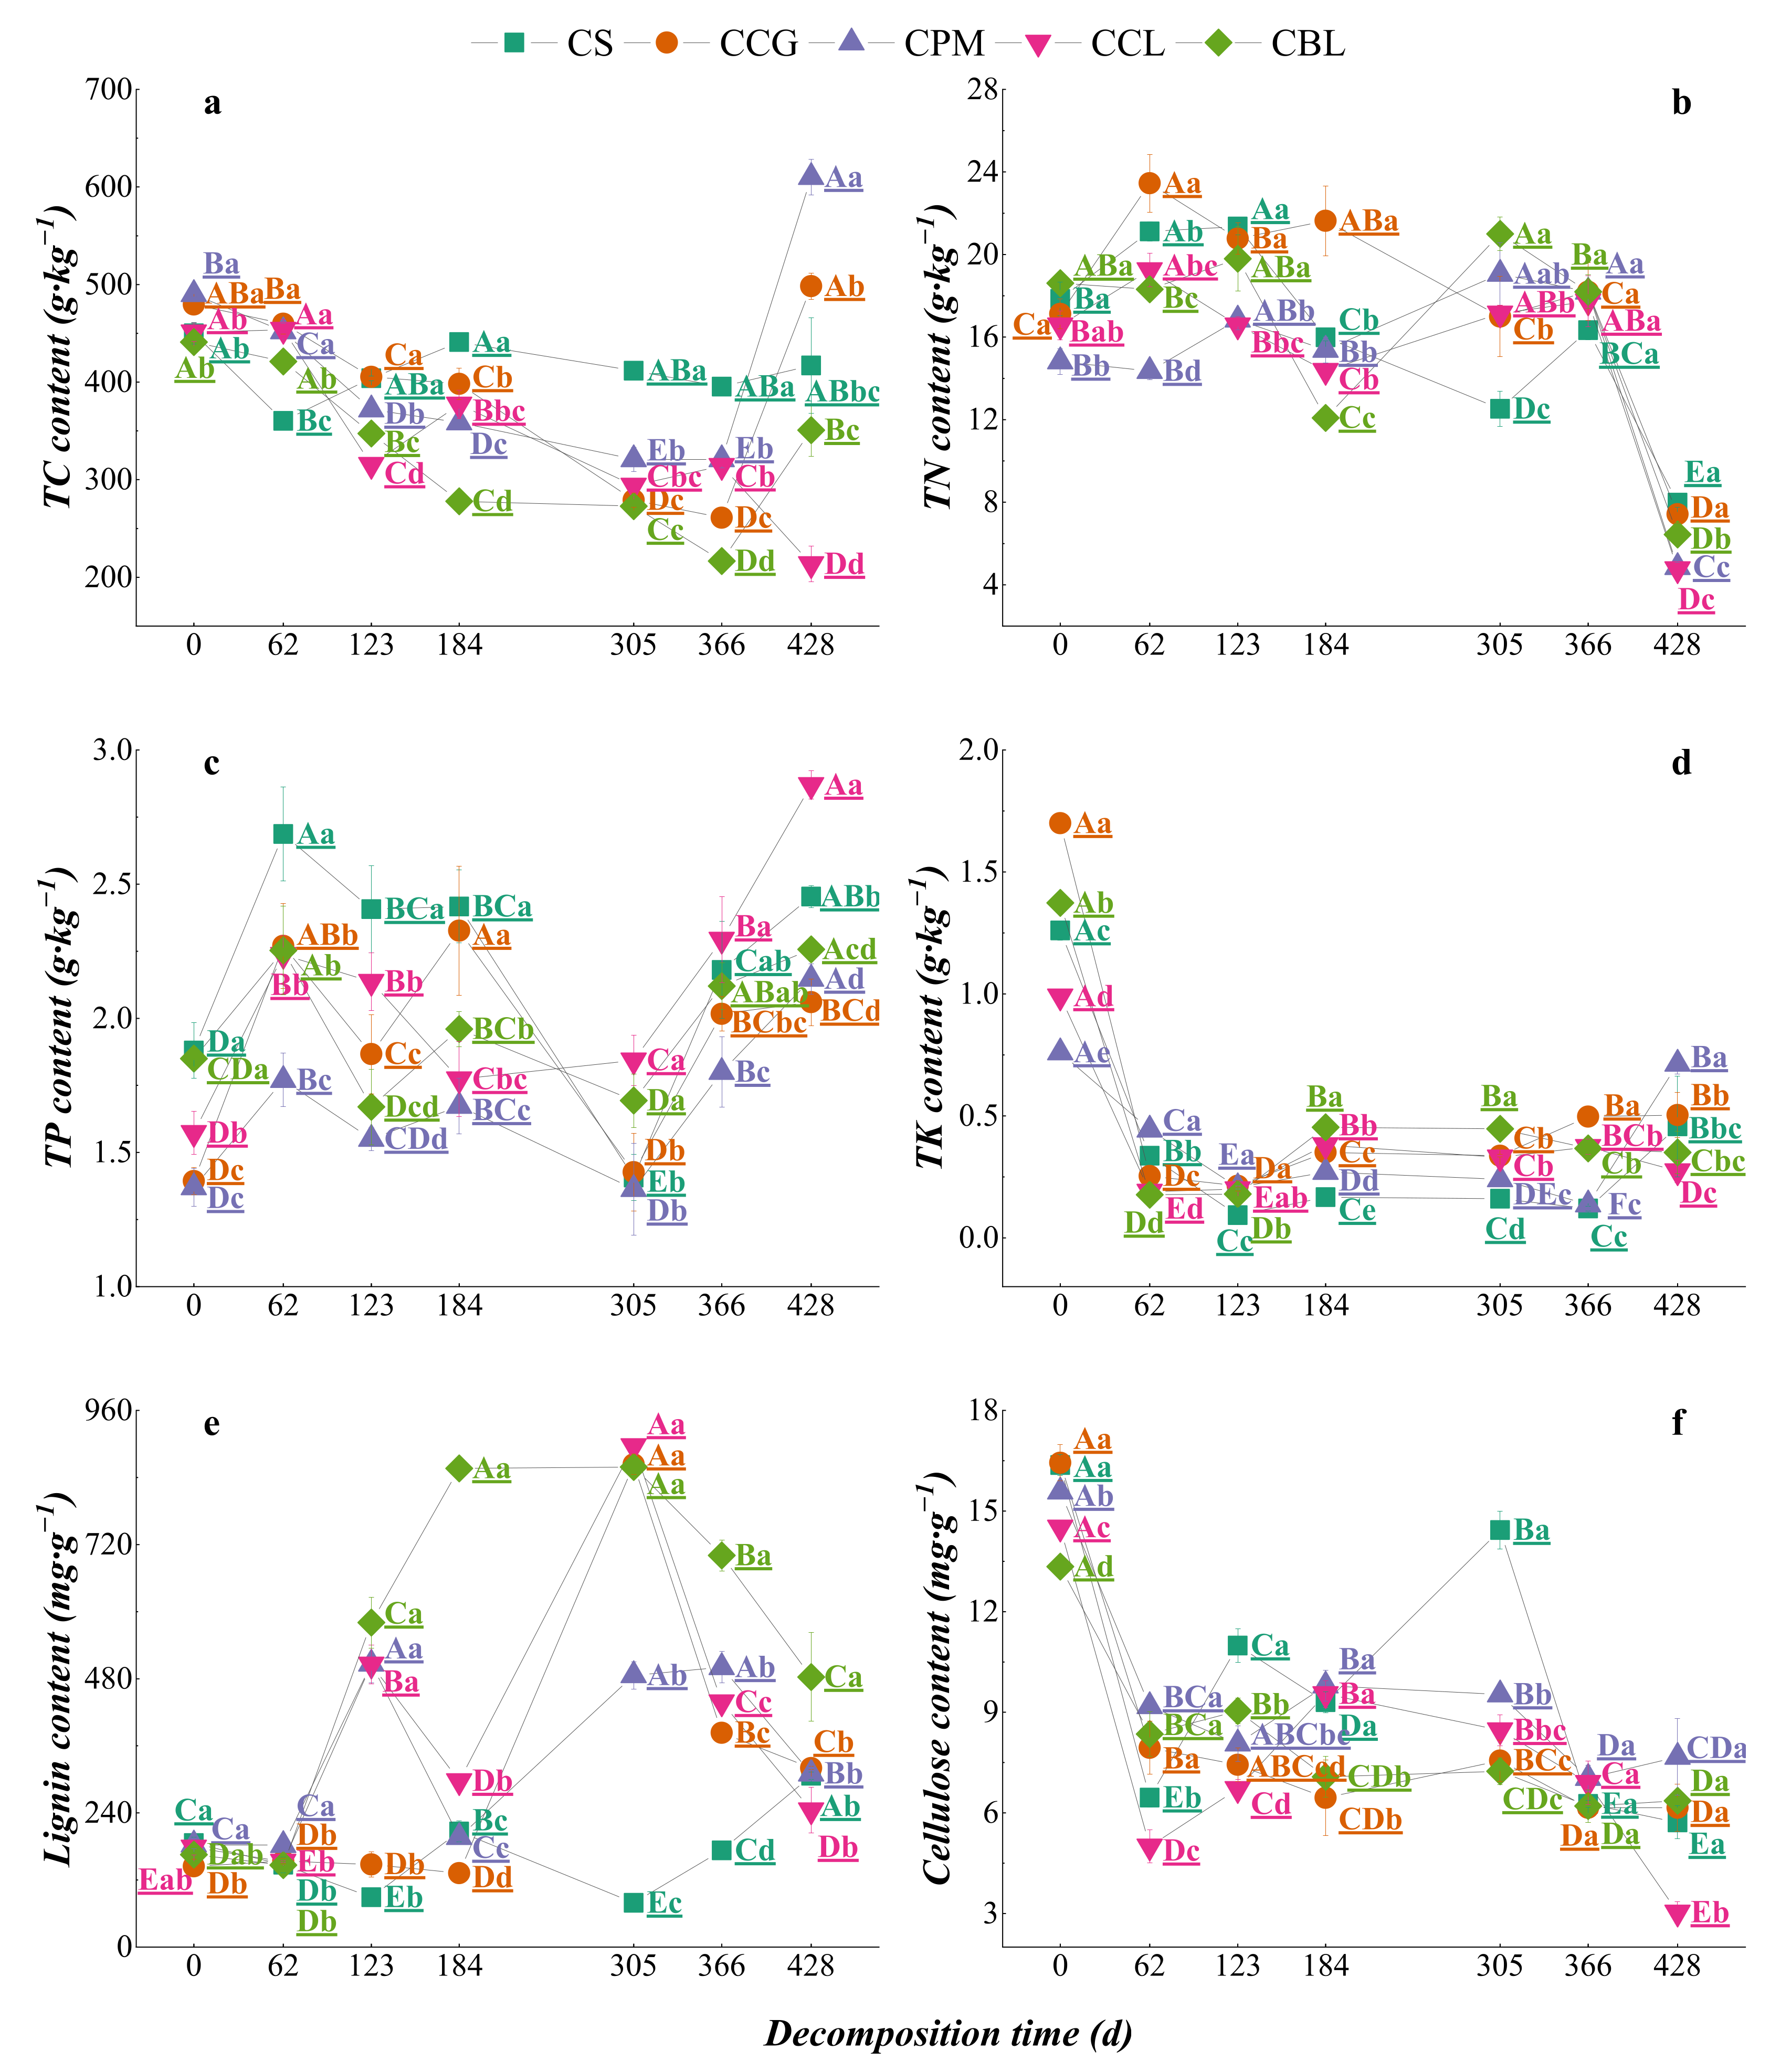
In the process of decomposition, the TC contents in the five kinds of plant residues showed two trends (Figure 4a). The TC content in the CS, CCG, CBL, and CPM treatments first decreased and then increased, following a “V” shape, whereas the TC content in the CCL treatment showed a decreasing-increasing-decreasing trend, following an “N” shape. Throughout the decomposition process, the range of change in TC contents in the CS treatment was smaller than that of the mixed plant residues. After 428 d of decomposition, the TC content in the CPM treatment was significantly higher than that of the undecomposed residues (p < 0.05).
There were three trends of TN contents in the five kinds of plant residues during decomposition (Figure 4b). The change trend of TN contents in the CS and CCL treatments followed an “M” shape (i.e., increase-decrease-increase-decrease), the TN contents in the CCG and CPM treatments followed an inverted “V” shape (i.e., increase-decrease), and the change in TN content in the CBL treatment during the decomposition process followed a “V” shape. At the end of the experiment, TN contents in the five kinds of plant residues were significantly lower than TN contents in the undecomposed residues (p < 0.05).
The change trend of TP contents in the five plant residue types can also be roughly divided into two types (Figure 4c). During the decomposition process, the dynamic changes in TP contents in the CS, CCL, and CPM treatments followed an “N” shape. The TP contents in the CBL and CCG treatments followed a fluctuating trend (i.e., an increasing-decreasing-increasing-increasing-increasing trend). After 428 d of decomposition, the TP contents in the five kinds of plant residues were significantly higher than that of the undecomposed residues (p < 0.05).
The dynamic changes in the TK contents of the five kinds of plant residues were basically the same, and on the whole, they all decreased at first and then increased (Figure 4d). After 428 d of decomposition, the TK content of each plant residue was significantly lower than that of the undecomposed residues (p < 0.05).
In the process of decomposition, there were some differences in lignin contents between single plant residues and mixed plant residues (Figure 4e). Overall, the lignin contents in the four kinds of mixed plant residues first gradually decreased, then rapidly increased, and then rapidly decreased, whereas the lignin content in the single plant residues (CS) followed a “W” shape. After 428 d of decomposition, the lignin contents in the five kinds of plant residues were significantly higher than that of the undecomposed residues (p < 0.05).
The change trend of cellulose contents during the decomposition of the five kinds of plant residues can be roughly divided into two categories (Figure 4f). Among them, the dynamic change trends of cellulose contents in the plant residues of the CS, CPM, and CCL categories were similar and were characterized by first decreasing, then increasing, and then decreasing, whereas that of the CCG and CBL categories gradually decreased. After 428 d of decomposition, the cellulose contents in the five kinds of plant residues were significantly lower than initial values (p < 0.05).

3.2.2. Dynamic Changes in Nutrient Release from Plant Residues

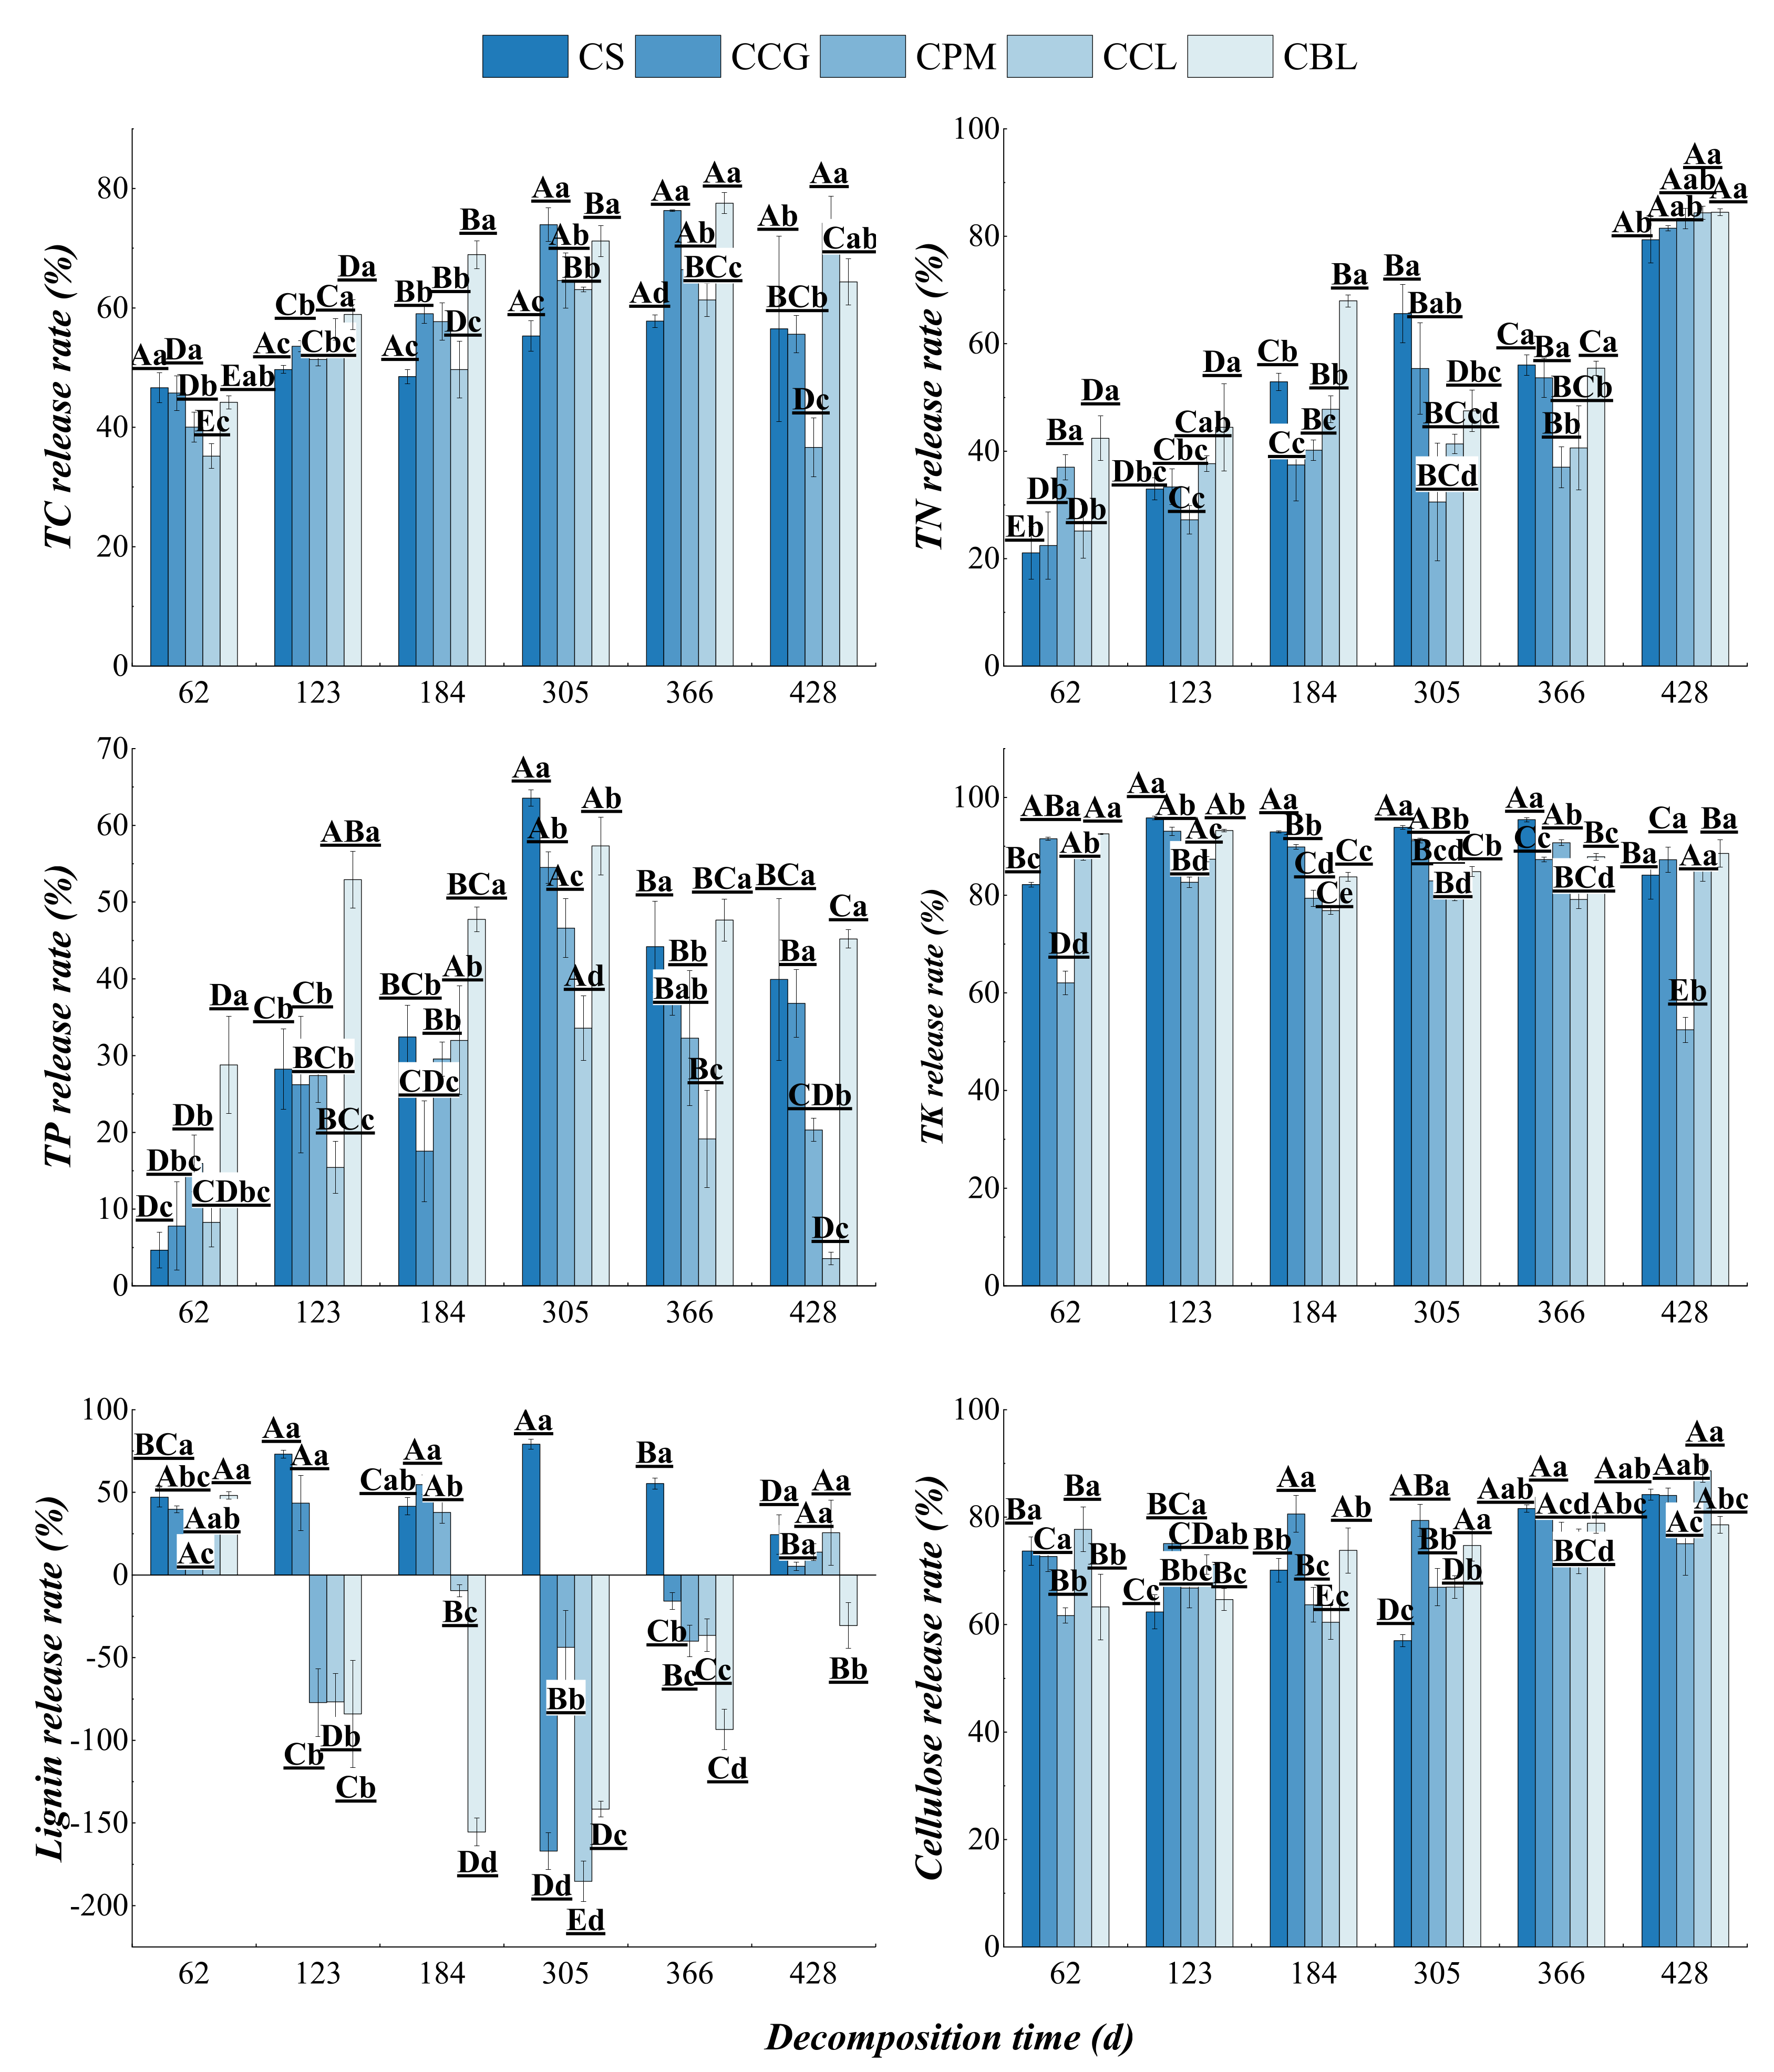
In the process of decomposition, there were some differences in nutrient release rates among the different plant residue types (Figure 5). The release patterns of TC, TN, TP, TK, and cellulose in the five plant residues were all direct release. There were great differences in lignin release patterns among the five kinds of plant residues: in the CS treatment, lignin was directly released; in the CCG and CCL treatments, lignin followed a leaching-enrichment-release pattern; in the CPM treatment, lignin followed a leaching-enrichment-release-enrichment-release pattern; and in the CBL treatment, a leaching-enrichment pattern was observed.

3.3. Dynamics of Element Changes in Topsoil DDuring Plant Residue Decomposition

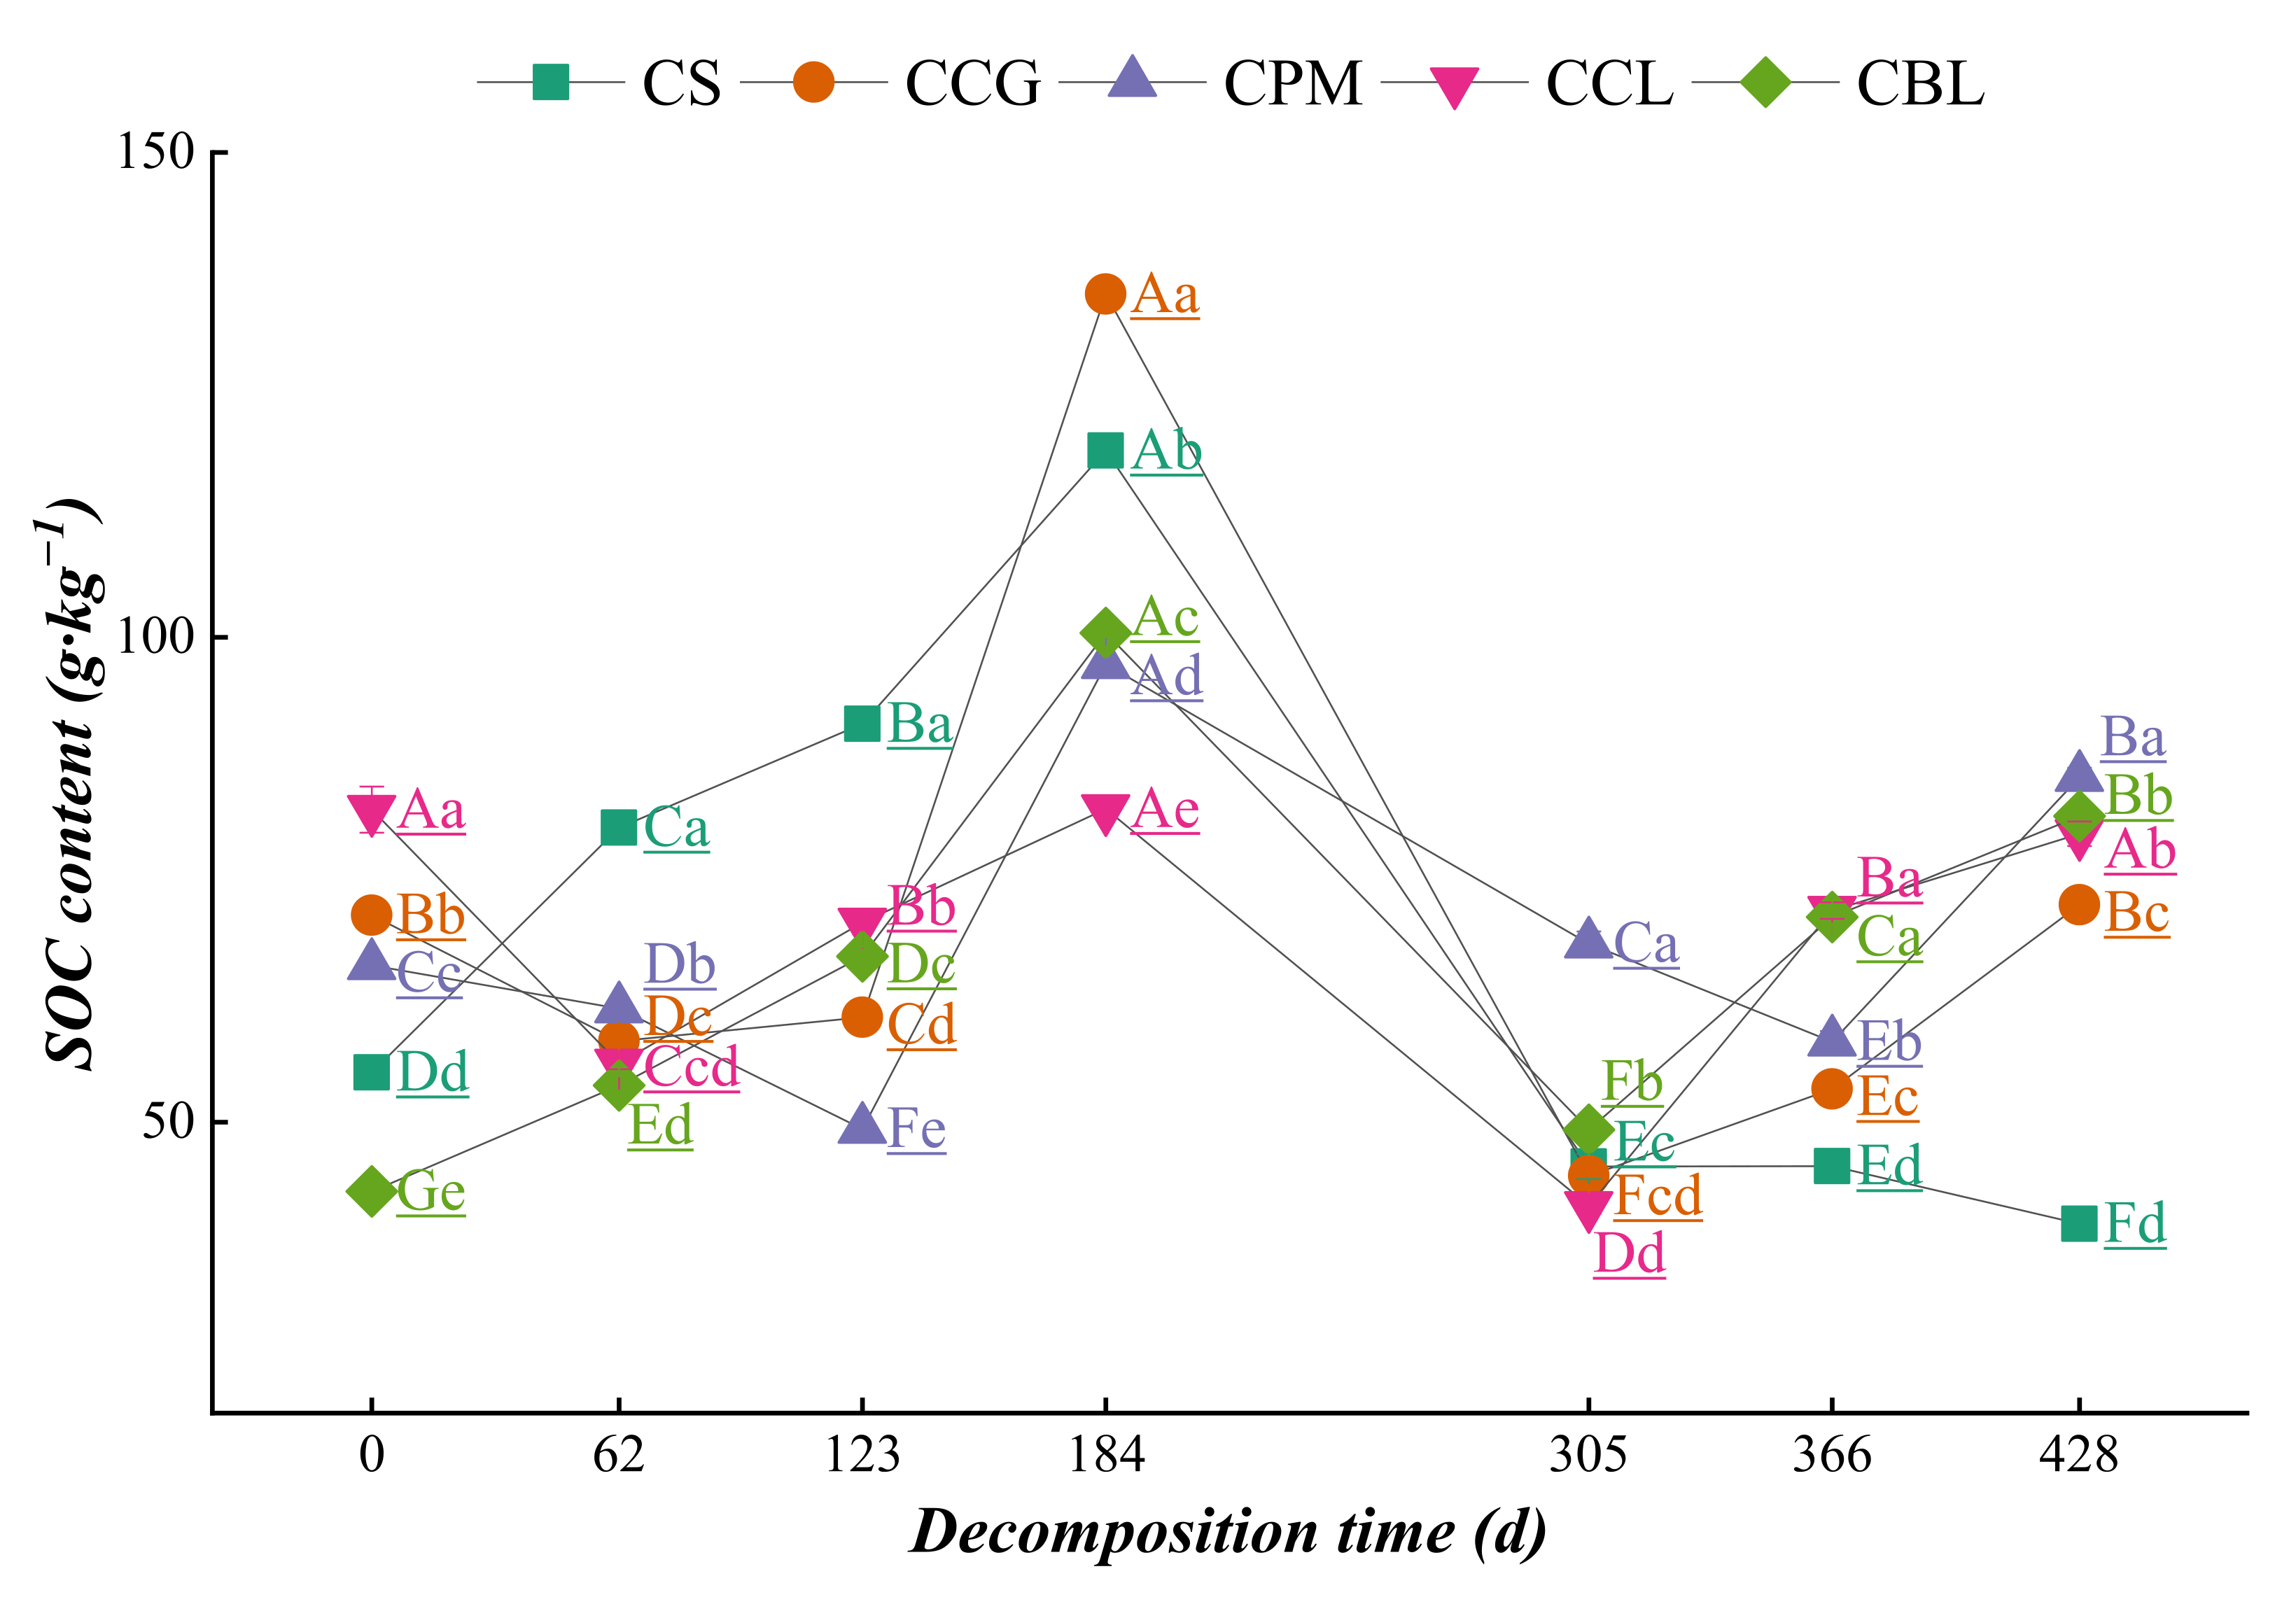
The SOC contents of the five kinds of plant residues increased to a certain extent during decomposition compared with that of the undecomposed residues (Figure 6). Overall, the change trend in SOC contents in the four kinds of mixed plant residue treatments followed an “N” shape (i.e., increase-decrease-increase), whereas the change in SOC content during the decomposition of the CS plant residue followed an inverted “V” shape (i.e., increase-decrease), indicating that the effect of mixed plant residue decomposition on SOC contents was different from that of single plant residue decomposition.
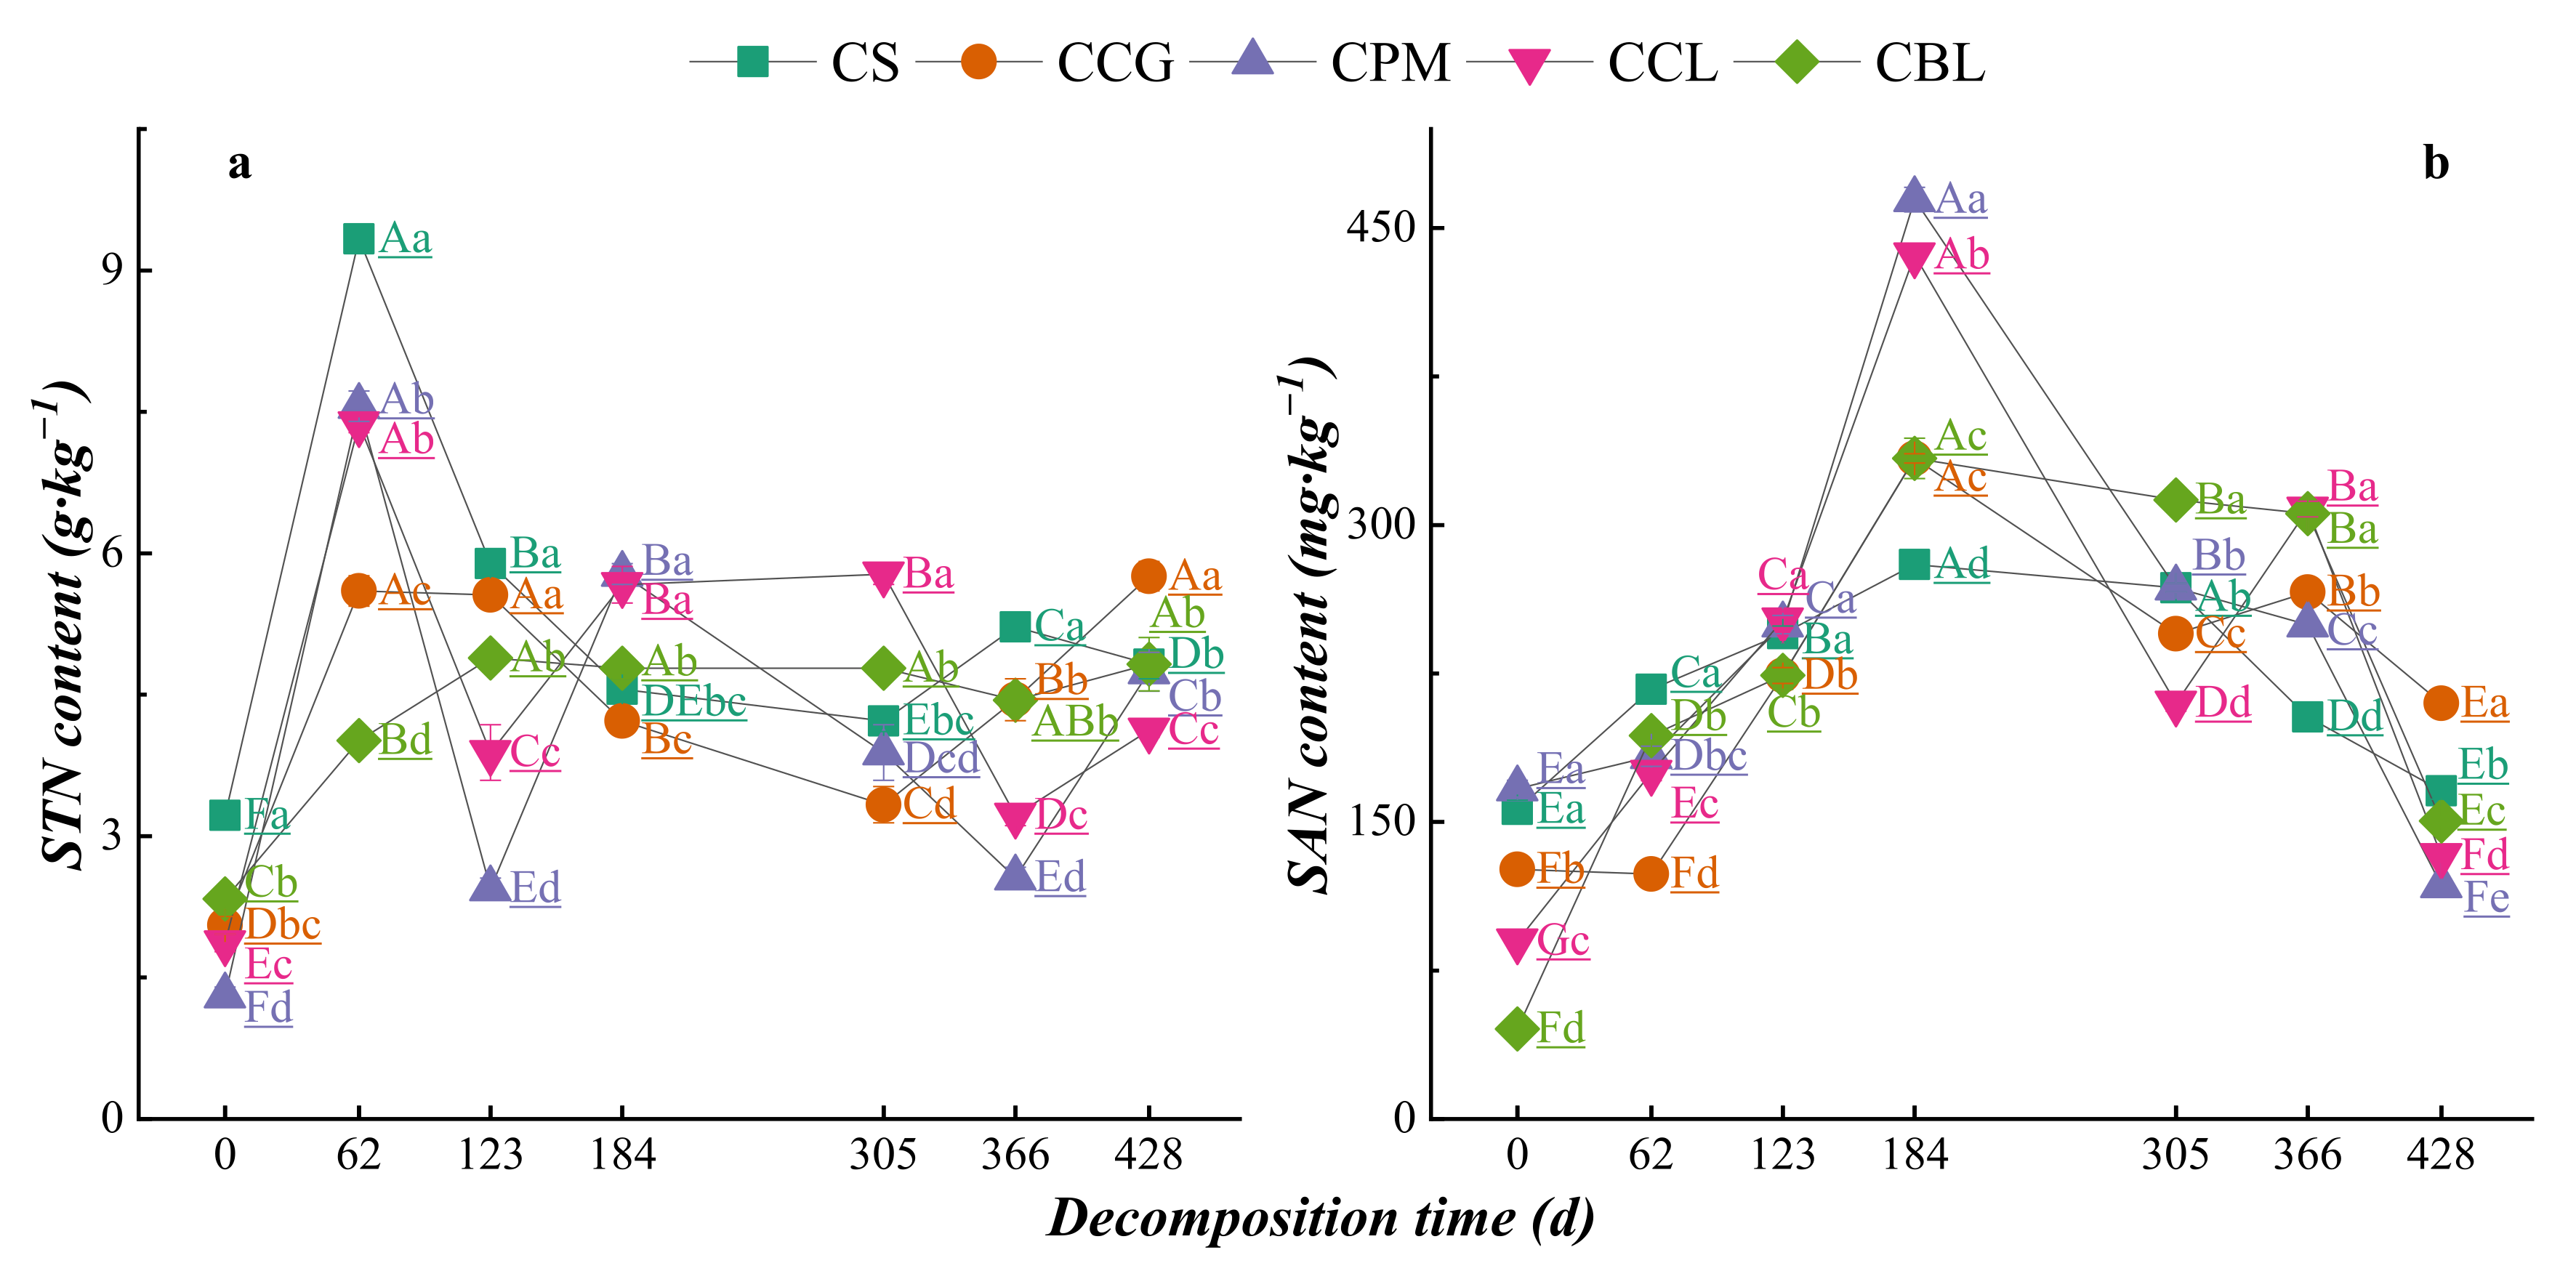
The contents of soil N fluctuated during the decomposition of the five different types of plant residue, and the contents of soil N at different decomposition stages was higher than the initial content (Figure 7). Throughout the decomposition period, the STN contents increased as the five plant residue types decomposed. In the early stage of decomposition (62 d), the contents of STN rapidly increased during the decomposition of the CS, CCL, and CPM residues, whereas the contents of STN in the CCG and CBL residues slowly increased. In the process of decomposition, the change ranges of STN contents in the CPM and CCL treatments were larger, whereas those in the CS, CCG, and CBL treatments were smaller. After 428 d of decomposition, the contents of STN in the CCG and CBL plant residue treatments were significantly higher than that of the CS treatment (p < 0.05). During the decomposition of the five plant residue types, the change in SAN contents showed two trends: the change in the CPM, CBL, and CS treatments followed an inverted “V” shape, whereas that of the CCL and CCG treatments followed an “M” shape. The SAN contents in the four kinds of mixed plant residues increased faster, whereas that of the CS residues slowly increased in the early stage of decomposition (0–184 d), and the contents of SAN peaked at 184 d in the five plant residue treatments. After 428 d of decomposition, the SAN contents in the CCG treatment was significantly higher than that of the CS treatment (p < 0.05).
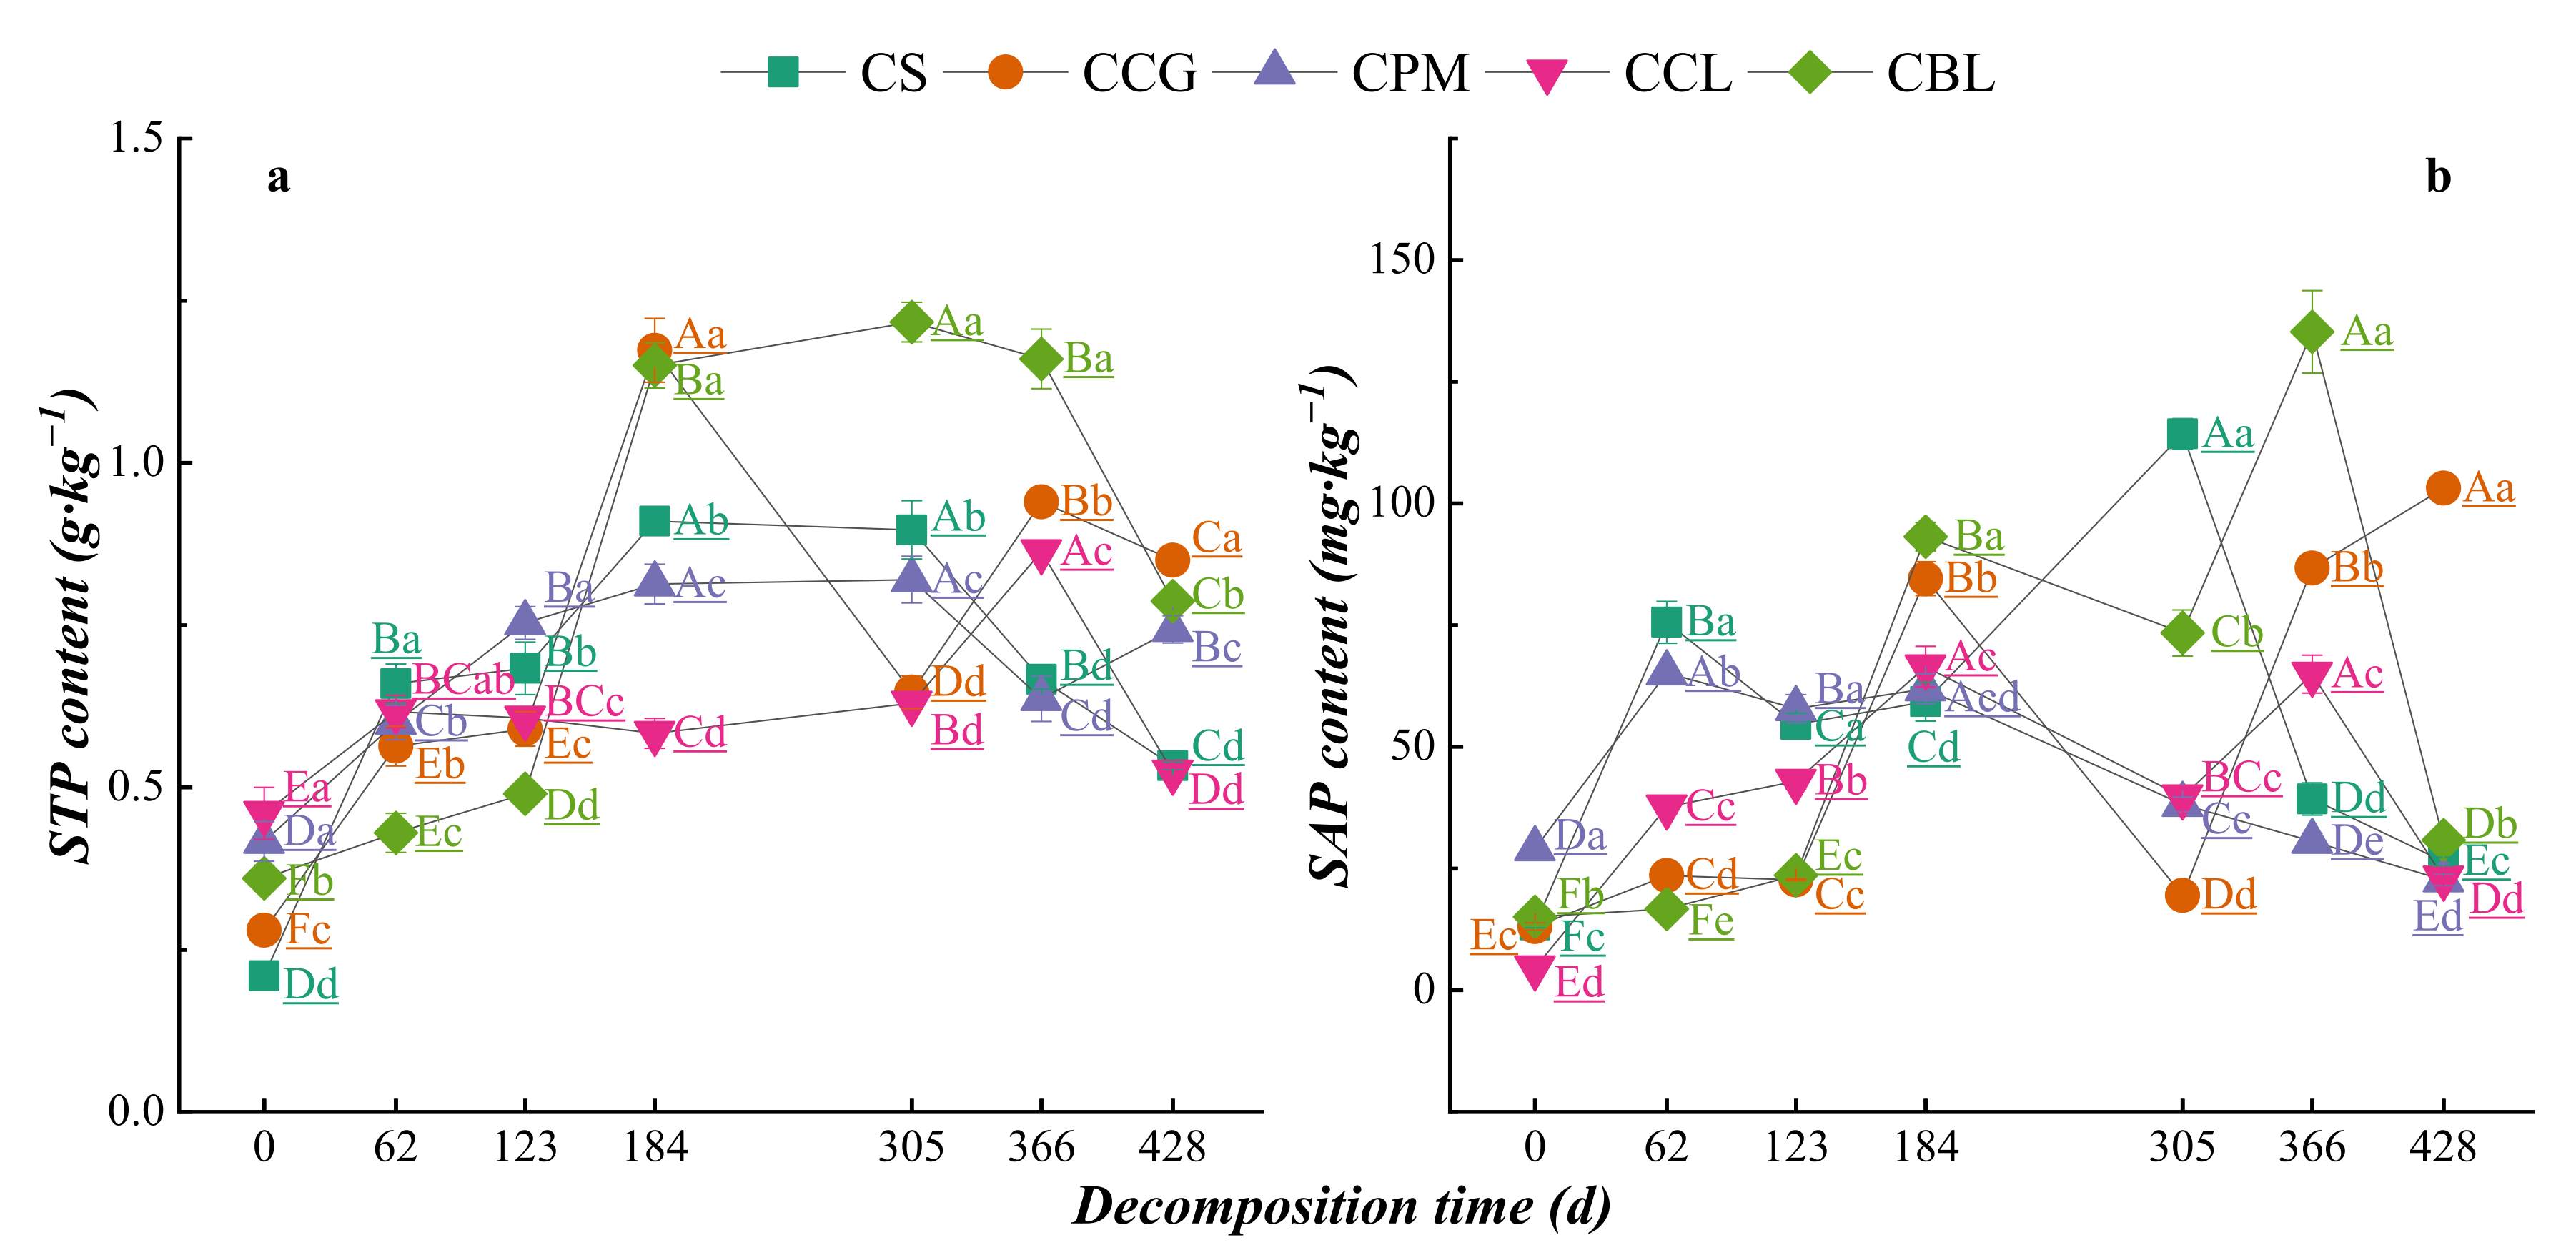
The dynamic changes in STP contents with decomposition time were different among the plant residue types during decomposition (Figure 8). STP contents rapidly increased in the CCG and CBL treatments (0–184 d). Throughout the decomposition period, the change ranges of STP contents in the CCL, CPM, and CS treatments were small, and the change trends of STP contents in the CPM and CS treatments were basically the same. After 428 d of decomposition, the contents of STP in the CCG, CBL, and CPM treatments were significantly higher than that of the CS treatment (p < 0.05). Consistent with the change in STP contents, the SAP contents rapidly increased before 184 d of decomposition in the CCG and CBL treatments.
Throughout the decomposition process, the change trends of the SAP contents in the CPM and CCL treatments and in the CCG and CBL treatments were similar, and the change ranges of the SAP contents in the CCG and CBL treatments were larger than that of the CS treatment. After 428 d of decomposition, SAP contents were significantly higher than that of the CS treatment, but the change ranges of SAP contents in the CPM and CCL treatments were lower than that of the CS treatment, and the SAP contents in the CPM and CCL treatments were significantly lower than that of the CS treatment after 428 d of decomposition (p < 0.05).
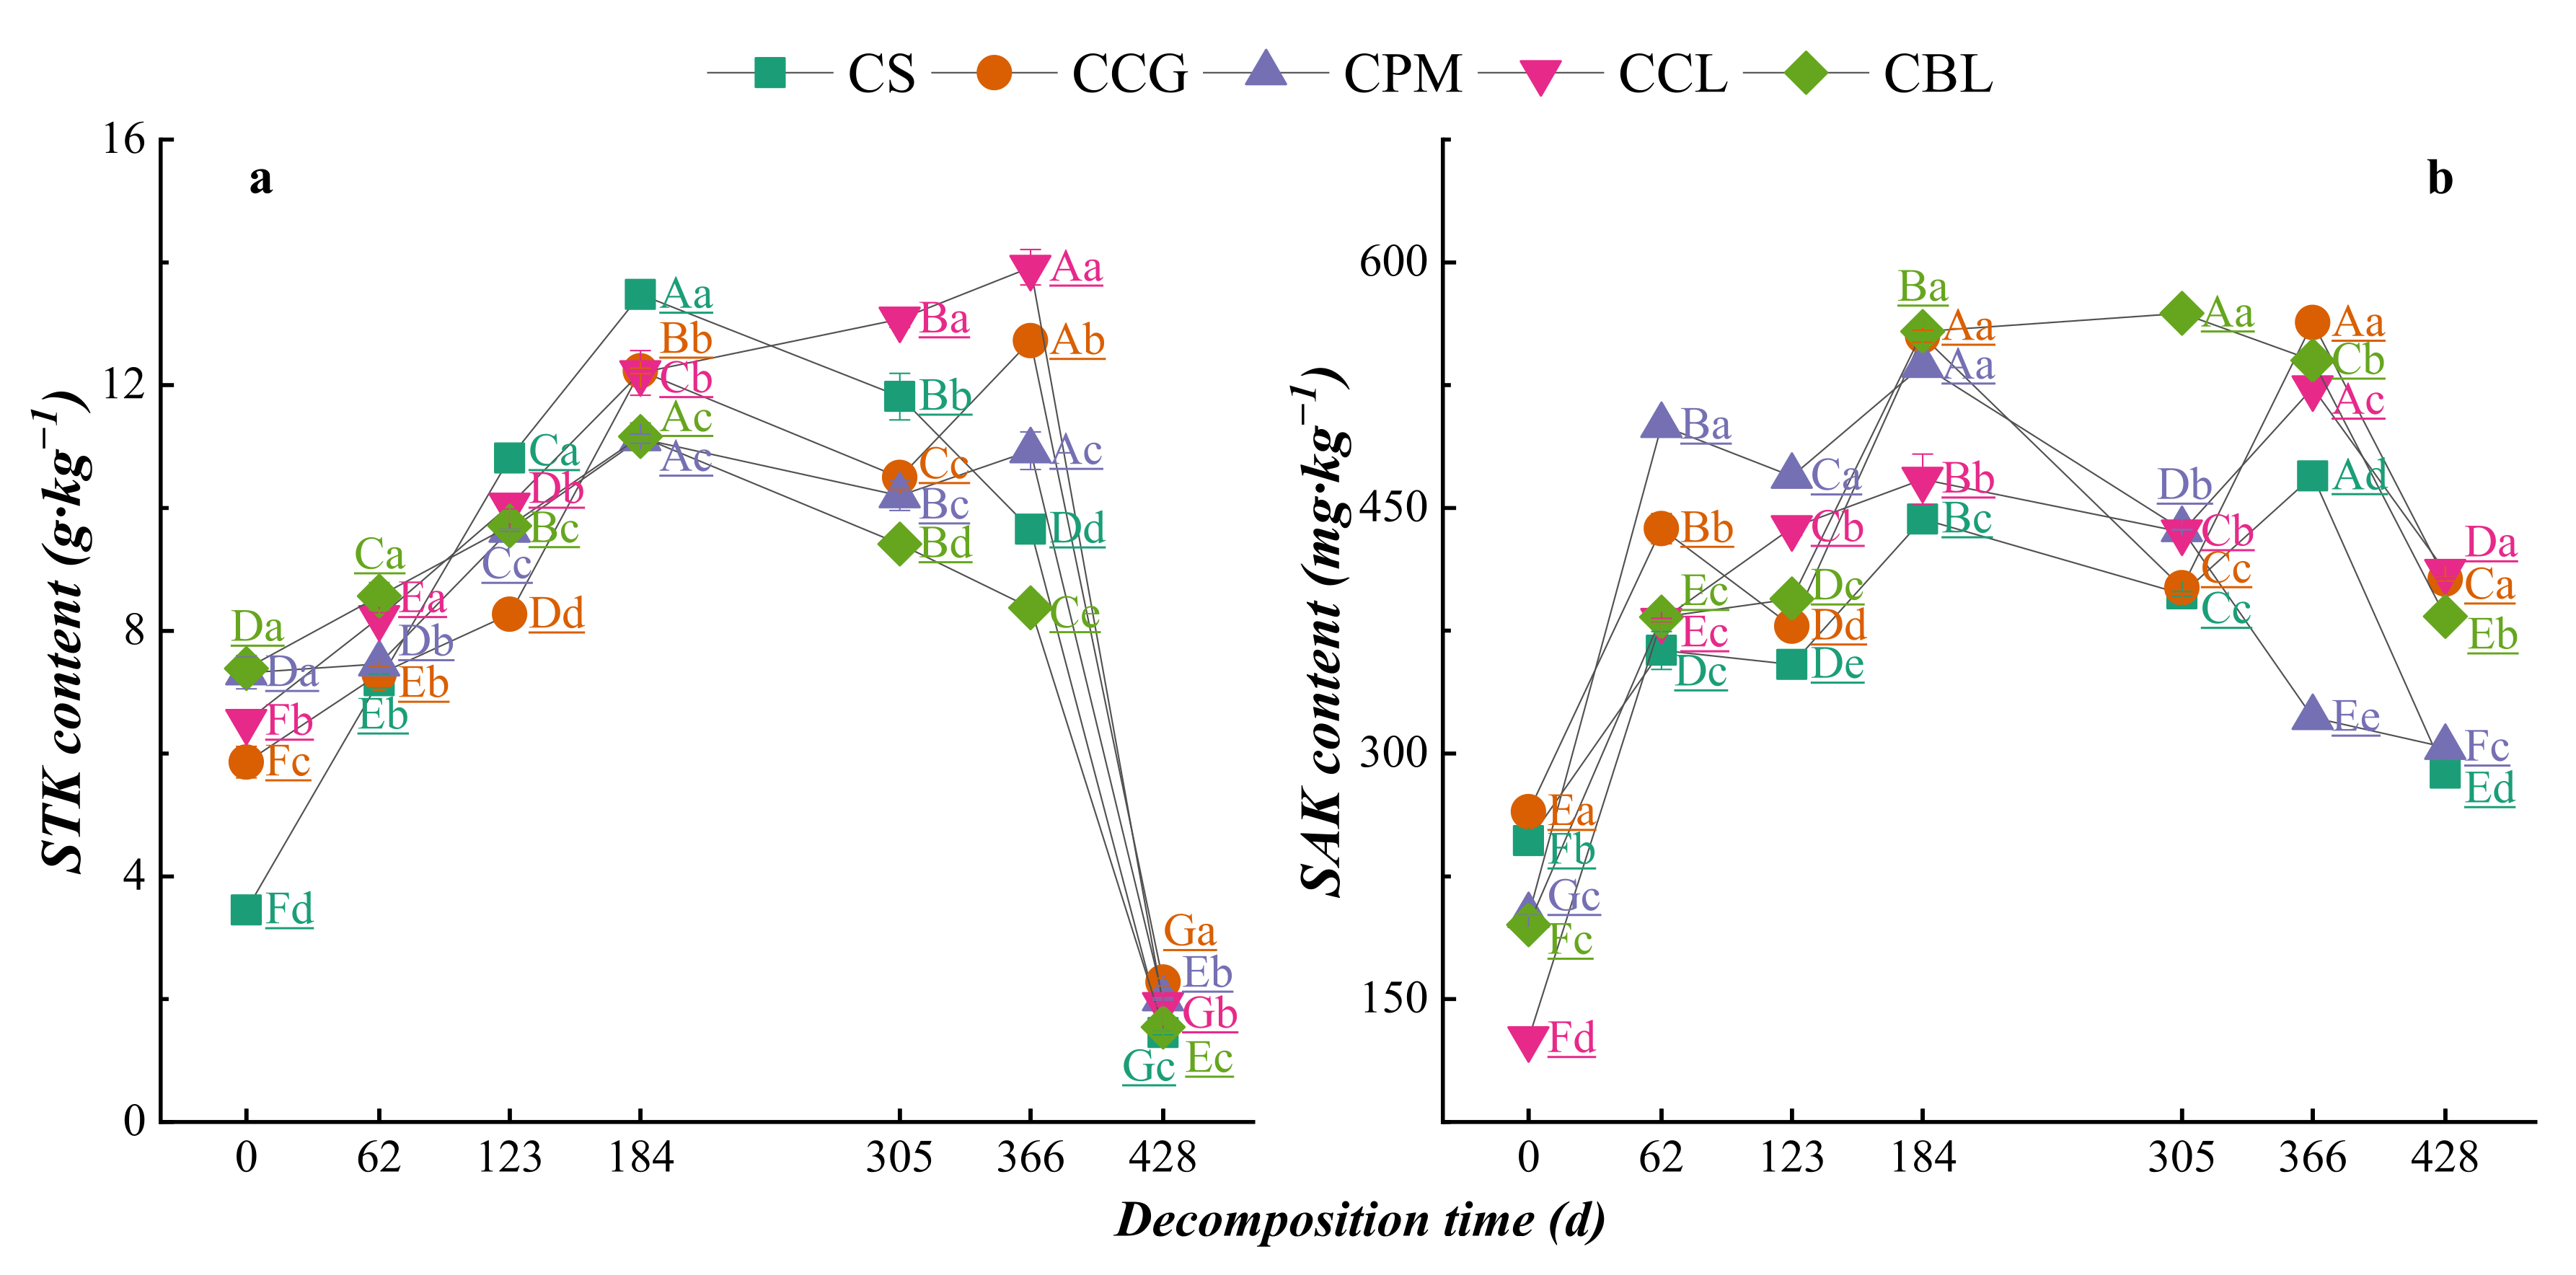
The change trends of the STK contents during the decomposition of different plant residue types were similar (Figure 9a). The dynamic changes in STK contents in the CBL, CCL, and CS treatments showed a single peak, whereas those in the CPM and CCG treatments followed a double peak shape. During the decomposition process, the content of STK rapidly increased in the CCL treatment and peaked at 366 d, and during the decomposition stage from 305–428 d, the content of STK in the CCL treatment was significantly higher than that of the CS treatment (p < 0.05). During the decomposition stage from 366 to 428 d, the contents of STK in the CCG and CPM treatments were also significantly higher than that of the CS treatment (p < 0.05). During the decomposition of the CS and CCG residues, the dynamic changes in SAK contents followed multipeak and double peak shapes in the CPM and CCL treatments and a single peak shape in the CBL treatment (Figure 9b). Throughout the decomposition process, the change range of SAK content in the CS treatment was less than that of the four kinds of mixed plant residue treatments. In the early stage of decomposition, the SAK contents rapidly increased in the four mixed plant residue treatments, among which the SAK content increased fastest in the CBL treatment. After 428 d of decomposition, the contents of SAK in the four mixed plant residue treatments were significantly higher than that of the CS treatment (p < 0.05).

3.4. Mixed Effect

3.4.1. Decomposition Rate Mixing Effect

The measured and expected values of the mass decomposition rate of each mixed plant residue are shown in Table 3. The mixed plant residues appeared to have a mixing effect on the process of decomposition. The measured decomposition rates of the CCG and CBL mixed plant residues were larger than the expected values in the early stage of decomposition (62 d), resulting in a synergistic effect. The CPM and CCL residues produced antagonistic effects during the process of decomposition. Throughout the decomposition process, comparing the difference between the expected and measured values of the decompositions rates (k) of the four mixed plant residues (Table 4), the CCG, CPM, and CBL mixed plant residues showed an additive effect, whereas the CCL mixed plant residue produced an antagonistic effect and inhibited decomposition.

3.4.2. Mixed Effect of Nutrient Release

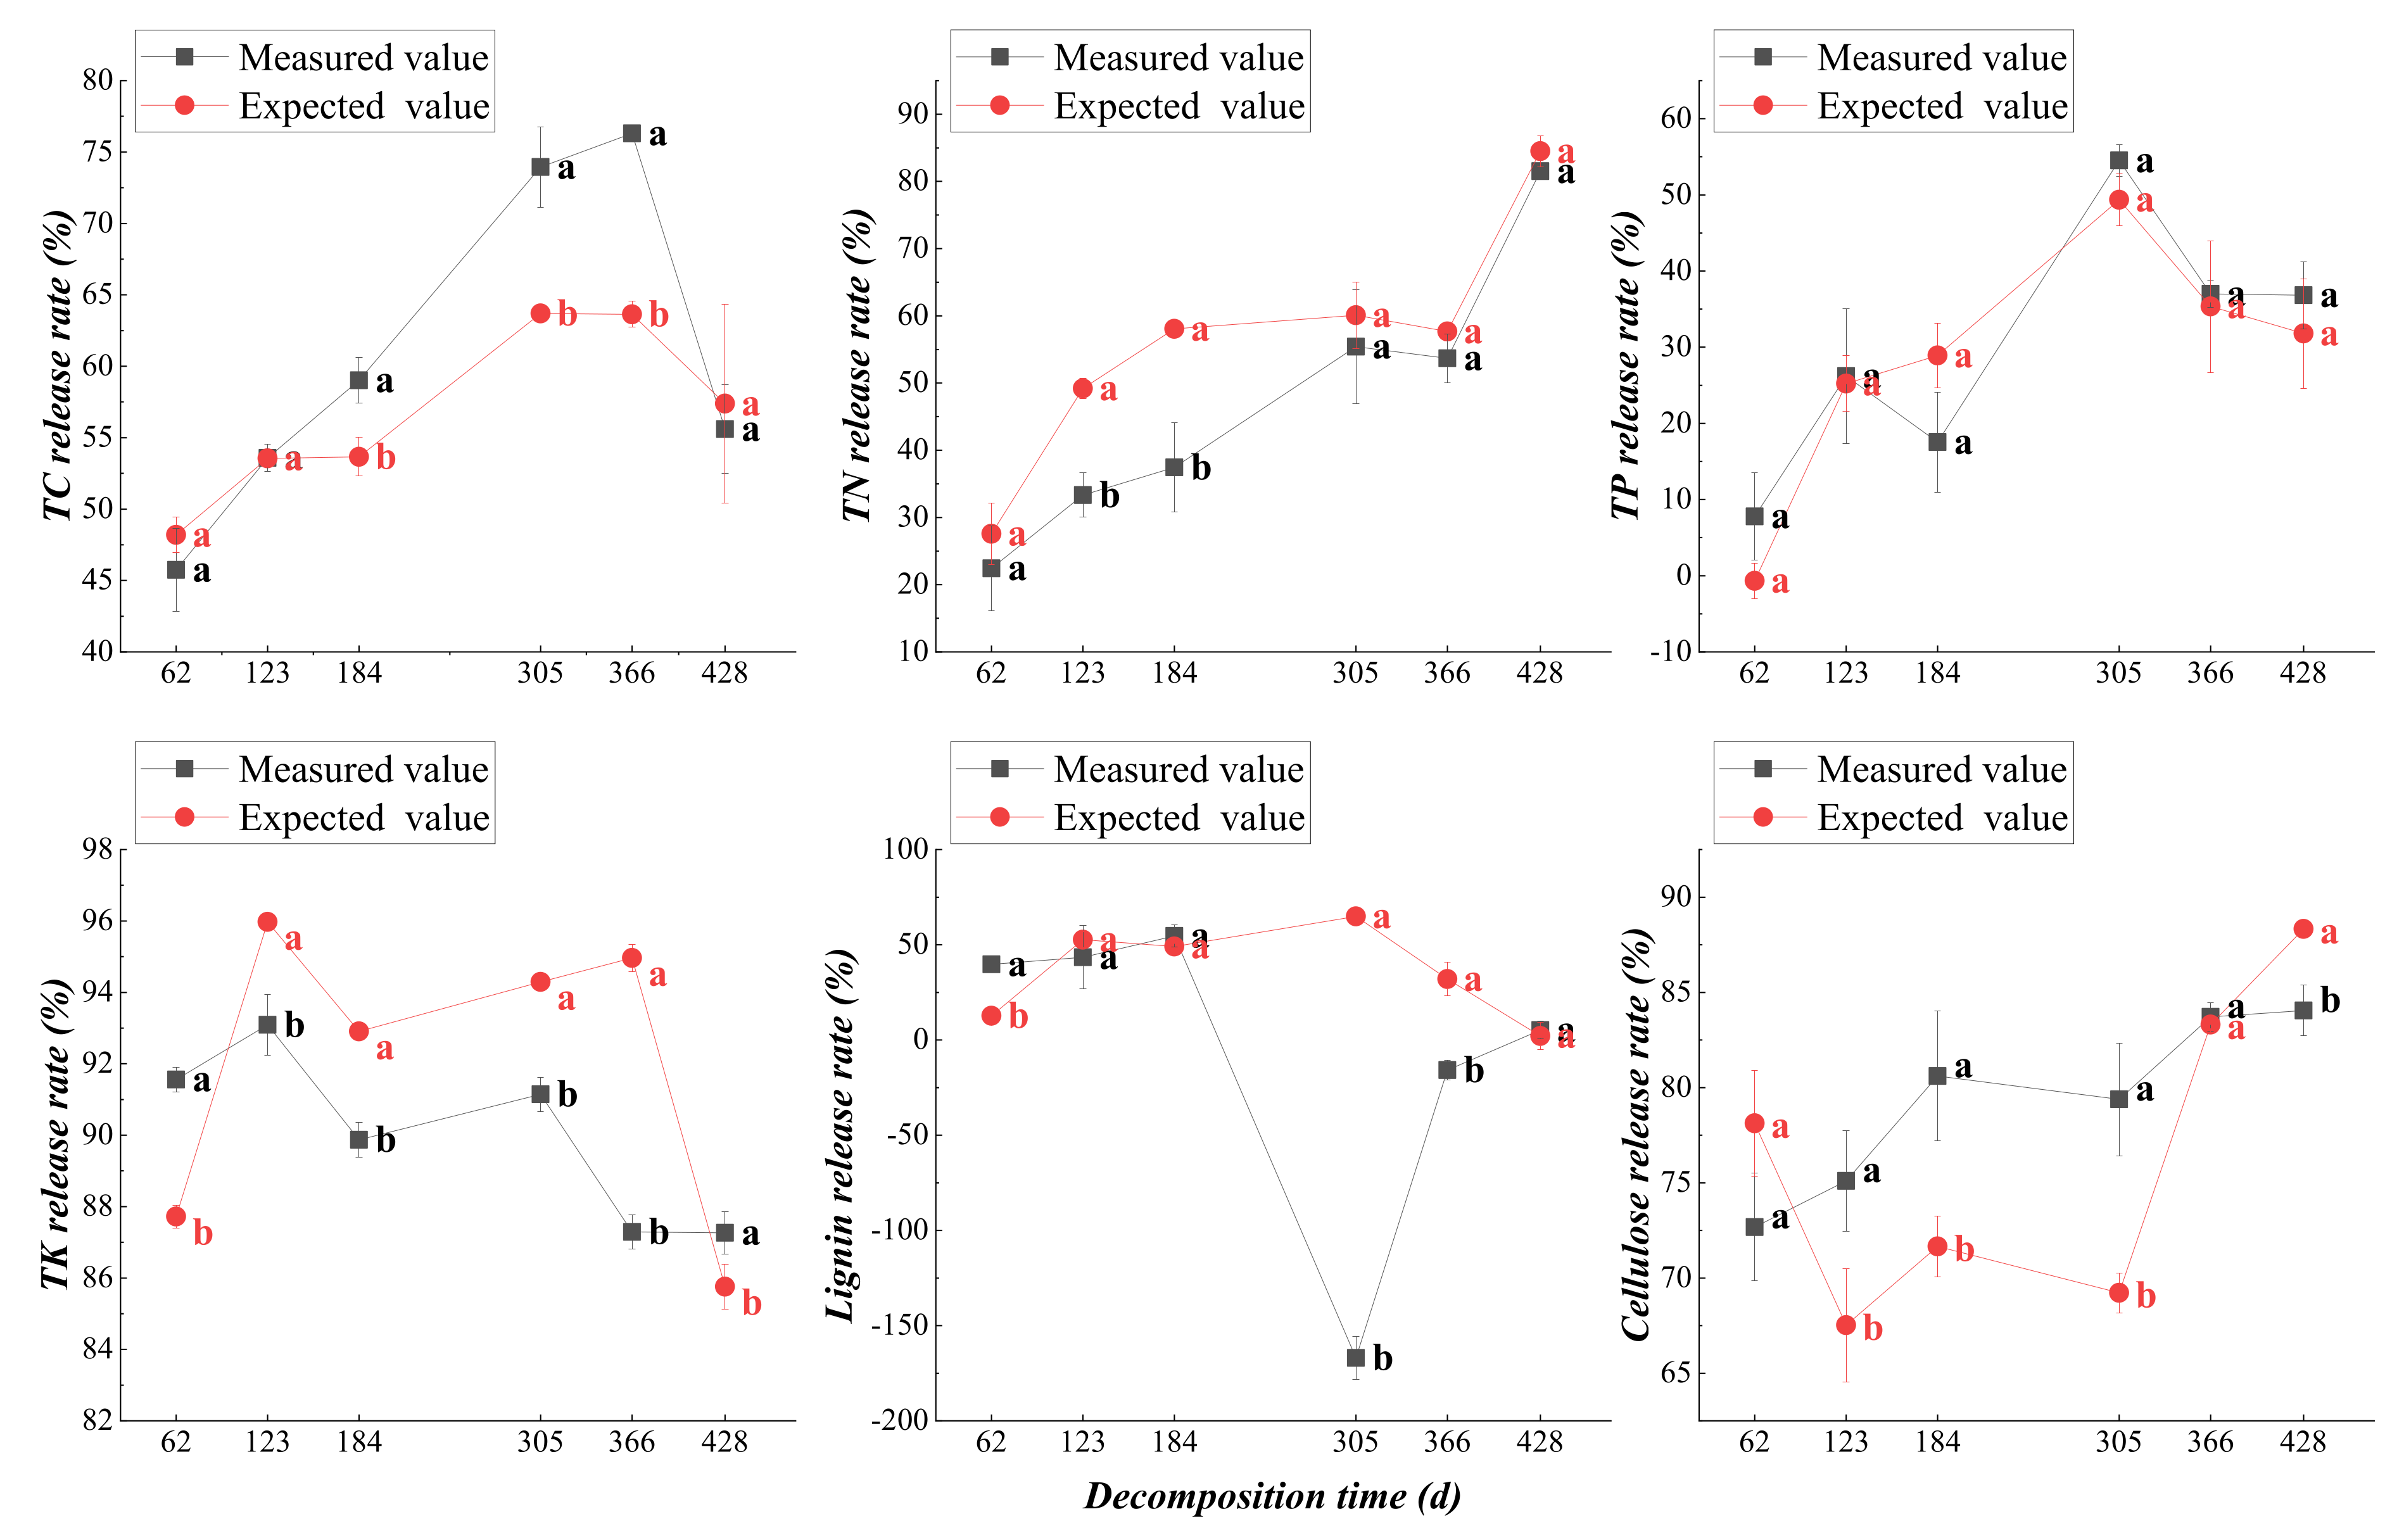
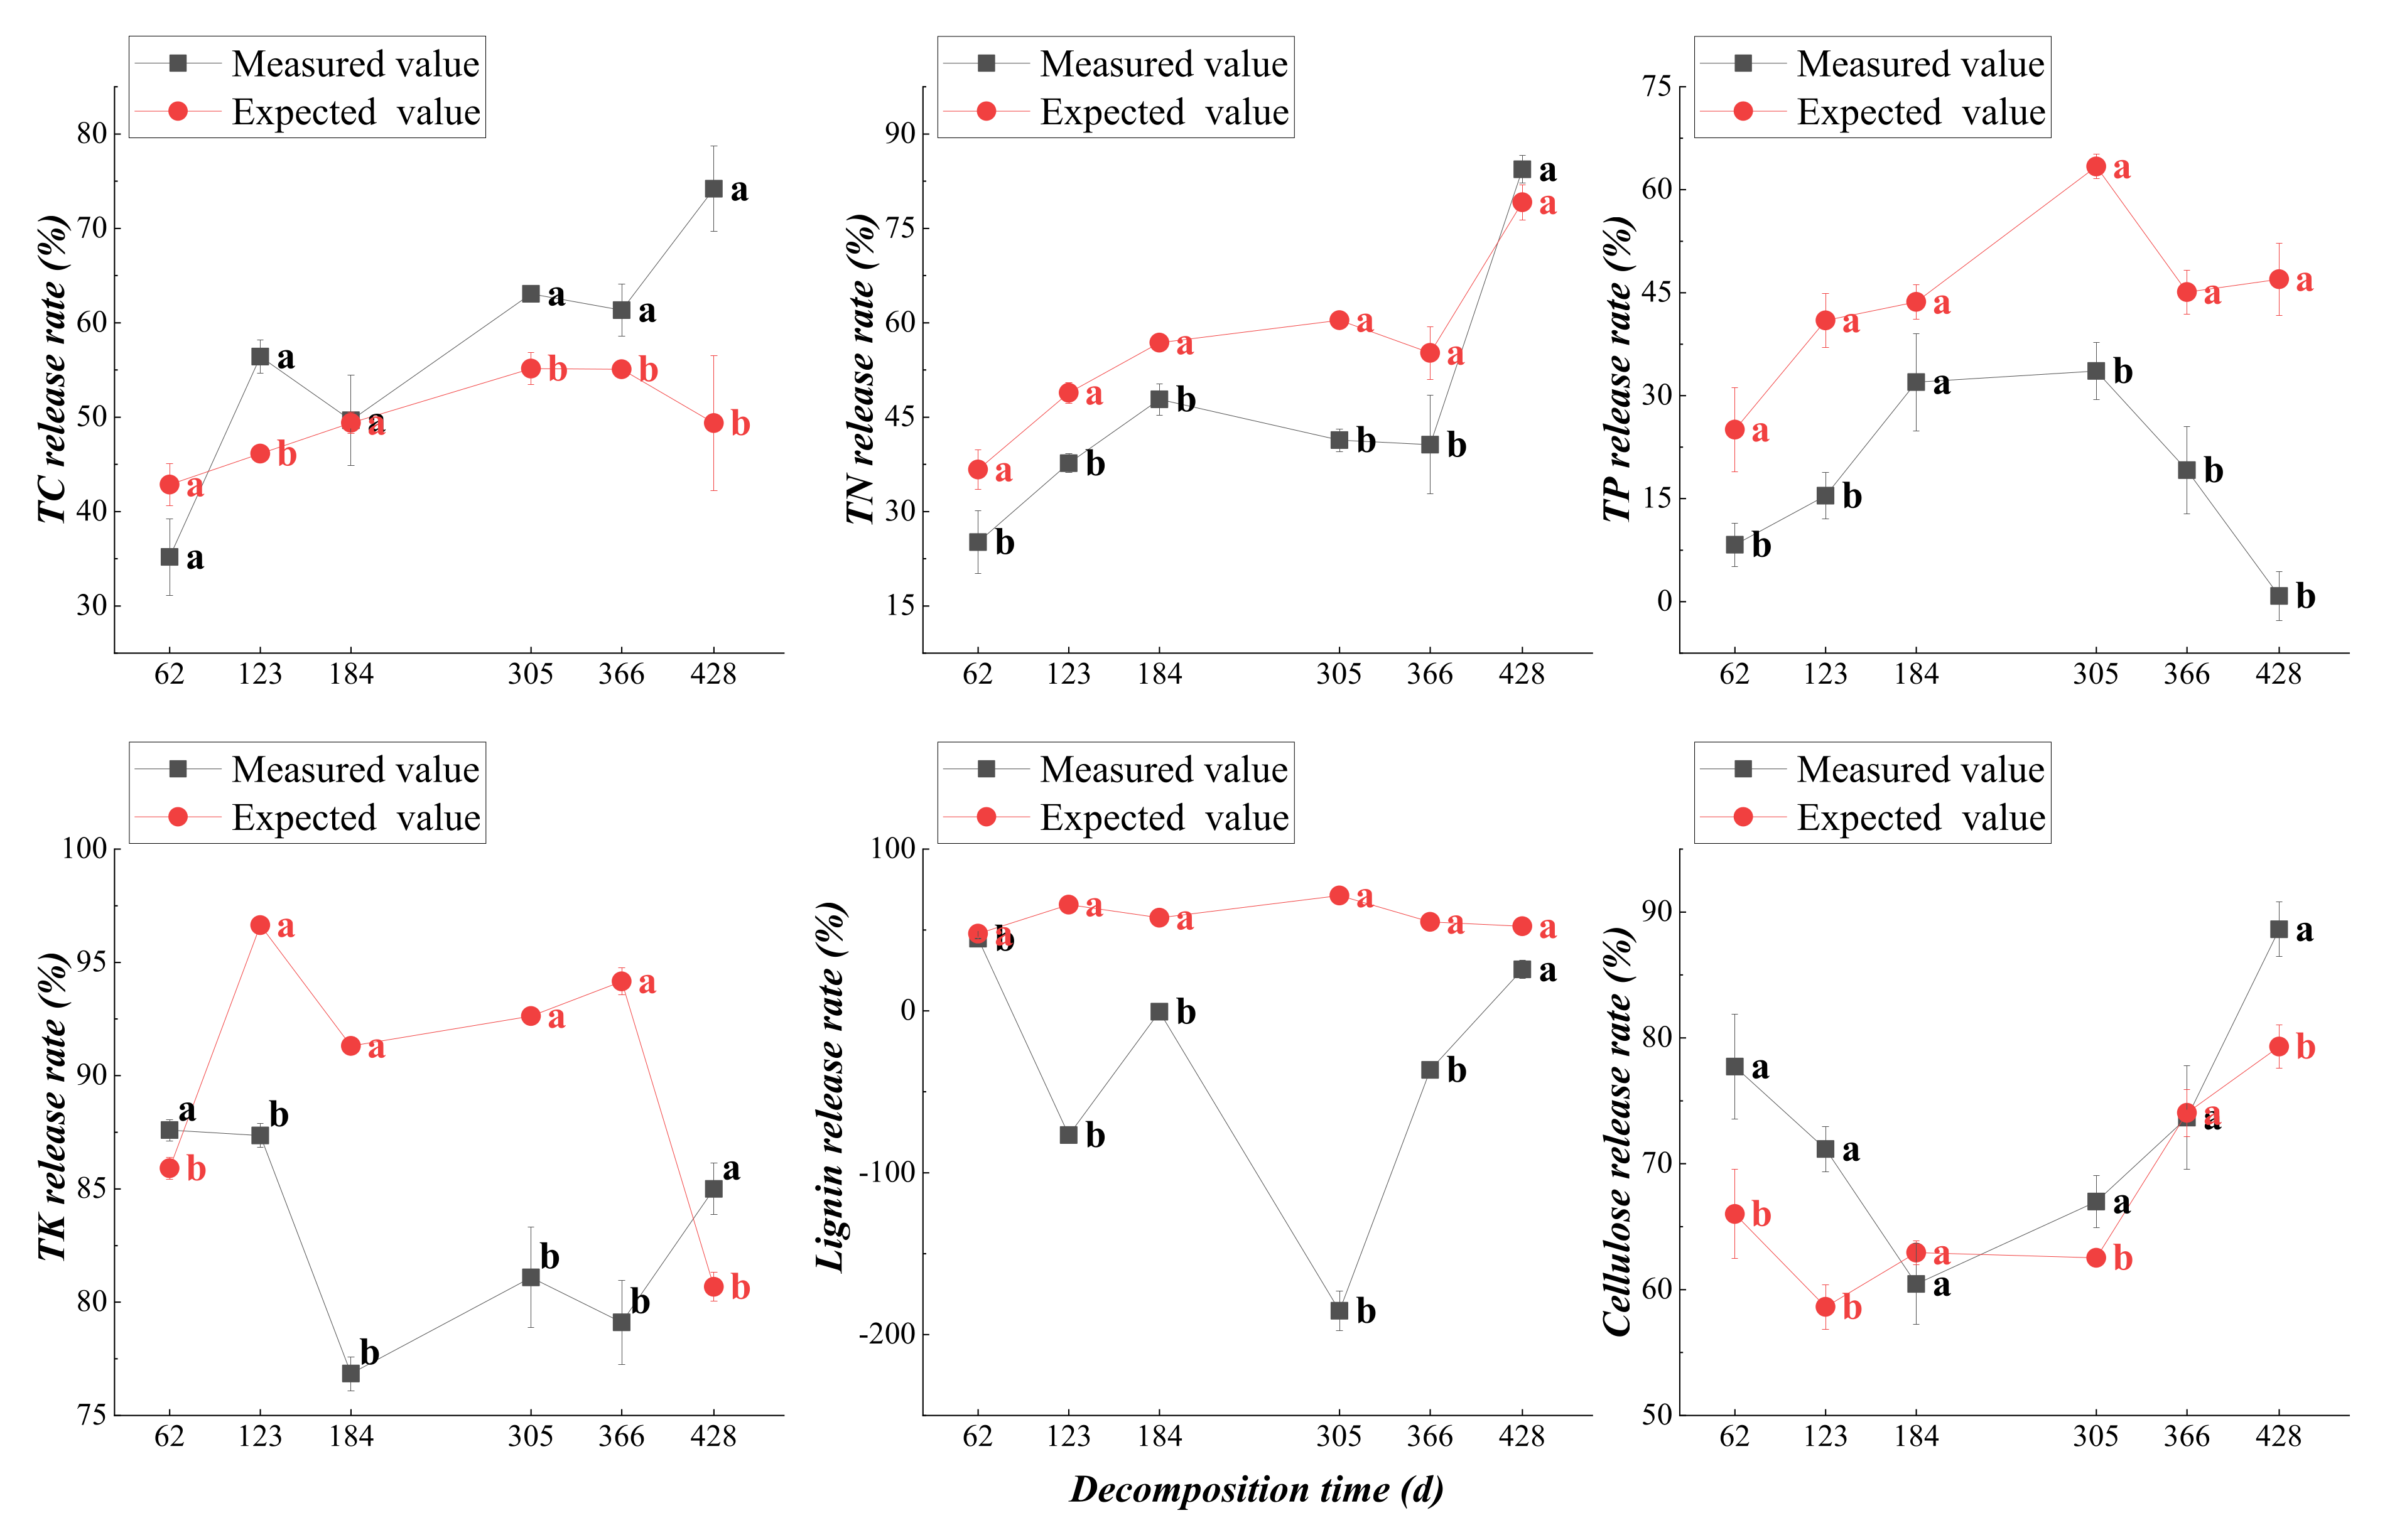
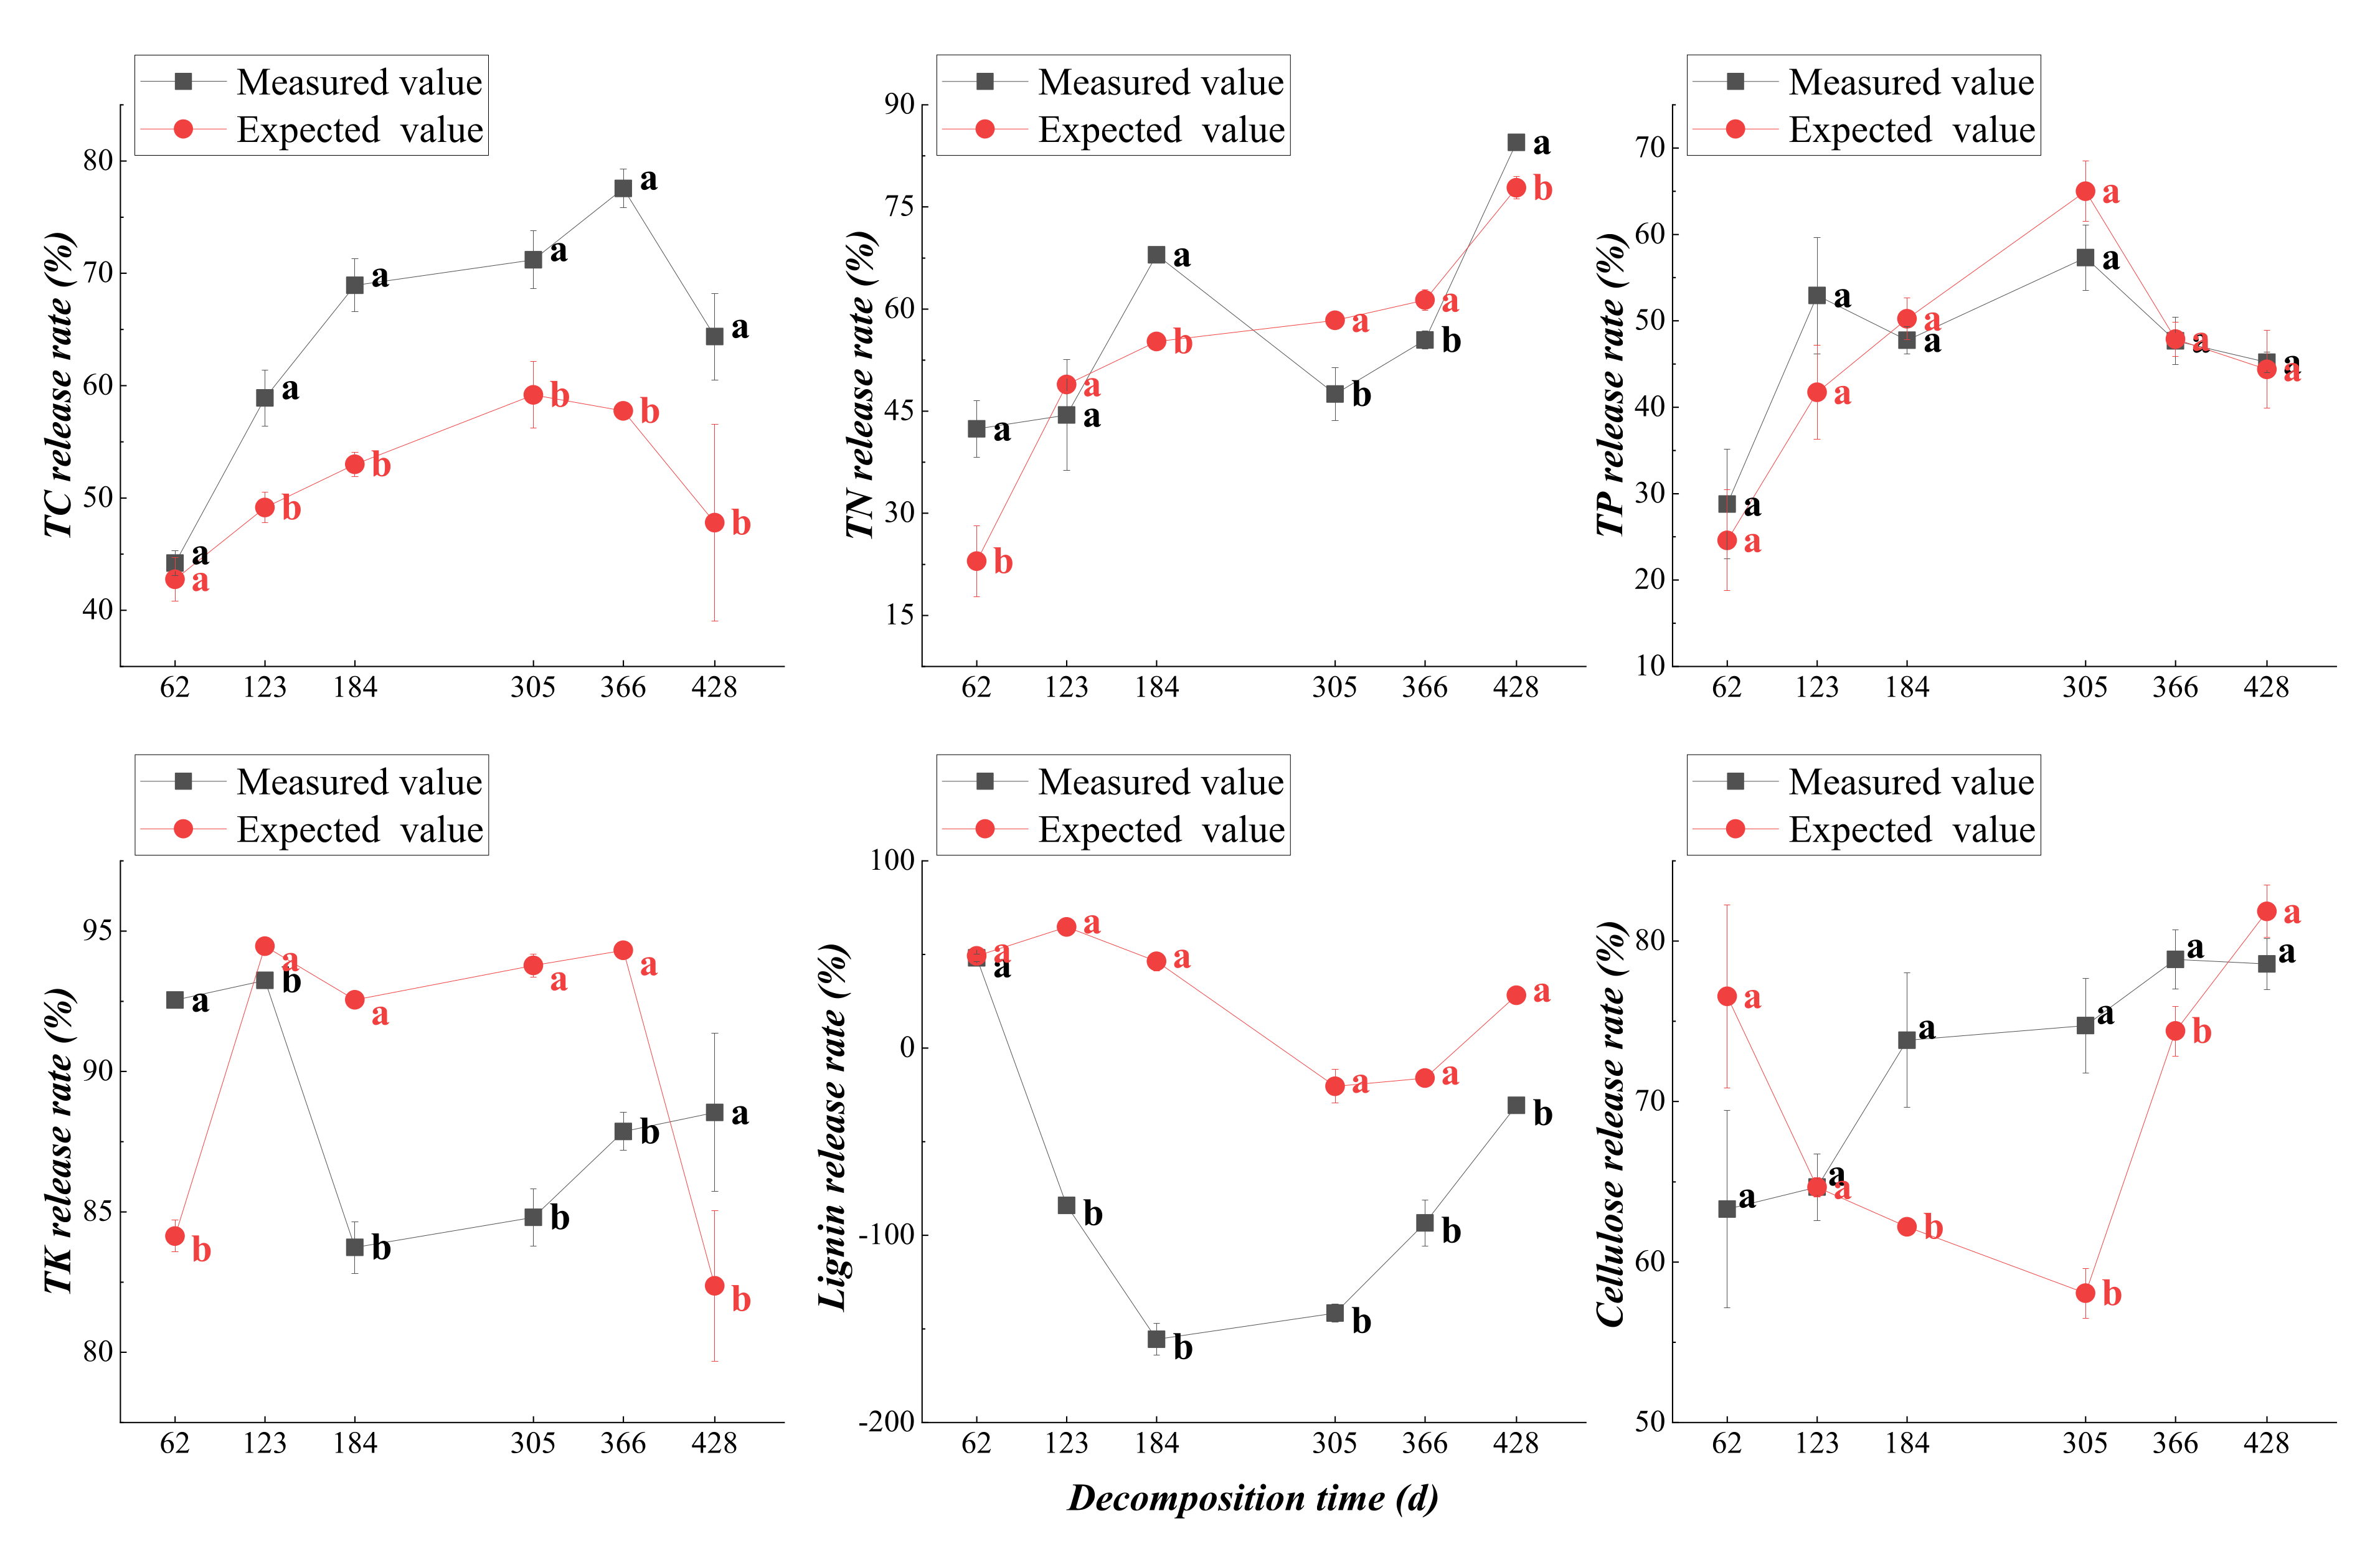
The nutrient release rates of the four mixed plant residues showed mixed effects in the process of decomposition (Figure 10, Figure 11, Figure 12 and Figure 13). During the decomposition process, the TC release rates in the four mixed plant residues showed a synergistic effect. The TN release rate in the CCG, CPM, and CCL residues showed an antagonistic effect, whereas that of the CBL treatment showed a synergistic effect in the early stage of decomposition, an antagonistic effect in the middle stage, and a synergistic effect in the later stage. There was no significant difference between measured and predicted TP release rates in the CCG and CBL treatments, which showed an additive effect (p > 0.05), whereas the CPM and CCL treatments showed an antagonistic effect. The release rates of TK from the CCG, CBL, and CCL plant residues showed a synergistic effect in the early stage of decomposition, an antagonistic effect in the middle stage, and a synergistic effect in the later stage; in the CPM treatment, an antagonistic effect was observed in the early stage, a synergistic effect in the middle stage, and an antagonistic effect in the later stage. The lignin release in the four kinds of mixed plant residues showed an antagonistic effect, and the cellulose release rate showed a synergistic effect.

4. Discussion

Related studies have shown that plant residue decomposition rates during the decomposition period have two stages: faster and slower [10]. In this study, the plant residue decomposition rates of the five different treatments were fast at first and then slow, which is consistent with the results of previous studies [10]. Plant residues with high N content and low C/N ratio and lignin content are usually called high-quality plant residues; in contrast, plant residues with low N content and high C/N ratio and lignin content are called low-quality plant residues [11,12]. A single component in a mixed plant residue is usually called a component plant residue [13]. Most existing studies have shown that plant residues with higher matrix quality in mixed decomposition can promote the decomposition of plant residues with poorer matrix quality, whereas the decomposition of residues with higher matrix quality is limited [14,15]. In this study, the mixed plant residues containing C. glanduliferum were added during the 428 d decomposition process, and the decomposition rate (k) of C. glanduliferum plant residues was higher than that of C. sinensis, indicating that exogenous C. glanduliferum plant residues could increase decomposition rates, accelerate the decomposition of tea garden plant residue, and promote the nutrient cycle in tea garden ecosystems. The interactions among material from different species during the decomposition of mixed plant residues can be divided into two types: additive effects and nonadditive effects, with the nonadditive effects being divided into positive nonadditive effects (i.e., synergistic effects) and negative nonadditive effects (i.e., antagonistic effects) [16]. In this study, there were no significant differences between the measured and expected decomposition rates of CCG, CPM, and CBL mixed plant residues, so they showed an additive effect. The measured decomposition rate of CCL mixed plant residues was significantly lower than the expected decomposition rate, so it showed antagonistic effects. Some studies have shown that mixing effects are more likely to occur in plant species compositions in which there are large differences in the nutrient contents of the plant residues [17,18,19,20]. In this study, there were differences in nutrient contents among the CCG, CPM, and CBL residues in the early stage of decomposition (Table 1), with all the mixtures exhibiting a synergistic effect; however, with continuous decomposition, the nutrient availability decreased, thus weakening the synergistic effect, and all these mixtures showed additive effects in the later stage of decomposition. In addition, the results of most studies suggest that the decomposition and nutrient release of coniferous species is strongly supported by the decomposition of coniferous and broad-leaved mixed plant residues, and consequently, the decomposition of residue from broad-leaved species will be inhibited [21,22]. Combined with the results of our previous research [23], the current study found decomposition rates of the CPM and CCL residues that were consistent with previous findings. The decomposition of the mixed CPM residue promoted the decomposition of the P. massoniana plant residue, whereas that of the mixed CCL residue inhibited the decomposition of C. sinensis.
Blair et al. reported that plant residue mixing did not affect the decomposition rate of plant residues but significantly accelerated the release of N [24]. In this study, the effect of mixed plant residue decomposition on N release was not obvious; throughout the decomposition process, only the decomposition of the CBL residue promoted N release. The extent of nutrient release from plant residues is generally determined by plant species, decomposition stage, and environmental factors [25,26], and depends on the nutrient properties of the residue [27]. Therefore, it seems logical that the CPM, CCG, and CCL residues had a higher C/N ratio than CS residues and that the processes of comminution and leaching in the initial stage of decomposition caused the mineralization and loss of N with rainfall, resulting in continuous changes in the C/N ratio during plant residue decomposition [28,29]. This affected the release of N content from the plant residue. A net release of TC and TN from the five kinds of plant residues was observed, which was consistent with the results of previous studies [30]. This finding shows that the contents of C and N in plant residues can meet the resource needs of microorganisms involved in decomposition and that there is no need to enrich residues with external C and N to meet these needs [31]. The TC release rate of the four mixed plant residues was significantly higher than that of the CS residue at different decomposition stages, and a synergistic effect was observed in the decomposition of the mixed residues; therefore, mixed decomposition promoted the release of C, which was consistent with the results of He Hongyue et al. [5]. In this study, the TP release rate during the decomposition of the mixed CCG and CBL residues showed an additive effect, whereas that of the CPM and CCL residues showed an antagonistic effect, which inhibited the release of TP. This finding is consistent with the results of Wang Xin et al. [32]. Wang Xin et al. [32] explained that the inhibition of TP release was related to the enrichment process of TP in the early stage of decomposition. In this study, TP followed a direct release model but showed species-specific differences, and species composition is the most important driver of plant residue decomposition [33]. The addition of coniferous plant residues changed the substrate quality and made the CS residue a high-quality plant residue. With the preferential decomposition of CS residue, the role of the component plant residues changed, resulting in a decrease in matrix quality into low-quality plant residues; the coniferous plant residues had a higher C/N ratio, making them difficult to decompose [34], thus reducing the overall decomposition rate and inhibiting the release of TP. K usually exists in the form of K+ in plant residues, and K contents usually gradually decrease in the process of decomposition [35,36]. In this study, the TK showed a net release in the four mixed plant residues, which was consistent with the results of previous studies [37]. In the process of decomposition, the mixing effect varied but was mainly antagonistic, which inhibited the release of TK; this result was inconsistent with the results of Lin Kaimin [38].
In most natural ecosystems, more than 90% of N and P and more than 60% of other mineral elements absorbed by plants from soil come from the decomposition of vegetative plant residues [39]. With the decomposition of plant residues, the release and return of nutrients in the residues are accelerated, and soil fertility is improved [38,40]. This is consistent with the results of this study, in which leafy plant residue decomposition improved the soil nutrient contents. There were differences among treatments. Regardless of whether tea tree decomposition was performed alone or in combination with the decomposition of four associated tree species, the SOC content increased. Compared with the CS treatment, SOC content increased fastest during the decomposition of the CCG residue, indicating that this residue mixture leads to greater increases in SOC content. He Hongyue et al. [6] found that SAN and SAK followed a decreasing trend over time. This finding is not consistent with the results of this study. The contents of STN, SAN, and SAK fluctuated during the decomposition of the four kinds of mixed plant residues, but increased over time as a whole. The reason for this result is that, in this study, a net release state was observed for TN and TK in the plant residue. He Hongyue et al. [5,6] also found that mixed plant residue decomposition had a greater effect than single plant residue decomposition on improving soil nutrient contents. In this study, after 428 d of decomposition, the decomposition of the four mixed plant residues improved soil nutrients. Adding C. glanduliferum and B. luminifera leafy residues from the tea garden to the decomposition mixtures resulted in soil nutrient contents that were significantly higher than that of CS alone; therefore, C. glanduliferum and B. luminifera are good choices for the construction of mixed forests in tea gardens.

5. Conclusions

The important ecological functions of plant residues include the ability to return nutrients to the soil and provide nutrients for forest growth, which are also important mechanisms of forest self-fertilization. The effects of plant residues can be applied to the process of forest cultivation and used to assess the relationships among tree species and determine the selection of afforestation tree species. Different tree species compositions have different effects on plant residue decomposition. Plant residue diversity provides a variety of nutrient elements, and the interaction between high-quality and low-quality plant residues increases the decomposition rate and plays a positive role in improving soil nutrients. Our results showed that mixed plant residue decomposition promoted soil nutrient cycling and nutrient availability in the Jiu’an ecological tea garden, in which C. glanduliferum and B. luminifera were added for mixed decomposition. The decomposition rate and nutrient release rate of tea pruning in the Jiu’an ecological tea garden were accelerated, soil nutrients increased, the plant residue decomposition turnover period shortened, and the nutrient cycle was accelerated. Therefore, to promote the sustainable management of modern ecological tea gardens, realize effective forest–tea compound management, and solve the ecological problems of existing tea gardens in the process of ecological tea garden management, C. glanduliferum and B. luminifera should be selected to adjust the tree species allocation of ecological tea gardens. The decomposition of plant residues can produce a positive mixed effect, increasing its nutrient return ability, maintaining tea garden fertility, and helping in the ecological development of tea gardens.

Author Contributions

Methodology, R.Y.; software, S.L.; investigation, C.H., J.G., and J.M.; writing—original draft preparation, S.L.; writing—review and editing, R.Y. and S.L. All authors have read and agreed to the published version of the manuscript.

Funding

This research was funded by the Science and Technology Program of Guizhou Province, Integration and demonstration of key technologies of species configuration in ecological tea gardens in mountainous areas of Guizhou, grant number Qian Ke He support [2020]1Y011, the Forestry Scientific Research Project of Guizhou Province, Study on dynamic mechanism of plant residue decomposition in ecological compound management, grant number Qian Lin Ke He [2020]22 and the Study on Identification and Measurement methods of Ancient Tea trees in Guizhou, grant number Qian Lin Ke He support [2018]14.

Data Availability Statement

Not applicable.

Acknowledgments

The authors gratefully acknowledge the Forestry College of Guizhou University for their technical support, especially Rui Yang for the valuable advice.

Conflicts of Interest

The authors declare that they have no conflict of interest.

References

  1. Chen, L.; Zhang, C.; Duan, W. Temporal variations in phosphorus fractions and phosphatase activities in rhizosphere and bulk soil during the development of Larix olgensis plantations. J. Plant Nutr. Soil Sci. 2015, 179, 67–77. [Google Scholar] [CrossRef]
  2. Baietto, A.; Hernández, J.; del Pino, A. Comparative Dynamics of Above-Ground Litter Production and Decomposition from Eucalyptus grandis Hill ex Maiden and Pinus taeda L., and Their Contribution to Soil Organic Carbon. Forests 2021, 12, 349. [Google Scholar] [CrossRef]
  3. Bernhard-Reversat, F. The leaching of Eucalyptus hybrids and Acacia auriculiformis leaf litter: Laboratory experiments on early decomposition and ecological implications in congolese tree plantations. Appl. Soil Ecol. 1999, 12, 251–261. [Google Scholar] [CrossRef]
  4. Lin, K.M.; Zhang, Z.Q.; Cao, G.Q.; He, Z.M.; Ma, X.Q. Decomposition characteristics and its nutrient dynamics of leaf litter mixtures of both Chinese fir and Phoeba bournei. Acta Ecol. Sin. 2006, 26, 2732–2738. [Google Scholar] [CrossRef]
  5. He, H.; Ma, C.; Mu, H.; Shan, Y. The Decomposition Characteristics and Soil Nutrient Dynamics of Leaf Litter Mixture of Larix principis-rupprechtii and Betula platyphylla. For. Resour. Manag. 2018, 47, 93–100. [Google Scholar] [CrossRef]
  6. He, H.; Mu, H.; Ma, C.; Shan, Y. The decomposition characteristics and their effect on soil nutrients of leaf litter mixtures of Larix principis-rupprechtii and Lespedeza bicolor. J. Hebei Agric. Univ. 2018, 41, 55–61. [Google Scholar] [CrossRef]
  7. Mi, C.H.; Liu, Z.W.; Li, Q.; Mohamad, O.A. Effect of Litter Decomposition on Soil Polarization in Three Typical Planted Pure Coniferous Forests in Loess Plateau, China. Int. J. Agric. Biol. 2013, 15, 687–693. [Google Scholar]
  8. Olson, J.S. Energy Storage and the Balance of Producers and Decomposers in Ecological Systems. Ecology 1963, 44, 322–331. [Google Scholar] [CrossRef] [Green Version]
  9. Hättenschwiler, S. Effects of Tree Species Diversity on Litter Quality and Decomposition. Ecol. Stud. 2005, 176, 149–164. [Google Scholar] [CrossRef]
  10. Ge, L.; He, Z.; Meng, Q.; Lin, Y. Mixed Decomposition Process of Litterfall of Acacia aulacocarpa and Casuarina equisetifolia Plantations in Southeast Coastal Area. J. Northeast. For. Univ. 2019, 47, 35–40. [Google Scholar] [CrossRef]
  11. Steffensen, J.P.; Andersen, K.K.; Bigler, M.; Clausen, H.B.; Dahl-Jensen, D.; Fischer, H.; Goto-Azuma, K.; Hansson, M.; Johnsen, S.J.; Jouzel, J.; et al. High-Resolution Greenland Ice Core Data Show Abrupt Climate Change Happens in Few Years. Science 2008, 321, 680–684. [Google Scholar] [CrossRef] [PubMed]
  12. Gao, H.Y.; Hong, M.; Huo, L.X.; Ye, H.; Zhao, B.Y.; Shan, H. Effects of exogenous nitrogen input and water change on litter decomposition in a desert grassland. Chin. J. Appl. Ecol. 2018, 29, 3167–3174. [Google Scholar] [CrossRef]
  13. Hoorens, B.; Coomes, D.; Aerts, R. Neighbour identity hardly affects litter-mixture effects on decomposition rates of New Zealand forest species. Oecologia 2009, 162, 479–489. [Google Scholar] [CrossRef] [PubMed] [Green Version]
  14. Chomel, M.; Guittonnylarcheveque, M.; DesRochers, A.; Baldy, V. Effect of mixing herbaceous litter with tree litters on decomposition and N release in boreal plantations. Plant Soil 2015, 398, 229–241. [Google Scholar] [CrossRef]
  15. Liu, C.; Liu, Y.; Guo, K.; Zhao, H.; Qiao, X.; Wang, S.; Zhang, L.; Cai, X. Mixing litter from deciduous and evergreen trees enhances decomposition in a subtropical karst forest in southwestern China. Soil Biol. Biochem. 2016, 101, 44–54. [Google Scholar] [CrossRef]
  16. Li, Y.; Zhou, X.; Zhang, N.; Ma, K. The research of mixed litter effects on litter decomposition in terrestrial ecosystems. Acta Ecol. Sin. 2016, 36, 4977–4987. [Google Scholar] [CrossRef]
  17. Leroy, C.J.; Marks, J.C. Litter quality, stream characteristics and litter diversity influence decomposition rates and macroinvertebrates. Freshw. Biol. 2006, 51, 605–617. [Google Scholar] [CrossRef]
  18. Gartner, T.B.; Cardon, Z.G. Site of leaf origin affects how mixed litter decomposes. Soil Biol. Biochem. 2006, 38, 2307–2317. [Google Scholar] [CrossRef]
  19. Hättenschwiler, S.; Gasser, P. Soil animals alter plant litter diversity effects on decomposition. Proc. Natl. Acad. Sci. USA 2005, 102, 1519–1524. [Google Scholar] [CrossRef] [Green Version]
  20. Wardle, D.A.; Bonner, K.I.; Nicholson, K.S. Biodiversity and Plant Litter: Experimental Evidence Which Does Not Support the View That Enhanced Species Richness Improves Ecosystem Function. Wiley Behalf Nord. Soc. Oikos 1997, 79, 247–258. [Google Scholar] [CrossRef]
  21. Yuan, Y.; Zhang, D.; Zhang, Y.; Li, X.; Chen, Y.; Qin, Y.; Zhang, J. Enzyme activities in the early stage of mixed leaf litter decomposition from Pinus massoniana and broad-leaved tree species. Chin. J. Appl. Environ. Biol. 2018, 24, 508–517. [Google Scholar] [CrossRef]
  22. Qin, Y.; Zhang, D.J.; Li, X.; Zhang, Y.; Yuan, Y.L.; Wang, L.F.; Pang, Z.H.; Zhang, J. Changes of total phenols and condensed tannins during the decomposition of mixed leaf litter of Pinus massoniana and broad-leaved trees. Chin. J. Appl. Ecol. 2018, 29, 2224–2232. [Google Scholar] [CrossRef]
  23. Liu, S.; Yang, R.; Hou, C.; Ma, J.; Guo, J. Decomposition Characteristics of Lignin and Cellulose in Different Litters of Ecological Tea Gardens in Mountainous Areas of Guizhou. J. Tea Sci. 2021, 41, 654–668. [Google Scholar] [CrossRef]
  24. Blair, J.M.; Parmelee, R.W.; Beare, M.H. Decay Rates, Nitrogen Fluxes, and Decomposer Communiies of Single- and Mixed-Species Foliar Litter. Ecology 1990, 71, 1976–1985. [Google Scholar] [CrossRef]
  25. Duan, H.; Wang, L.; Zhang, Y.; Fu, X.; Tsang, Y.; Wu, J.; Le, Y. Variable decomposition of two plant litters and their effects on the carbon sequestration ability of wetland soil in the Yangtze River estuary. Geoderma 2018, 319, 230–238. [Google Scholar] [CrossRef]
  26. Sun, Z.; Mou, X.; Zhang, D.; Sun, W.; Hu, X.; Tian, L. Impacts of burial by sediment on decomposition and heavy metal concentrations of Suaeda salsa in intertidal zone of the Yellow River estuary, China. Mar. Pollut. Bull. 2017, 116, 103–112. [Google Scholar] [CrossRef]
  27. Zhang, D.; Hui, D.; Luo, Y.; Zhou, G. Rates of litter decomposition in terrestrial ecosystems: Global patterns and controlling factors. J. Plant Ecol. 2008, 1, 85–93. [Google Scholar] [CrossRef] [Green Version]
  28. Bonanomi, G.; Incerti, G.; Antignani, V.; Capodilupo, M.; Mazzoleni, S. Decomposition and nutrient dynamics in mixed litter of Mediterranean species. Plant Soil 2010, 331, 481–496. [Google Scholar] [CrossRef]
  29. Yang, L.; Deng, C.C.; Ya-mei, C.; He, R.L.; Zhang, J.; Liu, Y. Relationships between decomposition rate of leaf litter and initial quality across the alpine timberline ecotone in Western Sichuan, China. Chin. J. Appl. Ecol. 2015, 26, 3602–3610. [Google Scholar] [CrossRef]
  30. Xie, T.; Li, L.; Liu, M.; Chen, X.; Chen, C.; Yang, Z.; Li, C. Characteristics of litter decomposition and nutrient release of several dominant annual herbaceous species in the riparian zone of the Three Gorges Reservoir Area. Pratacultural Sci. 2020, 37, 226–236. [Google Scholar] [CrossRef]
  31. Xie, Y.; Yu, D.; Ren, B. Effects of nitrogen and phosphorus availability on the decomposition of aquatic plants. Aquat. Bot. 2004, 80, 29–37. [Google Scholar] [CrossRef]
  32. Wang, X.; Guo, Y.; Zhao, H.; Meng, F.; Liu, G. Decomposition characteristics and its nutrient dynamics of the leaf litter mixtures of Larix principis-rupprechtii and Betula platyphylla. For. Ecol. Sci. 2018, 33, 29–36. [Google Scholar] [CrossRef]
  33. Liao, Z.Y.; Hui, Y.; Wang, S.J.; Chen, P. Leaf litter decomposition and nutrient return characteristics of Pinus yunnanensis at different forest ages. Ecol. Environ. Sci. 2018, 27, 1981–1986. [Google Scholar] [CrossRef]
  34. Guo, P.; Jiang, H.; Yu, S.; Ma, Y.; Dou, R.; Song, X. Comparason of Litter Decomposition of Six Species of Coniferous and Broad-leaved Trees in Subtropical China. Chin. J. Apppl. Environ. Biol. 2009, 2009, 655–659. [Google Scholar] [CrossRef]
  35. Li, Q.; Cheng, X.; Jiang, T.; Xu, Z.Q. Review on studies of forest litter decomposition. Hebei J. For. Orchard. Res. 2012, 27, 396–401. [Google Scholar] [CrossRef]
  36. Lin, B.; Liu, Q.; Wu, Y.; He, H. Advances in the studies of forest litter. Chin. J. Ecol. 2004, 23, 60–64. [Google Scholar]
  37. Wang, C.; Dong, X.-T.; DU, R.-P.; Zhang, Z.-D.; Huang, X.-R. Changes of nutrient release and enzyme activity during the decomposition of mixed leaf litter of Larix principis-rupprechtii and broadleaved tree species. Ying yong sheng tai xue bao = J. Appl. Ecol. 2021, 32, 1709–1716. [Google Scholar] [CrossRef]
  38. Lin, K.; Hong, W.; Yu, X.; Huang, B. Decomposition interaction of mixed litter between Chinese fir and various accompanying plant species. Chin. J. Appl. Ecol. 2001, 12, 321–325. [Google Scholar] [CrossRef]
  39. Hu, N.; Ma, Z.; Lan, J.; Wu, Y.; Fu, W.; Yuan, H.; Lou, L. Leaf litter decomposition characters and impact on soil organic carbon/nitrogen in different vegetation restorations of karst rocky desertification: An example of the Zhongliang mountain in Chongqing. Carsologica Sin. 2016, 35, 539–549. [Google Scholar] [CrossRef]
  40. Liao, L.; Ma, Y.; Wang, S.; Gao, H.; Yu, X. Decomposition of leaf litter of chinese fir in mixture with major associated broad-leaved plantation species. Acta Phytoecol. Sin. 2000, 24, 27–33. [Google Scholar]
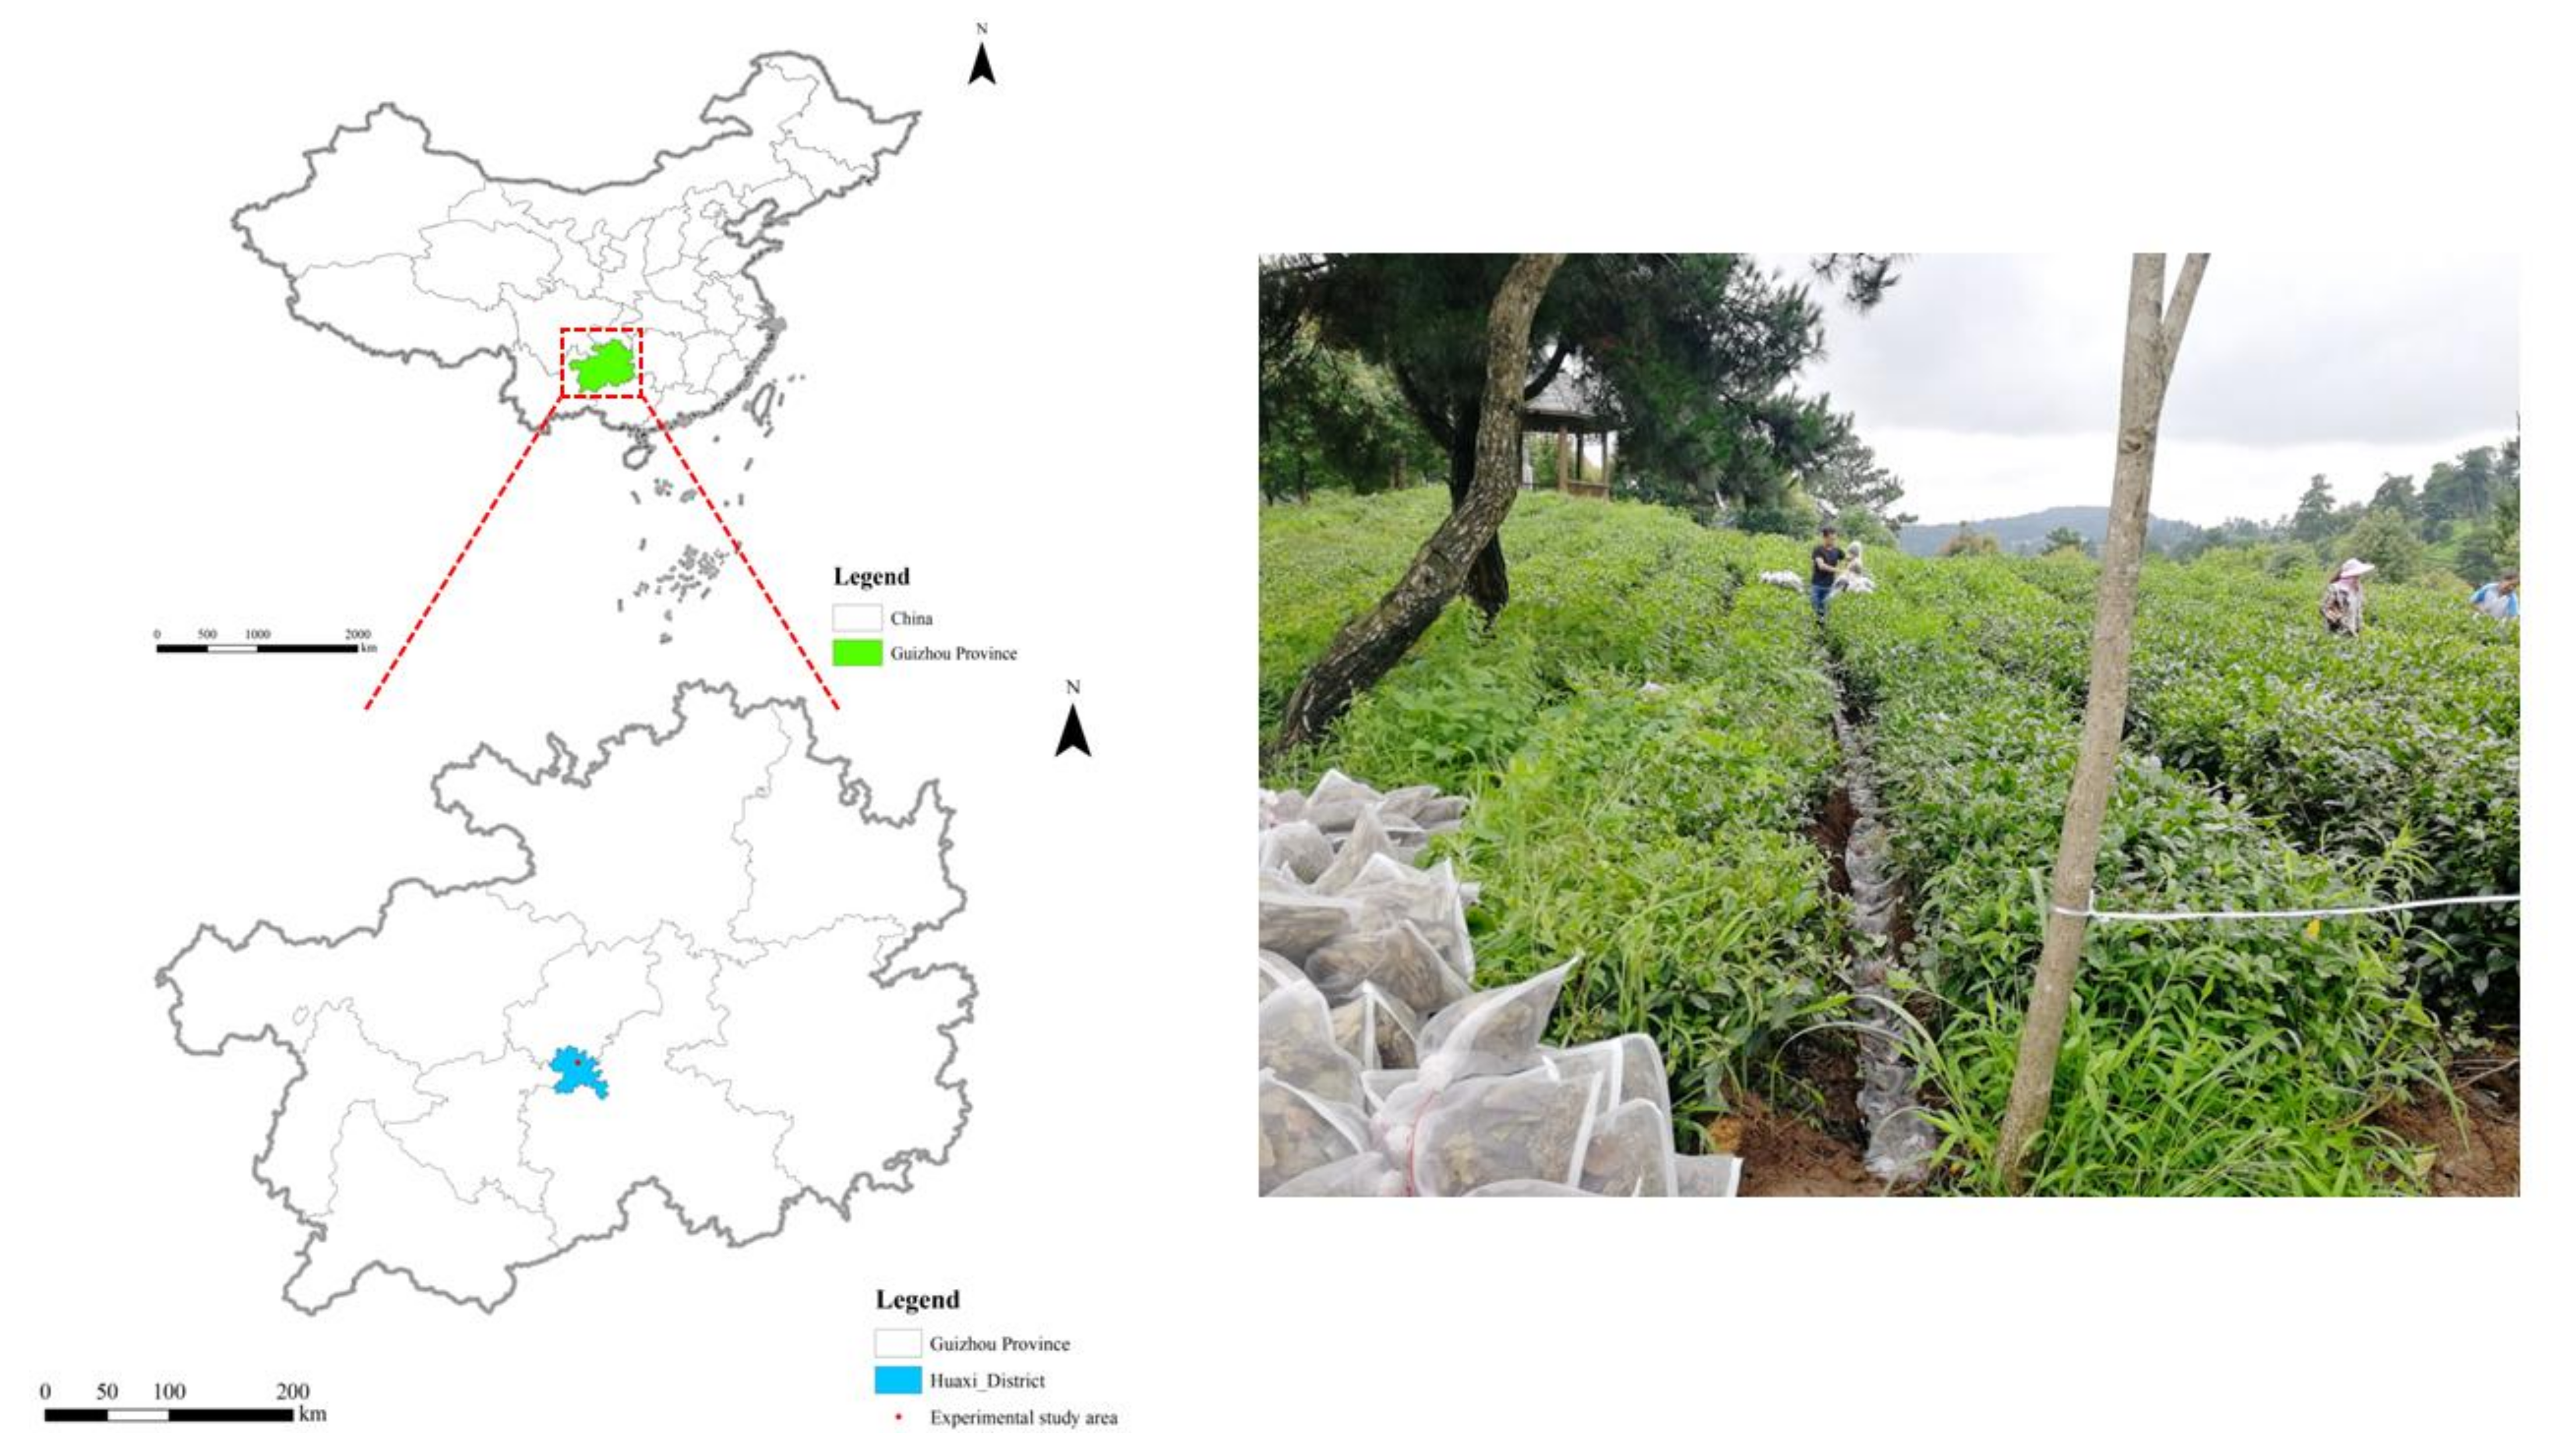
Figure 1. Experimental study area.
Agronomy 12 02717 g001
Figure 2. Schematic diagram of the experimental field layout. Note: CS—Camellia sinensis; CCL—C. sinensis + Cunninghamia lanceolata; CPM—C. sinensis + Pinus massoniana; CCG—C. sinensis + Cinnamomum glanduliferum; CBL—C. sinensis + Betula luminifera; CK—control. The same notation is used in subsequent figures.
Agronomy 12 02717 g002
Figure 3. Characteristics of the decomposition rates of the plant residues. Note:. a, b, c—differences between treatments in the same decomposition period. (p < 0.05).
Agronomy 12 02717 g003
Figure 4. Dynamic changes in nutrients of different plant residues during the decomposition process. Note: A, B, C—differences between decomposition stages of the same treatment (p < 0.05); a, b, c—differences between treatments in the same decomposition period (p < 0.05); (a)—TC content (g-kg−1); (b)—TN content (g-kg−1); (c)—TP content (g-kg−1); (d)—TK content (g-kg−1); (e)—Lignin content (mg-kg−1); (f)—Cellulose content (mg-kg−1).
Agronomy 12 02717 g004
Figure 5. Dynamic changes in the nutrient release of different plant residues during the decomposition process. Note: A, B, C—differences between decomposition stages of the same treatment (p < 0.05); a, b, c—differences between treatments in the same decomposition period (p < 0.05).
Agronomy 12 02717 g005
Figure 6. Dynamic changes in the SOC contents of different plant residues during decomposition. Note: A, B, C—differences between decomposition stages of the same treatment (p < 0.05); a, b, c—differences between treatments in the same decomposition period (p < 0.05).
Agronomy 12 02717 g006
Figure 7. Dynamic changes in soil N contents of different plant residues during decomposition processes. Note: A, B, C—differences between decomposition stages of the same treatment (p < 0.05); a, b, c—differences between treatments in the same decomposition period (p < 0.05); (a)—STN content (g-kg−1); (b)—SAN content (mg-kg−1).
Agronomy 12 02717 g007
Figure 8. Dynamic changes in soil P contents of different plant residues during decomposition processes. Note: A, B, C—differences between decomposition stages of the same treatment (p < 0.05); a, b, c—differences between treatments in the same decomposition period (p < 0.05); (a)—STP content (g-kg−1); (b)—SAP content (mg-kg−1).
Agronomy 12 02717 g008
Figure 9. Dynamic changes in soil K contents of different plant residues during decomposition processes. Note: A, B, C—differences between decomposition stages of the same treatment (p < 0.05); a, b, c—differences between treatments in the same decomposition period (p < 0.05); (a)—STK content (g-kg−1); (b)—SAK content (mg-kg−1).
Agronomy 12 02717 g009
Figure 10. Measured and expected values of the nutrient release rates during CCG plant residue decomposition. Note: a, b—differences between expected value and measured value in the same decomposition period (p < 0.05).
Agronomy 12 02717 g010
Figure 11. Measured and expected values of the nutrient release rate during CPM plant residue decomposition. Note: a, b—differences between expected value and measured value in the same decomposition period (p < 0.05).
Agronomy 12 02717 g011
Figure 12. Measured and expected values of the nutrient release rate during CCL plant residue decomposition. Note: a, b—differences between expected value and measured value in the same decomposition period (p < 0.05).
Agronomy 12 02717 g012
Figure 13. Measured and expected values of the nutrient release rate during CBL plant residue decomposition. Note: a, b—differences between expected value and measured value in the same decomposition period (p < 0.05).
Agronomy 12 02717 g013
Table 1. Inceptive nutrients in the plant residues used for testing.
Plant Residue TypeTC
(g·kg−1)
TN
(g·kg−1)
TP
(g·kg−1)
TK
(g·kg−1)
Lignin
(mg·g−1)
Cellulose (mg·g−1)C/N RatioLignin/N Ratio
Camellia sinensis450.01 ± 19.24 b17.85 ± 1.40 ab1.88 ± 0.10 a1.26 ± 0.04 c171.40 ± 34.70 a16.37 ± 0.54 a25.35 ± 2.86 bc10.49 ± 1.41 b
Cunninghamia lanceolata452.12 ± 14.05 b15.28 ± 1.07 c1.27 ± 0.09 b0.72 ± 0.01 d184.74 ± 11.31 a12.64 ± 0.95 c29.7 ± 2.74 b12.16 ± 1.50 b
Pinus massoniana530.34 ± 16.94 a11.78 ± 1.62 d0.87 ± 0.05 c0.26 ± 0.01 e195.06 ± 25.34 a14.79 ± 0.49 b45.49 ± 5.48 a18.01 ± 2.40 a
Cinnamomum glanduliferum509.17 ± 8.5 a16.38 ± 0.74 bc0.91 ± 0.03 c2.14 ± 0.01 a117.20 ± 15.57 b16.51 ± 0.55 a31.11 ± 0.96 b7.19 ± 1.30 c
Betula luminifera432.22 ± 13.73 b19.37 ± 0.70 a1.82 ± 0.12 a1.49 ± 0.01 b159.05 ± 25.38 ab10.31 ± 0.14 d22.33 ± 0.62 d7.46 ± 0.47 c
Note: Different letters in the same column indicate significant differences in the data (p < 0.05).
Table 2. Regression model of the decomposition of dry matter determined by mass loss of plant residues.
Plant Residue TypeRegression EquationkR2Half-Life (a)Turnover Period (a)
Camellia sinensis (CS)y = 78.305e−0.045t0.045 ab0.8697 **1.31 ± 0.20 bc5.68 ± 0.88 bc
Camellia sinensis + Cinnamomum glanduliferum (CCG)y = 73.903e−0.047t0.047 a0.9579 **1.23 ± 0.05 c5.32 ± 0.12 c
Camellia sinensis + Pinus massoniana (CPM)y = 80.114e−0.038t0.038 b0.9585 **1.51 ± 0.10 b6.53 ± 0.42 b
Camellia sinensis + Cunninghamia lanceolata (CCL)y = 78.713e−0.032t0.032 b0.9919 **1.83 ± 0.12 a7.90 ± 0.51 a
Camellia sinensis + Betula luminifera (CBL)y = 72.981e−0.042t0.042 ab0.8862 **1.37 ± 0.13 bc5.93 ± 0.56 bc
Note: Different letters in the same column indicate significant differences in the data (p < 0.05); **: p < 0.01.
Table 3. Measured and expected mass decomposition rates of the mixed plant residues (n = 3) %.
Plant Residue TypeValue TypeDecomposition Time (d)
62123184305366428
CCGExpected value38.67 ± 1.58 b46.28 ± 0.37 a50.04 ± 0.85 a54.90 ± 1.02 a55.50 ± 2.21 a57.44 ± 4.89 a
Measured value43.43 ± 1.28 a45.03 ± 2.47 a50.55 ± 2.31 a55.30 ± 3.42 a56.39 ± 2.00 a57.29 ± 1.42 a
CPMExpected value31.97 ± 1.26 b39.65 ± 0.30 a42.26 ± 1.28 a46.48 ± 1.67 a47.32 ± 2.30 a49.98 ± 2.90 a
Measured value34.96 ± 0.79 a35.89 ± 2.71 b42.16 ± 4.68 a46.03 ± 4.01 a48.62 ± 3.12 a49.13 ± 1.33 a
CCLExpected value36.86 ± 1.02 a42.73 ± 0.54 a45.54 ± 0.85 a49.05 ± 1.27 a50.19 ± 0.63 a51.86 ± 4.09 a
Measured value35.55 ± 1.03 a37.64 ± 1.46 b39.85 ± 2.21 b43.31 ± 2.00 b44.54 ± 2.19 b45.64 ± 1.46 b
CBLExpected value37.95 ± 1.96 b46.15 ± 1.28 a49.45 ± 1.00 a51.86 ± 1.80 a52.81 ± 0.33 a54.32 ± 3.60 a
Measured value41.53 ± 1.75 a47.79 ± 2.16 a50.70 ± 1.12 a53.49 ± 1.48 a54.34 ± 2.33 a55.10 ± 1.29 a
Note: a, b—differences between expected value and measured value in the same decomposition period of the same treatment (p < 0.05).
Table 4. Expected and measured decomposition rates of the mixed plant residues.
Plant Residue TypeDecomposition Rate (k)Mixed Effect
Measured ValueExpected Value
CCG0.047 ± 0.002 a0.049 ± 0.005 an
CPM0.038 ± 0.003 a0.039 ± 0.004 an
CCL0.032 ± 0.002 b0.040 ± 0.004 a-
CBL0.042 ± 0.004 a0.042 ± 0.004 an
Note: a, b—differences between expected value and measured value of the same treatment (p < 0.05); “+” indicates a positive mixed effect or synergistic effect. “−” indicates a negative mixed effect or antagonistic effect. “n” indicates no significant mixed effect or additive effect (p > 0.05).
Publisher’s Note: MDPI stays neutral with regard to jurisdictional claims in published maps and institutional affiliations.