Abstract
Wheat stripe rust-damaged leaves present challenges to automatic disease index calculation, including high similarity between spores and spots, and difficulty in distinguishing edge contours. In actual field applications, investigators rely on the naked eye to judge the disease extent, which is subjective, of low accuracy, and essentially qualitative. To address the above issues, this study undertook a task of semantic segmentation of wheat stripe rust damage images using deep learning. To address the problem of small available datasets, the first large-scale open dataset of wheat stripe rust images from Qinghai province was constructed through field and greenhouse image acquisition, screening, filtering, and manual annotation. There were 33,238 images in our dataset with a size of 512 × 512 pixels. A new segmentation paradigm was defined. Dividing indistinguishable spores and spots into different classes, the task of accurate segmentation of the background, leaf (containing spots), and spores was investigated. To assign different weights to high- and low-frequency features, we used the Octave-UNet model that replaces the original convolutional operation with the octave convolution in the U-Net model. The Octave-UNet model obtained the best benchmark results among four models (PSPNet, DeepLabv3, U-Net, Octave-UNet), the mean intersection over a union of the Octave-UNet model was 83.44%, the mean pixel accuracy was 94.58%, and the accuracy was 96.06%, respectively. The results showed that the state-of-art Octave-UNet model can better represent and discern the semantic information over a small region and improve the segmentation accuracy of spores, leaves, and backgrounds in our constructed dataset.
1. Introduction
Wheat stripe rust is a disease caused by the fungus Puccinia striiformis f. sp. tritici (Pst) that can destroy wheat crops [1]. It is one of the most dangerous wheat diseases worldwide, causing more than 5 million tons of wheat to be lost annually and costing nearly $1 billion [2]. It is also one of the most serious biological disasters affecting the safety of wheat production in China, mainly in the Hebei, Henan, Shandong, Shanxi, and Qinghai provinces. Stripe rust has been reported to have a devastating impact on wheat yields, leading to a reduction of more than 40% or even no wheat harvest in pandemic years [3]. Therefore, deploying real-time monitoring and accurate diagnosis of the disease severity before an outbreak will facilitate the much-needed timely implementation of prevention and intervention strategies and shift from passive disease prevention and control to active control. However, the traditional disease severity classification approaches are mostly visual and the severity of wheat rust is classified according to the percentage of spot areas (rather than spore areas) to the total leaf area. This has the disadvantages of high labor intensity, slow speed, significant subjectivity, and high misjudgment rates. However, rapidly developing artificial intelligence technologies have gradually been integrated into various disciplines. If the artificial intelligence image segmentation technology can be adopted to accurately identify the incidence area of wheat stripe rust, it can provide a theoretical foundation and technical support for guiding agricultural production and effective intelligent disease prevention and control.
The construction of a plant image dataset is very important for detecting diseases and pests using deep learning, and a high-quality dataset can improve the performance of the model and the accuracy of the results. Some scholars are constructing datasets related to agricultural diseases and pests. For example, Parraga-Alava J et al. [4] constructed a robusta coffee leaf image dataset called RoCoLe. The dataset contained 1560 images of leaves infected with visible red mites and spots (indicating the presence of coffee leaf rust) and healthy leaves. Additionally, the dataset included annotations on object (leaf), status (healthy and unhealthy), and disease severity (spotted leaf area). The proposal of this dataset laid the foundation for the classification of coffee leaf conditions using deep learning. Parraga-Alava J et al. [5] provided a dataset of 665 images of healthy and unhealthy lemon leaves. The latter were leaves where aphids were present, and the visible white spots were their characteristic. Additionally, each image contained a set of annotations identifying leaves, their health status and infestation severity based on the percentage of affected area. Next, Parraga-Alava J et al. [6] proposed a method to automatically detect aphids on lemon leaves using a convolutional neural network (CNN) as a binary classification problem and solved it using the VGG-16 network architecture. The experimental results reached average aphid detection rate of 81% to 97%. Unfortunately, there is currently no segmentation dataset for wheat stripe rust. In the field of wheat disease research, many researchers have applied image processing technology for the recognition, detection, and segmentation of disease-related data. Kukreja et al. [7] constructed a 2000-image wheat plant dataset and used a deep-learning method, namely, deep convolutional neural network (DCNN), for the automatic classification of rust, leaf spot, spike, and viral diseases. The classification accuracy of the method reached 97.16%. Sood et al. [8] used two transfer learning techniques to implement deep-learning models for the detection of wheat rust and automatic classification of leaf rust, stem rust, and stripe rust. The study found that the classification accuracy based on the VGG16 model was the highest, reaching 99.07%. Hayit et al. [9] proposed a Yellow-Rust-Xception model based on a DCNN. Using the severity of stripe rust, the model divided the input wheat stripe rust images into five types: disease-free, disease-resistant, moderately resistant, moderately susceptible, and susceptible, and automatically learned and recognized features in the data. The results showed that the performance of the proposed network for the specific task was comparable to or even better than that of humans, with the accuracy reaching 91%. Bao et al. [10] studied powdery mildew and stripe rust and proposed an algorithm for wheat leaf disease detection and severity recognition based on the ellipse-maximum boundary criterion metric learning. The experimental results showed that the proposed algorithm was superior compared to the traditional support vector machine, with the recognition accuracy reaching 94.16%. Su et al. [11] used a feature pyramid network based on the ResNet-101 network as the backbone of a Mask-RCNN to construct a feature pyramid and extract features. After generating a mask image of a wheat ear from a full-size image, the Mask-RCNN was used to predict the affected area on each individual ear. The detection rates of the method were 77.76% and 98.81%, respectively. By calculating the ratio of the detected wheat SCAB severity to the ground truth, prediction accuracy of 77.19% was observed.
It can be seen from the above recent studies that the application of image processing technology for automatic diagnosis, reactive classification, and disease index calculation using plant disease images has been advancing. However, the current studies in this field still focus on the classification of different diseases and target detection, and have the following shortcomings:
(1) Most of the disease datasets have only been used for the classification of disease type rather than segmentation of a specific disease. The specific incidence of a disease cannot be evaluated, and the disease management decisions cannot be supported with quantitative data.
(2) For many diseases, only small numbers of images are available or are of small scale. The targets and background are not sharply differentiated. Light and shooting angle and access device pixel resolution have a significant effect on the interference factors, making segmentation tasks difficult. Thus, the accuracy, precision, and generalization ability of the existing segmentation algorithms and disease models need to be improved.
To resolve the above problems, this study first established a wheat stripe rust image dataset and designed a novel semantic segmentation task for spores, leaves, and backgrounds. Image processing, deep learning, and other technologies were applied to the dataset. The performance of convolutional neural network models with different architectures for extracting the features from the dataset was explored, and a model with the best segmentation performance was determined.
2. Materials and Methods
2.1. Data Collection
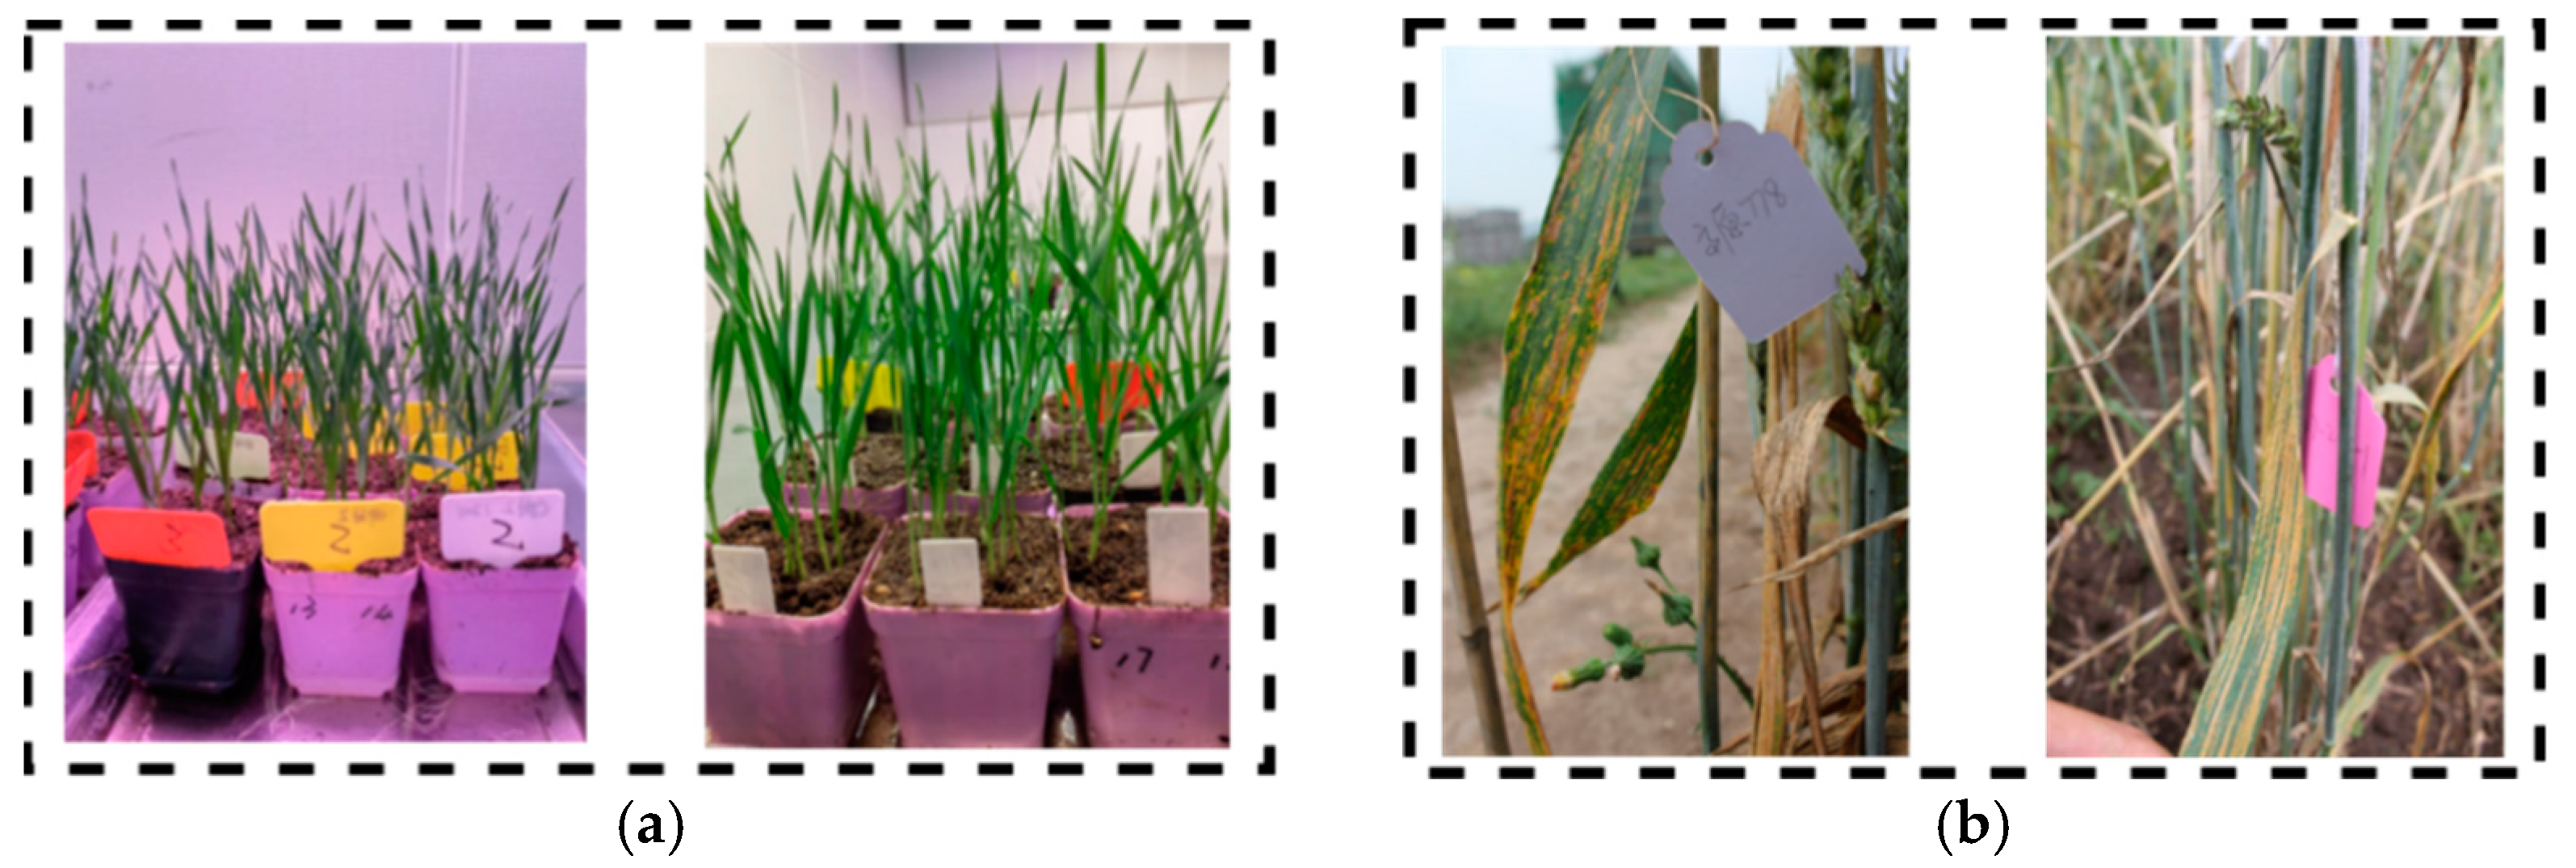
The crop disease treatment dataset based on an artificial intelligence system (CDTS) presented in this study is the first open dataset of wheat stripe rust images in Qinghai province. The development principles were as follows: images of wheat stripe rust obtained under different illumination and angles were taken at a wheat stripe rust cultivation greenhouse in the Qinghai Academy of Agricultural Sciences in the morning, in the middle of the day, and in the evening. Photos of wheat stripe rust specimens were also collected in the fields in Galianggou Village, Galiang Township, Guide County, Hainan Prefecture, Qinghai Province, and Chengshang Village, Kangyang Town, Jianzha County, Haidong City and other areas in Qinghai province. Parts of the sampling scenarios are shown in Figure 1. In order to further diversify the dataset, 2353 images with 538 different resolutions were obtained using different mobile devices. Among them, 178 images were 1470 × 2608 pixels, 508 images 2310 × 4096 pixels, 397 images 1891 × 4096 pixels, 420 images 3000 × 4000 pixels, and 32 images 3001 × 4001 pixels.

Figure 1.
Wheat stripe rust sampling scenes. (a) Collection of diseased leaves cultivated in greenhouse; (b) diseased leaf collection for field investigation.
2.2. Data Annotation and Processing
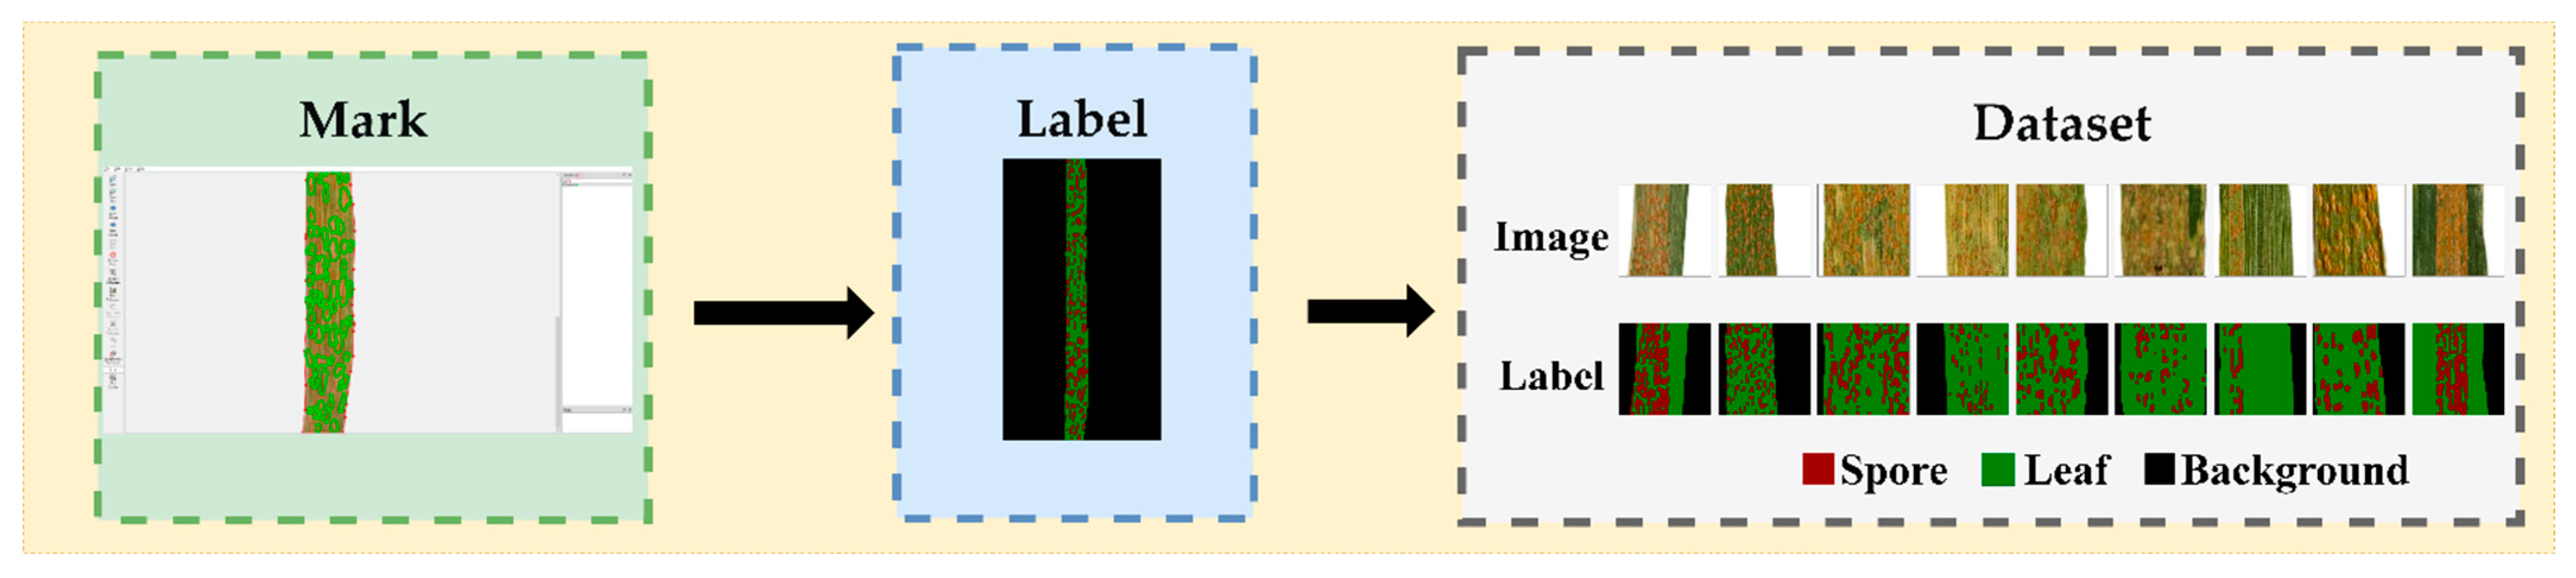
After matting the 2353 images, the Labelme4.5.13 [12] software was used to manually label the images. The tool “Create Polygons” was used to annotate the leaf category first, then the spore category and the remainder were assigned to the background category. The segmentation task was to divide the image into three categories: background, leaf, and spore.
The significance of this research is that, in the field of agricultural diseases, no tool exists that can directly quantify the spore-to-leaf area ratio in wheat leaves. In the field investigations of wheat rust, researchers and technical agricultural personnel usually use the percentage of spot area to the leaf area, namely, the severity of the disease, observed by the naked eye, to arrive at the disease index. However, this approach is very subjective and can only provide qualitative conclusions. If the quantitative data on rust disease occurrence of popular resistant wheat varieties can be obtained, the regional variation and dynamic changes in resistant wheat varieties can be better understood, to promote resistant wheat varieties in different areas. The segmentation task using computer vision techniques is difficult because the disease spore and spot areas are very similar, and spore and spot pixels are distributed over a small area of the image. The purpose of the data collection and segmentation was to calculate the percentage of the rust uredospore heap to the total leaf area.
The dataset was subsequently processed as follows: (1) image grid clipping. Due to the significant similarity between spores and spots, the image had to be enlarged before annotation. The original images were about 1000 × 4000 pixels. If the pixel size of the image were directly adjusted to 512 × 512, the image would be distorted and a significant amount of information lost, resulting in the difficulty of distinguishing spores from spore edges. Thus, the original images were divided into multiple small 512 × 512-pixel images to ensure that the semantic information in the images could be fully learned by the neural network. At the same time, an image can be divided into several 512 × 512-pixel local images to enhance the amount of data. Eventually, the total of 2353 images collected by different mobile devices were divided into 77,152 smaller 512 × 512-pixel images. (2) Image filtering. Since the proportion of targets in the original images is usually less than 100%, i.e., not all the original images contain target pixels, there will be a considerable proportion of pure background images after image division. To strengthen the generalization ability of the model, 43,914 background images were deleted, 1500 were retained, and, as a result, the total number of images changed from 77,152 to 33,238.
The steps of the dataset generation process are shown in Figure 2.
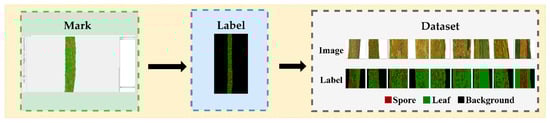
Figure 2.
CDTS dataset production steps.
The entire dataset is divided into training set (60%), validation set (20%) and test set (20%). The resolution of all images is 512 × 512, the training set has 19,942 images, the validation set has 6648 images, and the testing set has 6648 images.
2.3. U-Net
The encoder-decoder structure first proposed in the U-Net model is very effective for image segmentation. In this study, a U-Net model was also found the best among the three considered models (pyramid scene parsing network (PSPNet), DeepLabv3, and U-Net). Ronneberger et al. [13] proposed the U-Net model to effectively solve the semantic segmentation problem in medical images. The U-Net structure consists of two parts: an encoding module and a decoding module, namely, the contraction path that captures the context, the encoding layer, and the symmetric expansion path that can be accurately located, the decoding layer. The encoding layer performs a series of convolution operations and includes a maximum pooling layer, while the decoding layer performs a series of convolution and transpose convolution operations. To combine features between different levels, U-Net adopts a layer-hopping connection mechanism, which combines the features not compressed by the encoder with features corresponding to the same layer in the decoder to better fuse different semantic information.
The training strategy of the U-Net model is to use image enhancement technology to effectively learn from a small number of annotated sample images. After training with 30 molecular images through microscopic imaging, the U-Net model won the 2015 ISBI Cell Tracking Challenge Competition by a large margin.
2.4. PSPNet
The multi-scale analysis is a powerful concept in image processing and is deployed in many neural network architectures. Zhao et al. [14] proposed the PSPNet, which can better learn from the global context information of scene reaction.
Alongside an extended network, the multi-scale model uses a residual network to extract features from the input images. The obtained feature maps are fed into the pyramid pool model to distinguish features of different scales. A feature map is pooled into four different scale features, where each scale corresponds to a pyramid layer, and then a 1 × 1 convolution kernel is used to reduce their size. The output of the pyramid network in each layer is upsampled and then merged with the original feature map to obtain local and global context information. Finally, the prediction results at the pixel level are obtained in the convolution layer.
2.5. DeepLabv3
The dilated convolution introduces another parameter of the convolutional layer, the dilated coefficient. A 3 × 3 convolution kernel with an expansion coefficient of 2 has the same receptive field as a 5 × 5 convolution kernel with only 9 parameters. Therefore, the dilated convolution enlarges the receptive field without increasing the computational burden.
Chen et al. [15] proposed DeepLabv3, which combines cascade and parallel modules in a dilated convolution. Parallel convolution modules are grouped in a void-space convolution pooling pyramid, and a 1 × 1 convolution and batch standardization operation are added. The convolution pooling pyramid in the void space uses filters to detect the incoming convolution feature layers at different sampling rates, which can better capture the context information of objects and multi-scale images to steadily segment objects at multiple scales. All the outputs are merged and then subjected to a 1 × 1 convolution operation to output the logistic regression results of each pixel.
2.6. Octave-UNet
For ordinary convolution, all input and output feature maps have the same spatial resolution, and some feature maps reflecting low-frequency information are spatially redundant and thus unnecessary. In order to reduce the redundant spatial features, Chen et al. [16] proposed a convolution of octave feature representation, which can directly decompose the feature map vector into a group of high- and low-frequency features.
The octave convolution is designed to efficiently process the frequency tensors corresponding to high and low frequencies while effectively integrating the information between the two frequencies. Let X and Y be the input and output tensors, respectively. The output of feature map is composed of the output of the high frequency and the output of the low frequency, respectively. represents that the convolution of group A feature map is updated to the convolution of group B feature map. Specifically, and represent the intra-frequency update, and and represent the inter-frequency information fusion.
To obtain a more accurate feature, the model adopts average pooling, which helps to mitigate the inconsistency of fused information from different scales. Therefore, after average pooling is used during downsampling, output of the octave convolution can be expressed as follows:
where f(X;W) represents a convolution with number of parameters W, pool(X,k) is an average pooling with convolution size k × k and step size , and upsample(X,k) is an upsampling with factor and interpolation method as nearest neighbor interpolation.
The Octave-UNet module is built on the basis of U-Net network [17], and the idea is to replace all ordinary convolutions with the octave convolutions based on the U-Net network architecture.
3. Results
3.1. Experimental Setup
In this study, a GPU cluster server with a Linux operating system, 7-core GPU, 262 Intel(R) Xeon(R) CPU E5-2680 V4@2.40 GHz, and TITAN Xp GPU was used. All models were trained, verified and tested in a single graphics card mode.
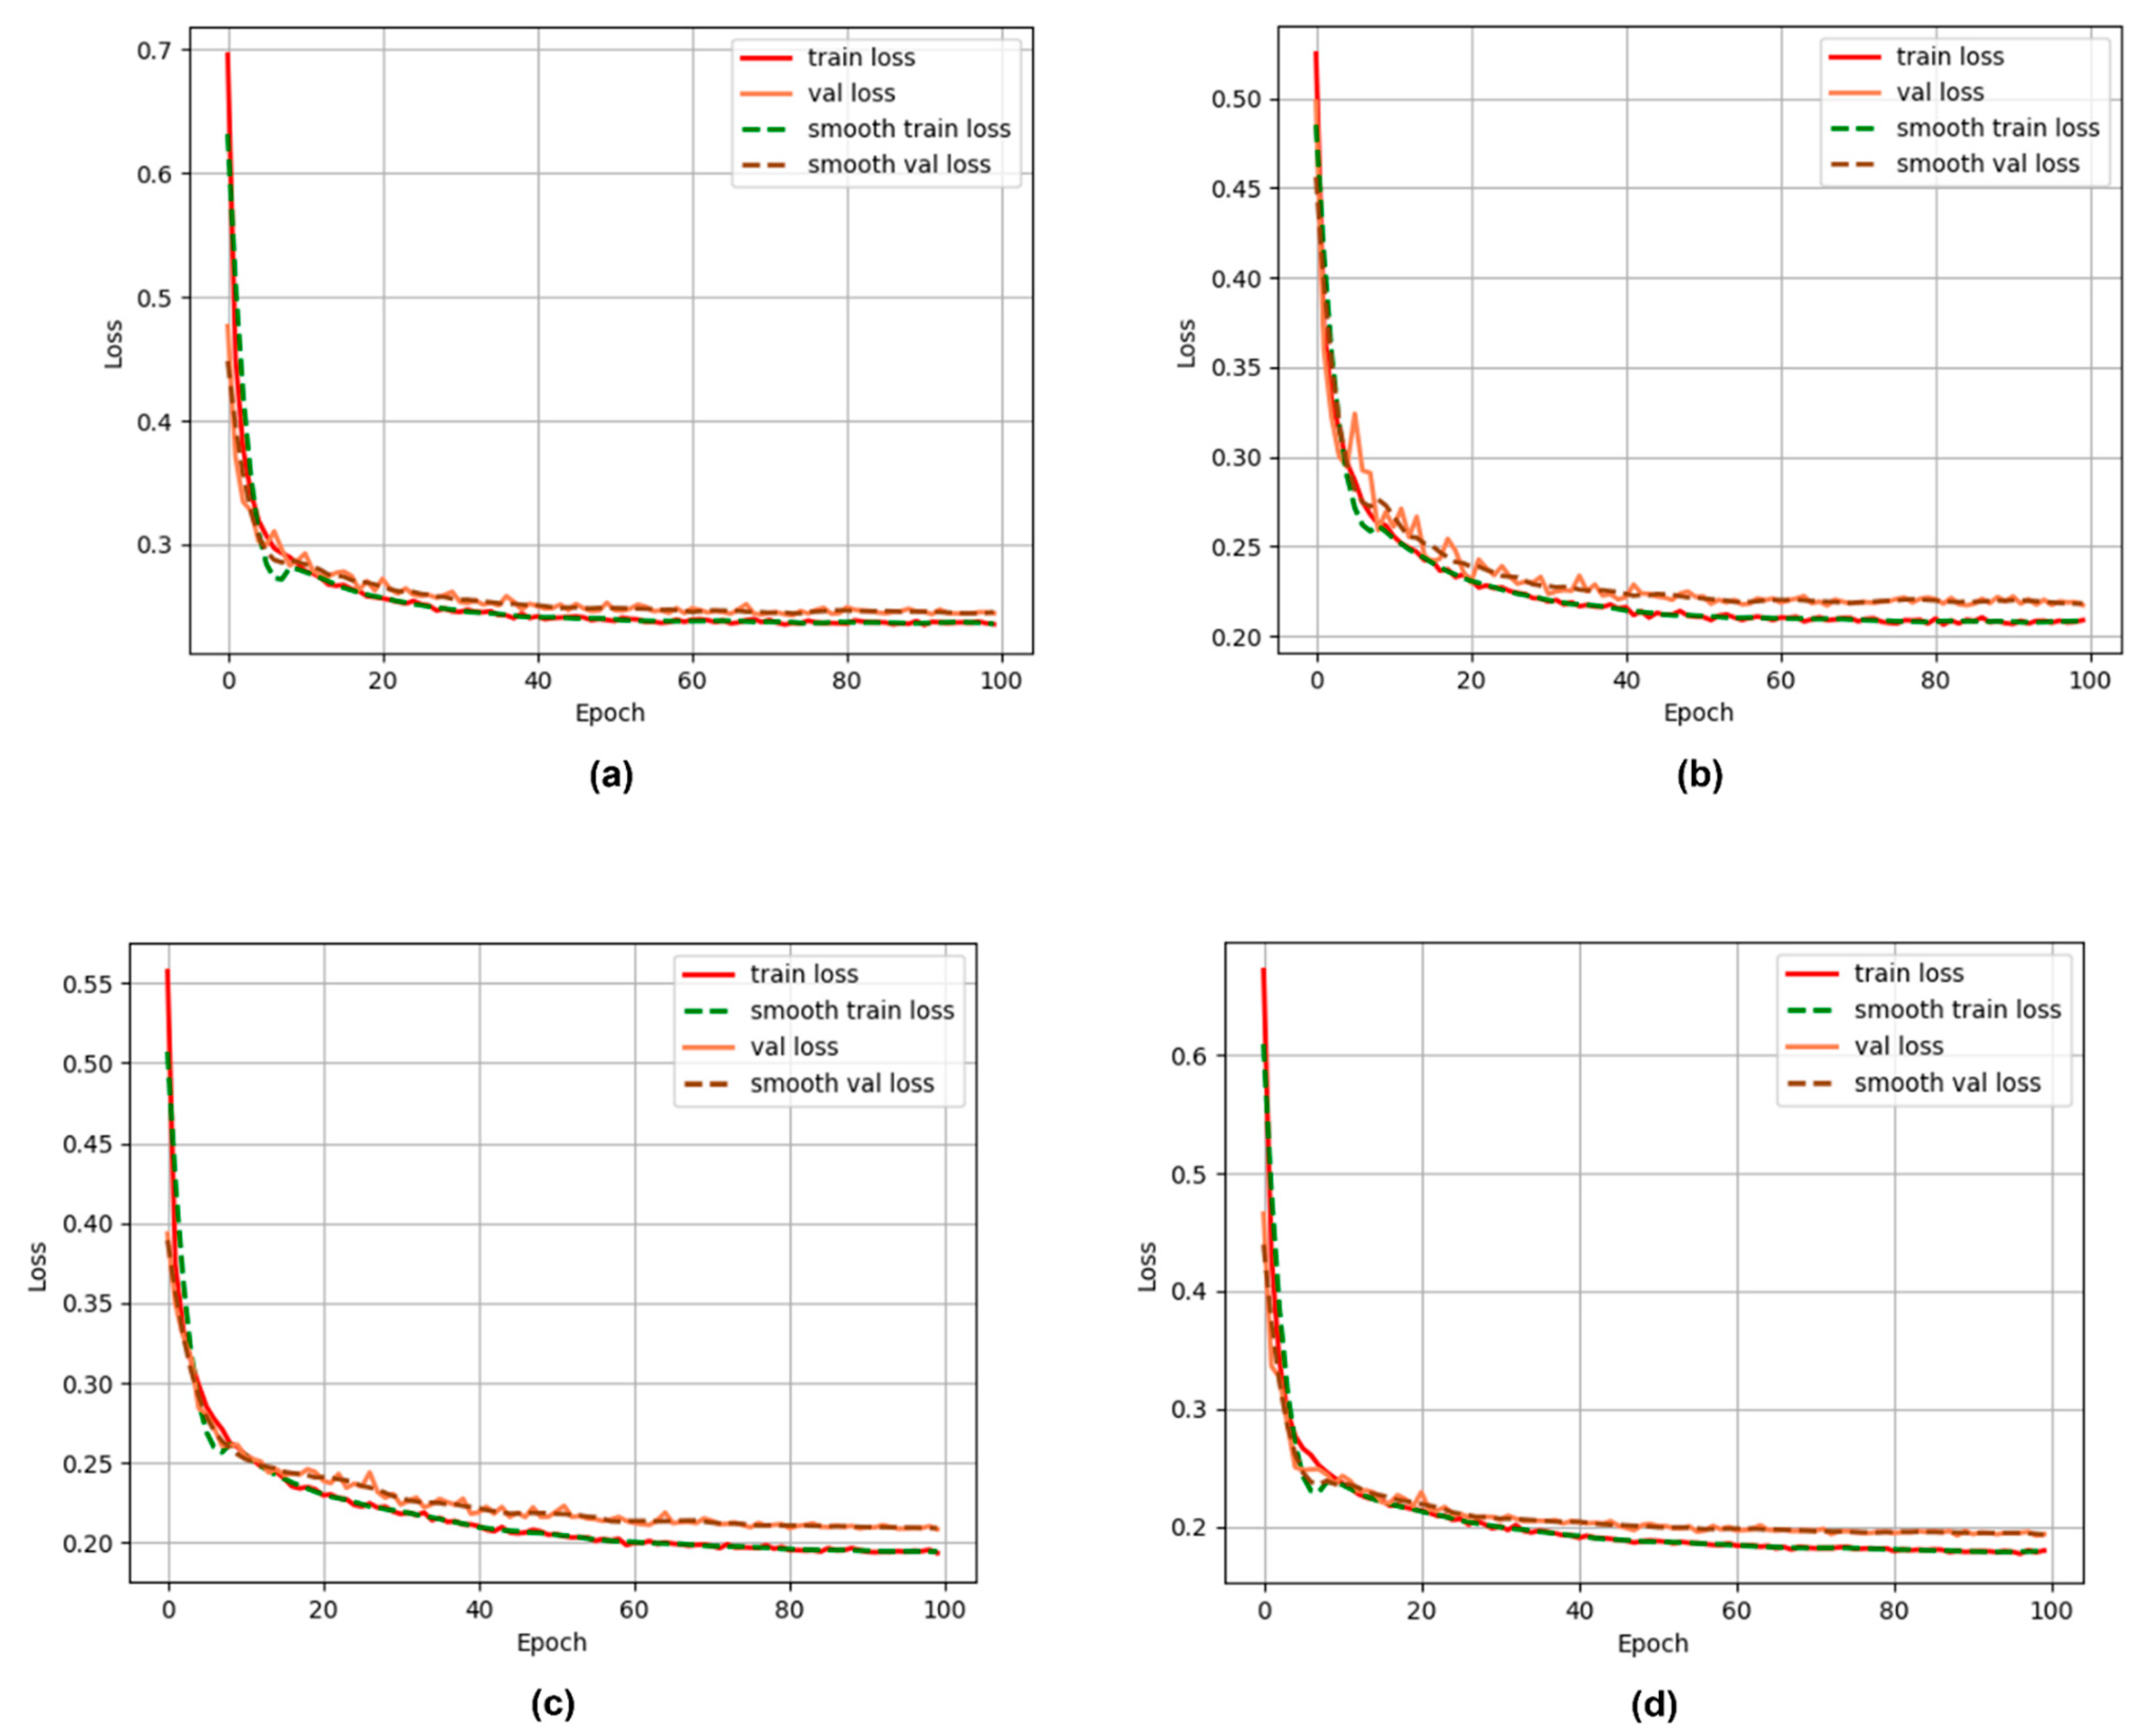
The number of training generations of all models was 100, the initial learning rate was 2 × 10⁻⁵, and the batch size was 8. An Adam optimizer was used in training by adjusting the learning rate mechanism. Each generation was updated once, and the multiplication factor of the updated learning rate, , was 0.96. The training error evolution curves are shown in Figure 3, where it can be seen that after 100 iterations, the four models converged and stabilized. The epochs with best performance on the validation set were selected for each model, i.e., the 74th epoch of the PSPNet, which had the training error of 0.237, and the validation error of 0.243, the 67th epoch of the DeepLabv3 model (training error of 0.209 and validation error of 0.217), the 100th epoch of U-Net model (training error of 0.193 and validation error 0.208), and the 99th epoch of the Octave-UNet model (training error of 0.179 and validation error of 0.193).
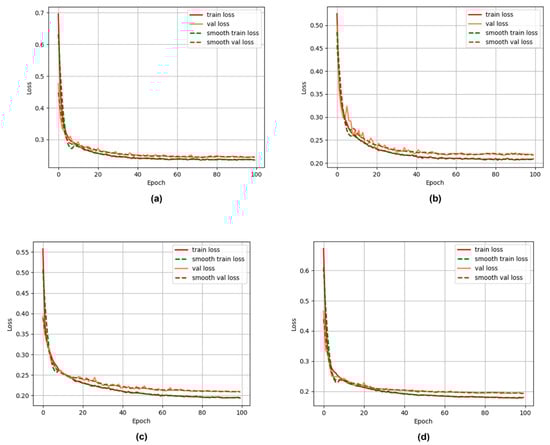
Figure 3.
Training loss curves for four models. (a) PSPNet model training loss curve; (b) Deeplabv3 model training loss curve; (c) U-Net model training loss curve; (d) Octave-UNet model training loss curve.
3.2. Performance Metrics
In semantic segmentation, a true positive (TP) is an outcome in which the actual object belongs to a positive class and the algorithm also predicts it as belonging to a positive class. A false positive (FP) is defined as a situation when the object belongs to a negative class but a positive class is returned by the algorithm. Those objects labeled as positive but judged as negative by the algorithm are defined as false negative outputs. If the actual object belongs to a negative class and the algorithm prediction is also negative, it is a true negative. In this study, precision, recall, and intersection over union (IoU) were used as model evaluation criteria for each category, and the mean intersection over union (MIoU) was used as the overall criterion. The mean pixel accuracy (MPA) and accuracy were used as the evaluation indices of the total sample.
Precision refers to the proportion of the data with a positive classification predicted correctly by the model (TPs) to all positive outcomes of the model (TPs and FPs). The calculation formula is as follows:
Recall, also known as sensitivity, refers to the proportion of data with a positive classification predicted correctly by the model (TPs) to all actual positive samples. The calculation formula is as follows:
The IoU ratio refers to the ratio between the intersection and the union of the predicted results of the model and the actual classes for a given category. The calculation formula is as follows:
When calculating the metrics of the entire sample, we assumed that the number of categories was k + 1, pij was the number of pixels that were actually in category i but were predicted to be in category j, pji was the number of pixels that were actually in category j but were predicted to be in category i, and pii was the number of pixels that were actually in category i and were predicted to be in category i.
The MIoU ratio was calculated by summing the ratios of the intersection and union of the prediction results of each class and the real values and then averaging. The calculation formula is as follows:
The MPA refers to the proportion of pixels correctly predicted by the model in each category and averaged for all categories. The calculation formula is as follows:
Accuracy refers to the proportion of samples correctly predicted by the model to the total number of samples in all categories. The calculation formula is as follows:
3.3. Segmentation Results for Each Class
Table 1 shows the segmentation performance of each model on the three categories measured by IoU, recall, and precision.

Table 1.
Segmentation results of four models for three categories.
For the background class, the highest IoU score of 98.22% was achieved by Octave-UNet, and it was 0.18% higher than U-Net (98.04%), 0.13% higher than DeepLabv3 (98.09%,), and 0.37% higher than PSPNet (97.85%). DeepLabv3′s 98.83% recall was 0.15% higher than that of Octave-UNet (98.68%), 0.3% higher than that U-Net (98.53%), and 0.11% higher than that of PSPNet (98.72%). Octave-UNet had the highest precision of 99.53%, which was 0.04% higher than U-Net (99.49%), 0.29% higher than DeepLabv3 (99.24%), and 0.42% higher than PSPNet (99.11%).
For the spore class, the Octave-UNet model achieved the best IoU ratio, recall, and precision. Octave-UNet’s IoU ratio was 64.03%, which was 1.13% higher than U-Net’s (62.9%), 4.01% higher than DeepLabv3′s (60.02%), and 7.62% higher than PSPNet’s (56.41%). Octave-UNet’s recall was 94.05%, and was 1.32% higher than that of U-Net (92.73%), 0.31% higher than that of DeepLabv3 (93.74%), and 0.96% higher than that of PSPNet (93.09%). Octave-UNet achieved a precision of 66.73%, which was 0.56% higher than that of U-Net (66.17%), 4.21% higher than that of DeepLabv3 (62.52%), and 8.15% higher than that of PSPNet (58.58%).
For the leaf category, Octave-UNet achieved the best IoU and recall metrics, while DeepLabv3 the best precision. Specifically, the IoU ratio of Octave-UNet was 88.08%, which was 0.48% higher than that of U-Net (87.6%), 1.9% higher than that of DeepLabv3 (86.18%), and 3.92% higher than that of PSPNet (84.16%). The recall rate of Octave-UNet was 91.01%, which was 0.99% higher than that of U-Net (90.02%), 2.23% higher than that of DeepLabv3 (88.78%), and 4.14% higher than that of PSPNet (86.87%). The precision of DeepLabv3 (96.71%) was 0.23% higher than that of Octave-UNet (96.48%), 0.71% higher than that of U-Net (96%), and 0.29% higher than that of PSPNet (96.42%).
3.4. Overall Segmentation Results
The segmentation performances of PSPNet, DeepLabv3, U-Net, and Octave-UNet models were then evaluated on the testing set. The evaluation results are shown in Table 2.
Table 2.
Overall segmentation results for the four models.
As can be seen in Table 2, the mean IoU ratio of Octave-UNet was 83.44%, which was 0.59% higher than that of U-Net (82.58%), 2.01% higher than that of DeepLabv3 (81.43%), and 4.06% higher than that of PSPNet (79.38%). Octave-UNet also achieved the highest MPA of 94.58%, which was 0.52% higher than U-Net (94.06%), 0.8% higher than DeepLabv3 (93.78%), and 1.68% higher than PSPNet (92.9%). In terms of accuracy, Octave-UNet also achieved the highest value of 96.06%, which was 0.19% higher than that of U-Net (95.87%), 0.6% higher than that of DeepLabv3 (95.46%), and 1.29% higher than that of PSPNet (94.77%). Overall, the Octave-UNet model achieved the highest scores in all three evaluation metrics.
3.5. Model Prediction Visualization
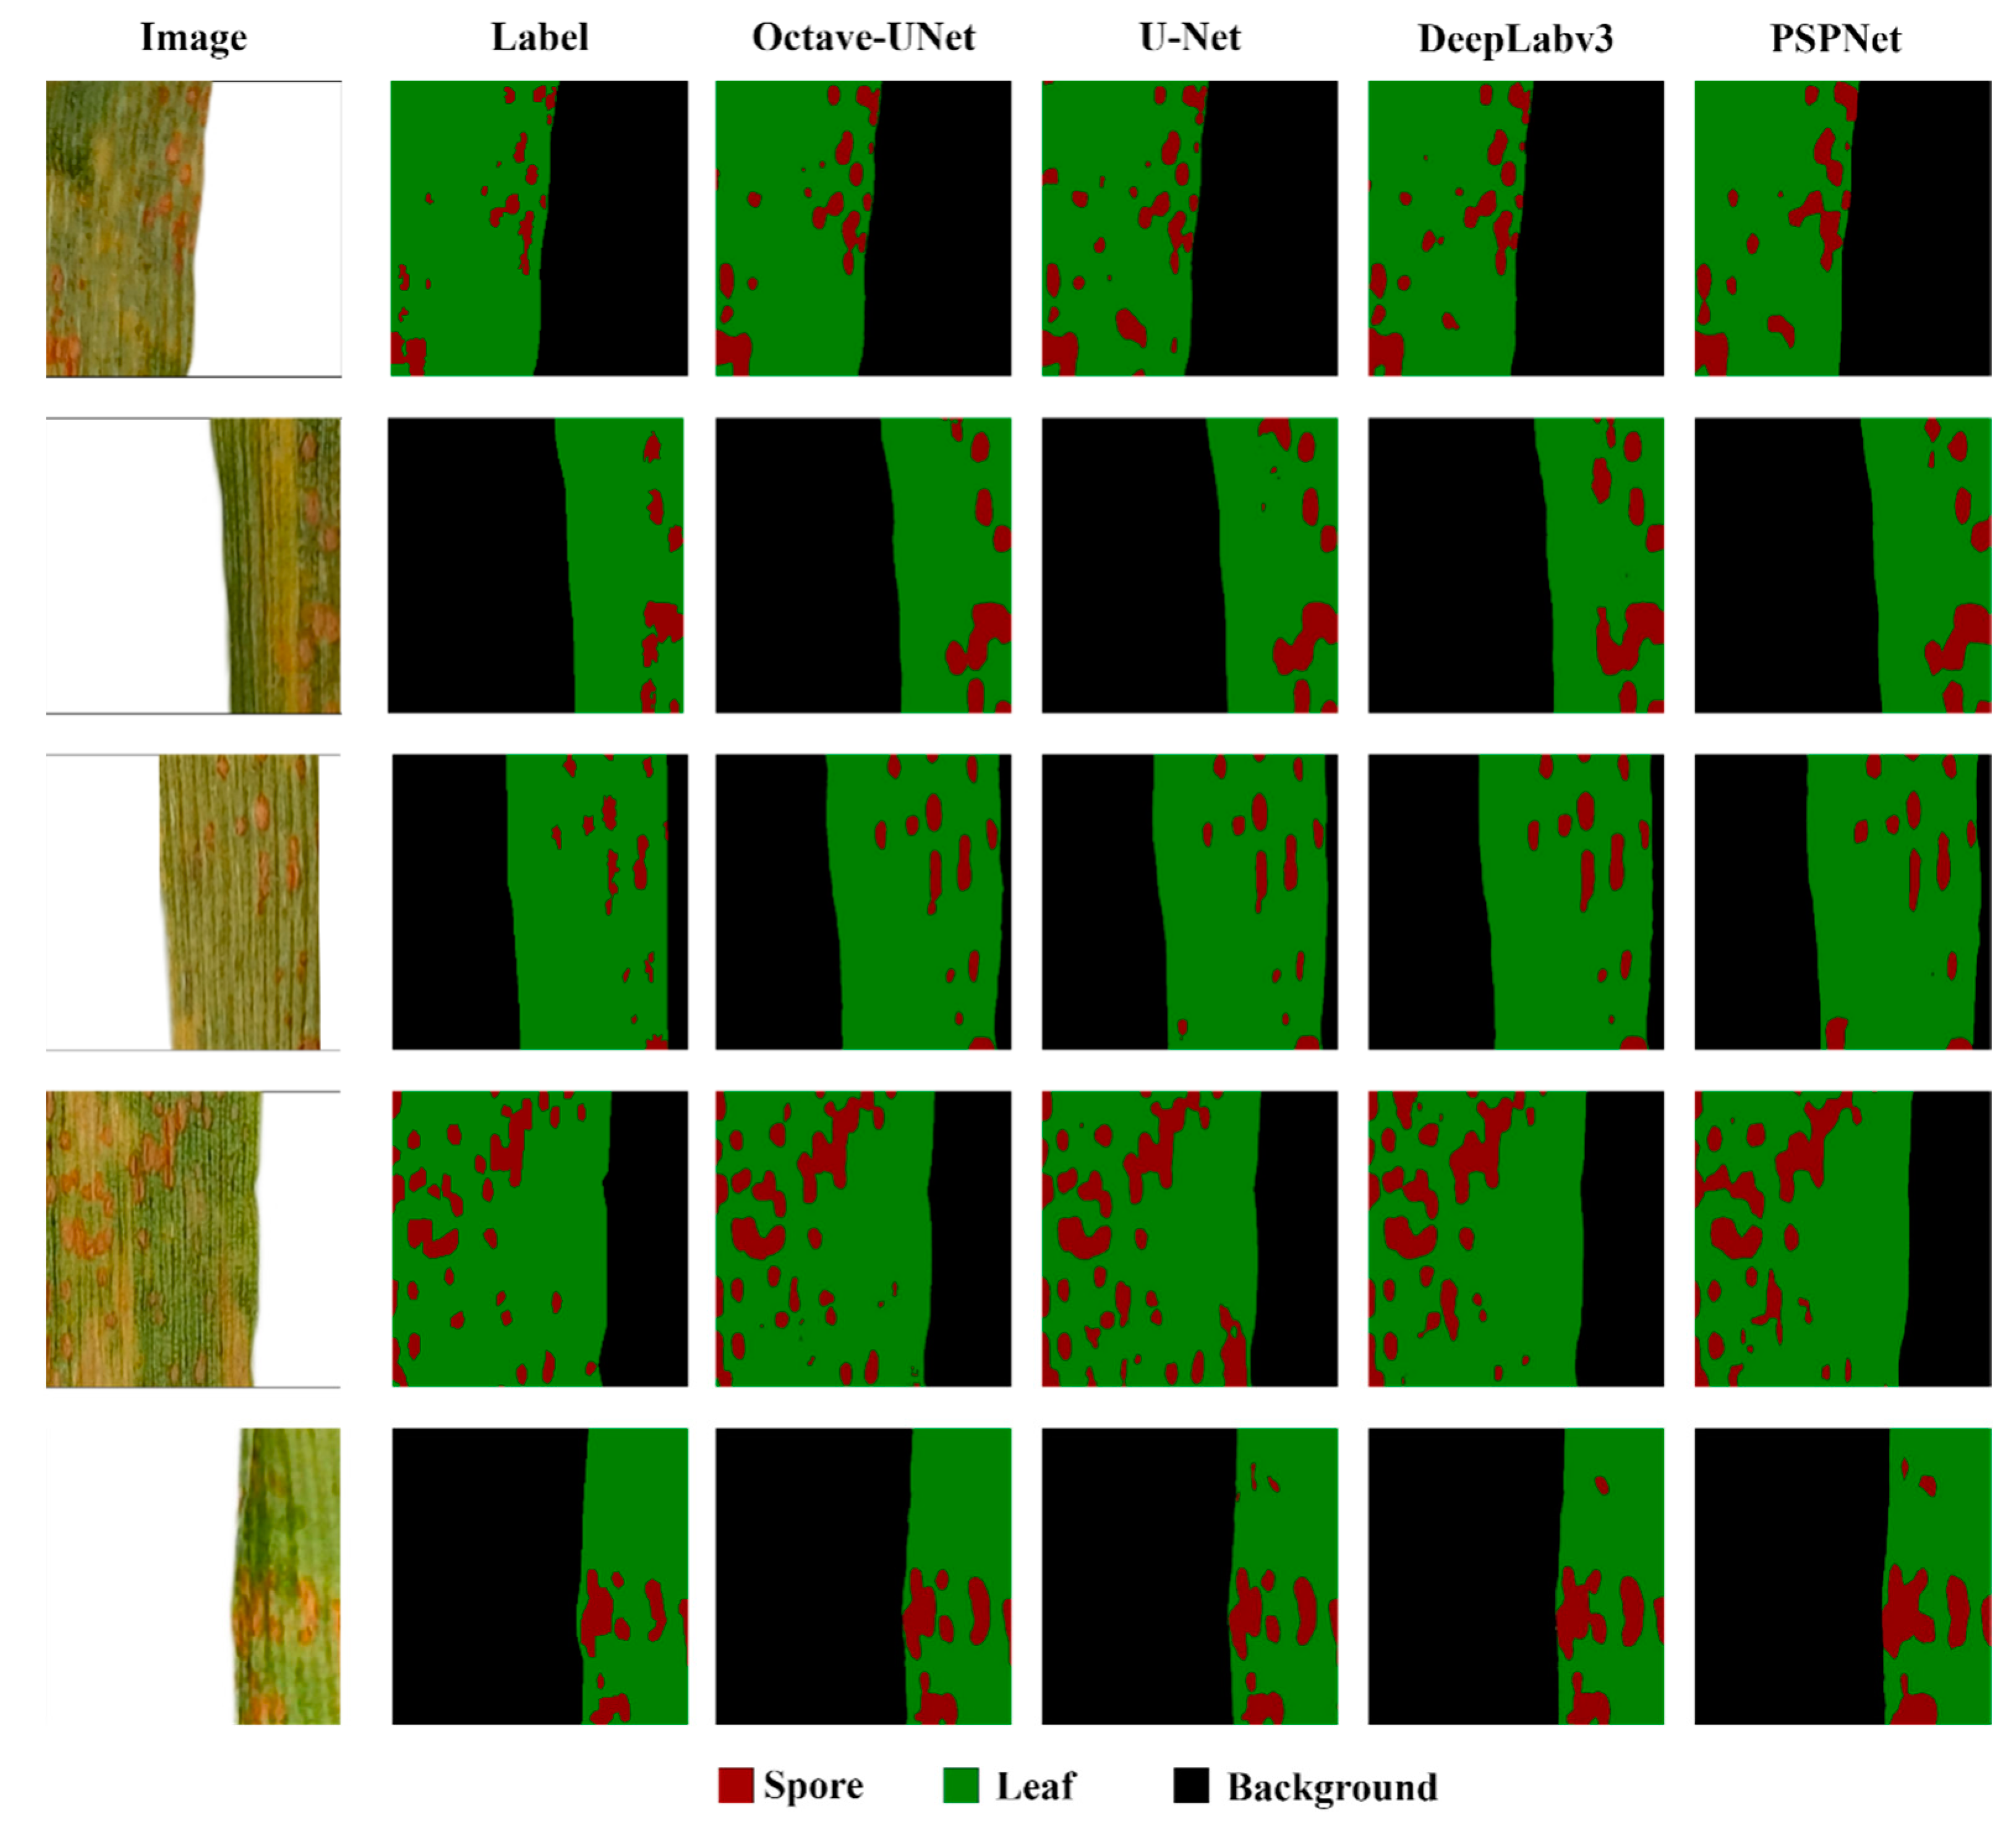
A part of the images showing infected leaves were selected for analysis by the four models. The corresponding manual labeling and predictions are displayed in Figure 4, where it can intuitively be seen that Octave-UNet provided the best predictions.
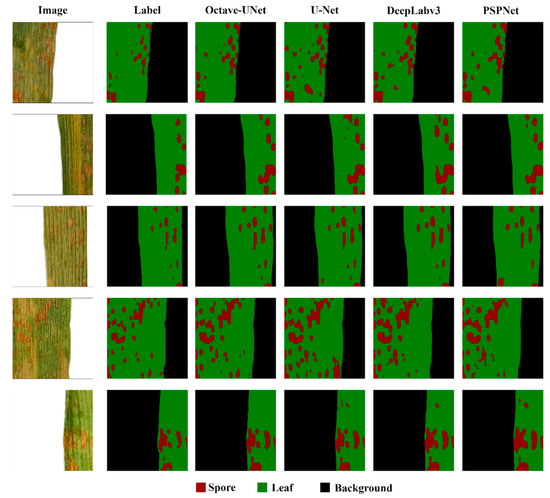
Figure 4.
Four models predict results.
4. Discussion
At present, there are few studies on quantifying the spore area ratio of stripe rust in wheat, but the quantitative data is very important for disease assessment and genetic experiment verification. In this paper, a large-scale segmentation dataset for wheat stripe rust was proposed for the first time, and a new segmentation paradigm was defined. Training on this dataset enabled the model to learn how to distinguish between spores and spots, so as to obtained the area ratio of spores to leaves. The proposal of this dataset had promoted the research progress of spore quantification data acquisition. In addition, this dataset presented the challenge of fine distinction of edge contours, which can provide a pre-trained model for solving similar disease segmentation. These confirm the importance and necessity of establishing the CDTS dataset.
It can be seen from the overall and individual category segmentation results that the U-Net model equipped with octave convolution had the best performance, demonstrated by its higher accuracy for small-area semantic segmentation. This happened because the volume in each layer was in the integration operation and semantic fusion of high-frequency information and low-frequency information occurred. The fusion of information can help distinguish spores from lesions, and at the same time reduce the redundancy of low-frequency information, improving the segmentation performance.
Wheat is the main food crop in the world and is therefore of great significance to humankind. Wheat stripe rust is a major fungal disease that endangers the safety of wheat crops. Any occurrence of the disease will lead to a severe grain production reduction and cause serious economic losses. When the disease incidence rate exceeds 5%, there are currently no better control measures than destroying the affected crops. Therefore, accurate detection and monitoring of wheat stripe rust will be beneficial for disaster prediction and forecasting, and can proactively prevent or reduce losses. Using deep learning to semantically segment the collected images of wheat leaves with stripe rust signs and automatically calculate the ratio of spores in the total leaf area can effectively address the shortage of agricultural experts and delays and misjudgments of artificial visual recognition systems.
5. Conclusions
This paper studied a semantic segmentation task for wheat stripe rust images. The main contributions of this study are as follows:
(1) Development of the first large-scale public dataset of wheat stripe rust images in Qinghai province, including field and greenhouse cultivation images, comprising a total of 33,238 images with a 512 × 512-pixel resolution, with a significant similarity between the targets and background. The characteristics of the target distribution provide data support for small-area, high-similarity semantic segmentation using deep-learning algorithms.
(2) The first to propose a segmentation paradigm that distinguished spores from spots, and obtained quantitative data of the ratio of spores to leaf area.
(3) Given the difficulty in distinguishing wheat stripe rust spores from disease spots, experiments confirmed that the octave convolution was adopted within a U-Net model to enable semantic fusion between high- and low-frequency information and more accurate capturing of the spore edges, learning the details and local information, reducing the redundancy of low-frequency information, and more accurate semantic understanding and segmentation of edge contours. Model performance evaluation was conducted using the established wheat stripe rust image dataset. The MIoU ratio of the Octave-UNet model was 83.44%, the MPA rate was 94.58%, and the accuracy was 96.06%, i.e., better than those of the remaining three models. The model was robust and realized the intelligent segmentation of wheat stripe rust images.
Author Contributions
Conceptualization, Y.L. (Yang Li), Q.H. and Q.Y.; methodology, Y.L. (Yang Li) and Q.H.; software, Y.L. (Yang Li); validation, Y.L. (Yang Li) and Q.H.; formal analysis, Y.L. (Yang Li); investigation, Q.Y. and H.L.; resources, Q.Y.; data curation, Y.L. (Yang Li), H.L., T.Q., W.L., W.J., J.L., Y.L. (Yang Lv), Y.T. and X.M.; writing—original draft preparation, Y.L. (Yang Li); writing—review and editing, Q.H. and Q.Y.; visualization, Y.L. (Yang Li); supervision, Q.Y.; project administration, Q.H. All authors have read and agreed to the published version of the manuscript.
Funding
This project was partially funded by National Key R&D Program of China (2021YFD1401000), National Natural Science Foundation of China (31960516), Key R&D Transformation Program of Qinghai Province (2022-NK-125), and the innovation and entrepreneurship training program of the College of Agriculture and Animal Husbandry of Qinghai University: 2021 (D202111131524533845).
Data Availability Statement
Direct URL to data: https://pan.baidu.com/s/1hYmyJxyFsWQpMro6Fix0ug?pwd=fp0k (accessed on 3 October 2022).
Conflicts of Interest
The authors declare no conflict of interest.
References
- Wang, N.; Tang, C.; Fan, X.; He, M.; Gan, P.; Zhang, S.; Hu, Z.; Wang, X.; Yan, T.; Shu, W.; et al. Inactivation of a Wheat Protein Kinase Gene Confers Broad-Spectrum Resistance to Rust Fungi. Cell 2022, 185, 2961–2974. [Google Scholar] [CrossRef] [PubMed]
- Beddow, J.M.; Pardey, P.G.; Chai, Y.; Hurley, T.M.; Kriticos, D.J.; Braun, H.J.; Park, R.F.; Cuddy, W.S.; Yonow, T. Research investment implications of shifts in the global geography of wheat stripe rust. Nat. Plants 2015, 1, 15132. [Google Scholar] [CrossRef] [PubMed]
- Jibin, M. Occurrence and control of stripe rust in wheat. Mod. Agric. Sci. Technol. 2019, 7, 91–94. [Google Scholar]
- Parraga-Alava, J.; Cusme, K.; Loor, A.; Santander, E. RoCoLe: A robusta coffee leaf images dataset for evaluation of machine learning based methods in plant diseases recognition. Data Brief 2019, 25, 104414. [Google Scholar] [CrossRef] [PubMed]
- Parraga-Alava, J.; Alcivar-Cevallos, R.; Morales Carrillo, J.; Castro, M.; Avellán, S.; Loor, A.; Mendoza, F. LeLePhid: An image dataset for aphid detection and infestation severity on lemon leaves. Data 2021, 6, 51. [Google Scholar] [CrossRef]
- Parraga-Alava, J.; Alcivar-Cevallos, R.; Riascos, J.A.; Becerra, M.A. Aphids Detection on Lemons Leaf Image Using Convolutional Neural Networks. In Proceedings of the International Conference on Systems and Information Sciences, Aljouf, Saudi Arabia, 7–9 April 2020; Springer: Cham, Switzerland, 2020; pp. 16–27. [Google Scholar]
- Kukreja, V.; Kumar, D. Automatic Classification of Wheat Rust Diseases Using Deep Convolutional Neural Networks. In Proceedings of the 2021 9th International Conference on Reliability, Infocom Technologies and Optimization (Trends and Future Directions) (ICRITO), Manhattan, NY, USA, 3–4 September 2021; pp. 1–6. [Google Scholar]
- Sood, S.; Singh, H. An Implementation and Analysis of Deep Learning Models for the Detection of Wheat Rust Disease. In Proceedings of the 2020 3rd International Conference on Intelligent Sustainable Systems (ICISS), Palladam, India, 3–5 December 2020; IEEE: Manhattan, NY, USA, 2020; pp. 341–347. [Google Scholar]
- Hayit, T.; Erbay, H.; Varçın, F.; Hayit, F.; Akci, N. Determination of the severity level of yellow rust disease in wheat by using convolutional neural networks. J. Plant Pathol. 2021, 103, 923–934. [Google Scholar] [CrossRef]
- Bao, W.; Zhao, J.; Hu, G.; Zhang, D.; Huang, L.; Liang, D. Identification of wheat leaf diseases and their severity based on elliptical-maximum margin criterion metric learning. Sustain. Comput. Inform. Syst. 2021, 30, 100526. [Google Scholar] [CrossRef]
- Su, W.H.; Zhang, J.; Yang, C.; Page, R.; Szinyei, T.; Hirsch, C.D.; Steffenson, B.J. Automatic evaluation of wheat resistance to fusarium head blight using dual mask-RCNN deep learning frameworks in computer vision. Remote Sens. 2020, 13, 26. [Google Scholar] [CrossRef]
- Russell, B.C.; Torralba, A.; Murphy, K.P.; Freeman, W.T. LabelMe: A database and web-based tool for image annotation. Int. J. Comput. Vis. 2008, 77, 157–173. [Google Scholar] [CrossRef]
- Ronneberger, O.; Fischer, P.; Brox, T. U-Net: Convolutional Networks for Biomedical Image Segmentation. In Proceedings of the International Conference on Medical Image Computing and Computer-Assisted Intervention, Munich, Germany, 5–9 October 2015; pp. 234–241. [Google Scholar]
- Zhao, H.; Shi, J.; Qi, X.; Wang, X.; Jia, J. Pyramid Scene Parsing Network. In Proceedings of the IEEE Conference on Computer Vision and Pattern Recognition, Hawaii, HL, USA, 21–26 July 2017; pp. 2881–2890. [Google Scholar]
- Chen, L.C.; Papandreou, G.; Schroff, F.; Adam, H. Rethinking atrous convolution for semantic image segmentation. arXiv 2017, arXiv:1706.05587. [Google Scholar]
- Chen, Y.; Fan, H.; Xu, B.; Yan, Z.; Kalantidis, Y.; Rohrbach, M.; Yan, S.; Feng, J. Drop an Octave: Reducing Spatial Redundancy in Convolutional Neural Networks with Octave Convolution. In Proceedings of the IEEE/CVF International Conference on Computer Vision, Seoul, Republic of Korea, 2 November 2019; pp. 3435–3444. [Google Scholar]
- Fan, Z.; Mo, J.; Qiu, B.; Li, W.; Zhu, G.; Li, C.; Hu, J.; Rong, Y.; Chen, X. Accurate retinal vessel segmentation via octave convolution neural network. arXiv 2019, arXiv:1906.12193. [Google Scholar]
Publisher’s Note: MDPI stays neutral with regard to jurisdictional claims in published maps and institutional affiliations. |
© 2022 by the authors. Licensee MDPI, Basel, Switzerland. This article is an open access article distributed under the terms and conditions of the Creative Commons Attribution (CC BY) license (https://creativecommons.org/licenses/by/4.0/).