Abstract
Leaf rust of wheat caused by Puccinia triticina (Pt) is one of the most common fungal diseases in the southwest and northwest of China, the middle and lower reaches of the Yangtze River, and the southern part of the Huang-Huai-Hai river basin. Using 13 simple sequence repeat (SSR) markers, we systematically revealed the genotypic diversities, population differentiation and reproduction of Pt isolates in 15 wheat-producing areas in China. A total of 622 isolates were divided into 3 predominant populations, including the eastern Pt populations, consisting of Pt samples from 8 eastern provinces of Beijing, Hebei, Shanxi, Shaanxi, Anhui, Shandong, Henan, and Heilongjiang; the 4 western Pt populations from Gansu, Qinghai, Sichuan, and Inner Mongolia provinces; and the bridge Pt populations including Jiangsu, Hubei, and Yunnan, which communicated the other 2 populations as a “bridge”. The pathogen transmission of eastern Pt populations was more frequent than western Pt populations. The linkage disequilibrium test indicated that the whole Pt population was in a state of linkage disequilibrium. However, populations of Beijing, Hebei, Shaanxi, Jiangsu, Henan, and Heilongjiang provinces showed obvious linkage equilibrium, while the five provinces of Qinghai, Hubei, Anhui, Shandong, and Inner Mongolia supported clonal modes of reproduction.
1. Introduction
Wheat is the third largest grain crop in China after corn and rice, accounting for 20.7% of Chinese total grain output, which is of great significance to Chinese grain stability [1]. Although China attaches great importance to the production and supply of wheat, it has still been facing various production crises [2]. Leaf rust of wheat caused by Puccinia triticina (Pt) is the most common and widespread fungal disease among the three major wheat rust diseases, which seriously threatens world wheat safety [3]. Wheat leaf rust has a wide incidence area, especially in the southwest and northwest of China, the middle and lower reaches of the Yangtze River, and the southern part of the Huang-Huai-Hai river basin [4]. In recent years, the occurrence of wheat leaf rust has been increasing. In 2008, 2009, 2012 and 2013, it occurred on a large scale throughout the country, causing serious losses in some areas of Shandong, Henan and Xinjiang. In 2015, it broke out in Huang-Huai-Hai region, especially in Henan, Anhui, and other provinces [5,6].
The prevention and control of wheat rust should be built on the strengthening of disease monitoring and integrated measures of planting disease-resistant varieties, supplemented by fungicides and cultivation control [7]. Planting disease-resistant varieties is the most effective and environmentally friendly method to control wheat leaf rust. However, the resistant varieties of wheat usually became ineffective in a few years due to rapid evolution of Pt [8]. In addition, urediniospores of Pt can disperse over large areas by air currents and migrate between different regions, causing it to establish new populations in new areas [9].
Although it is simple, intuitive, and practical to study the population virulence of Pt by traditional virulence analysis, the results are easily affected by the differential host, environmental conditions, and human factors, and it is difficult to comprehensively reflect the population genetic structure and genetic relationship of Pt [10]. SSR molecular marker technology effectively reveals diminutive variation among individuals within the same species, using a series of primer pairs [11]. Duan [12] and Szabo et al. [13] reported SSR primers for genetic polymorphism analysis of Pt in 2003 and 2007, respectively. Since then, population genetic studies of Pt using SSR markers were carried out in many regions of the world. Ordoñez et al. [14] determined the molecular polymorphisms between Pt populations collected from durum wheat and found that SSR genotypes of isolates from South America, North America, and Europe were highly similar, indicating that they might originate from a single source. Similar studies were carried out in central Asia [9], the Middle East [15], Europe [16], and other regions, including China.
Xu et al. [17] found high levels of population genetic diversity in Hebei, Henan, and Shandong provinces, and there was a correlation between genetic polymorphisms and geographical source. Kolmer [18] analyzed Pt samples from seven provinces in China, and found no overall differentiation of SSR genotypes or virulence phenotypes based on province of origin. The reason the results of these two studies on the genetic structure of Pt populations in China were not completely consistent was that the study did not include as many wheat production areas in China as possible. There were big differences in the ecological environment between eastern and western China. We believed that the genetic structure of Pt populations could be revealed more clearly in a broader landscape, and the genetic relationship of different populations in different regions of China can also be more comprehensively analyzed.
In this study, we collected samples of wheat leaf rust from 15 provinces (Beijing, Hebei, Henan, Shandong, Shanxi, Shaanxi, Anhui, Jiangsu, Hubei, Yunnan, Sichuan, Gansu, Qinghai, Heilongjiang, and Inner Mongolia) of China, using 13 SSR markers to determine if distinct regional division between populations in 15 provinces of Pt is present, and to reveal the reproduction mode of Pt populations in the above regions, which is important for formulating a suitable control strategy and an appropriate layout of leaf rust resistant varieties.
2. Materials and Methods
A total of 709 wheat leaf rust collections of Pt were obtained from locations in Beijing, Hebei, Shanxi, Yunnan, Jiangsu, Gansu, Qinghai, Sichuan, Hubei, Shaanxi, Anhui, Shandong, Henan, Heilongjiang, and Inner Mongolia provinces in 2018 (most of the collections were obtained and sent by scientists from the Chinese Cereal Rust and Powdery Mildew Research Group of the Institution of Plant Protection, Chinese Academy of Agricultural Sciences) (Figure 1 & Table A1). Wheat leaves with uredinial infections of Pt were dried at room temperature and then stored in craft paper bags at 4 °C until single uredinial isolation.
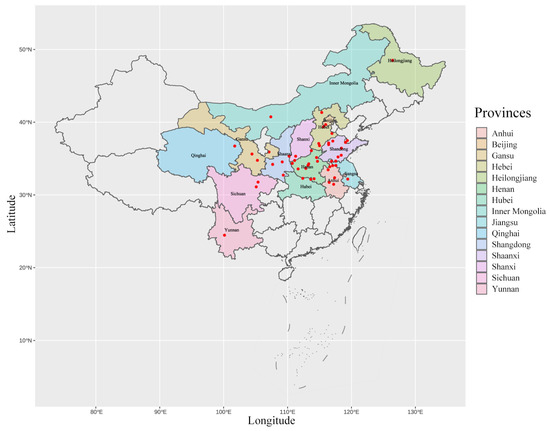
Figure 1.
The collection site of Pt samples collected from 15 provinces in China in 2018, red dots represent sample collection sites.
A 2 cm segment of wheat leave containing continuous uredinial infections was cut off from each sample and was put into mineral oil (Soltrol 170, Pillips 66 Company, Houston, TX, USA) in a 2 mL centrifuge tube for urediniospores dispersion. Then, mineral oil with urediniospores was pumped out onto 7-day-old seedlings of wheat variety Mingxian 169 for inoculation. After drying for 1 h, wheat plants were put in a dew chamber at 20 °C in darkness for 18 to 24 h. After that, inoculated wheat plants were put in a greenhouse with supplemental illumination at 20 to 28 °C in the daytime and 15 to 18 °C in darkness at night. Each plant was covered with a glassine paper bag (40 × 30 cm, 45 g/m2) to reduce cross-contamination. After 10 to 12 days of inoculation, the leaf segment with a single uredinial infection as the inoculum was cut off. The process was repeated, and urediniospores were collected by tapping the cellophane bag.
Twenty mg of urediniospores for each isolate was used for DNA extraction by Plant Genomic DNA Kit (TIANGEN Biotech (Beijing), China) according to manufacturer’s instructions. Thirteen SSR primer pairs developed from genomic libraries of Pt were used to characterize the collections [12] (Table 1). The Polymerase Chain Reaction (PCR) reaction was carried out in a total volume of 25 μL, including 12.5 μL of 2 × UniqueTM Taq Super Master Mix (Novogene, Beijing, China), 1 μL (100 ng/μL) of genomic DNA, 9.5 μL of sterile ddH2O, and 1 μL (10 ng/μL) of forward and reverse primers, respectively. The conditions were as follows: initial denaturation at 94 °C for 5 min, 35 cycles at 94 °C for 30 s, 53–64 °C for 30 s (according to the annealing temperature of the primers), 72 °C for 60 s, and a final extension at 72 °C for 10 min.

Table 1.
Repeat motif, primer sequence, size, amplification conditions (Tm: annealing temperature), number and size in base pair (bp) of alleles of the 13 microsatellite loci.
Electrophoresis was carried out in a DYY-6B electrical swimming instrument after PCR for testing the existence of PCR products. The PCR products were diluted at the ratio of 1:50. Then, 1 μL of diluted products was added to the mixture of 9 μL Hi-Di (Hi-Di Formamide for 3500 Dx/3500xl Dx) and Liz 500 (GeneScan™ 500 LIZ™ Size Standard), and the mixing ratio of Hi-Di and Liz is 1000:15. SSR analysis was performed with ABI 3500xl Genetic Analyzer (Applied Biosystems, Waltham, MA, USA). The length of the fragment was identified by GeneMarker v2.7.0.
Genotypes were determined by different alleles at the 13 SSR loci. An R package of poppr was used to analysis the data of admixed, clonal, mixed, and/or sexual populations [19]. Simpson’s index (1-D) was calculated to determine the diversity for each locus. Genotypes richness and evenness were reflected by expected MLG (eMLG) and E.5 [20,21]. Genotype diversity was measured by the Shannon–Wiener index (H) [22], Stoddart and Taylor’s index (G) [23], and Simpson’s index (lambda) [24]. Additionally, we used Corrected Simpson’s Index (corrected lambda) to avoid the influence from various sample sizes.
Analysis of Molecular Variance (AMOVA) was used to analyze the variations of SSR genotypes at three levels: between regions, between samples within regions, and within samples [25]; Discriminant Analysis of Principal Components (DAPC) was a multivariate and model-free approach to cluster samples, and based on prior population information [26].
A Bayesian approach was also used to group the SSR genotypes using STRUCTURE v2.3.4 [27]. Global analysis was run for SSR genotypes for K ranging from 1 to 10, and we performed 10 independent runs for each K value with 100,000 interactions and a burn-in period of 10,000. Running results were submitted to structure the harvester website, the best population number was determined by the highest delta K value. Finally, Distruct software [28] was used to generate histograms of population structure.
Analysis of gene flow (Nm) was calculated by GENALEX [29]. Gene flow was a collective term that included all mechanisms resulting in the movement of genes from one population to another and was an important factor that affected the degree of genetic variation within and between populations [30].
3. Results
From the genotype accumulation curve, it reached the plateau with 12 loci, indicating that the 13 loci we used was enough for distinguishing all the observed MLGs (Appendix A Figure A1). All the 13 SSR loci used in this study were polymorphic, with the average number of observed alleles being 5.23 (Table 2). Except RB26 and RB12 having two alleles, the other SSR markers produced 3–13 microsatellite alleles. The values of 1-D and Hexp were similar, both ranged from 0.076 to 0.729, and the range of evenness was 0.435–0.997. The RB26 locus had a low level of diversity and expected heterozygosity, and it was uneven in allele distribution, indicating it might be a phylogenetically uninformative locus. The diversity and evenness indexes of RB25 and RB27 were low, but the number of observed alleles were abundant. RB29 had the highest diversity (1-D and Hexp were both 0.729), containing the most alleles (the number of observed alleles was 13), and RB12 had the most evenly distributed alleles (evenness = 0.997).
Table 2.
Allele, 1-D, Hexp and Evenness of the 13 microsatellite loci isolated from Pt.
To ensure the accuracy of analysis, loci data with more than 25% missing values were removed, and data of 622 isolates were maintained from 709 samples for following analyses. A total of 428 MLGs were observed from 622 isolates of Pt, indicating that 68.8% of the isolates belonged to unique genotypes (Table 3). From the value of eMLG, the population of Inner Mongolia had a high level of diversity (eMLG = 10.00), while Beijing (eMLG = 7.65) and Yunnan (eMLG = 7.64) were lower. E.5 is an index to measure the distribution of genotype abundance, where the genotype evenness of a population with the same genotype abundance is equal to 1, while the genotype evenness of a population dominated by a single genotype is close to 0. E.5 in this study ranged from 0.464 to 1.000, with an average of 0.564, showing that genotypes were fairly evenly distributed in different populations. The value of corrected lambda ranged from 0.875 to 0.980, and the overall value was 0.998, indicating a high level of genotypic diversity in the 15 populations.
Table 3.
Genotype diversity information of different Pt populations.
The clonal strains’ spread of the pathogens in 15 provinces was supported by AMOVA results, with variation within individuals at 94.98% (p = 0.001), and variation among populations at 5.02% (p = 0.001), which was consistent with previous studies [9,17] (Table A2).
The relative position of the Pt populations in DAPC scatter plot showed the genetic distance between populations from different provinces (Figure 2). The first discriminant component separated populations in Inner Mongolia from other regions. The second discriminant component showed the genetic distance between the 14 populations were relatively close, and the genetic divergence gradually obvious from the eastern populations to the western population (from Heilongjiang to Qinghai). Separately analyzed from the four quadrants, the samples of Beijing, Hebei, Shandong, Anhui, Shanxi, Shaanxi, Henan, and Heilongjiang were mainly distributed in the third quadrant, while the samples of Qinghai, Sichuan, and Gansu were clustered in the first quadrant. Jiangsu, Yunnan, and Hubei populations were located in the second and fourth quadrants, connecting the first and third quadrants. Inner Mongolia population was mainly located in the fourth quadrant, and some samples were located near the samples of Qinghai, Sichuan, and Gansu provinces, far away from the samples of Beijing, Hebei, and other cities in the third quadrant. The populations in Beijing, Hebei, Shandong, Anhui, Shanxi, Shaanxi, Henan, and Heilongjiang (eight central and eastern provinces) had close genetic distance, while populations in Qinghai, Sichuan, and Gansu (three western and southwestern provinces) had close genetic distance, indicating two independent epidemic areas, respectively. Jiangsu, Yunnan, and Hubei populations might serve as a bridge between two independent epidemic areas.
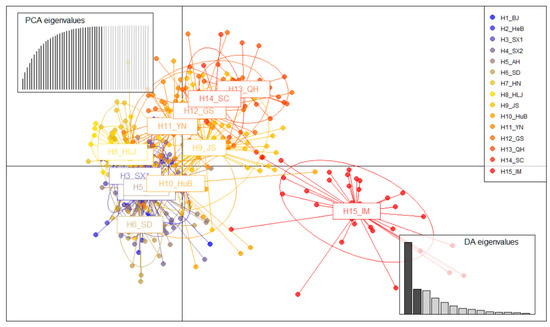
Figure 2.
Scatterplot from discriminant analysis of principal components (DAPC) of the first two principal components discriminating Pt populations by regions. Points represent individual observations. Lines and shapes represent population membership.
To further cluster the 15 populations into different groups, STRUCTURE, the structure harvester website, and Distruct were used to calculate and generate the different compositions of clusters at K values ranging from 2–4 (Figure 3). At K = 2, samples of Beijing, Hebei, Shanxi, Shaanxi, Anhui, Henan, Heilongjiang, and Yunnan were differentiated from Jiangsu, Hubei, Gansu, Qinghai, Sichuan, and Inner Mongolia. At K = 3, 15 populations were divided into 3 clusters: The first cluster included samples from Beijing, Hebei, Hubei, Shandong, Henan, and Heilongjiang; the second cluster included samples from Shanxi, Yunnan, Shaanxi, and Anhui; the third cluster included samples from Jiangsu, Gansu, Qinghai, Sichuan, and Inner Mongolia. At K = 4, the sample of Hubei showed differentiation from the others, divided into an independent cluster. Samples of Beijing, Hebei, Shandong, Heilongjiang, and Sichuan were divided into the second cluster. Samples of Shanxi, Shaanxi, Anhui, Henan, and Yunnan were divided into the third cluster. Samples of Jiangsu, Gansu, Qinghai, and Inner Mongolia were divided into the fourth cluster. Structure results revealed a genetic difference between the eastern populations and the western populations of Pt.
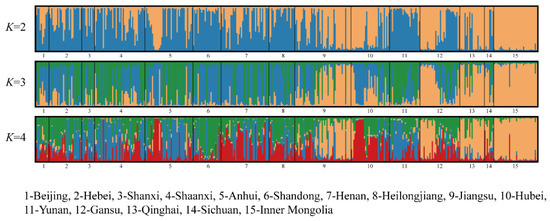
Figure 3.
Distruct software divided 15 populations based on the results of Structure for K = 2 to K = 4. They are partitioned into different colors, and populations are divided by a black line. Each vertical bar represents an individual, where the proportion of the color bar represents the membership coefficient for each subpopulation. A bar with only a single color represents its ancestry to a single population, and a mixture of colors represents admixture from different populations.
The Nm value between any two populations was greater than 1, indicating that there was genetic exchange among the populations (Table 4). Pairwise populations of Beijing, Hebei, Shanxi, Shaanxi, Anhui, Shandong, Henan, and Heilongjiang had frequent genetic exchanges, while pairwise populations of Jiangsu, Gansu, Qinghai, and Sichuan had frequent genetic exchanges. The level of genetic exchange between the Inner Mongolia population with other populations were relatively low, except Jiangsu, Gansu, and Qinghai populations.
Table 4.
The value of Nm between different pair of populations.
A genotype is the combination of alleles carried by a given individual at a particular set of loci, and individuals carrying the same set of alleles are considered to have the same multi-locus genotype. All the other populations had some shared genotypes except for Qinghai, Sichuan, and Inner Mongolia (Table A3). Anhui and Shandong populations had the greatest number of shared MLGs, and 10 of the 14 shared MLGs were found in both. Populations of Beijing, Shanxi, Anhui, and Shandong had the proportion of shared MLGs for 90.9% (10/11), 71.4% (10/14), 75% (36/48), and 97.3% (36/37), respectively, accounting for more than half of the populations. Jiangsu population had the least proportion of shared MLGs (except for Qinghai, Sichuan, and Inner Mongolia) while the greatest number of MLGs, with only 8 shared MLGs identified from 51 MLGs (15.7%).
4. Discussion
4.1. Population Genetic Structure of Pt Collections
Populations monitored from 15 provinces show pathogen exchange especially in the eastern region. Wheat leaf rust is a typical air-borne disease, urediniospores of Pt can travel long distances by the upper air, resulting in regional communication [31], and the spread of urediniospores leads to genetic exchange between different regions. Whitlock and Mc Cauley [32] claimed when Nm > 4, the genetic exchange between populations is relatively sufficient, which can play the role of homogenization and eliminate the genetic difference of populations. Strong gene flow of Pt was found between the eight pairwise populations, including Beijing, Hebei, Shanxi, Shaanxi, Anhui, Shandong, Henan, and Heilongjiang (central and eastern regions), and was also found between the four pairwise populations including Qinghai, Gansu, Sichuan, and Inner Mongolia (western regions), indicating frequent pathogen exchanges exist in the two clusters, respectively. It was also proved by the results of cluster analysis. For the eight populations in the central and eastern regions of China, most of them are adjacent to each other, and the lack of mountain barriers in these regions provides the geographical condition for pathogen spreading [18]. In addition, the provinces of Shandong, Anhui, Henan, Hebei, Shaanxi, and Shanxi belong to the Huang-Huai winter wheat area, similar natural conditions make these populations closely related to each other.
Sample locations of Qinghai, Gansu, Sichuan, and Inner Mongolia populations are located in the western regions of China, which are geographically far away from the central and eastern regions, and differentiated from these populations in genetic distance. Qinghai and Gansu populations are located in high altitude areas, while Sichuan and Inner Mongolia populations are located in the basin areas. For complex and diverse terrain, the pathogen exchange among the 4 western populations is not as frequent as that among the 8 central and eastern populations. Furthermore, the population of Inner Mongolia exhibit obvious difference between 8 populations in terms of Nm value and DAPC analysis. From the geographical position, the Inner Mongolia population mainly comes from Bayannur city, which is located in the west of Inner Mongolia and belongs to the Hetao plain irrigation area [33]. Unlike winter wheat planted in other areas, spring wheat is mainly planted in this area. From June to July, winter wheat is harvested gradually from south to north. However, in Inner Mongolia, consecutive fields of spring wheat that has not been harvested provides hosts for Pt, with an average temperature of 18–20 °C and abundant rainfall, and both humidity and temperature are favorable for the epidemic of wheat leaf rust [34]. According to the shared MLGs, Beijing, Hebei, Shanxi, Anhui, Shandong, and Henan had the proportion of shared MLGs ranged from 43.3–97.3%, suggesting that many of the MLGs in one population could be identified in others. However, Qinghai, Sichuan, and Inner Mongolia did not share any MLG, indicating a different composition of the populations, and new strains of Pt might have originated from these regions.
4.2. Prediction of Pathogen Movement between Different Regions in China
The occurrence of wheat leaf rust is closely related to temperature and humidity, which affect the time of disease onset. Due to the vast territory and various climate in China, the onset time of wheat leaf rust is different in different regions. The samples of Pt collected from 15 provinces were distributed in the northeast spring wheat region, the north spring wheat region, the northwest spring wheat region, the north winter wheat region, the Huang-Huai winter wheat region, the middle and lower Yangtze River winter wheat region, and the southwest winter wheat region, respectively. Lincang city of Yunnan belongs to the southwest winter wheat region, with mild climate and suitable hydrothermal conditions, so the onset time of Pt is early, from the middle of February. The pathogens in Yunnan mainly come from pathogens of volunteer seedlings in mountainous areas, which go down the mountain in autumn and go up the mountain in spring, invading back and forth [35]. The urediniospores may be carried by wind to the northwest spring wheat region and the eastern wheat growing region, then spread to the northern spring wheat region in Hetao plain by the northwest spring wheat region. The winter wheat region in the middle and lower reaches of the Yangtze River has a warm and humid climate, with the precipitation of 360 mm to 830 mm during the wheat growth period. The latitude of wheat fields is higher than that in Beijing and Shandong, and the onset time of Pt is earlier, from late April to early May. The urediniospores in the winter wheat region in the middle and lower reaches of the Yangtze River may be introduced into the winter wheat region in Huang-Huai and the northern wheat region. Meanwhile, the samples of Zhenjiang city in Jiangsu province, located in the winter wheat region of the middle and lower reaches of the Yangtze River also exchange with the populations in the west.
In conclusion, there was frequent exchange of Pt in 15 provinces but also clearly genetic division between the eastern and western clusters. It reflected that the classification of Pt populations in China was affected by topography and geographical location to some extent. Due to its highly thermal adaptability, Pt is widespread in most areas of China. However, the preliminary infection source is formed in a small area and then migrates to further regions. Therefore, the Pt population in China can be divided into eastern, western, and “bridge” regions. On this basis, the genetic structure, pathogen migration route, and disease prevalence can be further studied in a small area.
Author Contributions
Conceptualization, W.C. and T.L.; methodology, Z.X.; software, Z.X. and H.L.; validation, T.L.; formal analysis, Z.X.; investigation, Z.X.; resources, X.X., B.L. and L.G.; writing—original draft preparation, Z.X. and H.L.; writing—review and editing, T.L.; visualization, Z.X. and H.L.; supervision, T.L.; funding acquisition, T.L. and W.C. All authors have read and agreed to the published version of the manuscript.
Funding
This study was supported by the National Natural Science Foundation of China (Project 31671967), National Key Research and Development Program (2018YFD0200500 and 2016YFD0300700), China Agriculture Research System (CARS-3), Agricultural Science and Technology Innovation Program (CAAS-ASTIP, CAAS-202002) and Epidemic Detection and Control of Crop Diseases and Insect Pests (2130108).
Institutional Review Board Statement
Not applicable.
Informed Consent Statement
Not applicable.
Data Availability Statement
The data presented in this study are available on request from the corresponding author.
Acknowledgments
We acknowledge Hao Zhang (Institution of Plant Protection, Chinese Academy of Agricultural Sciences) and researchers responsible for the trap nurseries for the samples of Pt for this study.
Conflicts of Interest
The authors declare no conflict of interest.
Appendix A

Figure A1.
Genotype accumulation curve is a tool that allows us to assess if it is sufficient to discriminate between unique individuals for given a random sample of the loci. It had reached the plateau with 12 loci indicating that the 13 loci we used is enough for distinguishing all the observed MLGs.

Table A1.
Information of the samples of Pt collected from different areas in 2018.
Table A1.
Information of the samples of Pt collected from different areas in 2018.
| Province | City | Number | Longitude | Latitude |
|---|---|---|---|---|
| Beijing | Fangshan district | 21 | E115°58′ | N39°40′ |
| Hebei | Baoding | 48 | E115°37′ | N39°22′ |
| Zhangjiakou | E115°21′ | N41°20′ | ||
| Cangzhou | E116°57′ | N37°87′ | ||
| Handan | E114°53′ | N36°64′ | ||
| Xingtai | E114°60′ | N36°46′ | ||
| Shanxi | Yuncheng | 25 | E111°16′ | N35°19′ |
| Yunnan | Lincang | 56 | E100°08′ | N23°88′ |
| Jiangsu | Zhenjiang | 65 | E119°18′ | N34°58′ |
| Xuzhou | E117°32′ | N34°39′ | ||
| Gansu | Pingliang | 50 | E106°66′ | N35°54′ |
| Tianshui | E105°17′ | N34°45′ | ||
| Dingxi | E103°86′ | N35°37′ | ||
| Qinghai | Xining | 30 | E101°44′ | N36°43′ |
| Sichuan | Guangyuan | 14 | E105°23′ | N31°46′ |
| Mianyang | E105°06′ | N31°07′ | ||
| Hubei | Xiangyang | 51 | E111°83′ | N31°77′ |
| Shiyan | E110°99′ | N32°95′ | ||
| Suizhou | E113°38′ | N31°69′ | ||
| Shannxi | Ankang | 62 | E109°20′ | N32°44′ |
| Xianyang | E108°70′ | N34°32′ | ||
| Baoji | E107°40′ | N34°12′ | ||
| Weinan | E110°14′ | N35°19′ | ||
| Anhui | Lu’an | 80 | E116°52′ | N31°73′ |
| Anqing | E117°13′ | N31°28′ | ||
| Suzhou | E116°94′ | N33°64 | ||
| Hefei | E117°22′ | N31°82‘ | ||
| Fuyang | E115°81′ | N32°88′ | ||
| Bozhou | E115°97′ | N33°53′ | ||
| Huibei | E116°64′ | N34°02′ | ||
| Shangdong | Linyi | 66 | E118°24′ | N35°27′ |
| Zibo | E117°86′ | N35°85′ | ||
| Liaocheng | E116°26′ | N36°55′ | ||
| Rizhao | E119°22′ | N36°88′ | ||
| Jinan | E117°05′ | N36°84′ | ||
| Weifang | E119°04′ | N36°73′ | ||
| Zaozhuang | E117°54′ | N34°73′ | ||
| Dezhou | E116°26′ | N37°08′ | ||
| Henan | Anyang | 71 | E113°44′ | N36°05′ |
| Zhengzhou | E113°12′ | N34°04′ | ||
| Lingbao | E110°45′ | N34°21′ | ||
| Nanyang | E112°52′ | N32°99′ | ||
| Xinyang | E114°09′ | N32°14′ | ||
| Pingdingshan | E113°19′ | N33°76′ | ||
| Sanmenxia | E111°07′ | N34°44′ | ||
| Zhoukou | E114°41′ | N 33°97′ | ||
| Shangqiu | E116°53′ | N 33°98′ | ||
| Xinxiang | E113°92′ | N 35°08′ | ||
| Heilongjiang | Qiqihar | 32 | E126°26′ | N48°30′ |
| Inner Mongolia | Bayannur | 38 | E107°23′ | N40°44′ |
| Total | 709 |
Table A2.
The Analysis of Molecular Variance (AMOVA) of Pt at different levels.
Table A2.
The Analysis of Molecular Variance (AMOVA) of Pt at different levels.
| Level | Df | Sum Sq | Mean Sq | Est. Var | Variation (%) | p Value |
|---|---|---|---|---|---|---|
| Among populations | 14 | 237.05 | 16.932 | 0.186 | 5.02 | 0.001 |
| Among individuals | 607 | 1062.82 | 1.751 | 0.000 | 0.00 | 0.001 |
| Within individuals | 622 | 2185.00 | 3.513 | 3.513 | 94.98 | 0.001 |
| Total | 1243 | 3484.87 | / | 3.698 | 100.00 |
Df = degrees of freedom; Sum Sq = Sum of squares; Mean Sq = Mean of squares; Est. Var = estimated variance.
Table A3.
The shared genotype and numbers of different Pt populations.
Table A3.
The shared genotype and numbers of different Pt populations.
| NO. | Beijing MLG = 11 | Hebei MLG = 30 | Shanxi MLG = 14 | Shaanxi MLG = 46 | Anhui MLG = 48 | Shandong MLG = 37 | Henan MLG = 50 | Heilongjiang MLG = 27 | Jangsu MLG = 51 | Hubei MLG = 38 | Yunnan MLG = 31 | Gansu MLG = 42 | Qinghai MLG = 21 | Sichuan MLG = 8 | Inner Mongolia MLG = 37 |
|---|---|---|---|---|---|---|---|---|---|---|---|---|---|---|---|
| MLG.15 | 1 | 6 | |||||||||||||
| MLG.16 | 2 | 5 | 2 | ||||||||||||
| MLG.18 | 2 | 1 | |||||||||||||
| MLG.32 | 1 | 1 | |||||||||||||
| MLG.71 | 1 | 2 | |||||||||||||
| MLG.75 | 2 | 1 | |||||||||||||
| MLG.139 | 1 | 2 | |||||||||||||
| MLG.156 | 1 | 1 | |||||||||||||
| MLG.167 | 1 | 1 | |||||||||||||
| MLG.179 | 1 | 2 | 4 | 1 | 1 | ||||||||||
| MLG.183 | 1 | 2 | 1 | ||||||||||||
| MLG.192 | 1 | 1 | |||||||||||||
| MLG.193 | 2 | 1 | 1 | ||||||||||||
| MLG.196 | 3 | 2 | 3 | 1 | |||||||||||
| MLG.200 | 1 | 1 | |||||||||||||
| MLG.206 | 2 | 1 | 3 | 7 | 3 | 1 | |||||||||
| MLG.207 | 1 | 1 | |||||||||||||
| MLG.213 | 3 | 1 | |||||||||||||
| MLG.220 | 1 | 4 | 1 | 1 | 1 | ||||||||||
| MLG.237 | 3 | 1 | 1 | ||||||||||||
| MLG.242 | 1 | 1 | |||||||||||||
| MLG.243 | 1 | 1 | |||||||||||||
| MLG.281 | 1 | 1 | |||||||||||||
| MLG.282 | 4 | 2 | |||||||||||||
| MLG.283 | 2 | 1 | |||||||||||||
| MLG.284 | 1 | 8 | 4 | 5 | 1 | ||||||||||
| MLG.288 | 4 | 1 | 2 | ||||||||||||
| MLG.312 | 1 | 1 | |||||||||||||
| MLG.317 | 1 | 1 | |||||||||||||
| MLG.319 | 1 | 1 | |||||||||||||
| MLG.321 | 2 | 1 | |||||||||||||
| MLG.359 | 2 | 2 | 1 | ||||||||||||
| MLG.360 | 2 | 1 | 1 | 1 | |||||||||||
| MLG.383 | 1 | 1 | |||||||||||||
| MLG.384 | 1 | 1 | |||||||||||||
| MLG.394 | 2 | 1 | |||||||||||||
| MLG.488 | 1 | 2 | 1 | 1 | 1 | ||||||||||
| No. of shared MLGs | 5 | 10 | 7 | 8 | 14 | 14 | 12 | 6 | 5 | 7 | 5 | 8 | 0 | 0 | 0 |
| No. of samples of shared MLGs | 10 | 13 | 10 | 8 | 36 | 36 | 24 | 7 | 8 | 7 | 5 | 9 | 0 | 0 | 0 |
| Proportion of shared MLGs/% | 90.9 | 43.3 | 71.4 | 17.4 | 75.0 | 97.3 | 48.0 | 25.9 | 15.7 | 18.4 | 16.1 | 21.4 | 0.0 | 0.0 | 0.0 |
No. of shared MLGs: only counted the number of MLGs shared by the 15 populations; No. of samples of shared MLGs: counted the number of samples of the shared MLGs; Proportion of shared MLGs: number of samples of shared MLGs/number of the observed genotypes in the population.
References
- Jin, S.B. Chinese Wheat Science; China Agriculture Press: Beijing, China, 1996. (In Chinese) [Google Scholar]
- Lu, Y.J.; Li, X.; Jiang, N. Development and trend analysis of world wheat industry in 2017. China Mark. 2017, 26, 63–65. (In Chinese) [Google Scholar]
- Peng, S.Y. Comprehensive control technology of wheat leaf rust. Mod. Agric. 2013, 2, 30–31. (In Chinese) [Google Scholar]
- Huerta-Espino, J.; Germán, S.; Singh, R.P.; Mccallum, B.D.; Park, R.F.; Chen, W.Q.; Bhardwaj, S.C.; Goyeau, H. Global status of wheat leaf rust caused by Puccinia triticina. Euphytica 2011, 179, 143–160. [Google Scholar] [CrossRef]
- Kang, J.; Zhang, L.; Zhang, M.Y.; Yan, H.F.; Liu, D.Q. Development of specific molecular markers in Puccinia triticina. J. Agric. Univ. Hebei 2016, 39, 63–67. (In Chinese) [Google Scholar] [CrossRef]
- Zhang, M.Y.; Meng, Q.F.; Zhang, L.; Gao, Y.; Yan, H.F.; Liu, D.Q. Analysis of genetic diversity of Puccinia triticina isolated from different wheat cultivars. J. Henan Agric. Sci. 2018, 47, 77–81. (In Chinese) [Google Scholar] [CrossRef]
- Chen, W.Q. The Occurrence and Control of Wheat Rust; China Agriculture Press: Beijing, China, 2011. (In Chinese) [Google Scholar]
- Bolton, M.D.; Kolmer, J.A.; Garvin, D.F. Wheat leaf rust caused by Puccinia triticina. Mol. Plant Pathol. 2008, 9, 563–575. [Google Scholar] [CrossRef]
- Kolmer, J.A.; Ordoñez, M.E.; Manisterski, J.; Anikster, Y. Genetic ifferentiation of Puccinia triticina opulations in Central Asia and the Caucasus. Phytopathology 2007, 97, 1141–1149. [Google Scholar] [CrossRef]
- Xu, M.Q. Genetic Diversity of Puccinia triticina by SSR in Some Regions of China Hebei Agricultural University. Master’s Thesis, Hebei Agricultural University, Hebei, China, 2012. [Google Scholar]
- Ashley, M.V.; Dow, B.D. The use of microsatellite analysis in population biology: Background, methods and potential applications. EXS 1994, 69, 185–201. [Google Scholar] [CrossRef] [PubMed]
- Duan, X.; Enjalbert, J.; Vautrin, D.; Solignac, M.; Giraud, T. Isolation of 12 microsatellite loci, using an enrichment protocol, in the phytopathogenic fungus Puccinia triticina. Mol. Ecol. Notes 2003, 3, 65–67. [Google Scholar] [CrossRef]
- Szabo, L.J.; Kolmer, J.A. Development of simple sequence repeat markers for the plant pathogenic rust fungus Puccinia triticina. Mol. Ecol. Notes 2006, 7, 92–94. [Google Scholar] [CrossRef]
- Ordonez, M.E.; Kolmer, J.A. Simple sequence repeat diversity of a worldwide collection of Puccinia triticina from durum wheat. Phytopathology 2007, 97, 574–583. [Google Scholar] [CrossRef] [PubMed][Green Version]
- Kolmer, J.A.; OrdoñEz, M.E.; Manisterski, J.; Anikster, Y. Genetic differentiation of Puccinia triticina populations in the Middle East and genetic similarity with populations in Central Asia. Phytopathology 2011, 101, 870–877. [Google Scholar] [CrossRef]
- Kolmer, J.A.; Hanzalova, A.; Goyeau, H.; Bayles, R.; Morgounov, A. Genetic differentiation of the wheat leaf rust fungus Puccinia triticina in Europe. Plant Pathol. 2013, 62, 21–31. [Google Scholar] [CrossRef]
- Xu, M.; Wang, S.; Meng, Q.; Liu, D. Genetic Diversity of Puccinia triticina by SSR in Some Regions of China. J. Agric. Biotechnol. 2013, 21, 89–96. (In Chinese) [Google Scholar]
- Kolmer, J.A. Collections of Puccinia triticina in different provinces of China are highly related for virulence and molecular genotype. Phytopathology 2015, 105, 700–706. [Google Scholar] [CrossRef]
- Kamvar, Z.N.; Tabima, J.F.; Grünwald, N.J. Poppr: An R package for genetic analysis of populations with clonal, partially clonal, and/or sexual reproduction. PeerJ 2014, 2, 281. [Google Scholar] [CrossRef]
- Ludwig, J.A.; Reynolds, J.F.; Quartet, L.; Reynolds, J.F. Statistical Ecology: A Primer on Methods and Computing; John Wiley & Sons: Hoboken, NJ, USA, 1989; Volume 4, p. 38. [Google Scholar] [CrossRef]
- Grünwald, N.J.; Goodwin, S.B.; Milgroom, M.G.; Fry, W.E. Analysis of genotypic diversity data for populations of microorganisms. Phytopathology 2003, 93, 738–746. [Google Scholar] [CrossRef]
- Shannon, C.E. A mathematical theory of communication. Bell Syst. Tech. J. 1948, 27, 379–423. [Google Scholar] [CrossRef]
- Stoddart, J.A.; Taylor, J.F. Genotypic diversity: Estimation and prediction in samples. Genetics 1988, 118, 705–711. [Google Scholar] [CrossRef] [PubMed]
- Belcher, P.R. Measurement of myocardial contractility. J. Cardiothorac. Vasc. Anesth. 1997, 11, 812. [Google Scholar] [CrossRef] [PubMed]
- Excoffier, L.; Smouse, P.E.; Quattro, J.M. Analysis of molecular variance inferred from metric distances among DNA haplotypes: Application to human mitochondrial DNA restriction data. Genetics 1992, 131, 479–491. [Google Scholar] [CrossRef]
- François, B.; Sébastien, D.; Thibaut, J. Discriminant analysis of principal components: A new method for the analysis of genetically structured populations. BMC Genet. 2010, 11, 94. [Google Scholar] [CrossRef]
- Pritchard, J.K.; Stephens, M.; Donnelly, P. Inference of population structure using multilocus genotype data. Genetics 2000, 155, 945–959. [Google Scholar] [CrossRef]
- Rosenberg, N.A. Distruct: A program for the graphical display of population structure. Mol. Ecol. Notes 2004, 4, 137–138. [Google Scholar] [CrossRef]
- Peakall, R.; Smouse, P.E. GENALEX 6: Genetic analysis in Excel. Population genetic software for teaching and research. Mol. Ecol. Notes 2006, 6, 288–295. [Google Scholar] [CrossRef]
- Slatkin, M. Gene flow and the geographic structure of natural populations. Science 1987, 236, 787–792. [Google Scholar] [CrossRef] [PubMed]
- Xu, D.; Huang, G.; Yang, W.; Liu, D. Analysis of the Virulence and Molecular Polymorphism of Puccinia recondita f.sp. tritici. J. Agric. Biotechnol. 2002, 10, 41–45. [Google Scholar]
- Whitlock, M.C.; Mccauley, D.E. Indirect measures of gene flow and migration: FST≠1/(4Nm+1). Heredity 1999, 82, 117–125. [Google Scholar] [CrossRef] [PubMed]
- Li, Y.Q.; Wu, X.H.; Cui, G.H.; Wang, X.B.; Yu, M.L. Present situation and existing problems of wheat production in Inner Mongolia. Inn. Mong. Agric. Sci. Technol. 2000, S1, 139–140. (In Chinese) [Google Scholar]
- Wu, X.L. Analysis of climatic conditions for wheat growth in Inner Mongolia. Beijing Agric. 2014, 33, 39–40. [Google Scholar]
- Ran, Y. Review of wheat rust control in Yunnan Province. Yunnan Agric. Sci. Technol. 1993, 6, 5–9. (In Chinese) [Google Scholar]


Publisher’s Note: MDPI stays neutral with regard to jurisdictional claims in published maps and institutional affiliations. |
© 2022 by the authors. Licensee MDPI, Basel, Switzerland. This article is an open access article distributed under the terms and conditions of the Creative Commons Attribution (CC BY) license (https://creativecommons.org/licenses/by/4.0/).