Article

Effect of Foliar Application of Micronutrients and Fungicides on the Nitrogen Use Efficiency in Winter Wheat

by
Witold Szczepaniak
1,
Bartłomiej Nowicki
2,
Dagmara Bełka
3,
Adrian Kazimierowicz
4,
Michał Kulwicki
5 and
Witold Grzebisz
1,*
1
Department of Agricultural Chemistry and Environmental Biogeochemistry, Poznan University of Life Sciences, Wojska Polskiego 28, 60-637 Poznan, Poland
2
BASF Polska, Alej4e Jerozolimskie 142B, 02-305 Warszawa, Poland
3
Multi-Sector Enterprise Bełka General Partnership, Jeziorna 39, 77-400 Złotów, Poland
4
Agricultural Farm Adrian Kazimierowicz, Wietszyce 43, 67-221 Warszawa, Poland
5
Syngenta Polska, Szamocka 8, 01-748 Warszawa, Poland
*
Author to whom correspondence should be addressed.
Agronomy 2022, 12(2), 257; https://doi.org/10.3390/agronomy12020257
Submission received: 9 December 2021 / Revised: 15 January 2022 / Accepted: 19 January 2022 / Published: 20 January 2022

Abstract

:
The increase in the grain density (GD) is the key factor for effectively controlling Nitrogen-Use Efficiency (NUE) in winter wheat. Winter-wheat protection with fungicides and/or foliar fertilization with micronutrients during the critical stages of yield formation affects the grain yield by increasing GD. This hypothesis was verified in a two-factor field experiment, carried out in the 2013/2014, 2014/2015, 2015/2016 growing seasons. A field experiment in a two-factor split-plot design, included three systems of wheat foliar protection (FP): (i) N + Mi (N + macronutrients), (ii) N + P (N + fungicides), (iii) N + Mi + P, and 0, 40, 80, 120, 160, 200, 240 kg N ha−1. The grain yield, despite the significant effect of years, depended on the interaction of FP and N doses. The maximum yield of 8.1, 10.7, 11.1 t ha−1 for the optimal N dose of 79.8, 227.4, and 245.2 kg ha−1, was achieved, respectively, for N + Mi, N + N, N + Mi + P. The wheat-grain yield depended significantly on GD (R2 = 0.98, p ≤ 0.001). Wheat protected with fungicides increased GD gradually with the N dose, reaching over 3000 grains per m2 when fertilized with 200 kg N ha−1. The lack of fungicide protection, reducing GD, consequently resulted in a greater accumulation of N in straw at the expense of grain. Fungicide protection of wheat through the positive effect on N management by wheat should be considered as an agronomic measure that supports N-Use Efficiency.

1. Introduction

Wheat (Triticum aestivum L.) is one of the three main cereals responsible for bridging the food gap in the world [1]. It has been well-documented that differences in yields between regions of the world are due to biophysical factors such as temperature, rainfall amount and their distribution during the growing season [2,3]. The importance I of soil fertility cannot be ignored in food production [4]. In wheat, nutrient deficiency reduces nitrogen (N) uptake and, consequently, grain yield and its quality [5]. Modern wheat varieties have achieved a high yield potential in recent decades. However, their sensitivity to environmental factors has increased. This negative trend is especially visible in Europe [6]. The main factors, significantly affecting the realization of the yield potential of each crop are water and N, which are not complementary to each other [7,8].
The accumulation of N by wheat during the growing season occurs according to the so-called sigmoid pattern [9]. The main feature of this general model is the mathematically described pattern of N-accumulation during the successive stages of wheat growth. On this basis, the entire growing season of wheat can be divided into three major mega-phases [10]. The first, referred to as The Crop Foundation Period (CFP), extends from emergence to the end of tillering (BBCH 29- phenological stages of crop plants growth, as proposed by Mayer [11]). The demand for N by wheat during this period is relatively low. However, this phase is responsible for the formation of tillers [12]. The degree of the development of tillers and the N content in the wheat stem is the first step in the formation of yield components [13]. The second mega-phase, is defined as the Yield Foundation Period (YFP), which extends from the beginning of the stem elongation to the beginning of flowering. This is the crucial phase of N-accumulation in wheat. The amount of N in a single plant determines the number of fertile flowers per ear [14,15]. The third mega-phase, defined as the Yield Realization Period (YRP), extends from the beginning of flowering to the full maturity of the wheat. During this period, the key components of the yield reach their final size, expressed as the number of grains per unit area (Grain Density, GD), and the weight of a single grain, in practice, is regarded as the Thousand Grain Weight (TGW) [16,17].
In the first stages of wheat growth, i.e., during CFP, the supply of N to plants depends on the content of Nmin in the soil zone rooted by a crop. It is considered as the necessary condition [7,18]. The second group of factors is those that are responsible for the plant’s potential, i.e., its root system to take up N from the soil solution. This set of factors is treated as the sufficient condition for effective N management by the currently cultivated crop [19,20]. In the next mega-phase, i.e., PYF, N-accumulation follows the linear N pattern. In this period, the growth rate of the ear depends on the synchronization of the plant’s demand for N with the rate of its (i) uptake from the soil, (ii) utilization by the crop. This is a key condition, determining the ear growth rate [21]. During this period, the crucial for the potential yield is the booting phase, in which N deficiency leads to a reduction in the number of fertile flowers. Wheat is a cleistogamous plant, which means that only the well-formed flowers will be fertilized [22].
The first, i.e., the necessary condition for effective plant production is the amount of Nmin in the soil, which is controlled by the farmer using N fertilizers. The limitation of N management in the soil/plant system to the “the four laws” as proposed by Johnston and Bruulsema [23] is an oversimplification that comes down to the use of only N fertilizer. The second, the sufficient condition of N management, concerns a set of factors determining the uptake of N from the soil and its subsequent use by the plant. The N nutritional status of wheat is affected not only by the amount of N accumulated in the plant, but also by other nutrients that are responsible for its uptake and subsequent transformation in the plant [24,25]. This applies to nutrients such as calcium (Ca), phosphorus (P), potassium (K), magnesium (Mg), sulfur (S) and micronutrients. The availability of these nutrients depends on the pH of the soil, which also affects the architecture of the root system [14,26].
The most recognizable micronutrients in wheat production are copper and manganese [27]. It is well-known that the first affects some processes responsible for N balance in the plant. Copper applied to wheat in the early stages of its growth increases the number of ears and thus GD. Its late application, i.e., before flowering increases the remobilization and transport of N to the growing grain, and thus increases the protein content [28,29]. It should be emphasized that copper compounds are used as inorganic fungicides to protect cereals against a wide range of pathogens, such as powdery mildew and rusts [30]. The yield-forming functions of manganese are much less known. However, its use in the first mega-phase of wheat growth results in higher tillers production. Manganese in the form of Mn2+ inhibits the activity of Gaumannomyces graminis v. tritici, a pathogen attacking the root system of wheat [31,32].
The success of production in the Green Revolution was achieved under the condition of using high doses of N fertilizers concomitantly with the use of fungicides in order to strongly control the pressure of pathogens [33,34]. This, the nutritional status of wheat, is related mainly to its N content, and creates favorable conditions for the attack of pathogens. Plants that are well-fed with N are very susceptible to attack by pathogens belonging to the group of biotrophs, for example Blumeria graminis f. sp. tritici (powdery mildew on wheat) and Puccina triticina (leaf rust). On the opposite side are plants deficient in N due to (i) N shortage, and/or (ii) late stage of development. Plants deficient in N are attacked by necrotrophs, for example Pyrenophora tritici-repentis (tan spot) [35,36]. Wheat, in its life cycle, and during the growing season undergoes various nutritional states, which makes it constantly susceptible to pathogens [37]. The effective use of the yield potential of modern wheat varieties requires measures and actions that allow for an effective control of (i) the rate of the applied fertilizer N, (ii) the nutritional status of the plant in critical stages of grain yield formation, and (iii) the pressure of pathogens. The implementation of all these measures together is the only possible way to increase the Nitrogen-Use Efficiency (NUE).
The present state of knowledge assumes that the increase in grain density is a key factor that effectively control the NUE of winter wheat. The objective of the study was to evaluate the effect foliar protection of winter wheat with micronutrients and/or fungicides on the development of yield components and, finally, on grain yield as a prerequisite for effective NUE control.

2. Materials and Methods

2.1. Experimental Setup

The study on the grain yield of winter wheat, N accumulation, N use efficiency (NUE) indices in response to the management system (foliar fertilization with micronutrients, plant protection—fungicides), was carried out in 2013/14, 2014/2015, and 2015/2016 seasons in Smolice (52°42′ N; 17°10′ E), Poland. The field experiment was carried out on soil formed from loamy sand over loamy sand, classified as Albic Luvisol. The organic carbon (Corg) content and pH values were variable, peaking in the 2014/2015 growing season. The content of available nutrients, measured before wheat sowing, i.e., before the application of fertilizers, was in the medium class at least for P, K, Fe, and Zn. This means very favorable conditions for wheat growth. More variable levels of soil fertility were found for other nutrients, such as Mg, Ca, Cu, and Mn, which in the 2013/2014 growing season were in low or very low classes. The amount of mineral N (Nmin), measured just before the spring regrowth of winter wheat in a 0.0–0.6 m layer, was generally high or very high as in 2015 (Table 1).
The local climate of the study area, classified as intermediate between Atlantic and Continental, is seasonal, especially in Summer. The meteorological data are presented in Figure 1. The growth conditions of winter wheat assessed on the basis of the Sielianinov hydrothermal indices in the subsequent years of study were very diverse (Table 2). The early vegetation phase of winter wheat in spring 2014 was very good, but May was wet. The second part of the season was less favorable as June was very dry and July was dry. The 2015 growing season was generally unfavorable for wheat growth, as indicated by the predominance of dry conditions. The beginning of the 2016 growing season was wet. May was semi-dry, June was dry. These two months are critical for the development of the number of grains in an ear of winter wheat. Most of the wheat-grain filling period was wet again.

2.2. Experimental Design

The field experiment, arranged in a two-factor split-block design, was replicated four times, included:
  • Three systems of wheat foliar protection in the spring part of the growing season (FP):
    1.1.
    N + foliar fertilization with macronutrients (N + Mi, fungicide control − FC)
    1.2.
    N + fungicide protection (N + P);
    1.3.
    N + micronutrients + fungicide protection (N + Mi + P).
  • Seven rates of applied fertilizer N: 0, 40, 80, 120, 160, 200, 240 kg ha−1.
The total area of one plot was 22.5 m2 (1.5 × 15 m). The winter wheat cv. Wydma was sown annually in the fourth week of September in the rate of 300 grain m−2. The forecrop was winter oilseed rape. The wheat was harvested the following year at the end of July from an area of 19.5 m−2. Nitrogen was applied in the form of ammonia nitrate (34:0:0) in accordance with the experimental schedule:
(1)
80 kg N ha−1—the late winter, before beginning of winter wheat vegetation in spring;
(2)
160 kg N ha−1—at the end of tillering/beginning of shoot elongation (BBCH 29/30);
(3)
240 kg N ha−1—at the stage of a flag leaf becoming visible (BBCH 39).
Phosphorus was applied at the rate of 17.2 kg P ha−1 in the form of triple superphosphate (46% P2O5). Potassium was applied at the rate of 100 kg K ha−1 as Korn-Kali (K-MgO-Na2O-SO3 → 40-6-3-12.5). Both fertilizers were applied two weeks before wheat sowing. The foliar application of micronutrients and fungicides was carried out in accordance with the experimental schedule, as shown in Table 3.

2.3. Plant Sampling

The plant material for the determination of dry matter and the N content was collected at harvest. A single sample was first partitioned into grain and vegetative biomass (harvest residues = straw + chaffs). The N content was determined in both parts of the plant, using the standard macro-Kjeldahl procedure [42]. The content of N was expressed on a dry matter basis.

2.4. Calculated Parameters

2.4.1. Regression Models

The general pattern of wheat grain yield (GY) and nitrogen accumulation (GN, TN) in response to increasing N doses (Nfi) was described by two regression models [43]:
1.
Linear:
G Y = a N f i + B
2.
Quadratic:
G Y = a N f i 2 + b N f i + C
The main estimated parameters of these function are:
N o p = b 2 a
G Y m a x = c b 2 4 a
The computational procedures for determining the models and parameters of GN and TN were the same.
where:
  • GY—grain yield, t ha−1;
  • GNN accumulated in grain, kg ha−1;
  • TNN accumulated in total wheat biomass, kg ha−1;
  • Nfi—“i” dose of fertilizer N, kg ha−1;
  • Nop—optimal N rate, kg ha−1;
  • GYmax—maximum GY for the Nop, t ha−1;
  • A, B, C, a, b, c—constants of the respective regression model.

2.4.2. Parameters and Indices of Nitrogen Use Efficiency (NUE)

1.
Nitrogen accumulating in wheat grain, GN
G N = G Y × N     kg   ha 1
2.
Nitrogen accumulating in harvest residues, Nr
N r = H R × N     kg   ha 1
3.
Total accumulating nitrogen in wheat biomass, TN
T N = G N + N r     kg   ha 1
4.
Nitrogen Harvest Index, NHI [44]
N H I = G N T N × 100 %
5.
Nitrogen Unit Accumulation, NUA [44]
N U A = T N G Y     kg   N   × t 1
6.
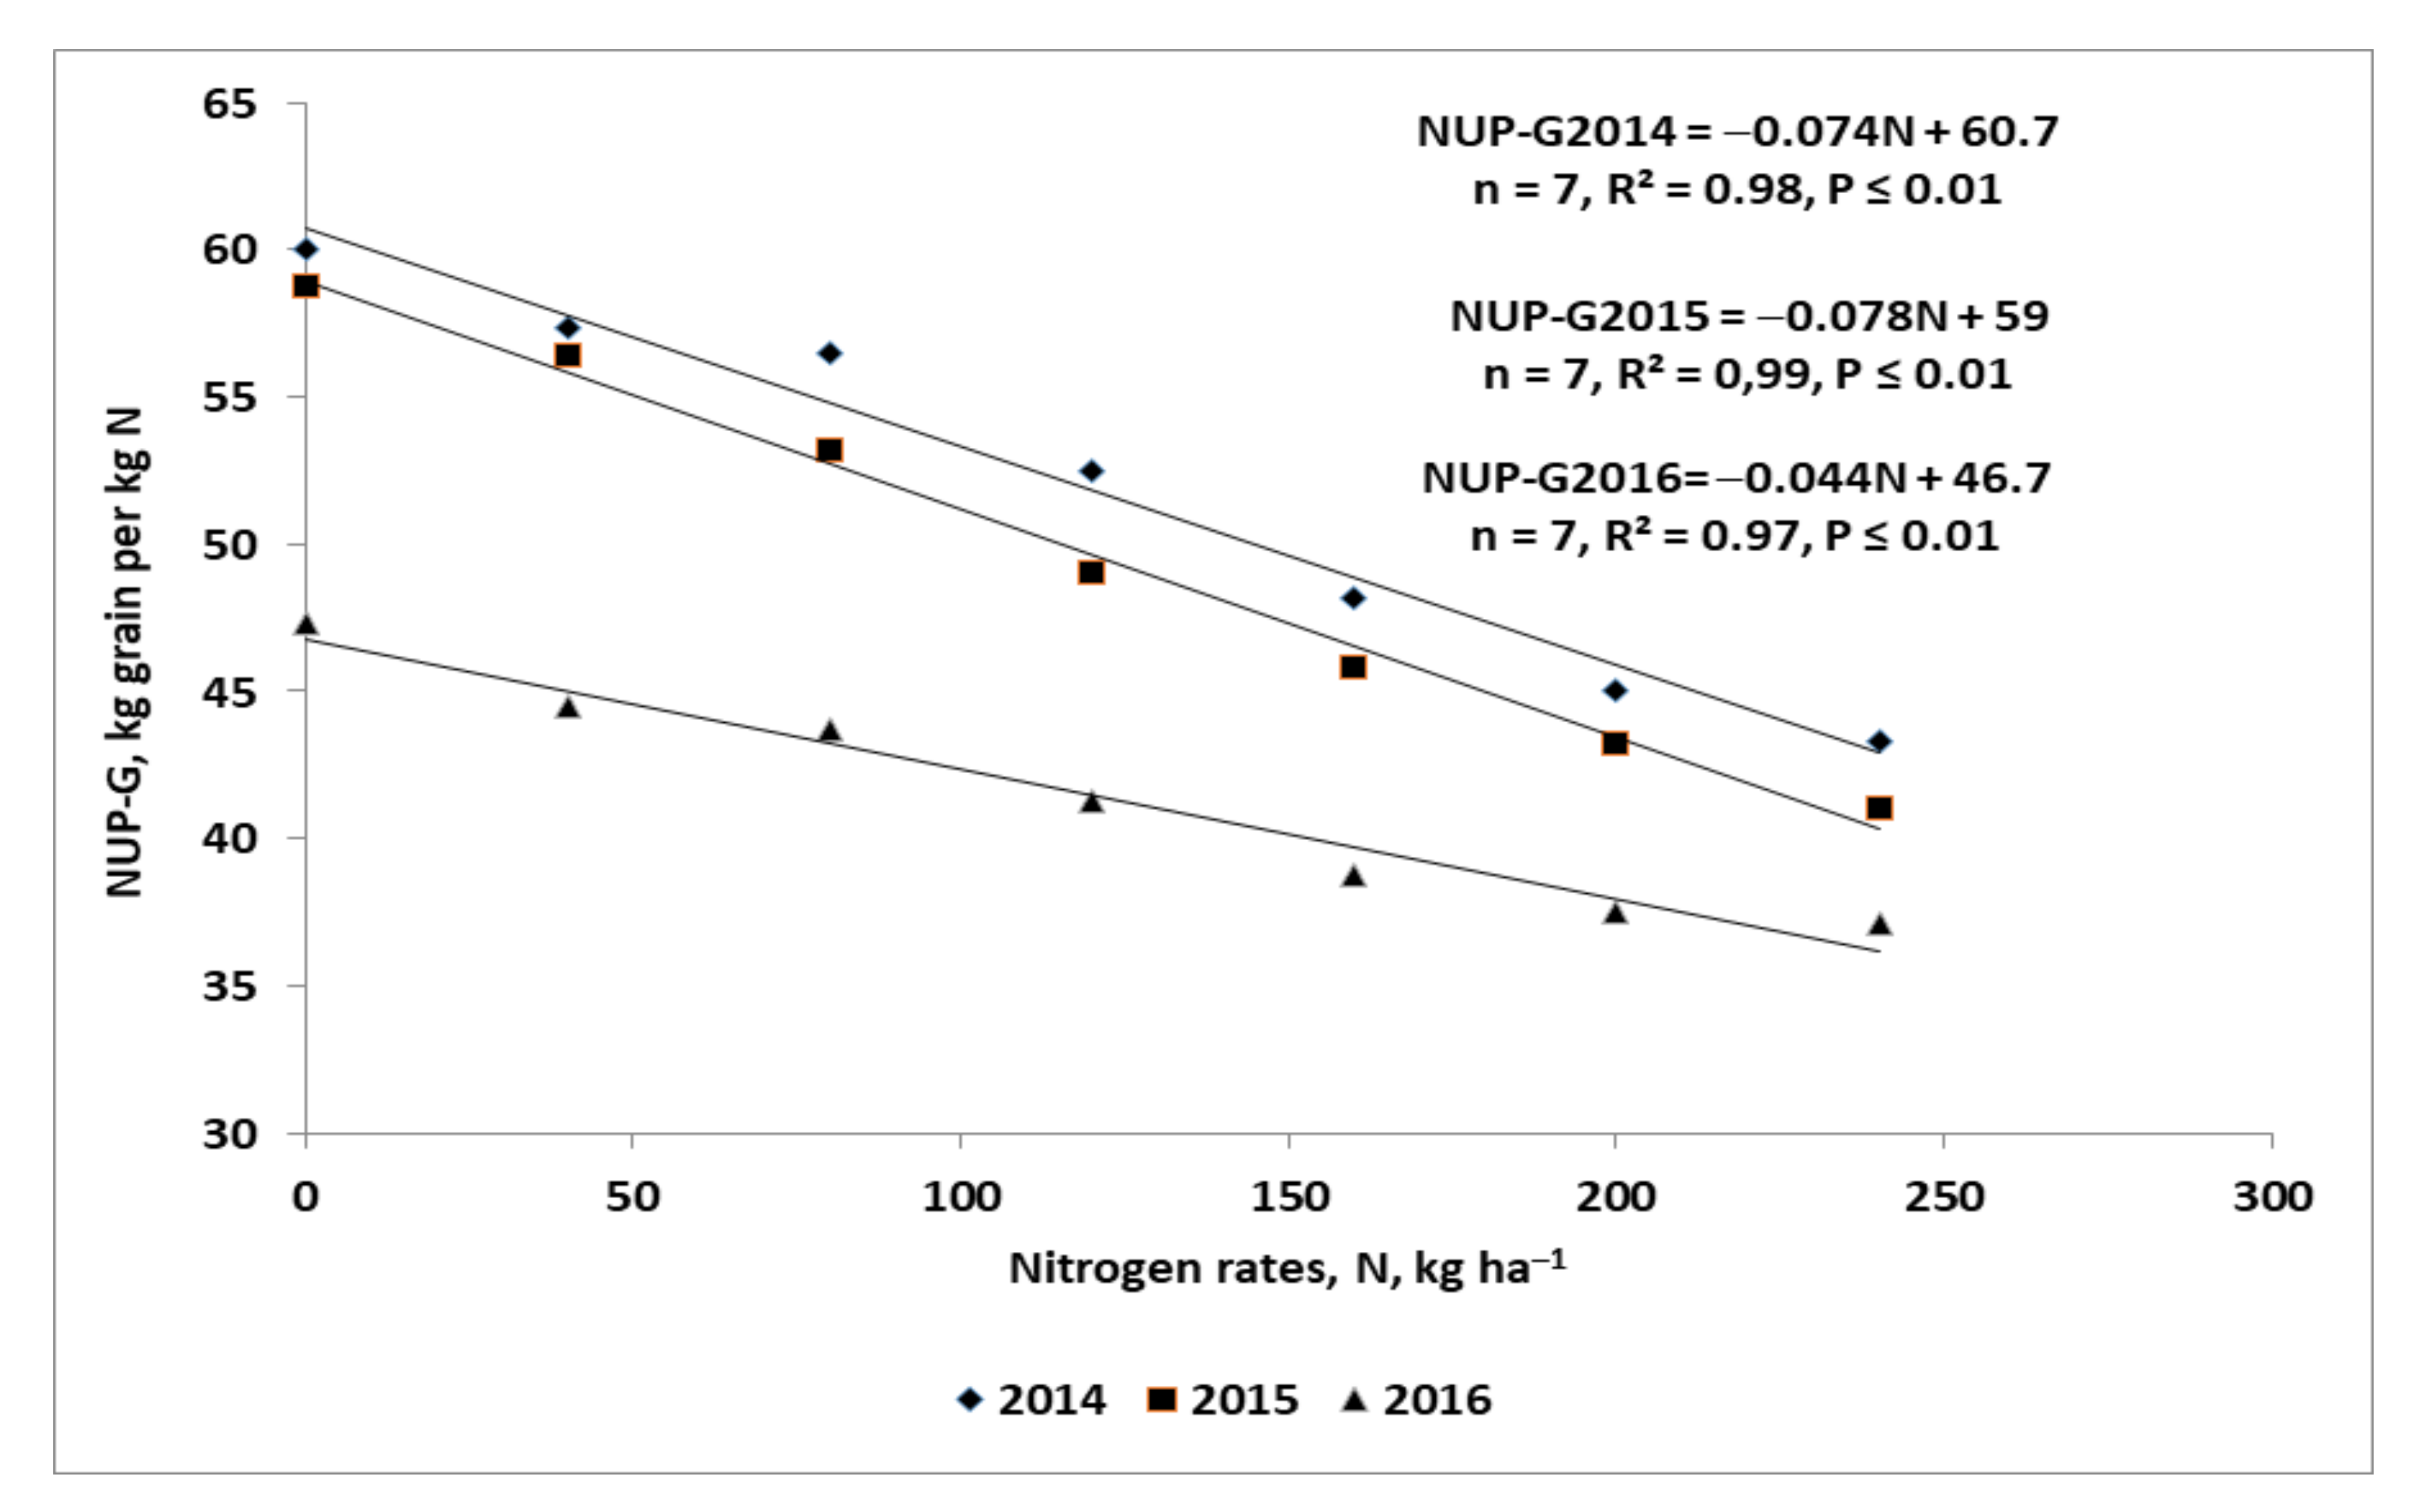
Nitrogen Unit Productivity-Grain, NUP-G [44]
NUP-G = G Y × 1000 G N       kg   grain   × kg 1   N
7.
Nitrogen Unit Productivity-Total, NUP-T [44]
NUP-T = G Y × 1000 T N     kg   grain   × kg 1   N
8.
Partial Factor Productivity of fertilizer N, PFP-N [44]
PFP-N = G Y × 1000 N i f     kg   grain   kg 1   N f
9.
Nitrogen Agronomic Efficiency, NAE [45]
N A E = G Y N i × 1000 G Y N c × 1000 N i f     kg   grain   × kg 1     N f
10.
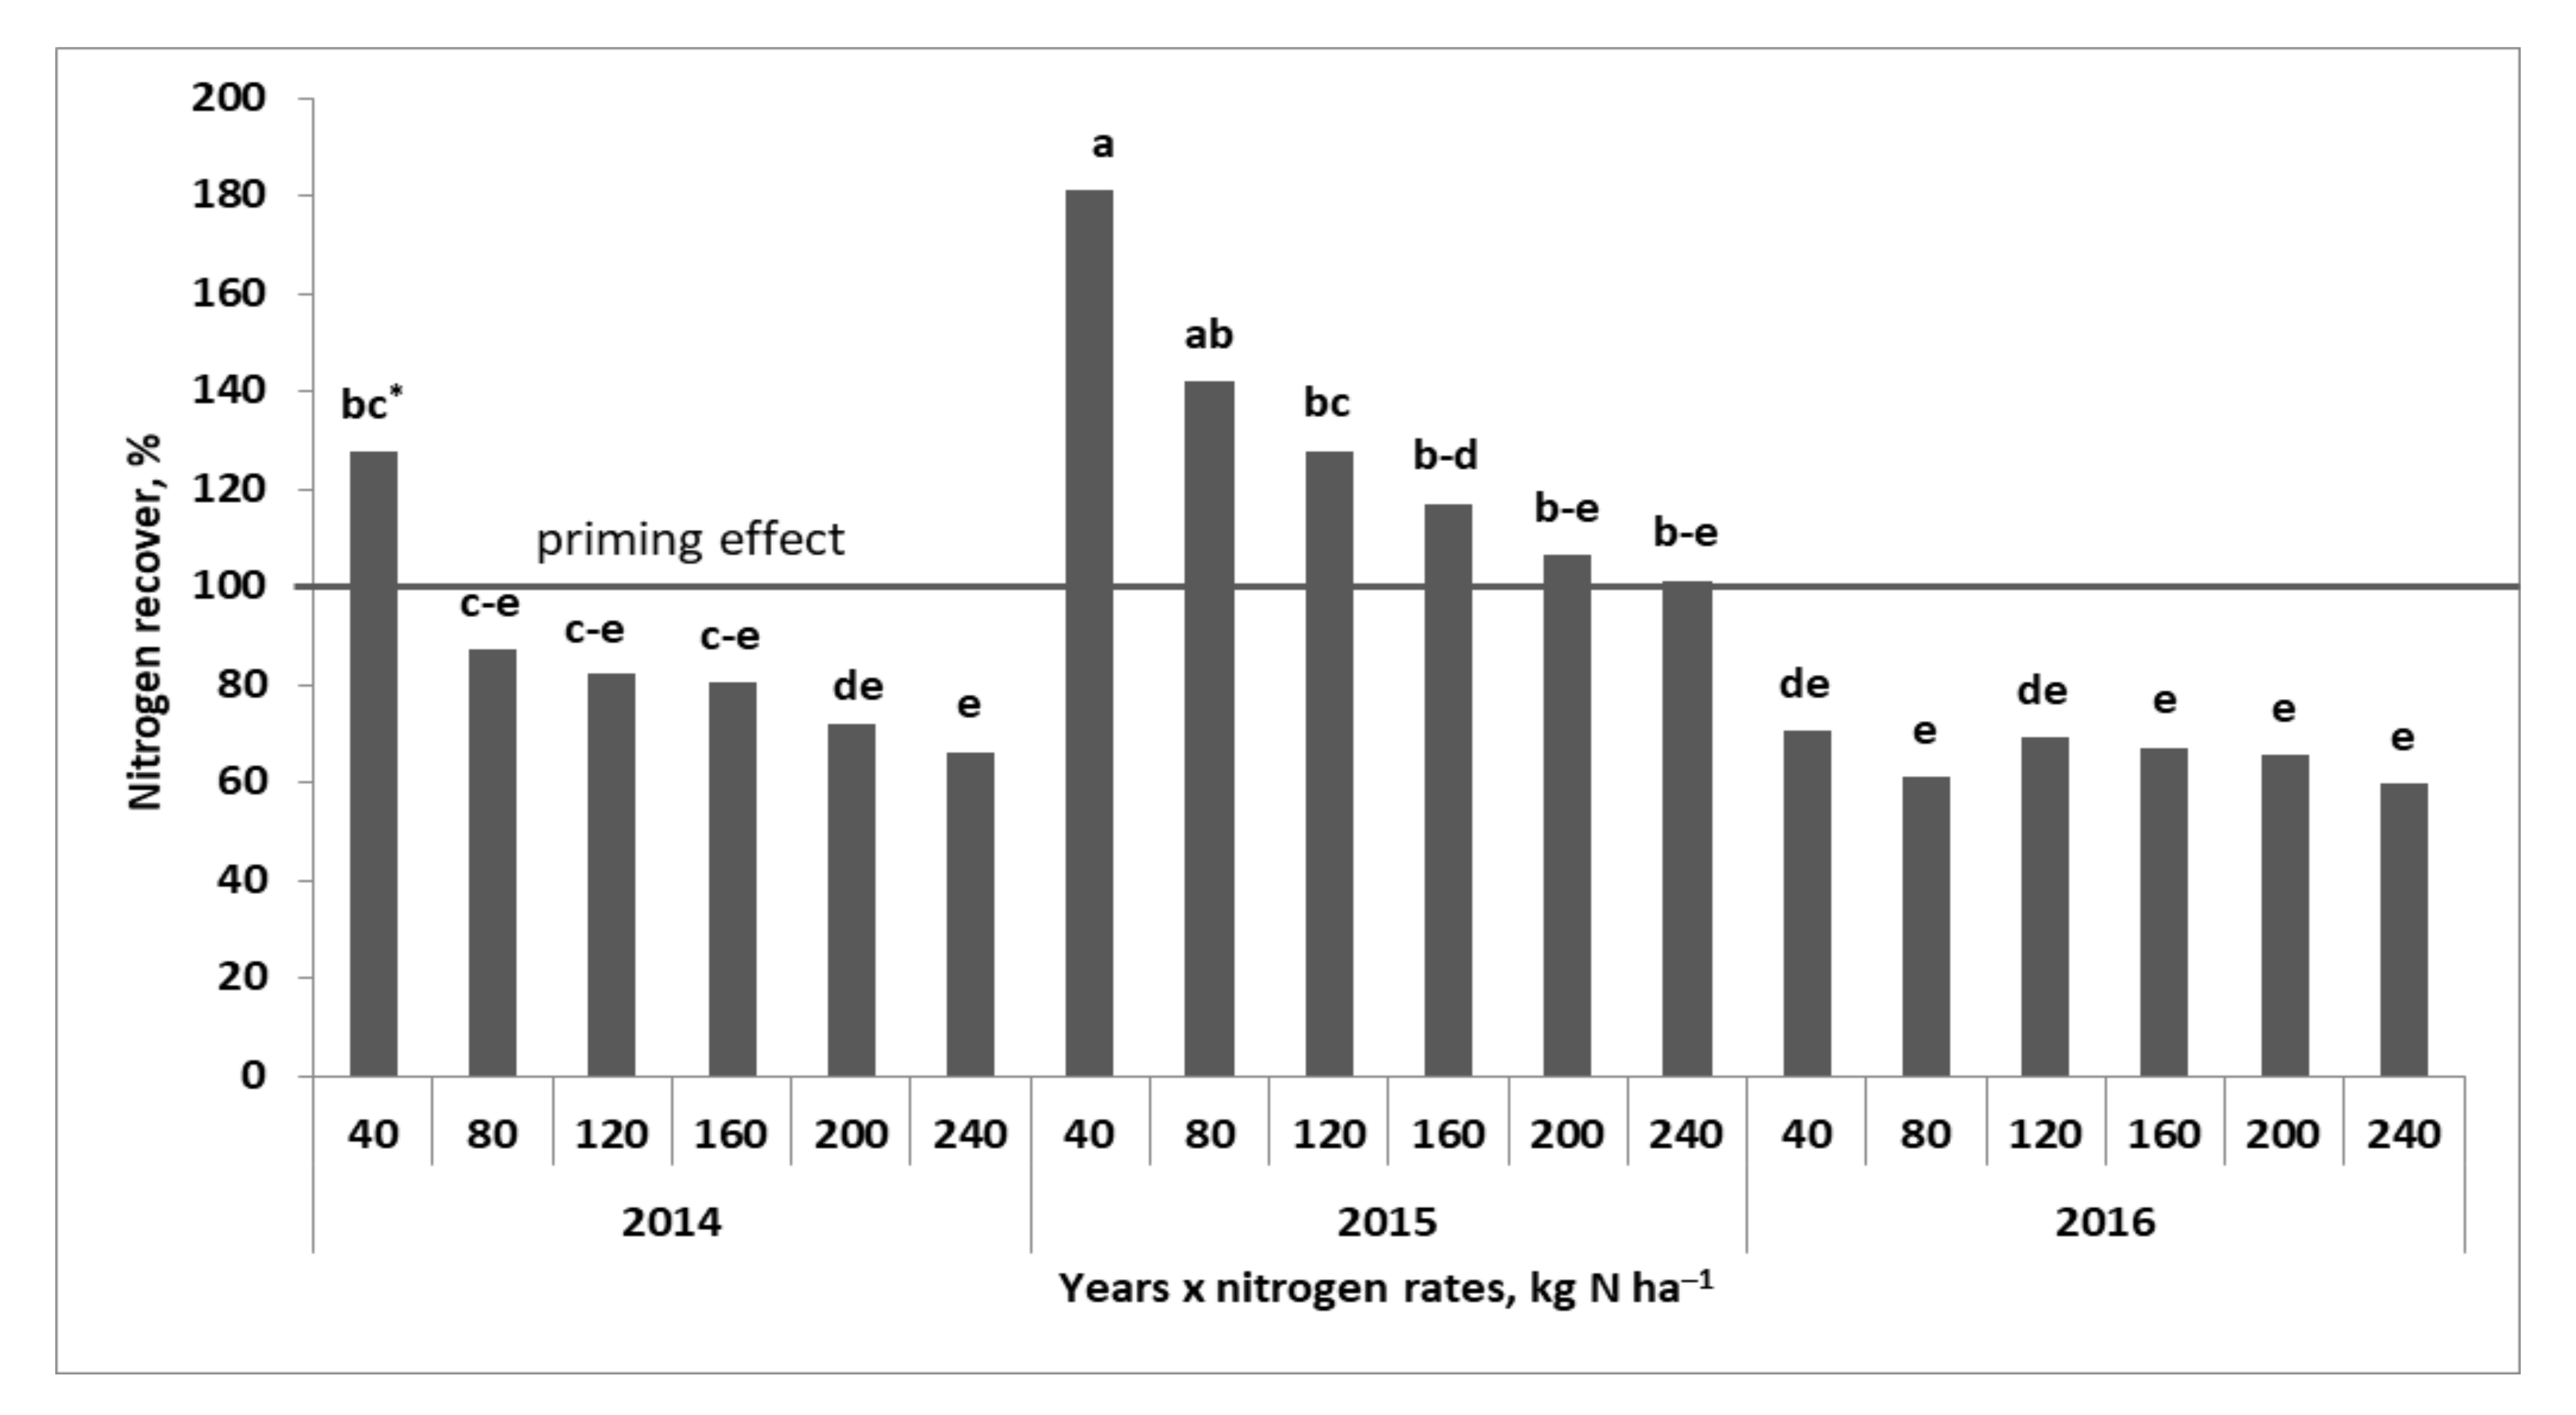
Nitrogen Recovery, N-R [45]
N-R = T N N i f T N N c N i f × 100 %
11.
Nitrogen Physiological Efficiency, NPhE [45]
N P h E = G Y N i × 1000 G Y N c × 1000 T N N i f T N N c     kg   grain   kg 1   N
where:
  • NHI—nitrogen harvest index, %;
  • HR—harvest residues, t ha−1
  • Nc—nitrogen control.

2.5. Statistical Analysis

The effects of individual research factors (year, foliar protection, N doses) and their interactions on the grain yield and indices of nitrogen use efficiency were assessed by means of a two-way ANOVA. Means were separated by honest significant difference (HSD) using Tukey’s method, when the F-test indicated significant factorial effects at the level of p < 0.05. The relationships between the traits were analyzed using the Pearson correlation and linear regression. The stepwise regression was applied to define the optimal set of variables for a given plant characteristics. The best regression model was selected based on the highest F-value for the entire model. STATISTICA 12 software was used for all statistical analyses (StatSoft Inc., Krakow, Poland, 2013).

3. Results

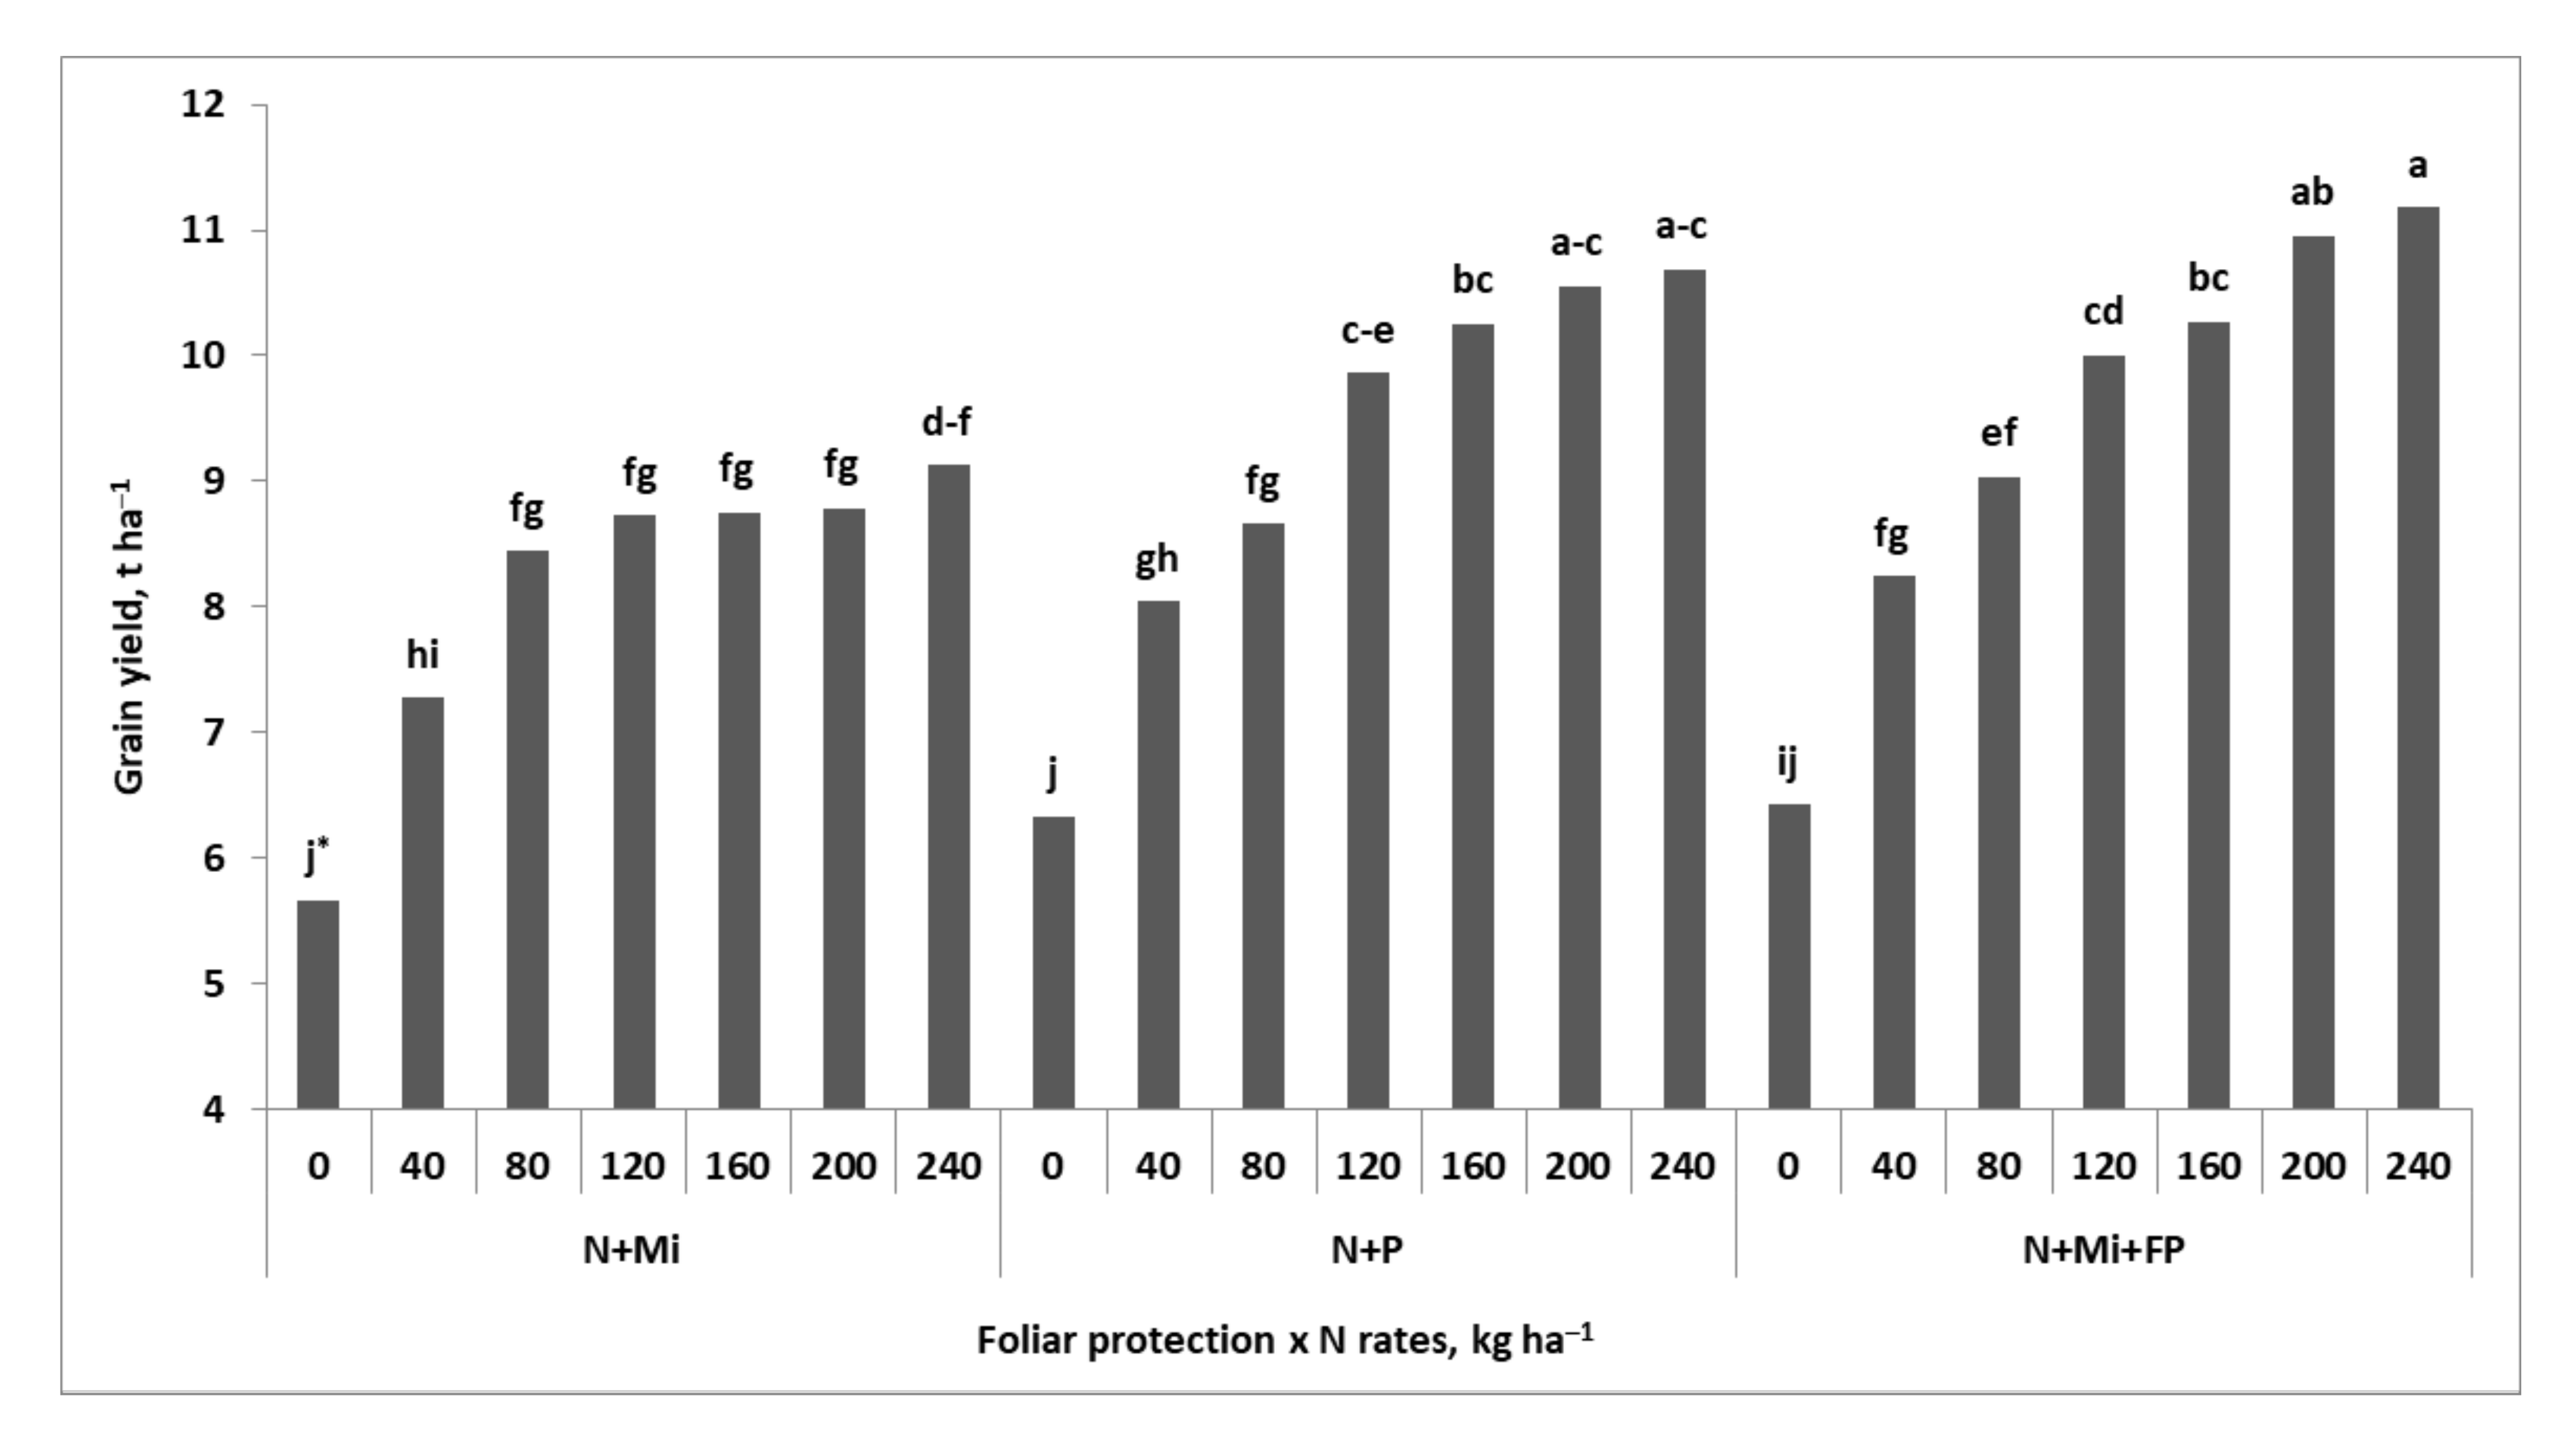
3.1. Grain Yield and Grain Yield Structure

The experimental factors and the years had a significant impact on the wheat-grain yield (Table 4). The highest GY recorded in dry 2015 was 66% and 22% higher, respectively, than in 2016 and 2014. The effect of foliar protection (FP) of wheat was significant. The yield increased in the following order: N + Mi < N + P < N + Mi + P. The increasing dose of N caused a progressive increase in the grain yield, averaged over the years and FP. The highest value was obtained on the plot fertilized with 240 kg ha−1.
The wheat grain yield, despite the significant effect of experimental factors and years, depended on the interaction of FP and N doses, which did not interact with years (Figure 2). The yield on the N + Mi object increased significantly to the N dose of 80 kg ha−1, and then continued its growth, but at a much slower rate. The resulting N dose–response pattern can be described by a double linear model, indicating the existence of two sub-phases:
(1)
progressive:
GY = 0.0347N + 5.739 for n = 3, R2 = 0.99, P ≤ 0.01
(2)
smooth:
GY = 0.0036N + 8.194 for n = 5, R2 = 0.86, P ≤ 0.05
The intersection of both lines provided a peak, indicating a change in the actual rate of increase in the grain yield in response to the dose of N. As indicated by the value of the direction coefficient, each dose of N fertilizer above 78.9 kg ha−1 resulted in a 10-fold reduction in the rate of increase in the yield compared to its rate below this value. For the N + P and N + P + Mi objects, the grain yield response to gradually increasing N doses can be best described by the quadratic regression model:
(1)
N + P:
GY = 0.000082N2 + 0.037N + 6.432 for n = 7, R2 = 0.99, P ≤ 0.01
(2)
N + P + Mi:
GY = 0.000074N2 + 0.036N + 6.611 for n = 7, R2 = 0.99, P ≤ 0.01
Both models are only seemingly the same, as indicated by the parameters of the equations obtained. The optimal N dose of 227.4 and 245.2 kg N ha−1 resulted in the maximum grain yield of 10.674 and 11.063 t ha−1 for N + P and N + P + Mi, respectively.
The straw yield, despite significant variability from year to year and for N doses, did not show a significant response to interactions of the studied factors (Table 4). The effect of the years was the same as that reported for the grain yield, but the differences were much smaller. The straw yield in 2015 was 21% higher than 2016 and 33.8% higher than to the lowest, yield recorded in 2014. The significant difference between the years resulted from the specific tendency of the harvest index (HI). It was significantly higher in 2014 and on the plots treated with fungicides. HI in 2014 was more than 10-percentage points higher than in 2016. This index showed a positive and significant response to plant protection and its combination with the Mi application. The gradual increase in N doses caused a progressive increase in HI up to 120 kg N ha−1, where it reached a stable level of 48%. The overall response of total wheat biomass to the experimental factors and the years was consistent with the patterns observed for the grain yield.
The wheat grain yield significantly depended on the number of grains per unit area (Grain density, GD) (Table A1). GD variability explains 98% of the GY variability:
GY = 0.52GD − 0.69 for n = 21, R2 = 0.98 and P ≤ 0.01
This component of the yield-grain structure also showed a significant dependence on the interaction of both experimental factors. At the same time, it showed no interaction with the years (Table 4). The primary GD components, i.e., ear density (ED) and the number of grains per ear (GR), did not show a significant response to the interaction of experimental factors and years. ED changed significantly over the study years, showing the same trend as that observed for the grain yield, but the differences between the years were much smaller. This yield component progressively responded to the gradual increase in the N dose, achieving stability on the plot fertilized with 200 kg N ha−1. The seasonal variability in the GR trend was almost at the same level as that for the grain yield. In 2015, it was 62% and 12.5% higher compared to 2016 and 2014. The combined action of micronutrients and fungicides (Mi + P) resulted in a significant increase in GR compared to the fungicide control. The effect of N doses was very specific, because GR increased progressively only up to the N dose of 80 kg ha−1, and then stabilized. The only thousand grain weight (TGW) responded significantly to experimental factors and years. Nevertheless, its variability was low, as indicated by the means of 48.1 ± 2.54 g.

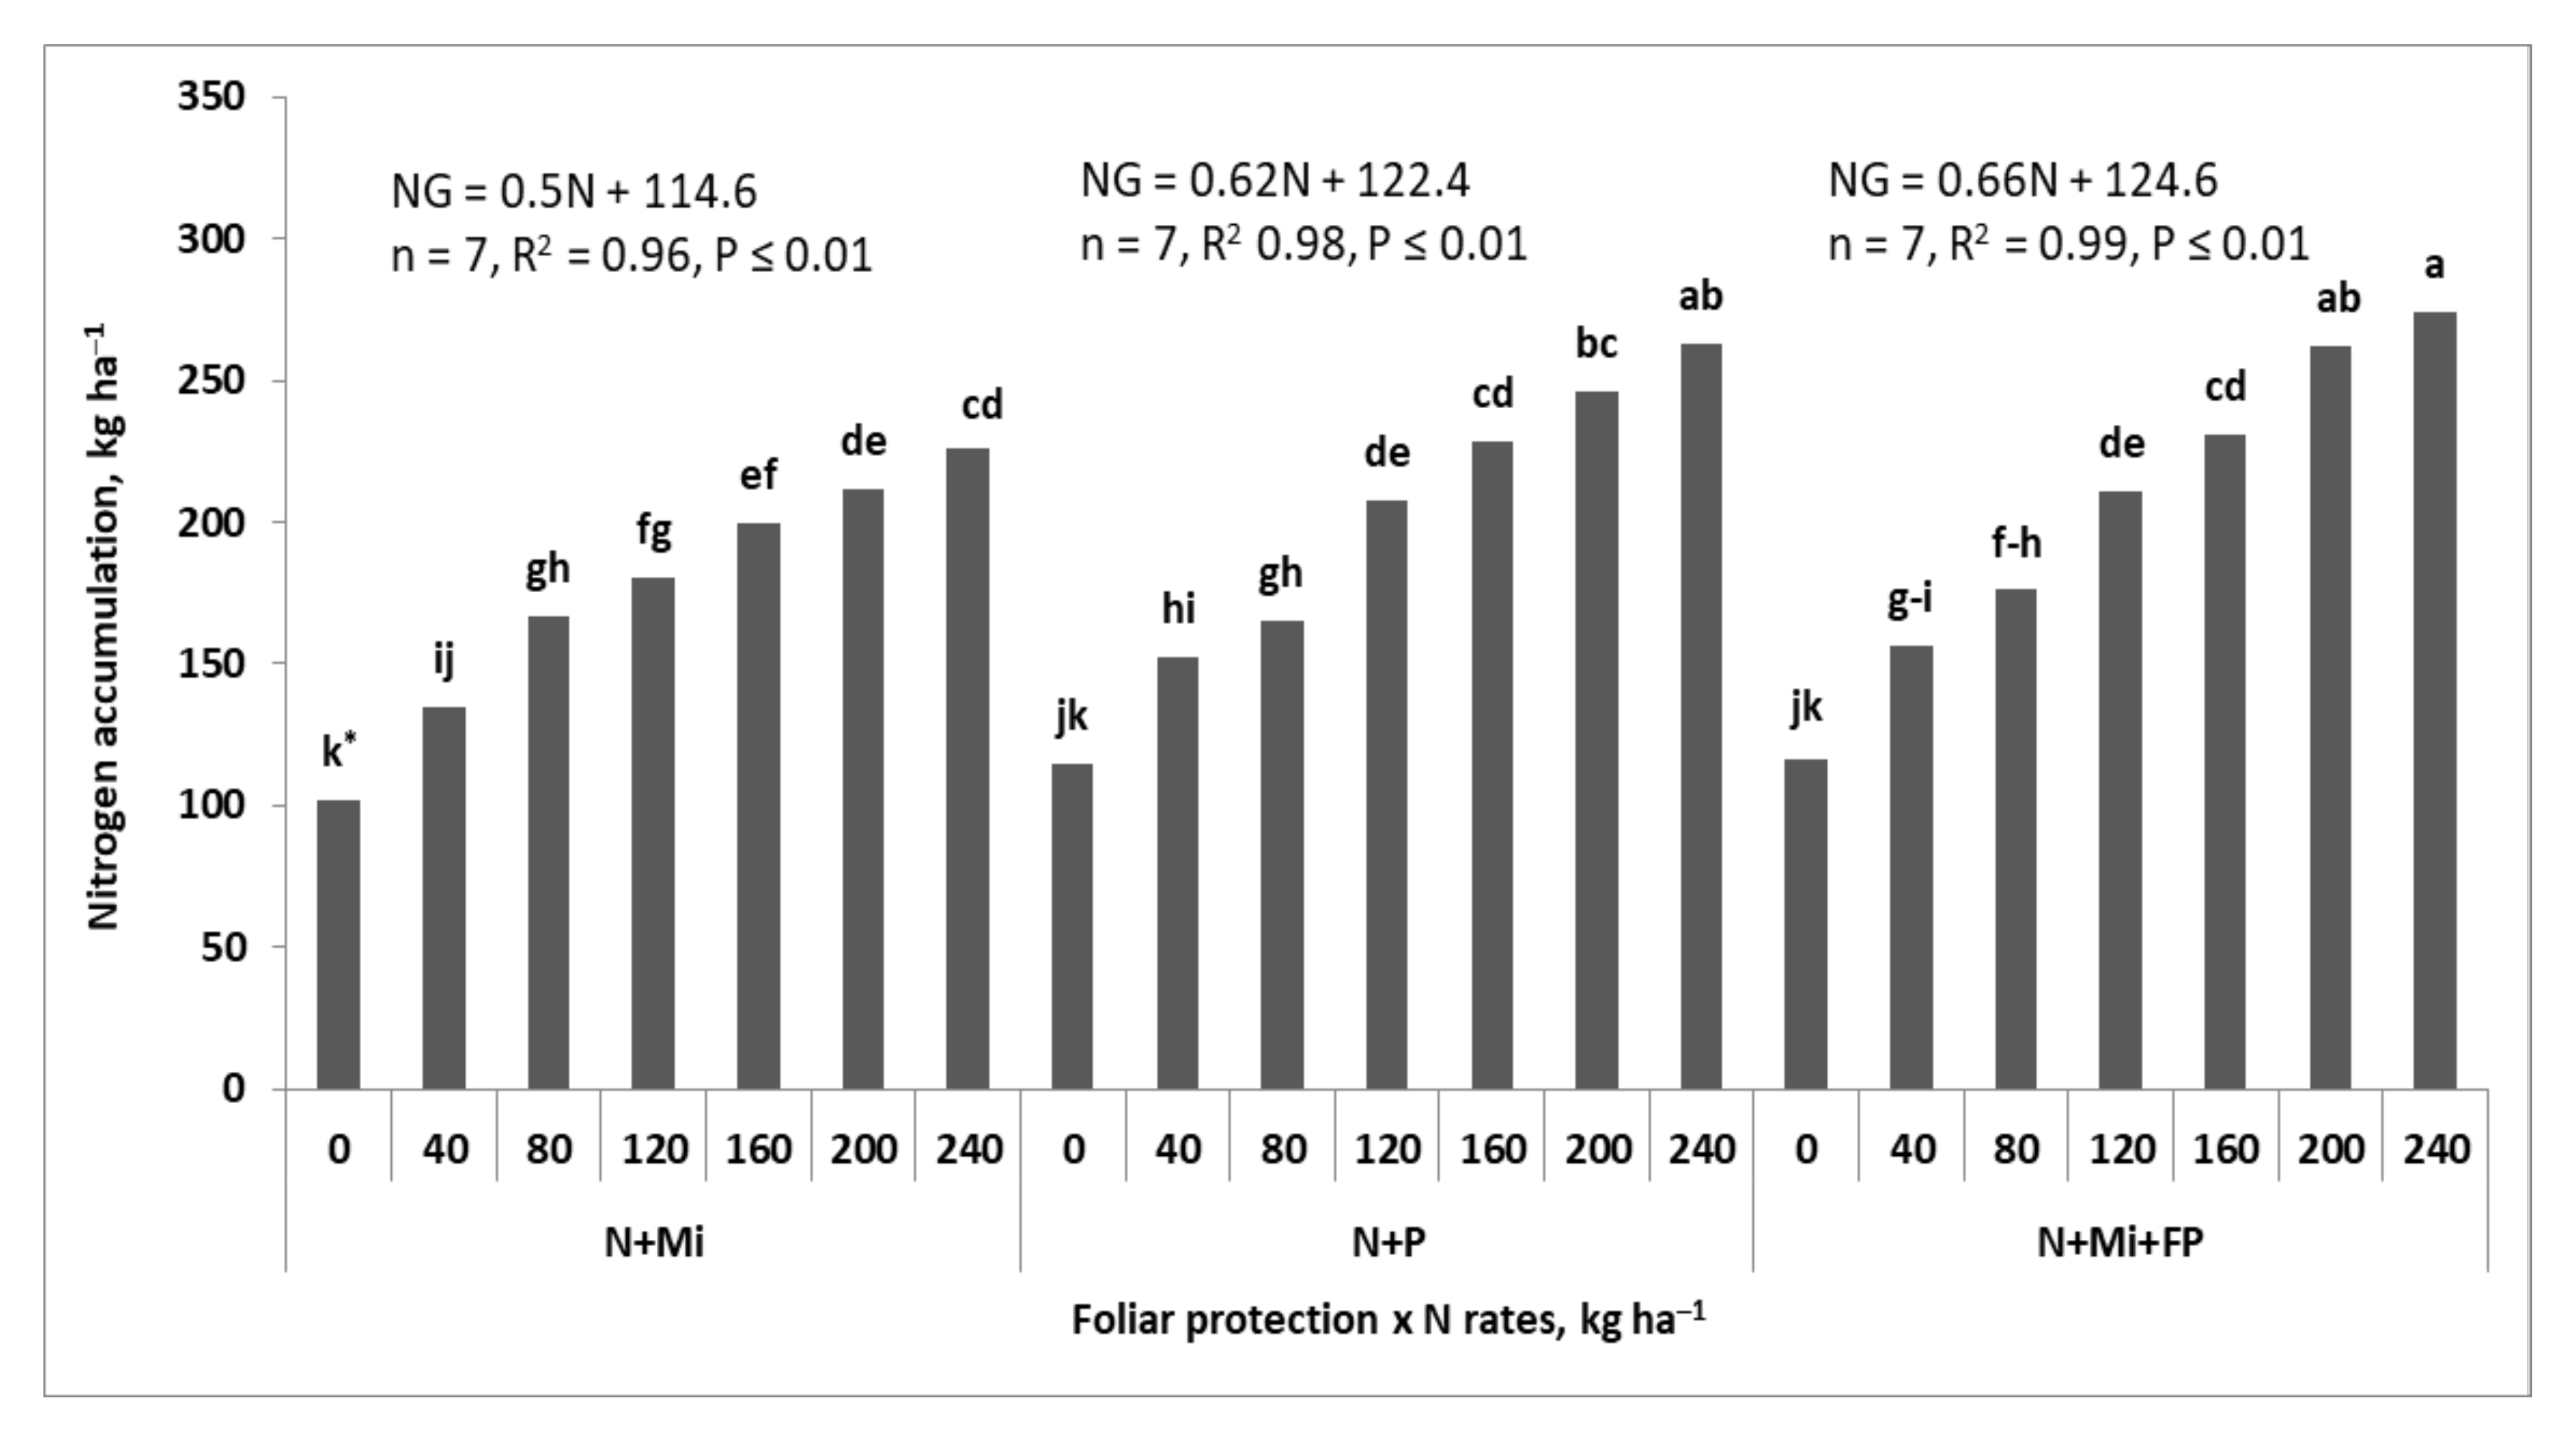
3.2. Nitrogen Accumulation

The amount of N accumulated in wheat grain (NG) showed the same tendency as for the grain yield in response to the experimental factors and the years (Table 4 and Table 5). The main difference between the trends obtained resulted from the effect of N doses. As shown in Figure 3, the increase in NG almost linearly corresponded to the increasing doses of N. The highest value of NG was achieved on the plot fertilized with 240 kg N ha−1. Its average value for other objects and years was 2.3-fold higher than in the N control. The key differences, as shown in Figure 3, resulted from the value of the direction coefficient. The FP effect was significant, and NG increased at a different rate in relation to the gradually increasing N doses. Averaged over the years and N doses, the order of the objects is as follows: N + Mi < N + P ≤ N + Mi + P.
The accumulation of N in the harvest residues (Nr) of wheat did not show a significant response to the interaction of all factors. The effect of the years was recorded only for 2014, when Nr was 1/3 lower compared to other years. The effect of N doses, averaged over other factors, was only slightly smaller than that reported for NG. The highest dose of N, equal to 240 kg ha−1 resulted in double the amount of N in the crop residues compared to the N control. The total N accumulated in wheat (TN) was consistent with the general trend described for total wheat biomass (Table 4 and Table 5). The Nitrogen Harvest Index (NHI) responded significantly to FP systems and N doses, but not to the interaction of experimental factors and years.
The overall effect of the experimental factors and years on the N utilization by wheat was assessed using three indicators. The first is Nitrogen Unit Accumulation (NUA). This index showed a significant response to all factors, analyzed separately, but not to the interaction of FP systems with years. The highest value of this index, obtained in 2016, was 30% and 40.6% higher than in 2015 and 2014. The FP effect was significant, but small. Higher NUA values were recorded for the N + Mi object. The effect of N doses was significant, but significantly lower than that observed for NG or Nr. The highest value of NUA was recorded on the plot fertilized with 240 kg N ha−1, which was 33% higher than in the N control plot.
The value of the next index, i.e., Total Unit Productivity of N (NUP-T) was the lowest in 2016 and the highest in 2014. As expected, the FP effect was the highest for the N + Mi + P object. Increased doses of N fertilizer caused a corresponding decrease in the NUP-T, which was the lowest for the plot fertilized with 240 kg N ha−1. The same trend was observed for the NUP-G index, which expresses the productivity of the N unit accumulated in wheat grain. The effect of the years was the same as that recorded for the NUP-T, but at a higher level. No significant impact of FP on this index was observed. The effect of the N doses was significant, showing an interaction with years. As presented in Figure A1, NUP-G decreased linearly each year, which logically corresponds to the effect of the increased N dose. The main difference between the years is in the value of the direction coefficient. In 2016, this coefficient was 43% lower than in 2015, when it was the highest. The highest values of NUP-G recorded in the N control were, respectively, 58.8 and 47.3 kg grain per kg of N accumulated in the grain in 2015 and 2016. For comparison, on a plot with 240 kg N ha−1, these values were, respectively, 41.0 and 37.2.
The analysis of the relationships between the NUE indices and the yield components clearly revealed the dominant role of ED, which significantly influenced the NG (Table A2). The effect of NT and Nr on the other yield components was significant, but much weaker. GR, as the basic component of GD, showed the highest positive relationship with NHI and at the same time negative with NUA. GD, as an aggregate component of the yield, showed the greatest correlation with NG, but not with Nr. The second major grain yield component, i.e., TGW, was significantly, but weakly, correlated with the NUE indices, but mostly with Nr.

3.3. Nitrogen Efficiency Indices

Partial Factor Productivity of fertilizer N (PFP-N) was the only index that responded significantly to the interaction of experimental factors, but not to their interaction with years (Table 6). The values of this index showed high variability, which was mainly affected by the N dose (Figure 4). The PFP-N response to increasing doses of N was the best fit to the power regression model. The key difference between the FP systems was the value of the constant, related to the theoretical efficiency of 1 kg of applied N fertilizer. This value was the highest for the N + Mi object and significantly lower for the other two. In the experimental reality, the PFP-N values for the plot with 40 kg N ha−1 ranged from 182 (100%) to 201 (104%) and to 206 (113%) kg grain kg−1 N for N + Mi, N + P and N + Mi + P, respectively. The lowest values of this index were typically found for the N treatment with the highest N dose. The differences between the main objects relatively increased on the fertilized plot with 240 kg N ha−1, and amounted to 37 (100%), 45 (121.6%), and 47 (127%) kg grain kg−1 N, respectively.
Nitrogen Agronomic Efficiency (NAE) responded significantly to experimental factors and years. However, significant interactions were noted only for Y × P and Y × N (Table 6). This index was more sensitive to weather variability in the studied years than grain yield and N accumulation by wheat. Its highest value, recorded in 2015, was 3.35-fold and 1.5-fold higher than in 2016 and 2014, respectively. It also increased in response to FP systems, and was significantly higher in objects treated with fungicides. The NAE response to gradually increasing N doses was consistent with the classical rule, i.e., it decreased gradually in response to increasing N doses. A progressive decrease in the index was recorded up to an N dose of 160 kg ha−1, and then it stabilized. A key indicator of the activity of N is its recovery from the applied fertilizer (R-N). This index followed the same patterns as those for NAE, but the differences were much weaker. The R-N index in 2015, as shown by the analysis of the Y × N interaction for all N doses exceeded 100%. Its values ranged from 181% to 101% on plots fertilized with 40 and 240 kg N ha−1, respectively. In 2014, R-N ranged from 128% to 66%, and in 2016 only from 71% to 60%, respectively. The Physiological efficiency of N fertilizer (PhE-N) showed slightly different patterns of response to the examined factors, mainly due to the impact of years. In 2016, PhE-N values were 37% lower compared to the first two years, but followed the same trend in response to increasing N doses.
The examined NUE indices showed a negative correlation with the components of yield (Table A3). The highest values of the correlation coefficients were found for ED, and then for GD. It should be emphasized that the negative sign for the analyzed dependencies is misleading. In fact, it reports that these two groups of wheat characteristics are opposite to one other. A classic example is the relationship between R-N and ED:
ED = −1.64R-N + 831.5 for n = 21, R2 = 0.70 and P ≤ 0.05
R-N = 0.0042ED2 − 6.077ED + 2277.8 for n = 21, R2 = 0.70 and P ≤ 0.01
The first equation clearly shows that the lowest ED was associated with the highest R-N and vice versa. The second equation states that a minimum R-N of 77.8% was achieved for ED of 723 ears per m2. Each decrease in ED resulted in a significant increase in the value of the R-N index. No significant correlations were found between the NUE indices and TGW.

4. Discussion

4.1. Grain Yield and Components of Yield Structure

The average wheat yields in the studied years were variable and ranged from 6.7 t ha−1 in 2016 to 11 t ha−1 in 2015. These two figures unequivocally confirm the hypothesis that modern wheat varieties are very sensitive to harsh conditions in the growing season, regardless of the European region [6,46]. Nevertheless, the interactive effects of the applied agronomic measures such as micronutrients and fungicides applied to wheat foliage, were the key driving forces in stabilizing the grain yield of wheat at a high level (Figure 2). The observed types of wheat responses to field protection systems resulted mainly from their interaction with a wide range of the applied N doses, which increased from 40 to 240 kg ha−1. Due to the lack of fungicide protection, despite of the use of micronutrients, the average yield was 8.4 t ha−1. This yield was achieved by applying only 80 kg N ha−1, which can be considered very high in Poland [5,47]. The main reason for such high yield was the forecrop, i.e., winter oilseed rape. This crop creates good conditions for wheat as a succeeding crop [48]. A progressive increase in N doses resulted in a gradual increase in the yield, but up to only 9.1 t ha−1. The yield growth rate on the plot fertilized with 80 to 240 kg N ha−1 was 10-folds slower compared to the rate obtained, applying less than 80 kg N ha−1. The obtained quasi stagnation in the grain yield suggests the dysfunctionality of the sink strength of wheat, i.e., grain number per unit area (GD, grain density). This conclusion was directly confirmed by the lower number of grain per ear (GR) but not by the number of ears per m2 (ED, Table 4). The results obtained confirm the common opinion that the stages immediately preceding flowering are of key importance for the yield of wheat grain [20,49].
Wheat grain yields showed a linear, and at the same time, a strong dependence (R2 = 0.98) on the grain density (GD). It has been well-documented that this trait of wheat is characteristic of modern wheat varieties. The size of this component of the yield depends on the nitrogen supply to plants over a period from the stem elongation to heading [16,50,51]. The lowest yield recorded in 2016, despite the good amount and distribution of rainfall, was the result of the lower number of grains per ear (GR). This component of the yield was 28% lower than in other years. Such a large decrease in GR, due to its significant impact on both the GD and grain yield, necessitates an identification of the cause. At the same time, no compensation in TGW was found. Slafer et al., [52] defined this cause as “yield regulator”. The main reasons for the GR reduction was the excess of N taken up by wheat in the vegetative phase of development. This explanation is supported by the value of Nitrogen Unit Accumulation (NUA), which was 1/3 higher compared to its values in the other years of study. An excess of N during the booting phase, which is critical for GR formation, leads to increased competition between the growing ear and the vegetative parts of wheat for the assimilates. Excessive and prolonged growth of the vegetative tissues of wheat, as a consequence, reduces the number of fertile flowers [53,54].
Globally, yield losses due to wheat diseases are in the range of 10–28% [55]. The yield gap due to pathogen pressure can be bridged by an increase in N doses, but only with the simultaneous use of fungicides. Kulig [56] found that under balanced conditions of the use of N, with an appropriate level of fungicide protection, the wheat grain yield increased by 35%. These two complementary facts provide a basis for an investigation of the most controversial problem in cereal production, i.e., the assessment of the yield-forming role of plant protection. In the Rabbinge [57] concept, plant protection belongs to the group of yield-reducing factors. This means that plant protection does not directly increase the yield by affecting the yield components. According to this view, the role of plant protection is to maintain the maximum yield produced by plants due to its optimal supply with water and N. Our study has provided evidence that contradicts this view. The conducted study showed that the yield of wheat treated with fungicides increased in line with N doses in comparison with the fungicide control, i.e., the object treated only with N and with micronutrients. The relative increase in GD compared to the fungicide control was approximately 18%. The GD increment level clearly emphasizes the yield-forming effect of fungicidal protection on yield components of wheat. This result can be explained by the effect of fungicides on N management in wheat during the formation of fertile flowers in the wheat ear. It has been well documented that the high dose of the applied N creates a favorable environment for the growth of biotrophs [35]. The positive effect of plant protection was indirectly confirmed by the yield stagnation on a plot fertilized with 80 kg N ha−1 in the fungicide control. At the same time, the amount of N accumulated by wheat increased linearly with the applied N doses (Figure 3). Pathogen pressure in combination with excess of N leads to a decrease in the green surface of the physiologically active parts of wheat [58,59]. In our case, this unexpected interaction resulted in a reduction in GD. The yield increase in wheat grain yield in response to fungicide application was 2.951 t ha−1 compared to the fungicide control. Thus, the hypothesis on the yield-forming effect of plant protection was fully confirmed. In light of the obtained results, the yield-forming effect of the applied micronutrients to wheat was found to be insignificant. This does not mean that the applied micronutrients did not fulfill their yield-forming function, taking into account GD and NUE. Their effect was detected, but wheat was protected with fungicides. The applied doses of N were exploited up to 227 kg ha−1 on the object with fungicides and theoretically up to 245 kg ha−1 on the object with both fungicides and micronutrients. The simultaneous combination of fungicide and micronutrients resulted in an additional increase in the yield by 0.39 t ha−1.

4.2. Agronomic Measures and Nitrogen Use Efficiency (NUE)

Intensive wheat fertilization with N is a common strategy to achieve two goals, i.e., high yield and high N content in the grain [60,61]. Therefore, the wheat management strategy, based on the strong protection of plants against the pressure of pathogens, requires an in-depth assessment of the effectiveness of the applied rates of N fertilizers [62].
The effect of the tested winter wheat foliar protection systems on NUE showed the existence of two different regression models (Figure 5). In the N + Mi system, i.e., fungicide control, the optimal total N accumulation (TNop), amounting to 298 kg N ha−1, resulted in a grain yield of 9.067 t ha−1. In contrast, in both systems with fungicides, the grain yield responded linearly to the increase in total N accumulated by wheat. The differences between the wheat protection systems were assessed on the basis of the Nitrogen Unit Productivity (NUP). This index directly relates to Nitrogen Utilization Efficiency, describing the production value of N accumulated by a crop. The values of this index calculated for TNop of 298 kg N ha−1 reached 30.4, 34.1, and 34.5 kg grain per kg of NT, respectively for N + Mi, N + P, N + Mi + P. This set of figures clearly stresses the greater effectiveness of N accumulated in wheat on the fungicide-treated objects. This study confirms the trends observed in other studies [62,63]. However, these reports did not explain the reason behind higher NUE. In our study, the ineffectiveness of N in wheat in the fungicide control resulted from inadequate levels of GD due to a reduction in GR. This condition is synonymous with the underdevelopment of the physiological sink [54,55].
The reasons for the ineffectiveness of N management in the fungicide control can be explained on the basis of the Nitrogen Unit Accumulation index (NUA). The increase in NUA in response to gradually increasing N doses showed a negative correlation with NHI, NUP-G, NUP-T, as well as with GR. This set of relationship indicates an unsustainable redistribution of N taken up by wheat between the grain and its vegetative tissues. The high share of N in the vegetative wheat tissues was a consequence of the reduced grain density on the object not protected with fungicides. This type of response suggest that these processes were revealed in the early stages of the ear growth [64,65]. The grain yield was not compensated for by the increase in grain weight (TGW), as is often assumed [66,67]. This response explains the reason behind the relatively low accumulation of N in wheat grains during the grain-filling period [68]. However, on objects treated with fungicides, the maximum grain yield in relation to the N supply could be achieved with TNop of 370 and 424 kg N ha−1, for the N + P and N + Mi + P systems, respectively. Therefore, it can be concluded that, in these two systems, the increase in the wheat grain yield was limited due to size of the source, i.e., the deficiency of NT in the wheat biomass at harvest.
The productivity of the applied N fertilizer doses was also assessed with the use of four classical NUE indices. Among the examined indices, PFP-N allows for a quick assessment of the effectiveness of the applied N [69]. In general, the course of the obtained regression model best fit the power function (Figure 4). The effect of the wheat foliar protection systems was revealed by a slightly smoother slope of the curve in response to gradually increasing N doses. In the P + Mi object, the PFP-N value of 55 kg grain kg−1 Nf was obtained on the plot fertilized with 160 kg N ha−1. In the objects with fungicides, this value was recorded on the plot fertilized with 200 kg N ha−1. The increase in the productivity of the N dose by 40 kg ha−1 indicates a longer activity of wheat. In the studied case, it was directly related to the noticeably higher GD, and thus the increased wheat demand for N (Table 5).
The key index, summarizing the yielding-forming effect of the applied N is its recovery (R-N) by the currently grown crop. The R-N values showed a high variability between years (Figure A2). A phenomenon known as the priming effect as observed for all N rates in 2015 an on the plot with 40 kg N ha−1 in 2014. The observed excessive N uptake from the soil can only be explained by the extremely high N demand of the growing ear wheat. Two factors support this explanation, i.e., high GD and stable TGW. The observed type of wheat response is in line opinion provided by Kong et al. [17]. These authors found that under certain growing conditions, i.e., with increased grain demand for N, it is also taken from the soil during the grain filling period.

5. Conclusions

A comparison of the three foliar protection systems for winter-wheat production clearly shows that the yield gap was reduced by the use of fungicides. It can be further reduced by the simultaneous use of fungicides and micronutrients. This protection system is specifically recommended in wheat production systems with intensive use of N fertilizer. The strong dependence of the increase in the grain yield on the number of grain-per-unit-area clearly confirms that fungicides in wheat should be treated as the yield-forming factor. The ineffectiveness of the applied N in the fungicide control was fully confirmed by the Nitrogen Use Efficiency indices. The Nitrogen Unit Accumulation index, which expresses the efficiency of N uptake was not correlated with the amount of N accumulated in wheat grain, but with the amount in harvest residues. These non-productive dependencies were the result of disturbance of the N partition between the wheat grain and its vegetative tissues on the object without fungicide protection. The key reason of yield reduction was the lower number of grain per unit area, which consequently reduced the N demand of the enlarging grains for N during the grain-filling period. The observed disturbance in the N-flow was confirmed by both the significantly lower Nitrogen Harvest Index and its negative response to increased NUA. The increase in the indices of the Partial Factor Productivity of fertilizer on objects treated with fungicides indirectly indicates a higher productivity of the applied N fertilizer. On the one hand, the obtained results confirm the dominance of the physiological sink over the source. On the other hand, they justify the basic goal of the study, i.e., the yield forming role of plant protection. The foliar application of microelements supports the action of the fungicidal protection of wheat, increasing the productivity of high N rates.

Author Contributions

Conceptualization, W.S. and B.N.; methodology, W.S.; software, D.B.; validation, W.S., B.N. and W.G.; formal analysis, A.K.; investigation, B.N.; resources, M.K.; data curation, B.N.; writing—original draft preparation, W.S. and B.N.; writing—review and editing, W.G.; visualization, A.K.; supervision, A.K.; project administration, M.K. All authors have read and agreed to the published version of the manuscript.

Funding

This research received no external funding.

Data Availability Statement

The data presented in this study are available on request from the corresponding author. The data are not publicly available due to the private property of Witold Szczepaniak.

Conflicts of Interest

The authors declare no conflict of interest.

Appendix A

Table A1. Matrix of correlation indices for grain yield winter wheat and its components, n = 21.
TraitsYSTBHIEDGEGDTGW
YG 10.83 ***0.97 ***0.84 ***0.89 ***0.91 ***0.99 ***0.59 **
YS1.000.94 ***0.410.96 ***0.64 **0.87 ***0.30
TB 1.000.69 **0.96 ***0.84 ***0.98 ***0.49 *
HI 1.000.52 *0.90 ***0.79 ***0.71 ***
ED 1.000.67 **0.91 ***0.35
GE 1.000.91 ***0.51 *
GD 1.000.47 *
***, **, * indicate significant differences at p < 0.001. p < 0.01, and p < 0.05., respectively; Legend: 1 GY—grain yield; SY—straw yield; TB—total biomass; HI—harvest index; ED—ears density; GR—grain per ear; GD—grain density; TGW—thousand grain weight.
Table A2. Matrix of correlation indices for nitrogen parameters and yield components, n = 21.
TraitsNrNTNHINUANUP-GNUP-TEDGEGDTGW
NG0.74 ***0.99 ***0.340.22−0.48 *−0.310.90 ***0.67 **0.85 ***0.45 *
Nr1.000.83 ***−0.360.75 ***−0.83 ***−0.79 ***0.61 **0.060.340.63 **
NT 1.000.200.36−0.59 **−0.44 *0.87 ***0.56 **0.77 ***0.51 *
NHI 1.00−0.72 ***0.49 *0.70 ***0.330.86 ***0.68 **−0.20
NUA 1.00−0.95 ***−0.99 ***0.07−0.51 *−0.290.34
NJP-G 1.000.97 ***−0.310.240.01−0.32
NJP-T 1.00−0.190.440.19−0.33
***, **, * indicate significant differences at p < 0.001, p < 0.01, and p < 0.05, respectively; NHI—nitrogen harvest index; NUA—nitrogen unit accumulation; NUP-G—nitrogen unit productivity—grain; nitrogen unit productivity—total biomass.
Table A3. Matrix of correlation indices for nitrogen efficiency indices and yield components, n = 21.
TraitsNAER-NN-FFEDGEGDTGW
PFP-N 10.96 ***0.92 ***0.70 **−0.79 ***−0.56 *−0.80 ***−0.11
NAE1.000.93 ***0.82 ***−0.81 ***−0.39−0.70 **−0.02
R-N 1.000.60 **−0.84 ***−0.42−0.73 **−0.14
N-FF 1.00−0.54 *−0.14−0.410.18
***, **, * indicate significant differences at p < 0.001, p < 0.01, and p < 0.05, respectively; 1 PFP-N—partial factor productivity of fertilizer N; NAE—nett nitrogen fertilizer productivity; R-N—nitrogen fertilizer recovery N-PhE—physiological efficiency of fertilizer taken up by the crop.

Appendix B

Figure A1. Trends of Nitrogen Unit Productivity for grain in consecutive years in study.
Agronomy 12 00257 g0a1
Figure A2. Nitrogen recovery in the successive years of study on the background of increasing N fertilizer doses. * Similar letters means a lack of significant differences using Tukeys’ test.
Agronomy 12 00257 g0a2

References

  1. Billen, G.; Lassaletta, L.; Garnier, J. A biochemical view of the global agro-food system: Nitrogen flows associated with protein production, consumption and trade. Glob. Food Sec. 2014, 3, 209–219. [Google Scholar] [CrossRef]
  2. Licker, R.; Johnston, M.; Foley, J.A. Mind the gap: How do climate and agricultural management explain the “yield gap” of croplands around the world? Glob. Ecol. Biogeogr. 2010, 19, 769–782. [Google Scholar] [CrossRef]
  3. Iwańska, M.; Paderewski, J.; Stępień, M.; Rodrigues, P.C. Adaptation of winter wheat cultivars to different environments: A case study in Poland. Agronomy 2020, 10, 632. [Google Scholar] [CrossRef]
  4. Jones, D.L.; Cross, P.; Withers, P.J.; DeLuca, T.H.; Robinson, D.A.; Quilliam, R.S.; Harris, I.M.; Chadwick, D.R.; Edwards-Jones, G. Nutrient stripping: The global disparity between food security and soil nutrient stocks. J. Appl. Ecol. 2013, 50, 851–862. [Google Scholar] [CrossRef]
  5. Schjoerring, J.K.; Cakmak, I.; White, P.J. Plant nutrition and soil fertility: Synergies for acquarring global green growth and sustainable management. Plant Soil 2019, 434, 1–6. [Google Scholar] [CrossRef] [Green Version]
  6. Schauberger, B.; Ben-Ari, T.; Makowski, D.; Kato, T.; Kato, H.; Ciais, P. Yield trends, variability and stagnation analysis of major crops in France over more than a century. Sci. Rep. 2018, 8, 16865. [Google Scholar] [CrossRef]
  7. Sinclair, T.R.; Rufty, T.W. Nitrogen and water resources commonly limit crop yield increases, not necessarily plant genetics. Glob. Food Sec. 2012, 1, 94–98. [Google Scholar] [CrossRef]
  8. Grafton, R.Q.; Williams, J.; Jiang, Q. Food and water gaps to 2050: Preliminary results from the global food and water systems (GFWS) platform. Food Sec. 2015, 7, 209–220. [Google Scholar] [CrossRef] [Green Version]
  9. McGuire, A.M.; Bryant, D.C.; Denison, R.F. Wheat yields, nitrogen uptake, and soil moisture following winter legume cover crop vs. Fallow. Agron. J. 1998, 90, 404–410. [Google Scholar] [CrossRef] [Green Version]
  10. Sylvester-Bradley, R.; Lunn, G.; Foulkes, J.; Shearman, V.; Spink, J.; Ingram, J. Management Strategies for Yield of Cereals and Oilseed Rape. HGCA Conference: Agronomic Intelligence: The Basis for Profitable Production. HGCA, 18. Available online: www.hgca.com/publications (accessed on 14 November 2021).
  11. Mayer, U. BBCH Monograph. In Growth Stages of Mono- and Dicotyledonous Plants, 2nd ed.; Federal Biological Research Center for Agriculture and Forestry: Berlin, Germany, 2001; Available online: http://www.jki.bund.de/fileadmin/dam_uploads/_veroeff/bbch/BBCH-Skala_Englisch.pdf (accessed on 14 November 2021).
  12. Tilley, M.S.; Heiniger, R.W.; Crozier, C.R. Tiller initiation and its effect on yield and yield components in winter wheat. Agron. J. 2019, 111, 1323–1332. [Google Scholar] [CrossRef] [Green Version]
  13. Meng, Q.; Yue, S.; Chen, X.; Cui, Z.; Ye, Y.; Ma, W.; Tong, Y.; Zhang, F. Understanding dry matter and nitrogen accumulation with time-course for high-yielding wheat production in China. PLoS ONE 2013, 8, e68783. [Google Scholar] [CrossRef] [Green Version]
  14. Bindraban, P.S.; Dimkpa, C.; Nagarajan, L.; Roy, A.; Rabbinge, R. Revisiting fertilisers and fertilization strategies for improved nutrient uptake by plants. Boil. Fertil. Soils 2015, 51, 897–911. [Google Scholar] [CrossRef] [Green Version]
  15. Hodgkinson, L.; Dodd, I.C.; Binley, A.; Ashton, R.W.; White, R.P.; Watts, C.W.; Whalley, W.R. Root growth in field grown winter wheat: Some effects of soil conditions, season and genotype. Eur. J. Agron. 2017, 91, 74–83. [Google Scholar] [CrossRef] [PubMed]
  16. Klepper, B.; Rickman, R.W.; Waldman, S.; Chevalier, P. The physiological life cycle of wheat: Its use in breeding and crop management. Euphytica 1998, 100, 341–347. [Google Scholar] [CrossRef]
  17. Kong, L.G.; Xie, Y.; Hu, L.; Feng, B.; Li, S.D. Remobilization of vegetative nitrogen to developing grain in wheat (Triticum aestivum L.). Field Crops Res. 2016, 196, 134–144. [Google Scholar] [CrossRef]
  18. Van Noordwijk, M.; van de Geijn, C. Root, shoot and soil parameters required for process-oriented models of crop growth limited by water or nutrients. Plant Soil 1996, 183, 1–25. [Google Scholar] [CrossRef]
  19. Forde, B.; Lorenzo, H. The nutritional control of root development. Plant Soil 2001, 232, 51–68. [Google Scholar] [CrossRef]
  20. Barraclough, P.B. The growth and activity of winter wheat roots in the field: Nutrient uptakes of high-yielding crops. J. Agric. Sci. Camb. 1986, 106, 45–52. [Google Scholar] [CrossRef]
  21. Shearman, V.J.; Sylvester-Bradley, R.; Scott, R.K.; Foulkes, M.J. Physiological processes associated with wheat yield progress in the UK. Crop. Sci. 2005, 45, 175–185. [Google Scholar]
  22. Slafer, G.A.; Elia, M.; Savin, R.; Garcia, G.A.; Terrile, I.I.; Ferrante, A.; Miralles, D.J.; González, F.G. Fruiting efficiency: An alternative trait to further rise in wheat yield. Food Energy Sec. 2015, 4, 92–109. [Google Scholar] [CrossRef]
  23. Johnston, A.M.; Bruulsema, T.W. 4R nutrient stewardship for improved nutrient use efficiency. Procedia Eng. 2014, 83, 365–370. [Google Scholar] [CrossRef] [Green Version]
  24. Olfs, H.-W.; Blankenau, K.; Brentrup, F.; Jasper, J.; Link, A.; Lammel, J. Soil-and plant-based nitrogen-fertilizer recommendations in arable farming. J. Plant. Nutr. Soil Sci. 2005, 168, 414–431. [Google Scholar] [CrossRef]
  25. Barłóg, P.; Łukowiak, R.; Grzebisz, W. Predicting the content of soil mineral nitrogen based on the content of calcium chloride-extractable nutrients. J. Plant. Nutr. Soil Sci. 2017, 180, 624–635. [Google Scholar] [CrossRef]
  26. Kumar, S.; Kumar, S.; Mohapatra, T. Interaction between macro- and micro-nutrients in plants. Front. Plant. Sci. 2021, 12, 665583. [Google Scholar] [CrossRef]
  27. Broadley, M.; Brown, P.; Cakmak, I.; Rengel, Z.; Zhao, F. Functions of nutrient: Micronutrients. In Marcher’s Mineral Nutrition of Higher Plants, 3rd ed.; Marschner, P., Ed.; Elsevier: Amsterdam, The Netherlands, 2012; pp. 243–248. [Google Scholar]
  28. Kumar, V.; Yadav, D.V.; Yadav, D.S. Effects of nitrogen sources and copper levels on yield, nitrogen and copper contents of wheat (Triticum aestivum L.). Plant. Soil. 1990, 126, 79–83. [Google Scholar] [CrossRef]
  29. Potarzycki, J. The role of copper in winter wheat fertilization. Part II. Nitrogen management. Zesz. Probl. Postępów Nauk Rol. 2004, 502, 960–966. (In Polish) [Google Scholar]
  30. Dordas, C. Role of nutrients in controlling plant diseases in sustainable agriculture. A review. Agron. Sustain. Dev. 2008, 28, 33–46. [Google Scholar] [CrossRef] [Green Version]
  31. Thompson, I.A.; Huber, D.M. Manganese and plant disease. p. 139–154. In Mineral Nutrition and Plant Disease; Datnoff, L.E., Elmer, W.H., Huber, D.M., Eds.; The APS: St. Paul, MN, USA, 2007; p. 278. [Google Scholar]
  32. Barłóg, P.; Grzebisz, W. Winter wheat yielding response to manganese foliar application and fungicide canopy protection. Fertil. Fertil. 2008, 32, 18–31. [Google Scholar]
  33. Taiz, L. Agriculture, plant physiology, and human population growth: Past, present, and future. Theor. Exp. Plant Physiol. 2013, 25, 167–181. [Google Scholar] [CrossRef] [Green Version]
  34. Hawkesford, M.J.; Riche, A.B. Impacts of G x E x M on nitrogen use efficiency in wheat and future prospects. Front. Plant Sci. 2020, 11, 1157. [Google Scholar] [CrossRef]
  35. Gebrie, S.A. Biotrophic fungi infection and plant defense mechanism. J. Plant Pathol. Microbiol. 2016, 7, 378. [Google Scholar]
  36. Simón, M.R.; Fleitas, M.C.; Castro, A.C.; Schierenbeck, M. How foliar fungal diseases affect nitrogen dynamics, milling, and end-use quality of wheat. Front. Plant. Sci. 2020, 11, 569041. [Google Scholar] [CrossRef] [PubMed]
  37. Castro, A.C.; Fleitas, M.C.; Schierenbeck, M.; Gerard, G.S.; Simón, M.R. Evaluation of different fungicides and nitrogen rates on grain yield and bread-making quality in wheat affected by Septoria tritici blotch and yellow spot. J. Cereal Sci. 2018, 83, 49–57. [Google Scholar] [CrossRef]
  38. Mehlich, A. Mehlich 3 soil test extractant: A modification of Mehlich 2 extractant. Com. Soil Sci. Plant. Anal. 1984, 15, 1409–1416. [Google Scholar] [CrossRef]
  39. Trávník, K.; Zbíral, J.; Němec, P. Agrochemical Soil Testing—Mehlich III; Central Institute for Supervising and Testing in Agriculture: Brno, Czech Republic, 1999. (In Czech) [Google Scholar]
  40. Zbíral, J. Determination of plant-available micronutrients by the Mehlich 3 soil extractant—A proposal of critical values. Plant Soil Environ. 2016, 62, 527–531. [Google Scholar] [CrossRef] [Green Version]
  41. Skowera, B. Changes of hydrothermal conditions in the Polish area (1971–2010). Fragm. Agron. 2008, 31, 74–87. [Google Scholar]
  42. ISO. PN-EN ISO 20483:2014-02. Cereal Grains and Pulses—Determinantion of Nitrogen Content and Conversion to Crude Protei–Kjeldah Method; ISO: Warsaw, Poland, 2015; p. 24. [Google Scholar]
  43. Laudański, Z.; Mańkowski, D.R. Planning and Statistical Analysis in Agricultural Research; IHAR: Radzików, Poland, 2007; p. 142. [Google Scholar]
  44. Moll, R.H.; Kamprath, E.J.; Jackson, W.A. Analysis and interpretation of factors which contribute to efficiency of nitrogen utilization. Agron. J. 1982, 74, 562–564. [Google Scholar] [CrossRef]
  45. Dobermann, A. Nitrogen use efficiency—State of the art. In Proceedings of the IFA International Workshop on Enhanced Efficiency Fertilizers, Frankfurt, Germany, 28–30 June 2005; pp. 1–16. [Google Scholar]
  46. Pecio, A.; Smagacz, J. Interaction between nitrogen and chemical protection in yield formation of cereal crops. In New Perspectives in Plant Protection; Bandani, A.R., Ed.; InTech: London, UK, 2012; pp. 167–191. ISBN 978-953-51-0490-2. [Google Scholar]
  47. Tabak, M.; Lepiarczyk, A.; Filipek–Mazur, B.; Lisowska, A. Efficiency of Nitrogen Fertilization of Winter Wheat Depending on Sulfur Fertilization. Agronomy 2020, 10, 1304. [Google Scholar] [CrossRef]
  48. Wanic, M.; Denert, M.; Treder, K. Effect of forecrops on the yield and quality of common wheat and spelt wheat grain. J. Elem. 2019, 24, 369–383. [Google Scholar] [CrossRef]
  49. Duan, J.; Wu, Y.; Zhou, Y.; Ren, X.; Shao, Y.; Feng, W.; Zhu, Y.; Wang, Y.; Guo, T. Grain number response to pre–anthesis dry matter and nitrogen in improving wheat yield in the Huang–Huai Plain. Sci. Rep. 2018, 8, 7126. [Google Scholar] [CrossRef]
  50. Guo, Z.; Chen, D.; Schnurbusch, T. Plant and floret growth at distinct developmental stages during the stem elongation phase in wheat. Front. Plant. Sci. 2018, 9, 330. [Google Scholar] [CrossRef] [Green Version]
  51. Würschum, T.; Leiser, W.L.; Langner, S.M.; Tucker, M.R.; Longin, C.F.H. Phenotypic and genetic analysis of spike and kernel characteristics in wheat reveals long-term genetic trends of grain yield components. Theor. Appl. Genet. 2018, 131, 2071–2084. [Google Scholar] [CrossRef] [PubMed]
  52. Slafer, G.A.; Savin, R.; Sadras, V.O. Course and fine regulation of wheat components in response to genotype and environment. Field Crops Res. 2014, 157, 71–83. [Google Scholar] [CrossRef]
  53. Rickman, R.W.; Waldman, S.E.; Klepper, B. MODWht3: A development driven wheat growth simulation. Agron. J. 1996, 88, 176–185. [Google Scholar] [CrossRef]
  54. Xie, Q.; Mayes, S.; Sparkes, D.L. Preanthesis biomass accumulation and plant organs defines yield components in wheat. Eur. J. Agron. 2016, 81, 15–26. [Google Scholar] [CrossRef]
  55. Figueoroa, M.; Hammond-Kosack, K.E.; Solomon, P.S. A review of wheat diseaes—A field perspective. Mol. Plant. Pathol. 2018, 19, 1523–1536. [Google Scholar] [CrossRef] [PubMed]
  56. Kulig, B.; Kania, S.; Szafrański, W.; Zając, T. Reakcja wybranych odmian pszenicy ozimej na intensywność uprawy. Bull. Plant Breed. Acclim. Inst. 2001, 218–219, 117–126. (In Polish) [Google Scholar]
  57. Rabbinge, R. The ecological background of food production. In Crop Production and Sustainable Agriculture; Rabbinge, R., Ed.; John Wiley and Sons: New York, NY, USA, 1993; pp. 2–29. [Google Scholar]
  58. Matzen, N.; Jørgensen, J.R.; Holst, N.; Jørgensen, L.N. Grain quality in wheat—Impact of disease management. Eur. J. Agron. 2019, 103, 152–164. [Google Scholar] [CrossRef]
  59. Belete, F.; Dechassa, N.; Molla, A.; Tana, T. Effect of split application of different N rates on productivity and nitrogen use effciency of bread wheat (Triticum aestivum L.). Agric. Food Sec. 2018, 7, 92. [Google Scholar] [CrossRef]
  60. Ellmann, T. Effect of intensity of agricultural techniques and grain storage on technological quality of winter wheat, Part I. Quality traits of grain and flour. Acta Sci. Polonorum. Agric. 2011, 10, 27–36. [Google Scholar]
  61. Pan, W.L.; Kidwell, K.K.; McCracken, V.A.; Bolton, R.P.; Allen, M. Economically optimal wheat yield, protein and nitrogen use component responses to varying N supply and genotype. Front. Plant Sci. 2019, 10, 1790. [Google Scholar] [CrossRef] [PubMed]
  62. Delin, S.; Nyberg, A.; Lindén, B.; Ferm, M.; Torstensson, G.; Lerenius, C.; Gruvaeus, I. Impact of crop protection on nitrogen utilisation and losses in winter wheat production. Eur. J. Agron. 2008, 28, 361–370. [Google Scholar] [CrossRef]
  63. Olesen, J.E.; Jorgense, L.N.; Petersen, J.; Mortensen, J.V. Effects of rate and timing of nitrogen fertilizer on disease control by fungicides in winter wheat. 1. Grain yield and foliar disease control. J. Agric. Sci. 2003, 140, 1–13. [Google Scholar] [CrossRef]
  64. Rivera-Amado, C.; Molero, G.; Trujillo-Negrellos, E.; Reynolds, M.; Foulkes, J. Estimating organ contribution to grain filling and potential for source upregulation in wheat cultivars with a contrasting source-sink balance. Agronomy 2020, 10, 1527. [Google Scholar] [CrossRef]
  65. Masoni, A.; Ercoli, L.; Mariotti, M.; Arduini, I. Post-anthesis accumulation and remobilization of dry matter, nitrogen and phosphorus in durum wheat as affected by soil type. Eur. J. Agron. 2007, 26, 179–186. [Google Scholar] [CrossRef]
  66. Gooding, M.J.; Dimmock, J.P.R.E.; Frane, J.; Jones, S.A. Green leaf area decline of wheat flag leaves: The influence of fungicides and relationships with mean grain weight and grain yield. Ann. Appl. Biol. 2000, 136, 77–84. [Google Scholar] [CrossRef]
  67. Duggan, B.L.; Domitruk, D.R.; Fowler, D.B. Yield component variation in winter wheat grown under drought stress. Can. Plant. Sci. 2000, 80, 739–745. [Google Scholar] [CrossRef] [Green Version]
  68. Acreche, M.M.; Slafer, G.A. Grain weight, radiation interception and use efficiency as affected by sink-strength in Mediterranean wheats released from 1940 to 2005. Field Crops Res. 2009, 110, 98–105. [Google Scholar] [CrossRef]
  69. Grzebisz, W.; Diatta, J. Constrains and solutions to maintain soil productivity, a case study from Central Europe. In Soil Fertility Improvement and Integrated Nutrient Management—A Global Perspective; Whalen, J., Ed.; InTech: London, UK, 2012; pp. 159–183. ISSN 978-953-307-945-5. [Google Scholar]
Figure 1. Daily mean air temperature and precipitation at the Experimental Station Smolice during the study.
Agronomy 12 00257 g001
Figure 2. Response of winter wheat grain yield to interaction of foliar protection systems and N rates. * Similar letters means a lack of significant differences using Tukeys’ test. Legend: N + Mi—N and micronutrients; N + P—N + fungicides; N + Mi + P—N plus micronutrients and fungicides.
Agronomy 12 00257 g002
Figure 3. Response of grain nitrogen by winter wheat to interaction of foliar protection systems and N rates. * Similar letters means a lack of significant differences using Tukeys’ test. Legend: N + Mi—N and micronutrients; N + P—N + fungicides; N + Mi + P—N plus micronutrients and fungicides.
Agronomy 12 00257 g003
Figure 4. Response of Partial Factor Productivity of fertilizer N by winter wheat to interaction of foliar protection systems and N rates. * Similar letters means a lack of significant differences using Tukeys’ test. Legend: N + Mi—N and micronutrients; N + P—N + fungicides; N + Mi + P—N plus micronutrients and fungicides.
Agronomy 12 00257 g004
Figure 5. Total nitrogen accumulation by winter wheat in dependence on the system of wheat foliar protection. Legend: N + Mi—N and micronutrients; N + P—N + fungicides; N + Mi + P—N plus micronutrients and fungicides.
Agronomy 12 00257 g005
Table 1. Soil agrochemical characteristics in consecutive growing seasons 1,2,3,4.
Soil, cmpHCorgPKMgCaCuMnZnFeNmin
%mg kg−1kg ha−1
2013/2014
0–306.91.3234 VH 5231 M105 VL988 L0.4 L27.2 L3.6 M536 H86.4
30–606.71.1234 VH237 M103 VL876 L0.4 L25.7 L3.5 M541 H
2014/2015
0–307.12.2185 H185 M165 M2045 M3.5 M85.5 M6.3 H268 M129
30–607.22.1161 H157 L155 L2063 M3.5 M93.8 M5.6 H26 9M
2015/2016
0–306.61.6202 VH281 M165 M1480 L2.8 M61.9 M6.1 H347 M110
30–606.61.4139 H222 M163 L1504 L2.5 M62.0 M3.7 M231 M
1 1.0 M KCl soil/solution ratio 1:2.5 m/v; 2 loss-on ignition; 3 Mehlich 3 [38]; 4 0.01 dm−3 CaCl2, soil/solution ratio 1:5 m/v; 5 availability classes: VL—very low; L—low; M—medium; H—high; VH—very high [39,40].
Table 2. Values of the Sielianinov hydrothermal index (k) for winter wheat (March–July).
Growing Season MarchAprilMayJuneJuly
2013/20142.0 qw1.3 qd3.4 ew0.6 vd1.1 qd
2014/20152.8 vw0.8 d0.6 vd0.7 vd0.7 vd
2015/20164.3 ew1.7 qw1.2 qd0.7 vd2.2 w
Legend: classes of weather conditions: very dry, vd: 0.41 < k < 0.7; dry, d: 0.71 < k < 1.0; quite dry, qd: 1.01 < k < 1.50; quite wet, qw: 1.51 < k < 2.0; wet, w: 2.01 < k < 2.5; very wet, vw: 2.51 < k < 3.0; extremely wet, ew: k > 3.01 [41].
Table 3. Time schedule and composition of micronutrients and fungicides applied to wheat.
Stage of Wheat GrowthMicroelementsFungicide
BBCH 30/31Cu + Mn → 60 + 140 g ha−1Capalo 337.5 SE → 1.5 dm3 ha−1
BBCH 39Cu + Mn + Zn → 15 + 60 + 100 g ha−1Adexar Plus → 2 dm3 ha−1
BBCH 65-Osiris 65 EC → 2 dm3 ha−1
Table 4. Statistical evaluation of factors affecting yields of winter wheat and components of yield structure.
FactorLevel of FactorDegree of
Freedom
GY 1SYTBHIEDGRGDTGW
t ha−1%Ears m−2Grains Ear−1Grains m−2g
Year (Y)201429.053 b9.085 b18.138 b50.3 a651.810 b31.2 a19.672 b46.1 c
2015 11.036 a12.155 a23.191 a47.4 b710.762 a31.3 a22.142 a49.7 a
2016 6.665 c10.044 c16.709 c39.8 c617.0 b22.5 b13.669 c48.6 b
P************************
Foliar ProtectionN + Mi28.112 c10.16018.272 b44.1 b646.727.1 b17.395 b46.4 c
(FP)N + P 9.199 b10.76219.961 a45.9 a675.528.4 ab18.937 a48.7 b
N + Mi + P 9.443 a10.36319.806 a47.6 a657.329.5 a19.151 a49.3 a
P***ns******ns*******
Nitrogen066.141 f8.252 c14.393 d43.1 c552.7 c23.8 b12.917 f47.6 b
(N)40 7.853 e9.924 b17.777 c44.1 bc625.9 b26.6 ab16.379 d47.8 b
80 8.711 d10.717 ab19.428 b44.9 ab665.5 ab27.9 a18.181 c47.9 b
120 9.528 c10.761 ab20.289 ab46.8 ab673.4 ab29.9 a19.804 b48.1 b
160 9.759 bc10.993 ab20.752 a47.0 ab687.0 ab30.2 a20.183 ab48.3 ab
200 10.100 ab11.109 ab21.209 a47.3 ab702.0 a30.0 a20.932 a48.3 ab
240 10.333 a11.241 a21.574 a47.8 a712.5 a29.8 a21.063 a49.0 a
P************************
Source of variation for interactions
Y*FP 4***nsns**nsns*****
Y*N 12***ns***nsnsns******
FP*N 12***nsnsnsnsns******
Y*FP*N 24nsnsnsnsnsnsns*
Similar letters means a lack of significant differences using Tukey’s’ test; ***, **, * indicate significant differences at p < 0.001, p < 0.01, and p < 0.05, respectively; ns—non significant; 1 GY—grain yield; SY—straw yield; TB—total biomass; HI—harvest index; ED—ears density; GR—grain per ear; GD—grain density; TGW—thousand grain weight.
Table 5. Statistical evaluation of factors affecting nitrogen accumulation and basic indices of nitrogen use efficiency.
FactorLevel of
Factor
Degree of FreedomNG 1NrNTNHINUANJP-GNJP-T
kg ha−1%kg N t−1 TBkg Grain kg−1 NGkg TB kg−1 NT
Year (Y)20142179.5 b45.1 b224.6 b80.0 a24.6 c51.8 a41.5 a
2015 231.0 a67.5 a298.6 a77.0 b26.6 b49.6 b38.1 b
2016 164.4 c67.6 a232.0 b70.7 c34.6 a41.4 c29.3 c
P*********************
Foliar ProtectionN + Mi2174.4 c62.6 a237.0 b73.6 c29.7 a47.535.1 b
(FP)N + P 196.9 b60.4 ab257.3 a76.2 b28.3 b47.836.5 a
N + Mi + P 203.6 a57.2 b260.9 a77.9 a27.8 b47.637.2 a
P*************ns***
Nitrogen06111.1 g37.1 e148.2 g75.424.5 f55.4 a42.0 a
(N)40 147.7 f49.5 d197.2 f74.926.2 d52.7 ab39.8 b
80 169.4 e56.6 cd226.0 e75.026.8 cd51.1 b38.5 b
120 199.6 d60.5 bc260.1 d76.628.1 c47.6 c36.6 c
160 219.5 c69.8 ab289.4 c75.830.4 b44.3 d33.6 d
200 239.8 b71.4 a311.2 b76.731.7 ab41.9 e32.3 de
240 254.3 a75.9 a330.1 a76.832.6 a40.5 f31.2 e
P*********ns*********
Source of variation for interactions
Y*FP 4**nsnsns**ns**
Y*N 12***ns***nsns******
FP*N 12***nsns*nsnsns
Y*FP*N 24nsnsnsnsnsnsns
Similar letters means a lack of significant differences using Tukeys’ test; ***, **, * indicate significant differences at p < 0.001, p < 0.01, and p < 0.05, respectively; ns—non significant; Legend: 1 NG, Nr, NT—nitrogen accumulation in grain harvest residues, total uptake; NHI—nitrogen harvest index; NUA—nitrogen unit accumulation; NJP-G—nitrogen unit productivity—grain; nitrogen unit productivity—total biomass.
Table 6. Statistical evaluation of factors affecting nitrogen efficiency indices.
FactorLevel of FactorDegree of FreedomPFP-NNAER-NN-PhE
kg Grain kg Nf%kg Grain kg−1 NNT
Year (Y)2014292.8 b27.8 b86.0 b31.5 a
2015 112.1 a41.6 a129.3 a31.4 a
2016 64.7 c12.4 c65.6 c19.9 b
P ************
Foliar ProtectionN + Mi282.8 b25.0 a94.424.6 b
(FP)N + P 92.1 a27.5 ab89.229.4 a
N + Mi + P 94.6 a29.3 a97.428.8 a
P ****ns***
Nitrogen406196.3 a43.3 a126.5 a31.5 a
(N)80 108.9 b32.1 b96.7 b33.5 a
120 79.4 c28.2 bc93.2 b29.8 a
160 61.0 d22.6 cd88.2 b24.9 b
200 50.5 e19.8 d81.5 b23.4 b
240 43.1 f17.5 d75.8 b22.5 b
P ************
Source of variation for interactions
Y*FP 4*******ns
Y*N 12**********
FP*N 12*nsnsns
Y*FP*N 24nsnsnsns
Similar letters means a lack of significant differences using Tukeys’ test; ***, * indicate significant differences at p < 0.001, p < 0.05, respectively; ns—non significant; NAE—net nitrogen fertilizer productivity; R-N—nitrogen fertilizer recovery N-PhE—physiological efficiency of fertilizer taken up by the crop.
Publisher’s Note: MDPI stays neutral with regard to jurisdictional claims in published maps and institutional affiliations.

