1. Introduction
Recently, the useful effects of plants, such as enhancements of germination, growth, and antioxidative activity, have been investigated, which are induced by active particles in plasmas [
1,
2,
3,
4,
5,
6,
7,
8,
9,
10,
11]. Enhancements of root and stem lengths and leaf area have been observed [
1,
2,
3,
4,
5,
6]. Restriction effects of plant growth have also been observed under some plasma conditions [
6]. To utilize these effects on plants and increase the production of agricultural products, detailed clarification of the response mechanism of plants against plasma irradiation is necessary. These growth enhancement effects would be owing to ions and active particles generated in plasmas. However, the mechanism and response processes of biological functions by the enhancement have not been clarified yet. Gene expression analysis of
Arabidopsis thaliana seed irradiated with plasmas has been performed to elucidate the growth enhancement mechanism [
7,
8,
9]. Observed gene expressions indicate that genes of the plant growth, stress response, hormone response, photosynthesis are upregulated. From these results, an increase of the energy production pathways would occur after germination.
As research on the enhancement of plant growth by plasma irradiation, plasma irradiation of seeds, and gene expression analysis of seeds have been mainly conducted. On the other hand, plasma irradiation to plants after germination and gene expression analysis for functional changes induced by plasma irradiation have not been performed. Gene expression in seeds is involved in the germination and cell differentiation of seeds, and information on sprout growth can be obtained [
10]. To investigate the growth process of the leaf, gene expression of the leaf must be analyzed. In this study, to investigate the gene expression variation in leaves by irradiation seeds or leaves, both seed and leaf are irradiated with oxygen plasma, and then responses of plant leaves after germination to the oxygen plasma irradiation are determined. Effects of plasma irradiation on plant growth process are investigated by (i) gene expression of the leaf that grows from seeds irradiated with plasma and (ii) gene expression of the leaf that is irradiated with plasma.
2. Experimental Apparatus and Methods
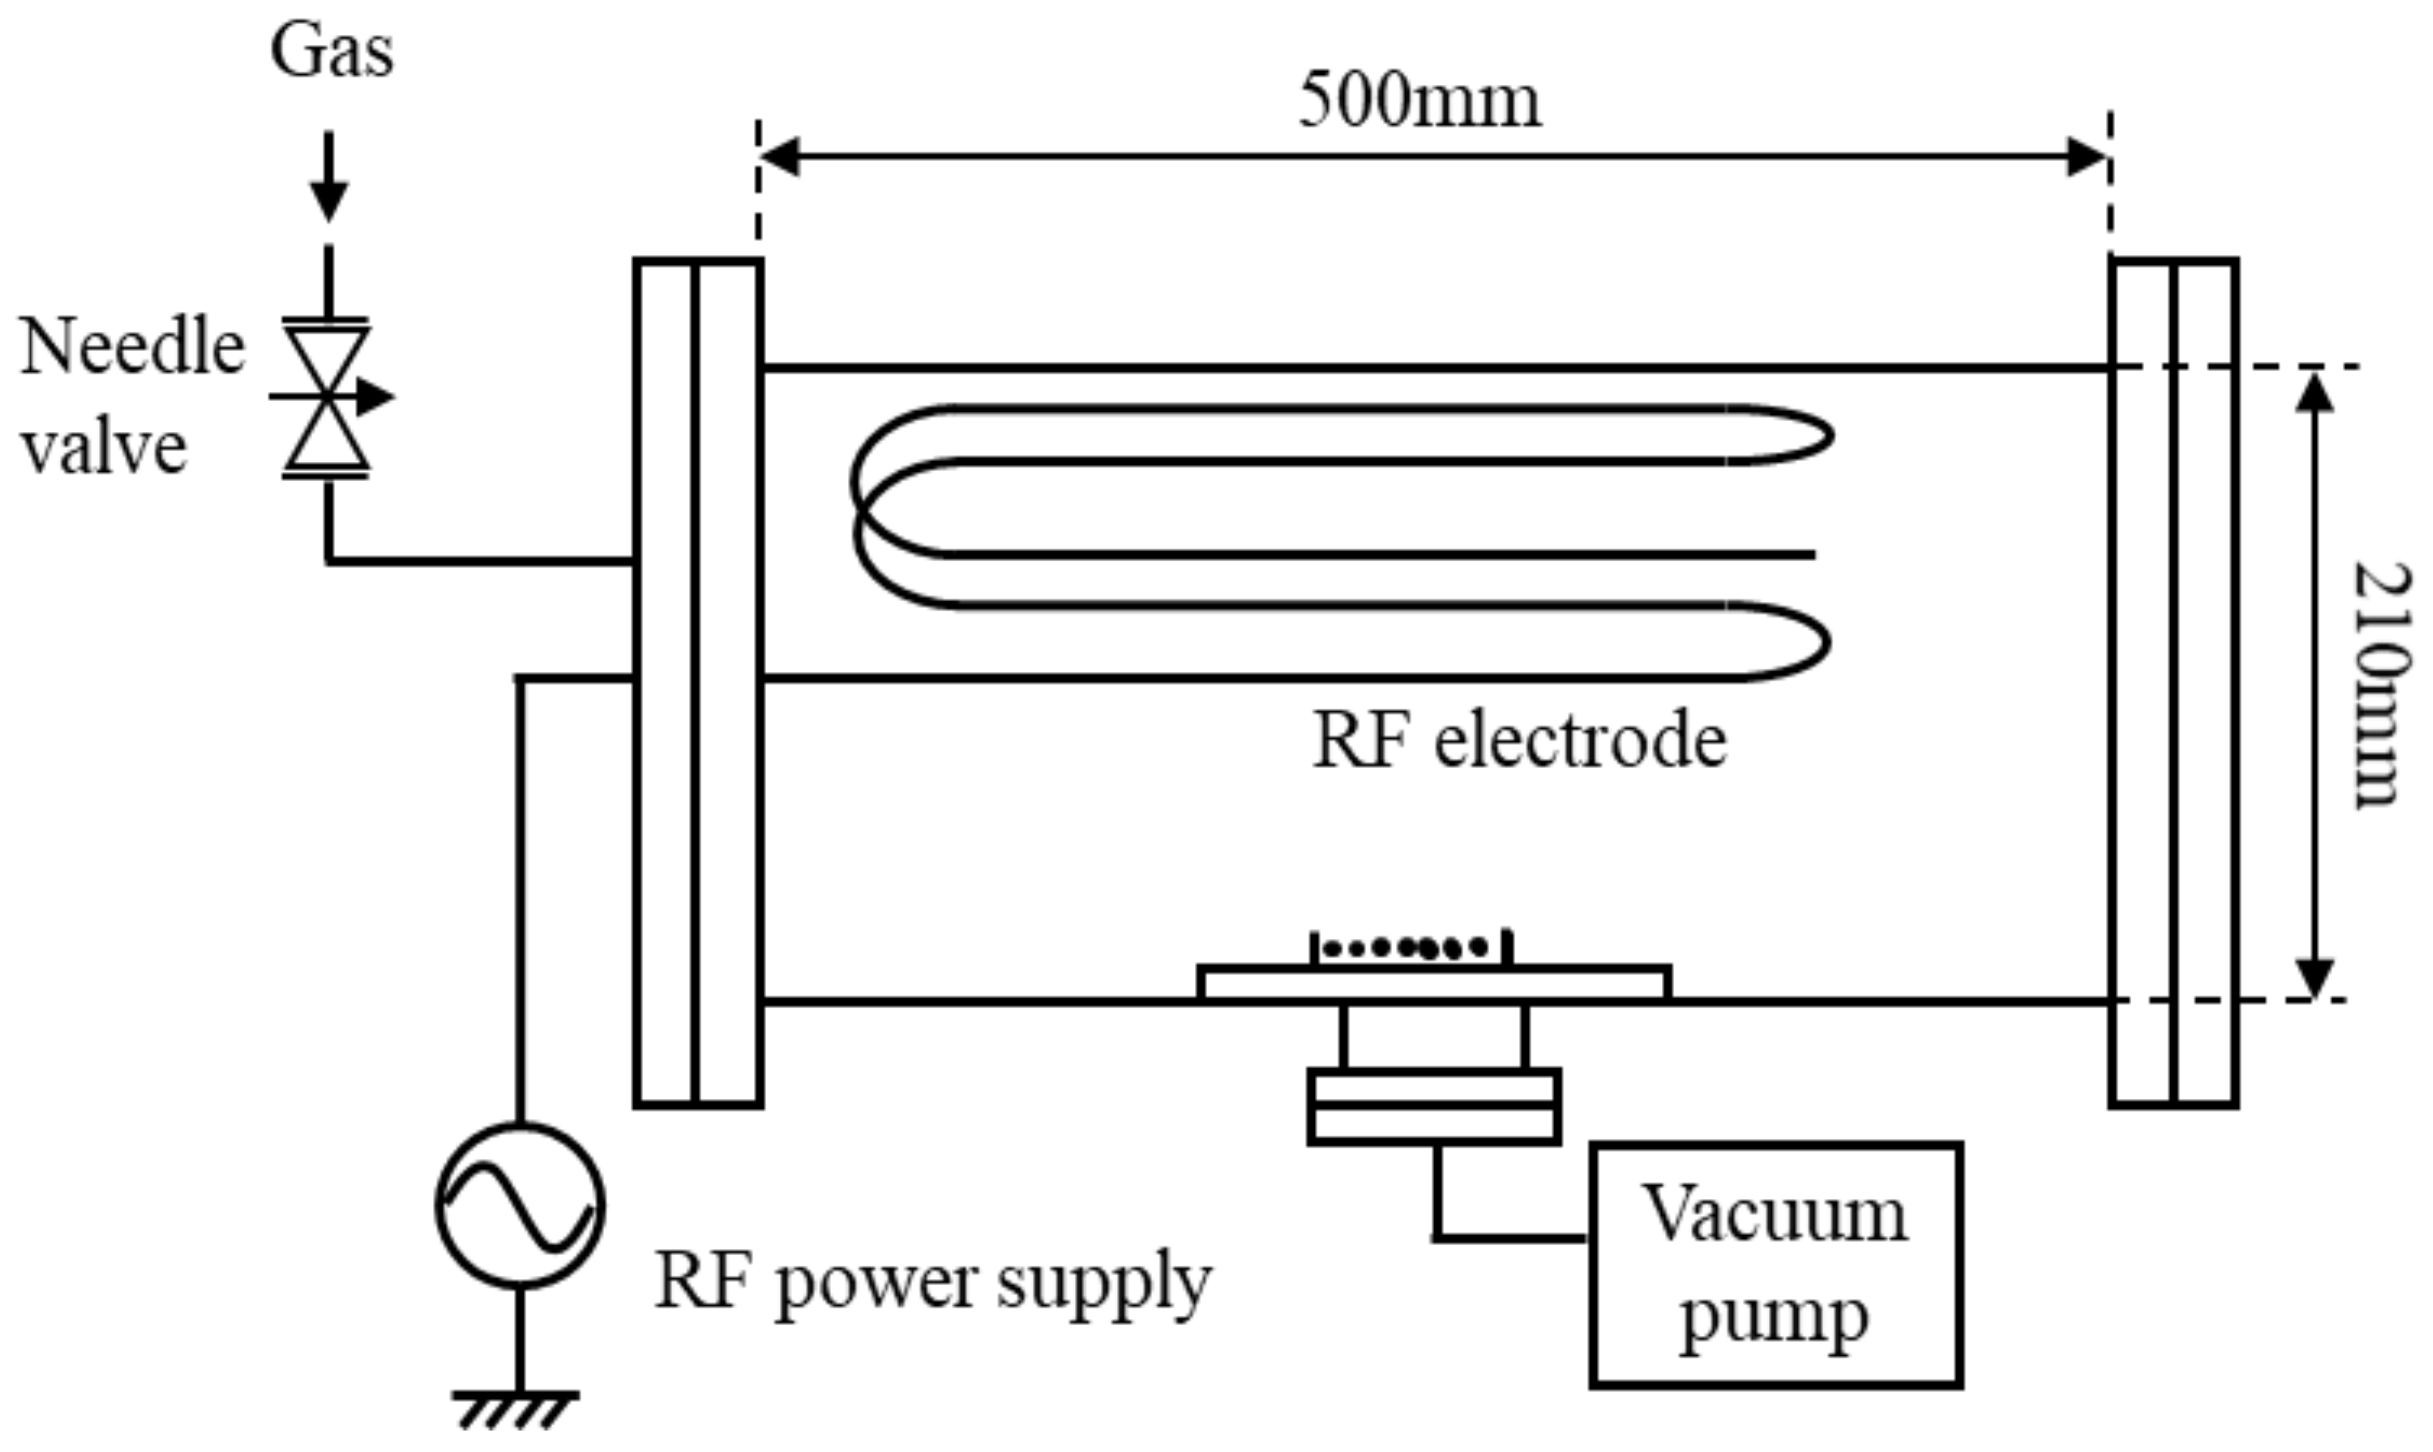
Figure 1 shows a schematic diagram of a low-pressure capacitively coupled plasma apparatus [
12,
13,
14,
15,
16]. The vacuum chamber is a stainless-steel cylindrical container with an inner diameter of 210 mm, a length of 480 mm, and a volume of 17 L. A high-frequency electrode is installed in the upper part of the chamber, and a sample holder on which the object to be processed is placed is installed in the diffused region. The distance between the electrode and the inner wall of the chamber is 3 cm, and the distance between the electrode and the sample holder is 17 cm. A high-frequency power supply with a frequency of 13.56 MHz and a load matching device were used for the plasma production. Plasma is produced in the gap between the high-frequency electrode and the inner wall of the grounded chamber. Oxygen gas is introduced from the gas cylinder to the vacuum pump through a gas regulator and a fine variable needle bulb. When the flow rate of oxygen gas is controlled using a variable needle bulb, and the evacuation velocity of a vacuum pump is kept constant, the oxygen gas pressure varies. Input high-frequency electrical power from a radio frequency power supply to the low-pressure plasma is kept constant at 60 W. From previous studies, the growth enhancement effect is induced by the active oxygen species with this input power on the seed. Time variation of the temperature in the chamber is measured because the increase of the temperature in the chamber would affect the gene expression of seeds. The temperature has hardly increased with plasma irradiation for 3 min. The increase of the temperature in the vacuum chamber is less than 10 °C after the irradiation for 30 min, which would not affect the plant growth. Species and the production amount of active oxygen in the plasma are measured using light emission spectroscopy. Time variation of the temperature in the chamber is measured because the increase of the temperature in the chamber would affect the gene expression of seeds. The temperature has hardly increased with plasma irradiation for 3 min. After the irradiation for 30 min, after the irradiation for 30 min, the temperature around seeds increases by about 10 °C.
The seeds irradiated with the low-pressure oxygen plasma are packed with a plastic bag to block the VUV-UV light and high-energy ions that stimulate the seeds. The plastic bag has a non-woven fabric on one side, and on this side, high energy ions that cause etching of organic substances collide with the non-woven fabric fibers and cannot permeate, and therefore only low energy neutral active oxygen permeates inside of the plastic bag. Moreover, the VUV-UV light emission from the oxygen plasma can be blocked by the non-woven fabric. The other side is a plastic film, and by facing this side with the oxygen plasma, permeation of both VUV-UV light and high energy ions into the plastic bag can be blocked. When the seeds are irradiated with particles from the cylindrical DBD, UV light containing a wavelength near 260 nm from the discharge region may be irradiated, so a ceramic filter is installed near the open edge inside the ceramic tube of the discharge electrode system so that UV light in the discharge region is not emitted to the outside. Therefore, it is considered that Arabidopsis thaliana seeds are irradiated with only neutral active oxygen species in both cases of the low-pressure plasma source and the atmospheric-pressure plasma sources.
The dielectric barrier discharge (DBD) device in cylindrical geometry is used for the plasma irradiation to leaf under atmospheric pressure [
17,
18,
19,
20].
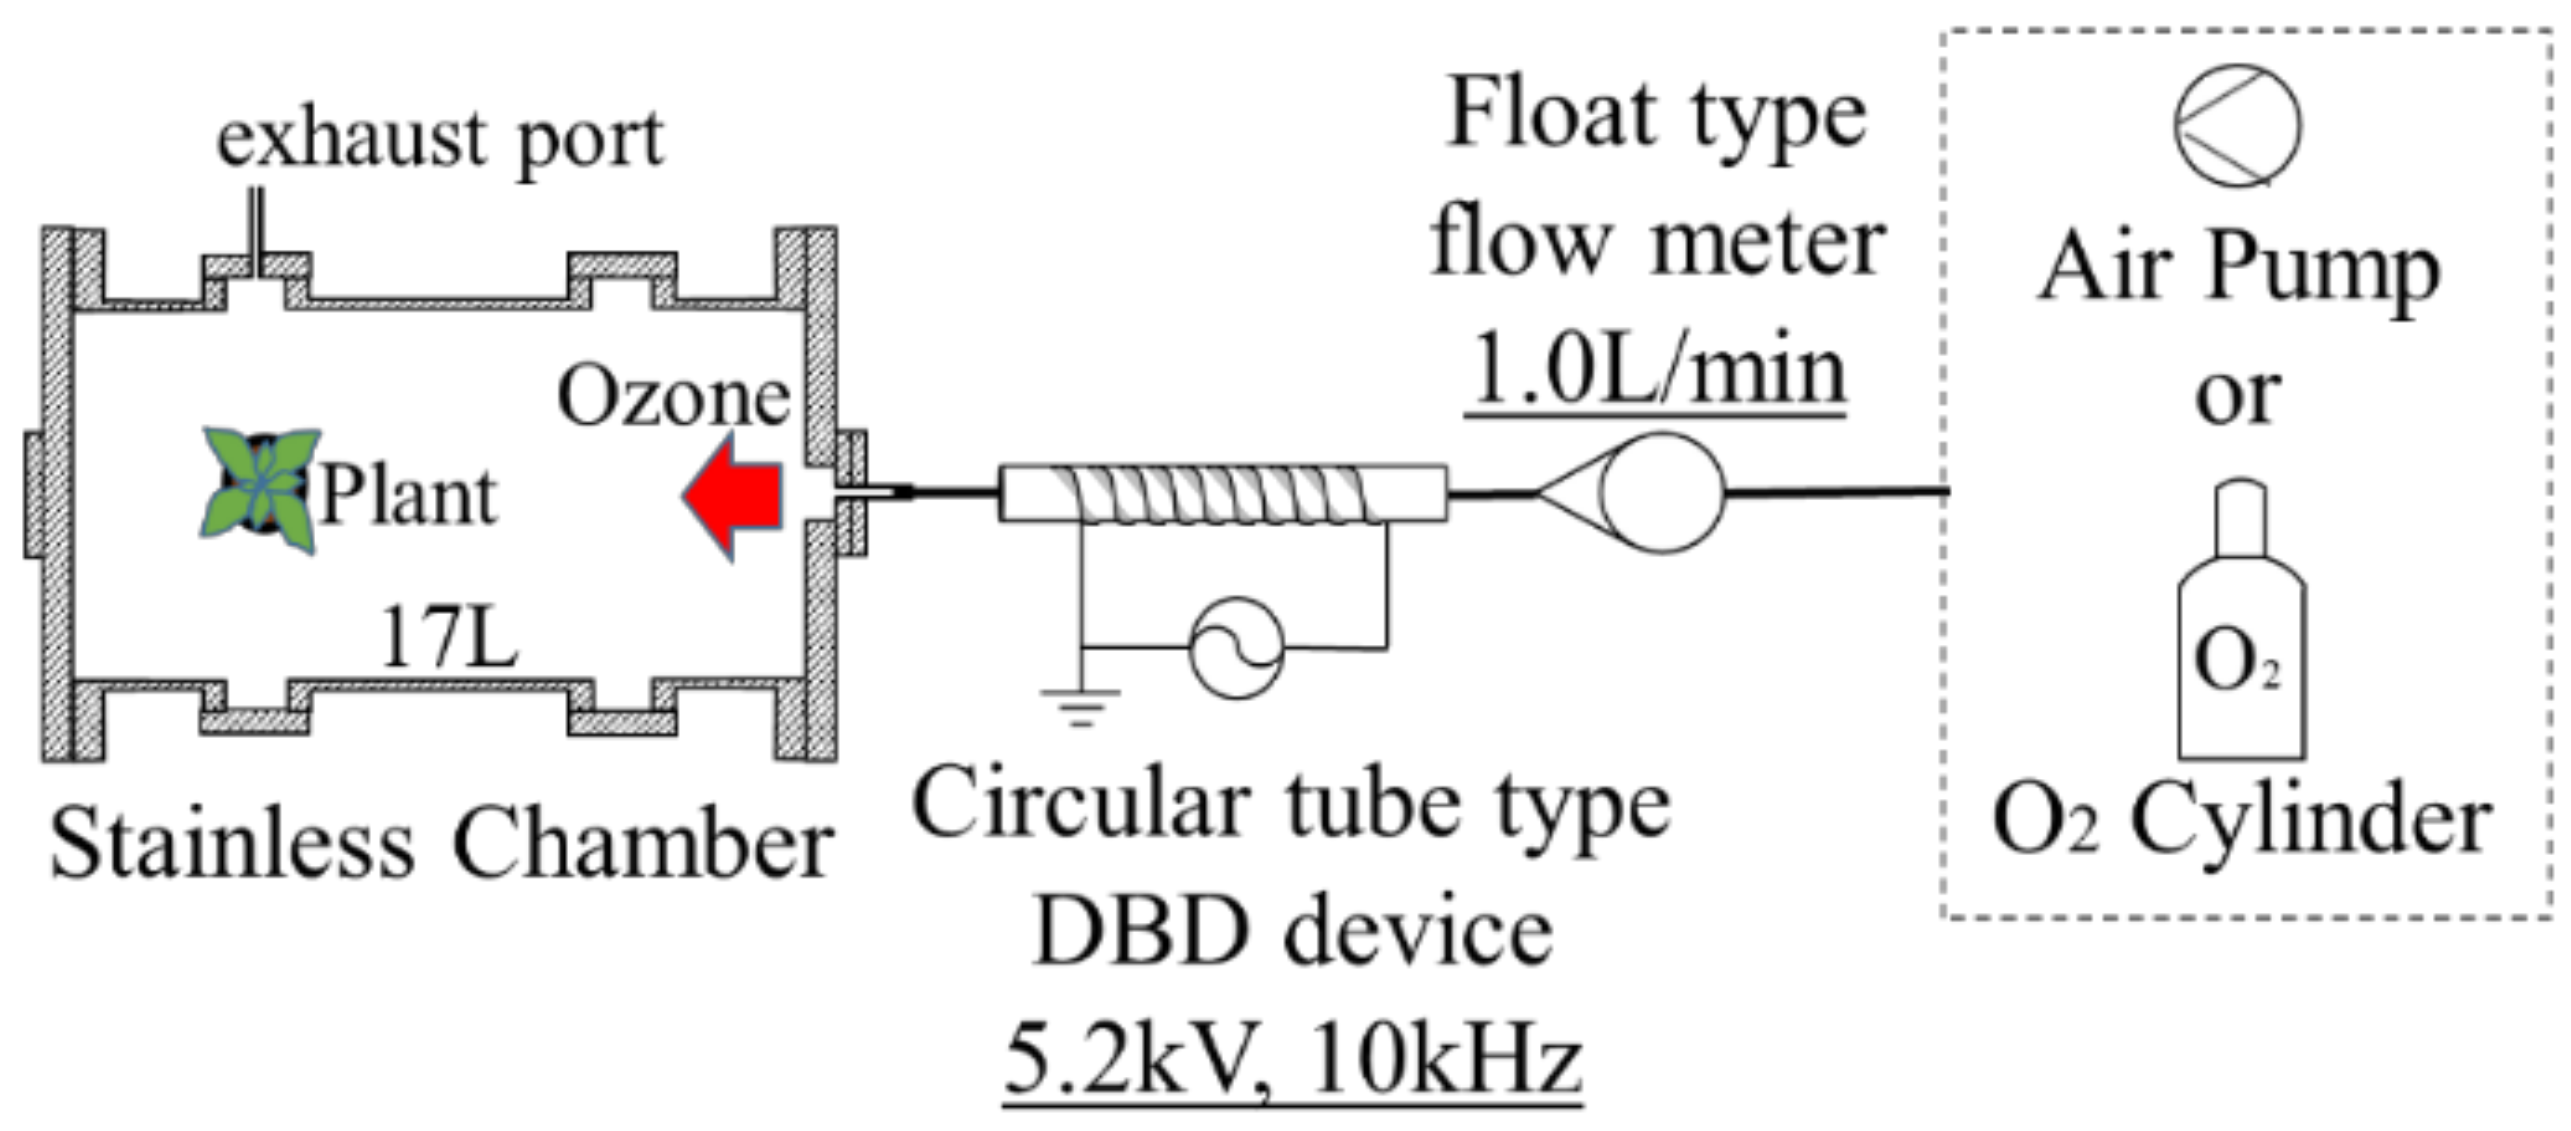
Figure 2 illustrates the schematic diagram of a plasma treatment device using the cylindrical-type surface DBD device. A ceramics tube with dimensions of 6 mm in outer diameter, 4 mm in inner diameter, and 100 mm in length is used as a ceramics tube employed as the dielectric for the DBD, and the copper film wounds on the outer surface of the ceramics tube as the grounded electrode. Cylindrical-shaped stainless-steel mesh as the cathode is set inside the ceramics tube touching on the inner wall of the tube. When the high-frequency electrical power of 10 kHz is applied to the mesh electrode, the DBD occurs in the tube. Discharge voltage and current are measured using the high voltage probe and the Rogowski coil with an oscilloscope, respectively. The voltage and frequency applied on the cathode are set at 5.2 kV and 10 kHz, respectively. The electrical power supplied to the discharge is approximately 12 W. Oxygen gas or air flows into the ceramics tube with a flow rate of 1.0 L/min. DBD in the oxygen gas or the air at atmospheric pressure generates plasma, including ozone. Then the ozone generated in the discharge region inside the tube is transported from the discharge region to the treatment chamber, as shown in
Figure 2, which is also used for the low-pressure plasma irradiation. In the chamber, the plant is placed and is exposed to the ozone.
Ozone has a sufficiently long lifetime to reach plants from the discharge region. In this experiment, the ozone CT value is used as the indicator of oxygen plasma effect on plants. The product of the ozone concentration C and the contact time T with ozone is defined as the ozone CT value [ppm·min] [
21,
22]. The concentration of ozone inside the chamber is measured by a gas detection tube using indigo dye. The ozone CT value was calculated in consideration of the fact that the ozone concentration in the chamber changes gradually with time until it is saturated, and in each case, the plasma irradiation parameters for the plants were determined so that the ozone CT value was constant. The production amount of active oxygen that is almost proportional to the CT value is measured using a chemical indicator (CI) in both cases of the low pressure and atmospheric pressure plasmas [
23,
24]. When active oxygen species irradiate the CI that is phthalocyanine dye pasted on a thin strip, the color of the CI changes due to oxidation of phthalocyanine. The CI used in this experiment consists of several layers of pigment thin films. The colors of the top, second, and bottle layers are purple, green, and pink, respectively. The top layer is decomposed and decolorized by neutral active oxygen and oxygen ions, the second layer is decomposed and decolorized by oxygen ions, and the bottom layer is resistant to both neutral active oxygen and oxygen ions. Since the intensity of green changes according to the exposure amount of neutral oxygen active species, the total amount of active oxygen can be quantified by measuring this change with a spectrometer. If ions are exposed, spectral peaks indicating blue and red that correspond to the pink color can be observed. Oxygen discharge produces several active oxygen species with different excited states, but CI does not have their selectivity.
The input power for each low-pressure and atmospheric pressure discharge is determined so that the amount of active oxygen species produced by the two discharges are approximately the same under the conditions where plant growth is enhanced. At this time, the amount of active oxygen species is monitored with the CI for active oxygen detection.
Seeds of Arabidopsis thaliana wild type, Columbia-0 are supplied as the sample plant from the Institute of Physical and Chemical Research, RIKEN. Arabidopsis thaliana has been grown according to the table in the guidelines for plant growth of the RIKEN bioresource research center. For the growth of plants, an artificial climate chamber is used to grow plants. The plants are irradiated with the fluorescent light of approximately 7800 Lux that is measured on the surface of the leaves using the illuminance meter. All the plants used in this experiment were grown together in a large-size plant incubator, so the conditions and environment are the same for all plants. Arabidopsis thaliana cultivated for one month after sown seeds were placed in the stainless-steel container together with the pot and soil. After that, the plasma produced by dielectric barrier discharge was introduced into the chamber. In the case of the oxygen plasma, the plant was irradiated with the plasma for 10 sec and 3 times within 24 h to avoid serious ozone damage on the plant. Moreover, plasma irradiates seeds for 20 sec in the case of the air plasma. In both cases, the CT value of ozone is adjusted the same, 1 ppm·min. In this experiment, 150 ozone-irradiated seeds and 150 untreated seeds were germinated. From those sprouts irradiated with ozone, 10 plants of Arabidopsis thaliana (50 plants under 5 conditions) were selected for each condition, 5 plants were used for growth observation, and 5 plants were used for gene expression analysis. After that, when the leaf size grows to about 1 cm, select the 7th leaf from the one with the largest leaf area in each strain, that is, measure the area of a total of 5 leaves from 5 plants, and simply average was obtained. The standard error and error bar are calculated. Similarly, in the gene expression analysis described below, the 7th leaf was collected from the one with the largest leaf area, and RNA was collected in the daytime.
The leaf area was used as an index for the growth of the plant. The area was measured from the captured images of leaves using the image processing software (Image J). The total area of 5 leaves were measured in descending order of area and evaluated using the average value. To clarify the biological reactions such as growth enhancement and antioxidative ability that are induced by plasma irradiation, variation of gene expression of plants after the plasma irradiation are investigated. Gene function annotation bioinformatics microarray analysis was performed as one of the gene expression analysis methods. Gene expression can be comprehensively analyzed by extracting RNA from
Arabidopsis thaliana seeds and leaves. The samples were homogenized with Fruit-mate (TAKARA). The total RNA was isolated from the cerebellum of each individual animal using TRIzol Reagent (nitrogen) and purified using SV Total RNA Isolation System (Promega) according to the manufacturer’s instructions. RNA samples were quantified by an ND-1000 spectrophotometer (NanoDrop Technologies, Wilmington, DE, USA), and the quality was confirmed with a 2200 TapeStation (Agilent Technologies, Santa Clara, CA, USA). The cRNA was amplified, labeled using Low Input Quick Amp Labeling Kit (Agilent Technologies, Santa Clara, CA, USA) and hybridized to a 44 K Agilent 60-mer oligomicroarray, Arabidopsis Oligo DNA Microarray v.4 (Agilent Technologies, Santa Clara, CA, USA) according to the manufacturer’s instructions. All hybridized microarray slides were scanned by an Agilent scanner. Relative hybridization intensities and background hybridization values were calculated using Agilent Feature Extraction Software (9.5.1.1). Raw signal intensities and Flags for each probe were calculated from hybridization intensities (gProcessedSignal), and spot information (gIsSaturated, etc.), according to the procedures recommended by Agilent (Flag criteria on GeneSpring Software. Absent (A): “Feature is not positive and significant” and “Feature is not above background”. Marginal (M): “Feature is not Uniform”, “Feature is Saturated”, and “Feature is a population outlier”. Present (P): others.). In addition, the raw signal intensities of two samples were log2-transformed and normalized by quantile algorithm with ‘preprocessCore’ library package [
25] on Bioconductor software [
26]. We selected probes that call ‘P’ flag at least one sample. To identify up or down-regulated genes, we calculated Z-scores [
27] and ratios (non-log scaled fold-change) from the normalized signal intensities of each probe for comparison between control and experiment sample. Then we established criteria for regulated genes: (up-regulated genes) Z-score ≥ 2.0; (down-regulated genes) Z-score ≤ −2.0. To determine significantly over-represented gene ontology (GO) categories and significant enrichment of KEGG pathways, we carried out the enrichment analysis of the regulated genes by the Database for Annotation, Visualization, and Integrated Discovery (DAVID) (
http://david.abcc.ncifcrf.gov/home.jsp, accessed on 1 December 2021) [
28,
29]. In this analysis, the significance level is set as
p < 0.05. The protein produced can be identified from the obtained gene expression profile, and the biological reaction caused by plasma irradiation can be estimated.
3. Experimental Results and Discussion
3.1. Production of Active Oxygen Species
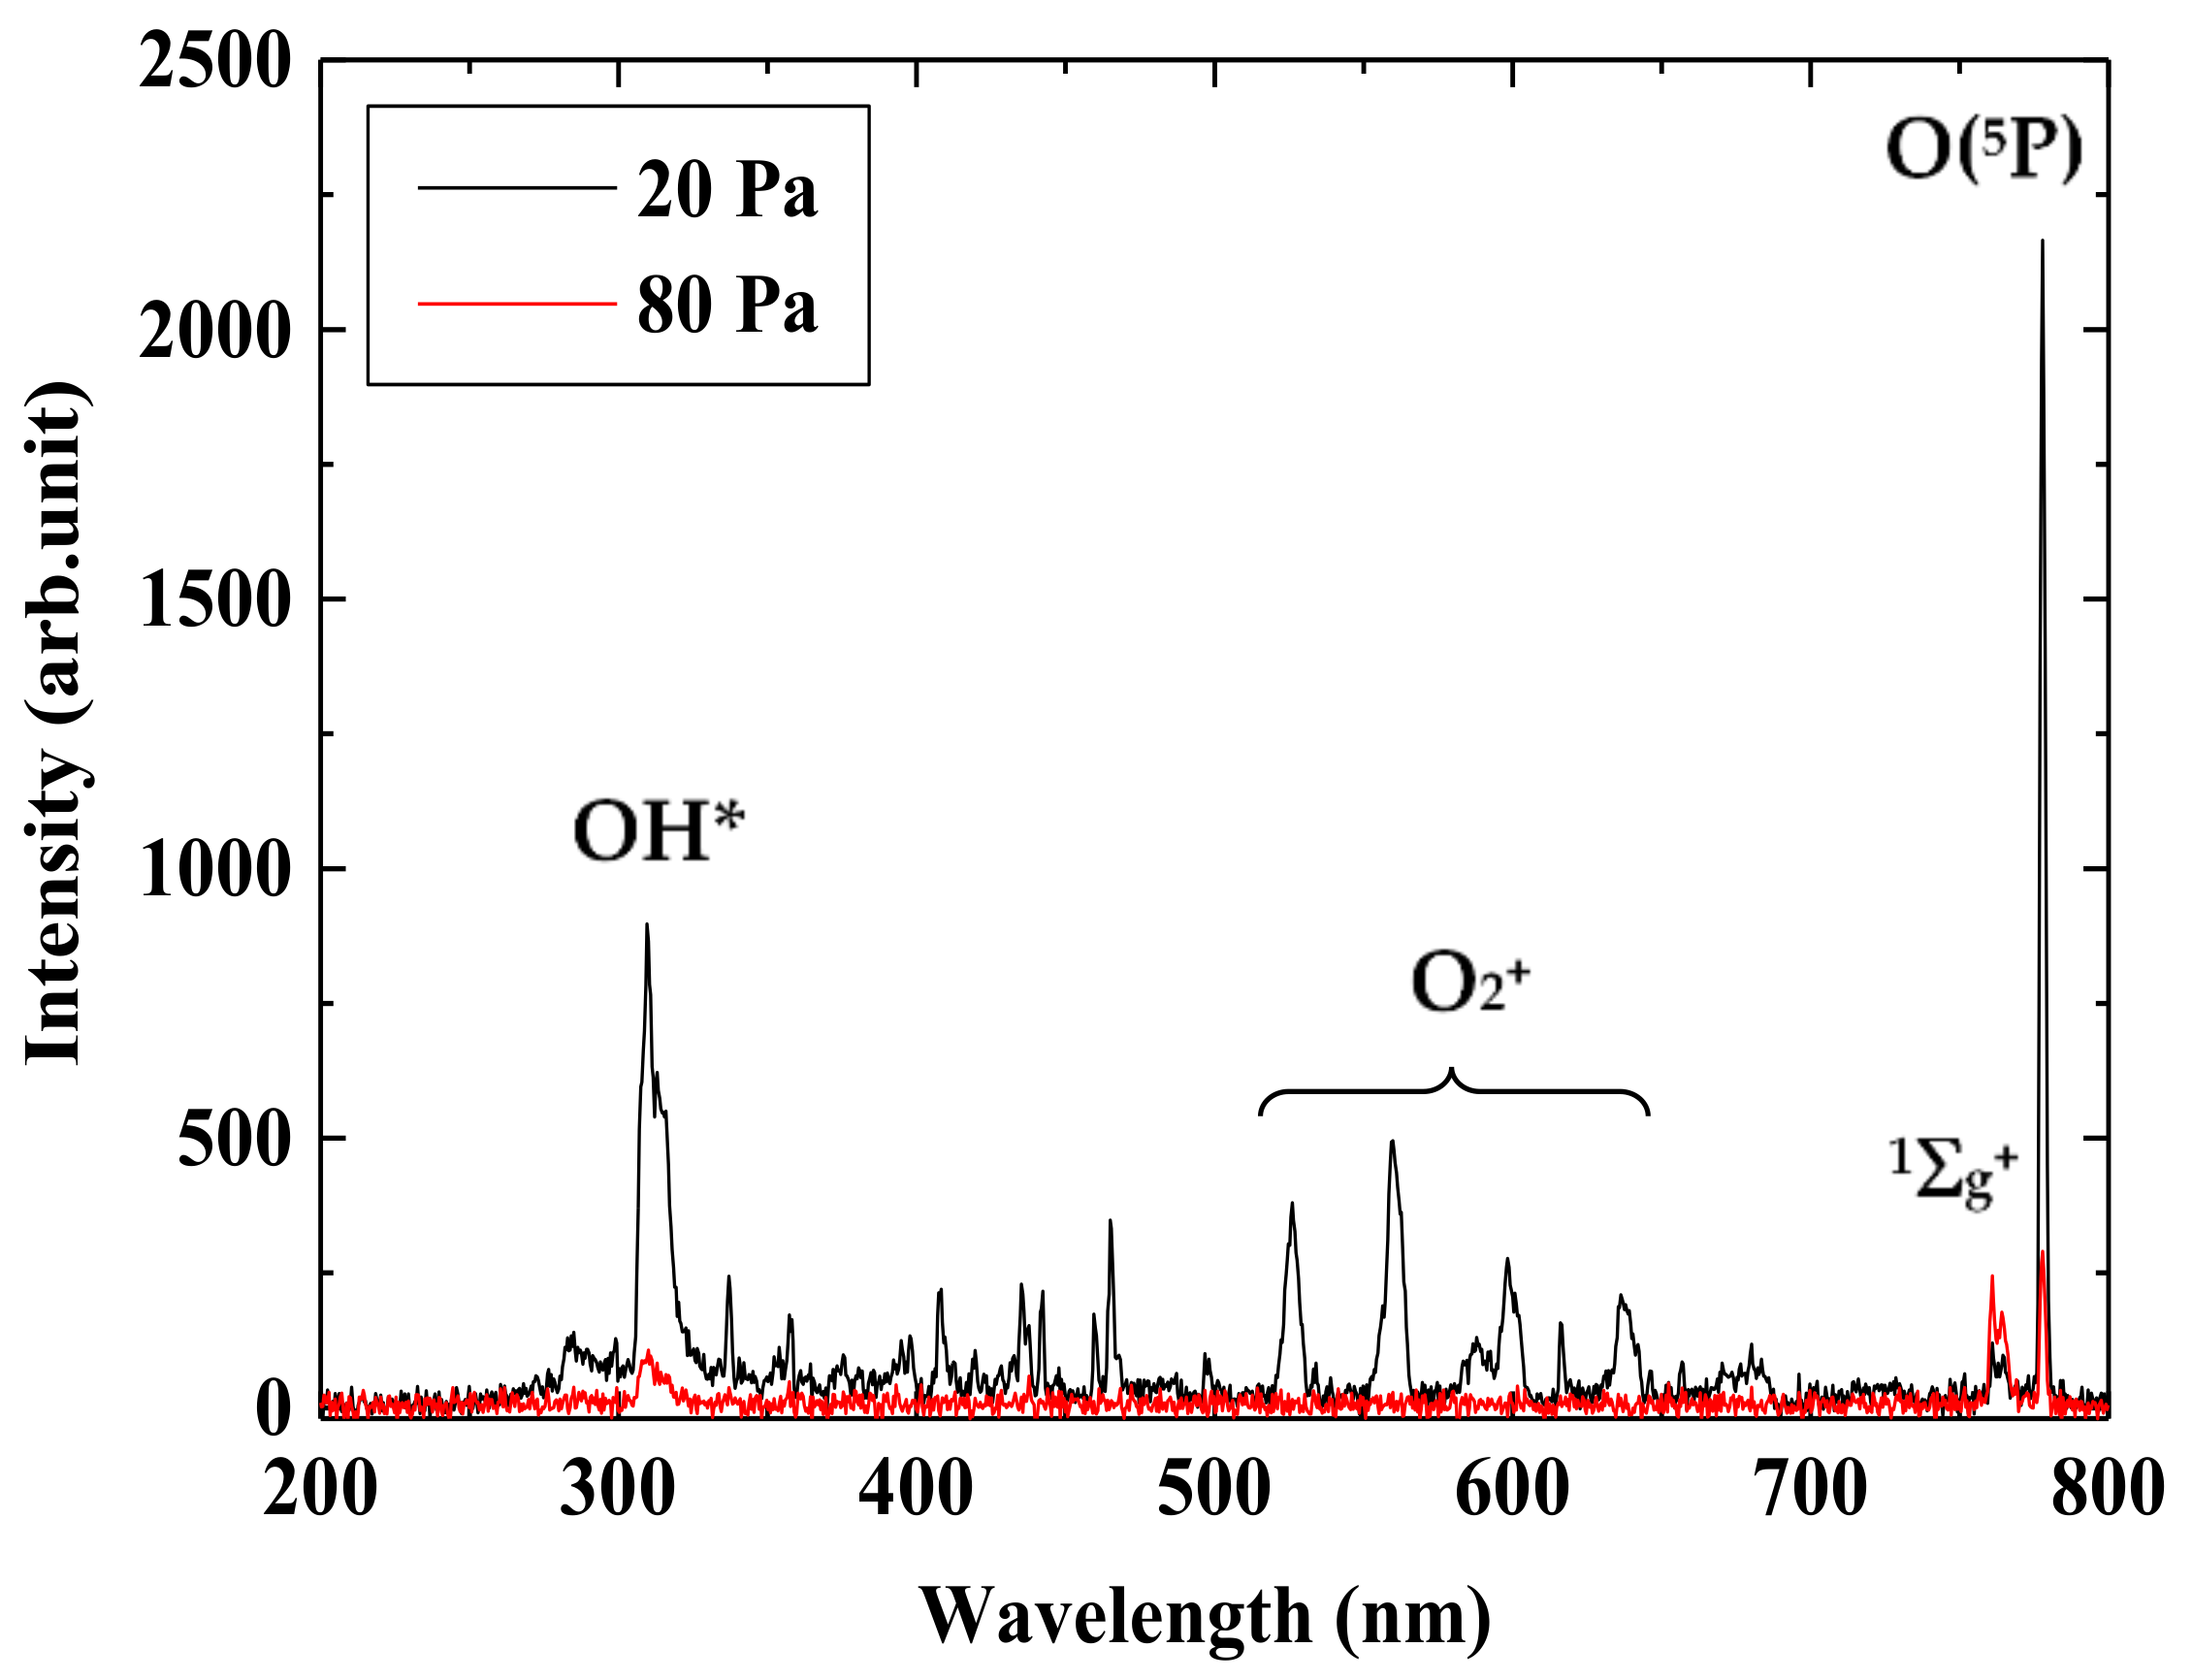
Figure 3 shows typical light emission spectra in the diffused region of low-pressure oxygen plasma with the pressure of 20 and 80 Pa. Exposure time of the spectrometer is 100 ms, and spectra are accumulated 30 times. The slit width of the spectrometer is 25 µm. At the center of the vacuum chamber, where is 110 mm apart from the wounded line type RF antenna set along the inner wall of the vacuum chamber, the light fiber connected to the spectrometer is placed in the axial direction. Significant peaks are observed at 309, 762, and 777 nm in both pressure case, even though the intensity at the pressure of 80 Pa is lower than that of 20 Pa. These peaks correspond to active oxygen species of OH radical, singlet oxygen molecule O
2 (
1Σ
g+), and atomic oxygen O(
5P) [
12,
14,
30,
31], respectively. Moreover, peaks at 527, 559, and 636 nm observed at 20 Pa are attributed to oxygen molecule ions O
2+ that require relatively higher electron energy for generation. These peaks cannot be observed at a higher pressure of 80 Pa, where the electron temperature decreases.
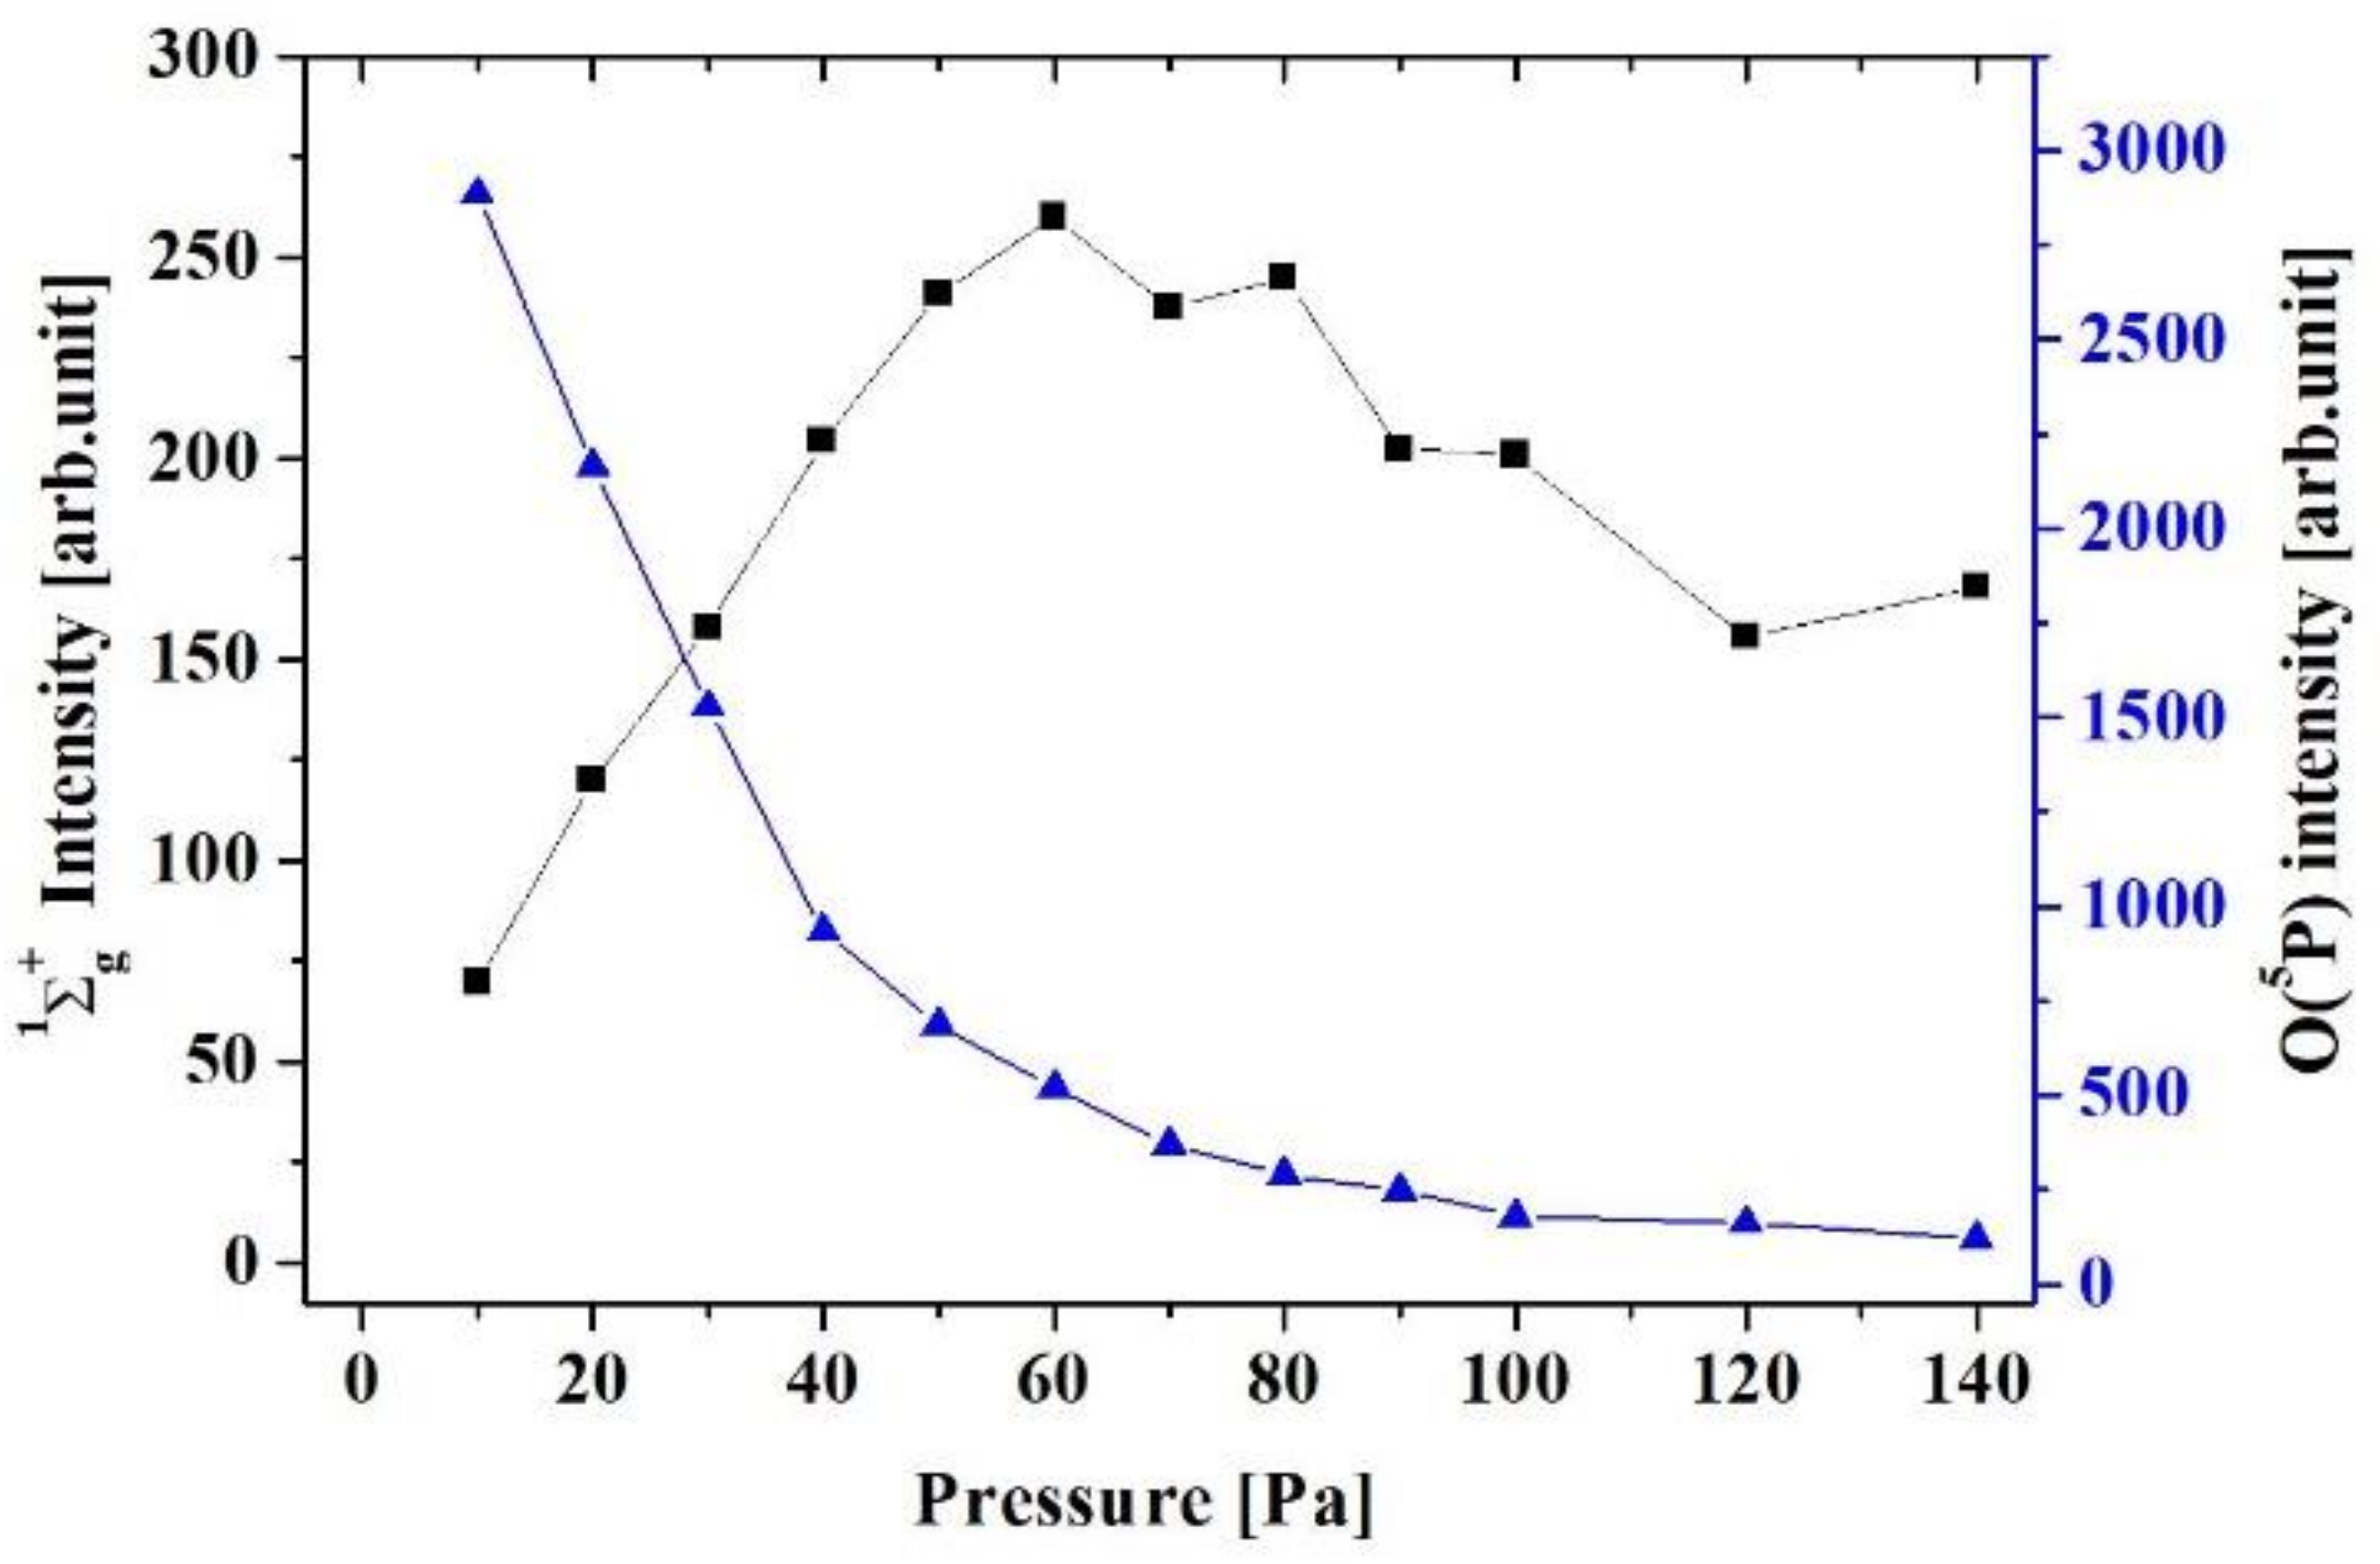
Figure 4 shows the pressure dependence of light emission intensity from atomic oxygen O(
5P) and singlet oxygen molecule O
2 (
1Σ
g+). The light emission intensity of O(
5P) decreases with oxygen gas pressure, which is due to the decrease of mean electron energy from the discharge by the increase of electron—neutral collisions. The excitation energy of O(
5P) from the ground state is around 10.7 eV. The number of energetic electrons decreases with the pressure, and then the amount of atomic oxygen monotonically decreases. Pressure dependences of OH radical, O(
3P), O(
1S) and O(
1D) are almost similar with O(
5P). On the other hand, the light emission intensity of singlet oxygen molecule O
2 (
1Σ
g+ →
3Σ
g−) increases with pressure until 60 Pa and then decreases above 60 Pa. The excitation energy of O
2 (
1Σ
g+) is relatively lower, 1.63 eV. When the pressure is in the range of 10 to 60 Pa, production of atomic oxygen decreases and production of O
2 (
1Σ
g+) increases. Above 60 Pa, electrons lose energy due to an increase in collisions, and the proportion of electrons that do not exceed the oxygen excitation energy increases, and then the production of O
2 (
1Σ
g+) decreases.
Atmospheric pressure plasma was generated from air or oxygen gas using dielectric barrier discharge and was introduced into the stainless-steel chamber to control precisely the ozone CT value. The oxygen discharge produces the ozone in afterglow region of the atmospheric discharge. The ozone with a long lifetime is transported to seed or leaf. The ozone reached the seed or leaf decomposes immediately to oxygen molecule of triplet state and singlet atomic oxygen O(
1D) according to the reaction Equation (1) [
32,
33], by the catalytic action of metals in coenzyme of leaf cells:
As atomic oxygen is difficult to be measured in general, the concentration or CT value of ozone is used as the index of atomic oxygen O(
1D). The concentration and irradiation time of ozone are adjusted so that the CT value is 1.0 ppm·min. Short-lifetime active oxygen particles such as OH radicals and atomic oxygen O(
5P) are also generated in the plasma. The OH* and O(
5P) have a short lifetime and deactivate before arriving at the plants. In the case of atmospheric pressure plasma, the transport of active oxygen species is determined by the gas flow. Active oxygen species generated in the discharge region of the cylindrical atmospheric pressure DBD source pass through a 30 cm long silicon tube connecting the plasma source and the chamber (
Figure 2) where the plant is installed and are reaching the leaves of the plant inside the chamber. As the flow rate of oxygen gas is 1.0 L/min, it is estimated that it takes about 0.1 s for active oxygen species to reach the leaves from the discharge region. Active oxygen species with high reactivity, such as OH radicals and O (
5P), lose energy by light emission, lose energy by collision, or are converted to other substances. As the lifetime of these active oxygen species under atmospheric pressure is considered to be µs to several hundred µs, the distance traveled from the discharge region is several tens or hundreds µm, and the active oxygen species cannot reach the leaves. Therefore, the active oxygen species that affect the leaves are atomic oxygen O (
1D) or O (
3P) and are transported in the form of ozone from the vicinity of the discharge region and are generated by dissociation of ozone near or on the surface of the leaves.
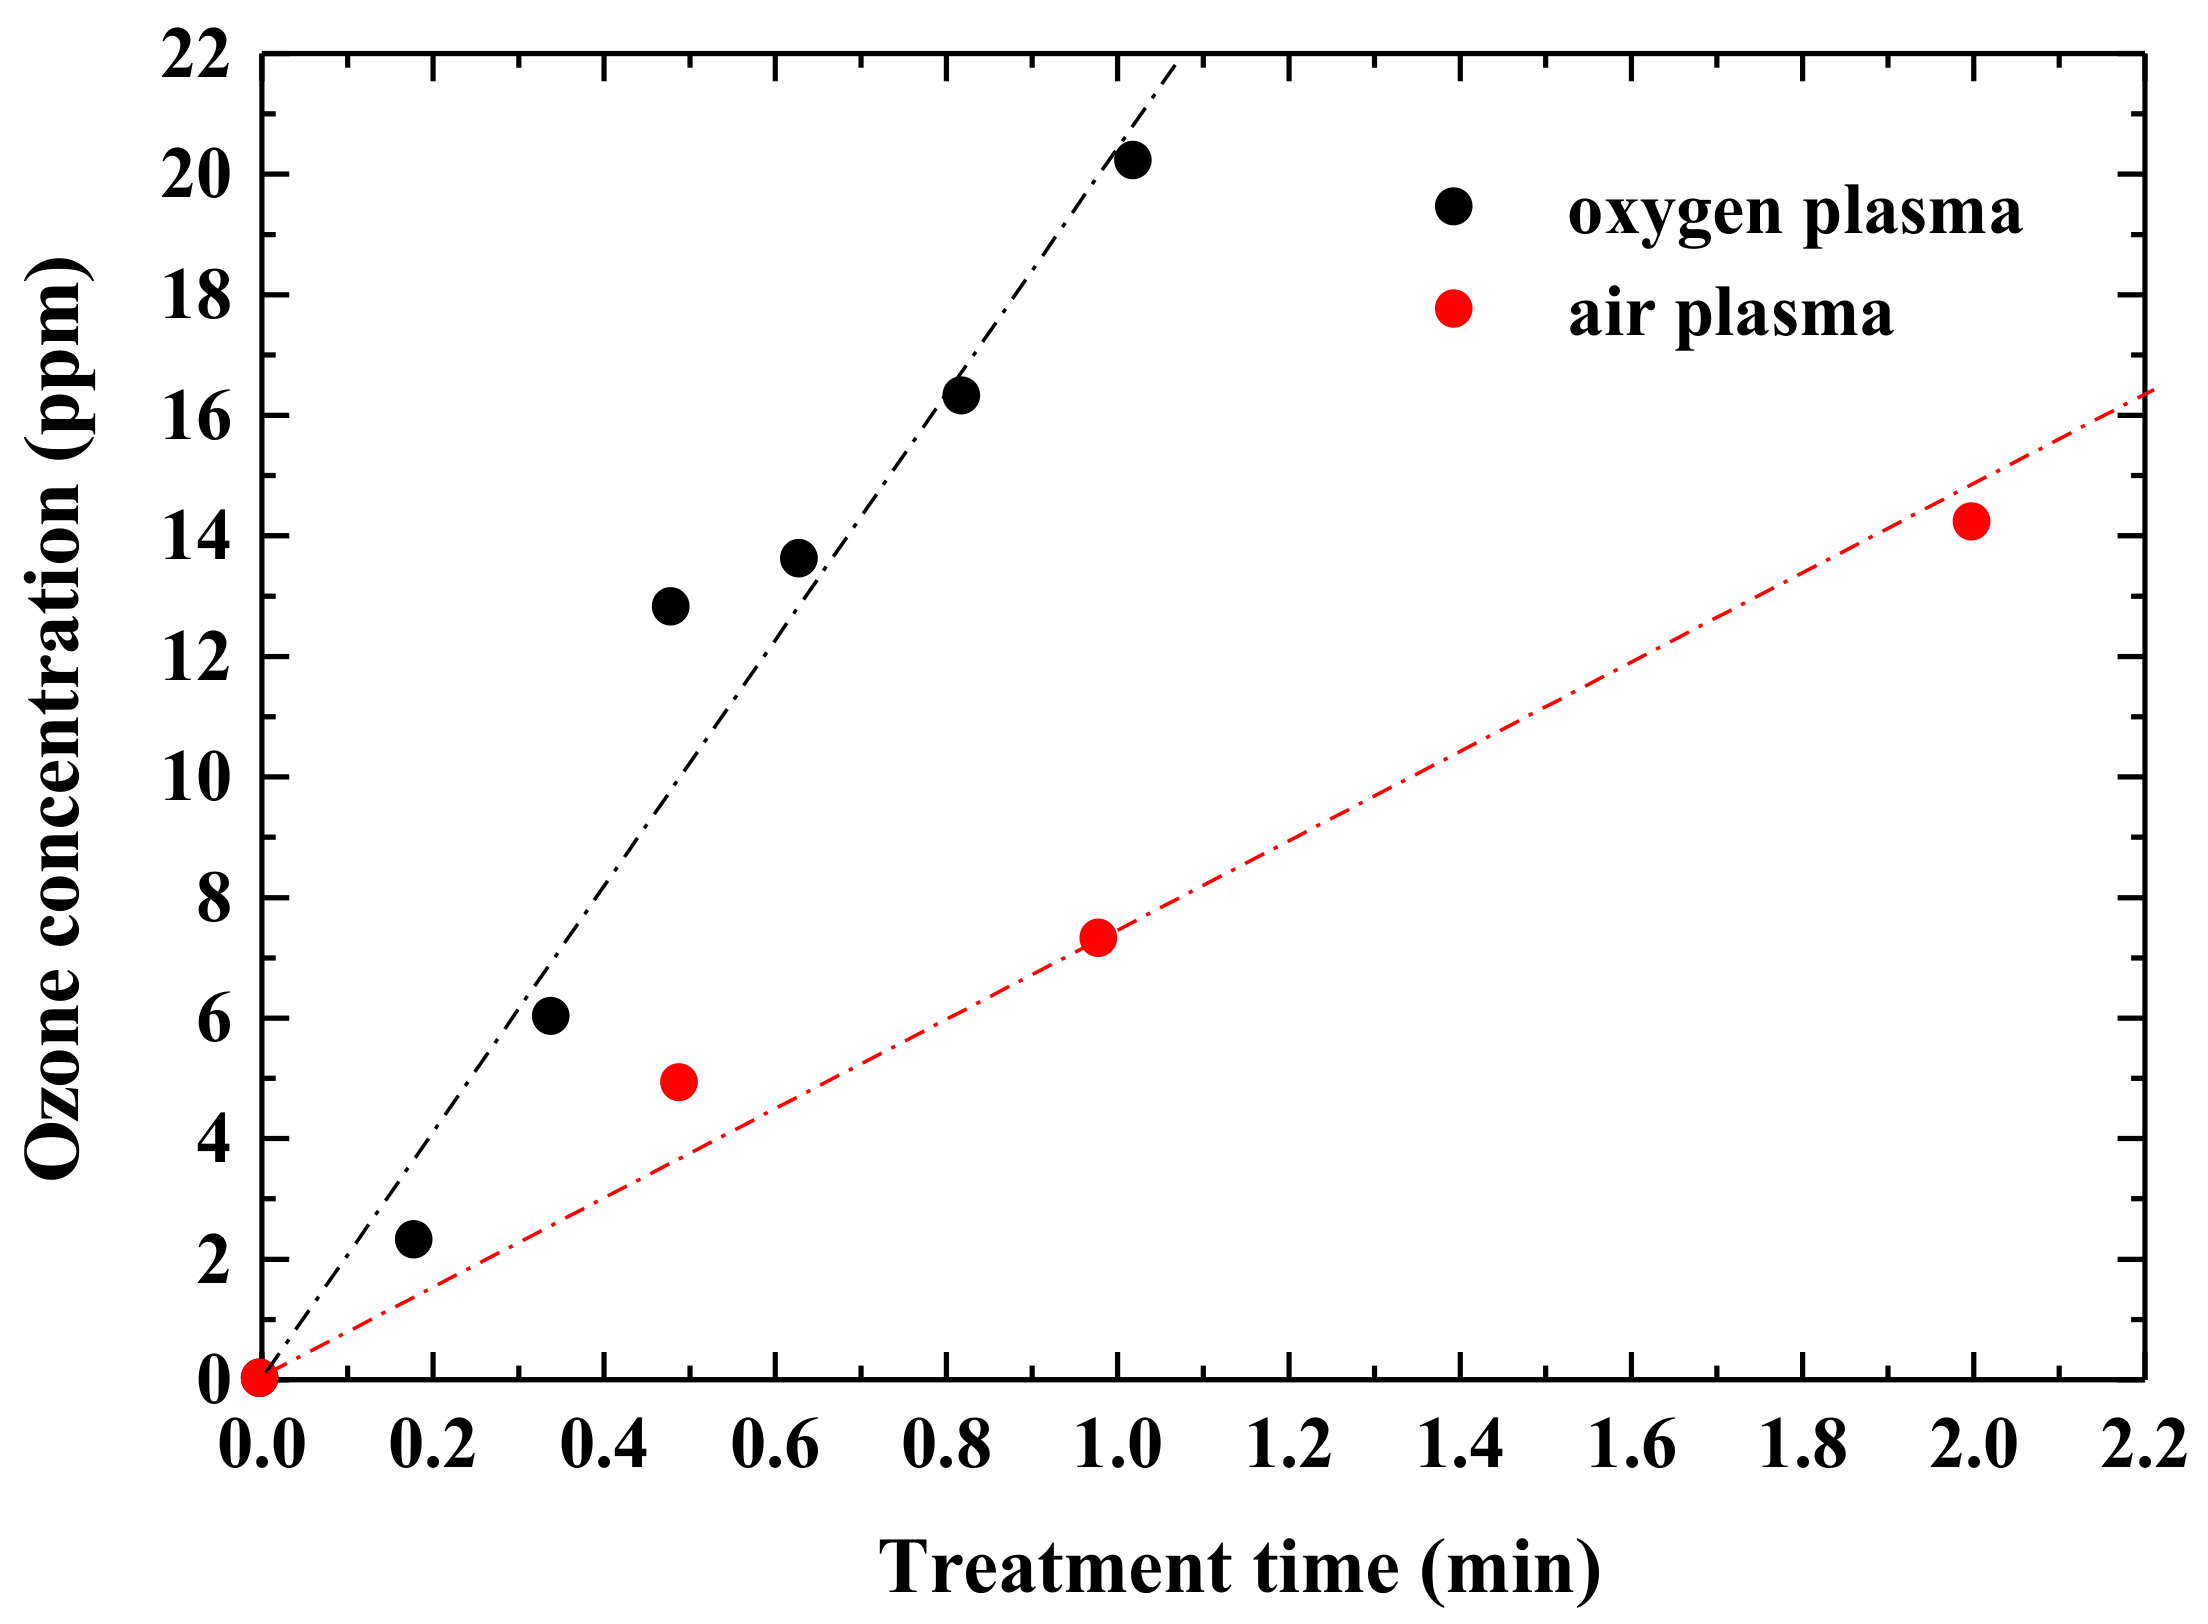
Figure 5 shows the change in ozone concentration in the chamber over plasma generation time. The ozone concentrations increase linearly with time. The oxygen gas discharge showed a high ozone concentration of about 2.8 times that of the air plasma.
The above results suggest that the major factor for the growth enhancement in both cases of irradiating seeds with low-pressure plasma and irradiating leaves with atmospheric-pressure plasma is singlet oxygen atom O(1D). In each case of the low pressure and atmospheric pressure plasmas, the amount of the active oxygen that irradiates seed and leaf is adjusted to the same using the CI due to controlling the input power for discharge and the irradiation time of the active oxygen. In this experiment, seeds are enclosed in a plastic non-woven bag and placed in a low-pressure plasma. The sterilization bag blocks both VUV-UV light and high-energy ions. In the case of cylindrical surface DBD, a ceramic filter is installed near the open edge inside the ceramic tube of the discharge electrode system so that UV light in the discharge region is not irradiated to the outside. Therefore, it is considered that Arabidopsis seeds are irradiated with only neutral active oxygen species in both low-pressure and atmospheric-pressure plasma sources.
3.2. Growth Enhancement Characteristics of Leaf by Irradiating Seed with Oxygen Plasma
Seeds of
Arabidopsis thaliana irradiated with the low-pressure oxygen plasma for 3 min were seeded and cultivated.
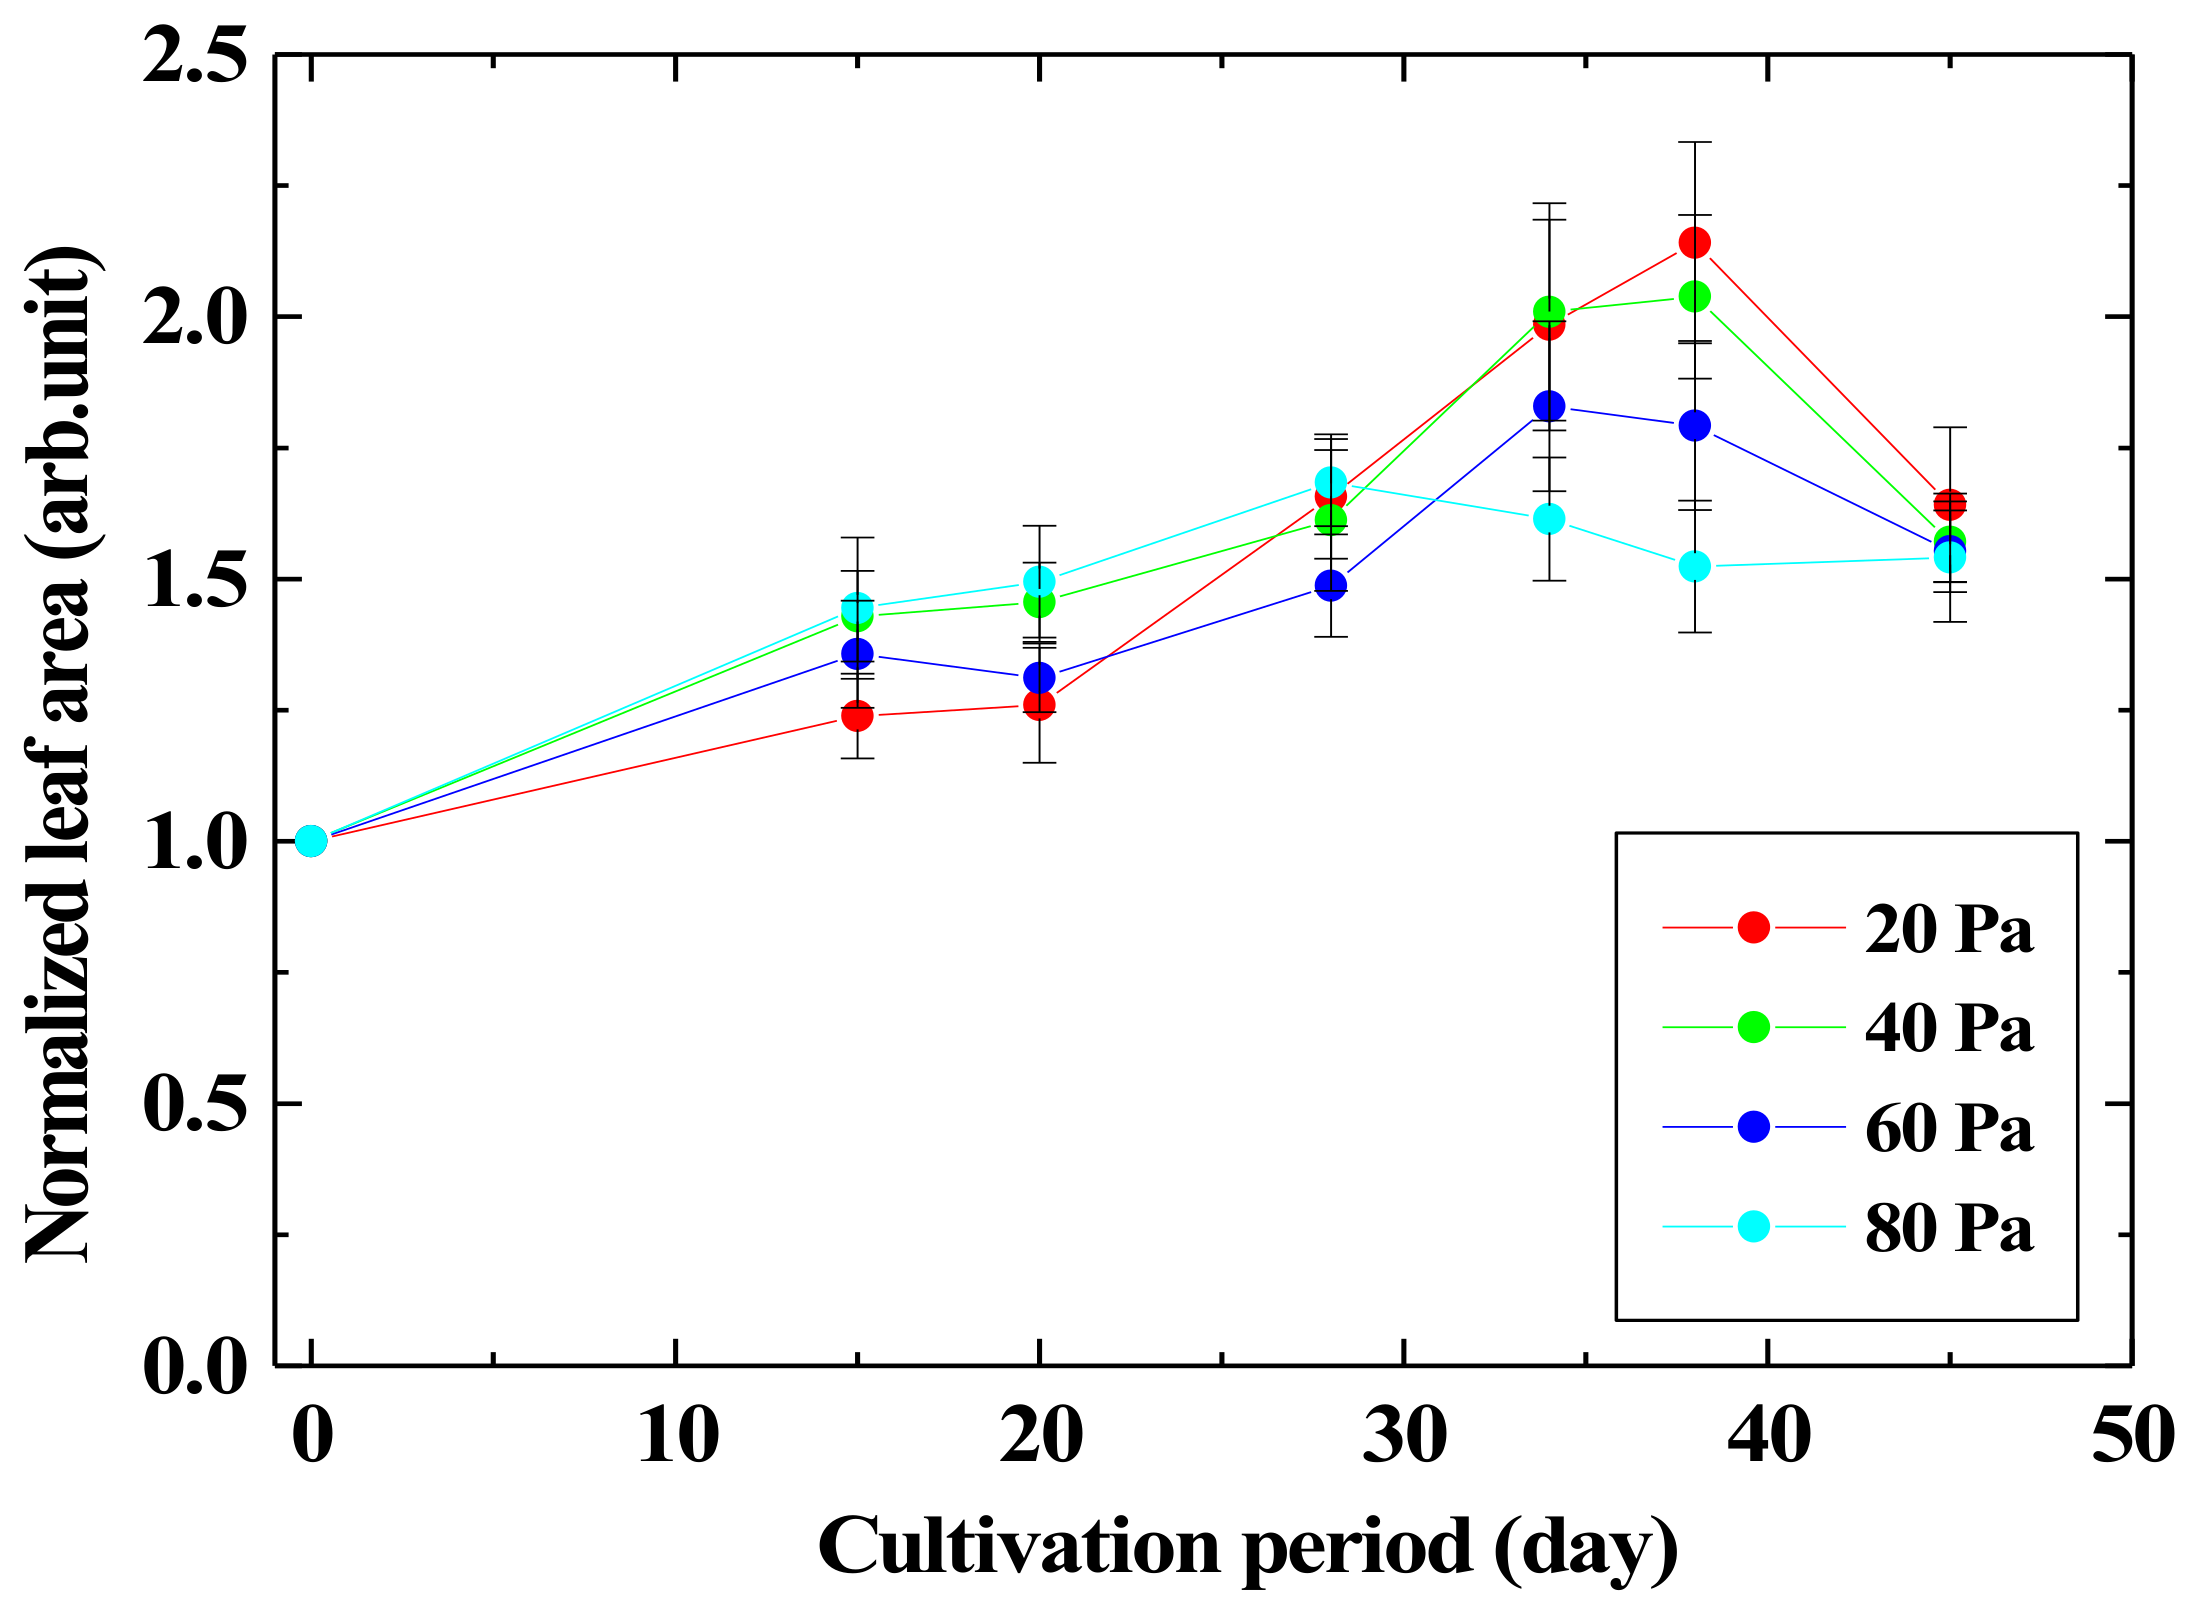
Figure 6 shows the leaf area of the
Arabidopsis thaliana when the cultivation time is changed. The leaf area was normalized by that of the unirradiated one. The leaf area became about 2.1 times after 40 days from the germination by irradiating oxygen plasma for 3 min with the oxygen pressure of 20 Pa as compared with that without plasma irradiation. As the growth enhancement effect of leaves at the oxygen gas pressure of 80 Pa is almost the same as that of 20 Pa, O(
5P) produced at any pressure would be the growth enhancement factor, and O(
3P) has a small effect on the leaf growth enhancement.
Figure 7 shows the leaf area grown from the
Arabidopsis thaliana seeds that are irradiated with oxygen plasma for 30 min. The leaf area becomes approximately 1.3 times after plasma irradiation for 30 min with the pressure of 60 Pa. The leaf area tends to be larger with 3 min irradiation than with 30 min irradiation. Moreover, there is a small growth enhancement effect at around 60 Pa. As shown in
Figure 4, the light emission intensity of the singlet oxygen molecule, O
2 (
1Σ
g+), is significant at 60 Pa. Therefore, the O
2 (
1Σ
g+) did not induce a growth enhancement effect on plants, or leaf growth was suppressed by long-term plasma irradiation for about 30 min. From the above results, regarding the growth of
Arabidopsis thaliana leaves by irradiating seeds with the low-pressure oxygen plasma, irradiation of seeds with atomic oxygen would enhance the plant growth, and irradiation with excited oxygen molecules tends to suppress the leaf growth.
3.3. Growth Enhancement Characteristics of Leaf by Irradiating Seed with Ozone
Arabidopsis thaliana leaf is irradiated with the ozone to investigate the growth enhancement of leaves. Area of leaves those are irradiated with ozone generated in the atmospheric pressure plasma is shown in
Figure 8. Under all irradiation conditions, the area reduced to about 80% of that without the plasma irradiation on the 6th day after irradiation, and therefore the growth was suppressed by the plasma irradiation. This result is known as ozone damage in plants [
34,
35] and may cause problems, especially in the plasma sterilization of agricultural products. Therefore, clarifying the details of ozone damage is indispensable for the progress of plasma sterilization technology.
3.4. Gene Expression Analysis of Leaf by Irradiating Seeds with Oxygen Plasma
To investigate the biological reactions in plants after irradiating seeds with oxygen plasma, a microarray analysis of RNA in the leaf is performed. The following is a preliminary summary: In a plant irradiated with plasma under a certain plasma condition, multiple genes are expressed, and among them, there are genes whose expression (activity) is increasing and genes whose expression is decreasing. In seeds irradiated with low-pressure oxygen plasma, the expression of almost all genes related to the promotion of growth and germination was increased, and the expression of genes related to the suppression of growth and germination was decreased. On the other hand, in the case of ozone exposure due to atmospheric discharge to the leaves, as described later, the expression of many genes such as photosynthesis and glycoprotein related to the promotion of growth and germination was reduced. The only genes whose expression was increased were heat shock protein and redox.
When the seeds are irradiated with the low-pressure oxygen plasma, the RNA is extracted from the leaves cultivated for 4 weeks after sowing the irradiated seeds, and then the gene expression variation from the control (unirradiated) are obtained. The irradiation conditions were an irradiation time of 3 min and 30 min with a gas pressure of 20 Pa where the atomic oxygen is dominant. There was no significant difference in the tendency of the gene expression variation when the irradiation time is changed, even though there is a remarkable difference in the growth enhancement effect with the irradiation time. This fact supports that the variation of gene expression is mainly caused by plasma irradiation on seeds.
The gene expression level of the leaves irradiated with plasma for 3 min was compared with that of the leaves without plasma irradiation, and the expression-variable genes were extracted. The GO terms described in
Table 1 are chosen by searching from the GO table concerning phenomena that actually occur in plants, such as plant germination and growth enhancements after irradiating seeds with oxygen plasma. The gene expression levels of (1) antioxidant activity, (2) photosynthetic electron transport chain, (3) molecular chaperone activation were significant for the irradiation for 30 min. On the other hand, the expression of genes related to (4) suppression of DNA methylation, (5) DNA replication was reduced. The following describes the detailed function of the gene whose expression variation was significantly increased by irradiation for 3 min or 30 min:
- (1)
Improvement of antioxidative activity: Increased expression of the gene group was observed.
Table 2 shows the GO terms of the increased gene expression concerning antioxidative ability by irradiating seeds with oxygen plasma, where the
p-value is the probability that the null hypothesis of a GO is adopted, and the Benjamini is the ratio of an acceptable correct null hypothesis, even if the null hypothesis is rejected. Moreover, the count is the number of genes corresponding to the GO. The GO in the table involved in enzymes with antioxidant activity such as oxidoreductase and superoxide dismutase (SOD) by irradiating oxygen plasma for 3 min. The redox enzymes, oxidoreductase, reduces the active oxygen in the plant cell. It is inferred that the increase of gene expression of the oxidoreductase enhances the sugar production by photosynthesis and the enhancement of growth by removing active oxygen in cells and blocking the inhibition of the dark reaction. Although the gene expression of the CuZn-SOD has been enhanced by the irradiation with ozone and O(
1D), the CuZn-SOD does not act as a catalyst for the removal of active oxygen. As ozone and O (
1D) are the same oxidizing substances for DNA and related molecules as O
2−, it is possible that the gene expression of the CuZn-SOD has been induced by the irradiation with ozone and O(
1D) due to oxidation of transcription factor, even though the CuZn-SOD does not act as a catalyst for the removal of active oxygen. Moreover, GO terms of iron and copper appear in this table. The corresponding functions of these terms are the production of iron and copper compounds in the plant. Since iron and copper are contained in the active center of coenzymes for Oxidoreductase and SOD and are indispensable to activate the catalytic effect of these enzymes, their expression is considered to have changed with Oxidoreductase and SOD by irradiation with active oxygen. The GO term of Removal of superoxide radicals represents the functions of the superoxide removal using methods other than SOD, such as ascorbic acid, flavonoids, and polyphenols. From the above, it was found that the improvement of antioxidant activity occurs over a long period of time by changing the gene expression by short-time oxygen plasma irradiation.
- (2)
Enhancement of photosynthesis: From the expression analysis results, it was found that the expression of genes related to the photosynthetic electron transport chain, including chlorophyll, was significantly increased by irradiation for 3 min, as shown in
Table 3. The photosynthetic reaction obtains energy from light and produces organic molecules such as ATP from carbon dioxide and water in the atmosphere. Some enzymes involved in the Calvin cycle have one or more sets of -SH groups (thiol groups) that respond to redox, and when these are oxidized, they become -S-S- bonds (disulfide bonds). Enzymes with disulfide bonds are known to have reduced activity. Antioxidants induced by short-lifetime active oxygen irradiation may reduce the enzymes involved in the Calvin cycle and enhance the carbon fixation reaction.
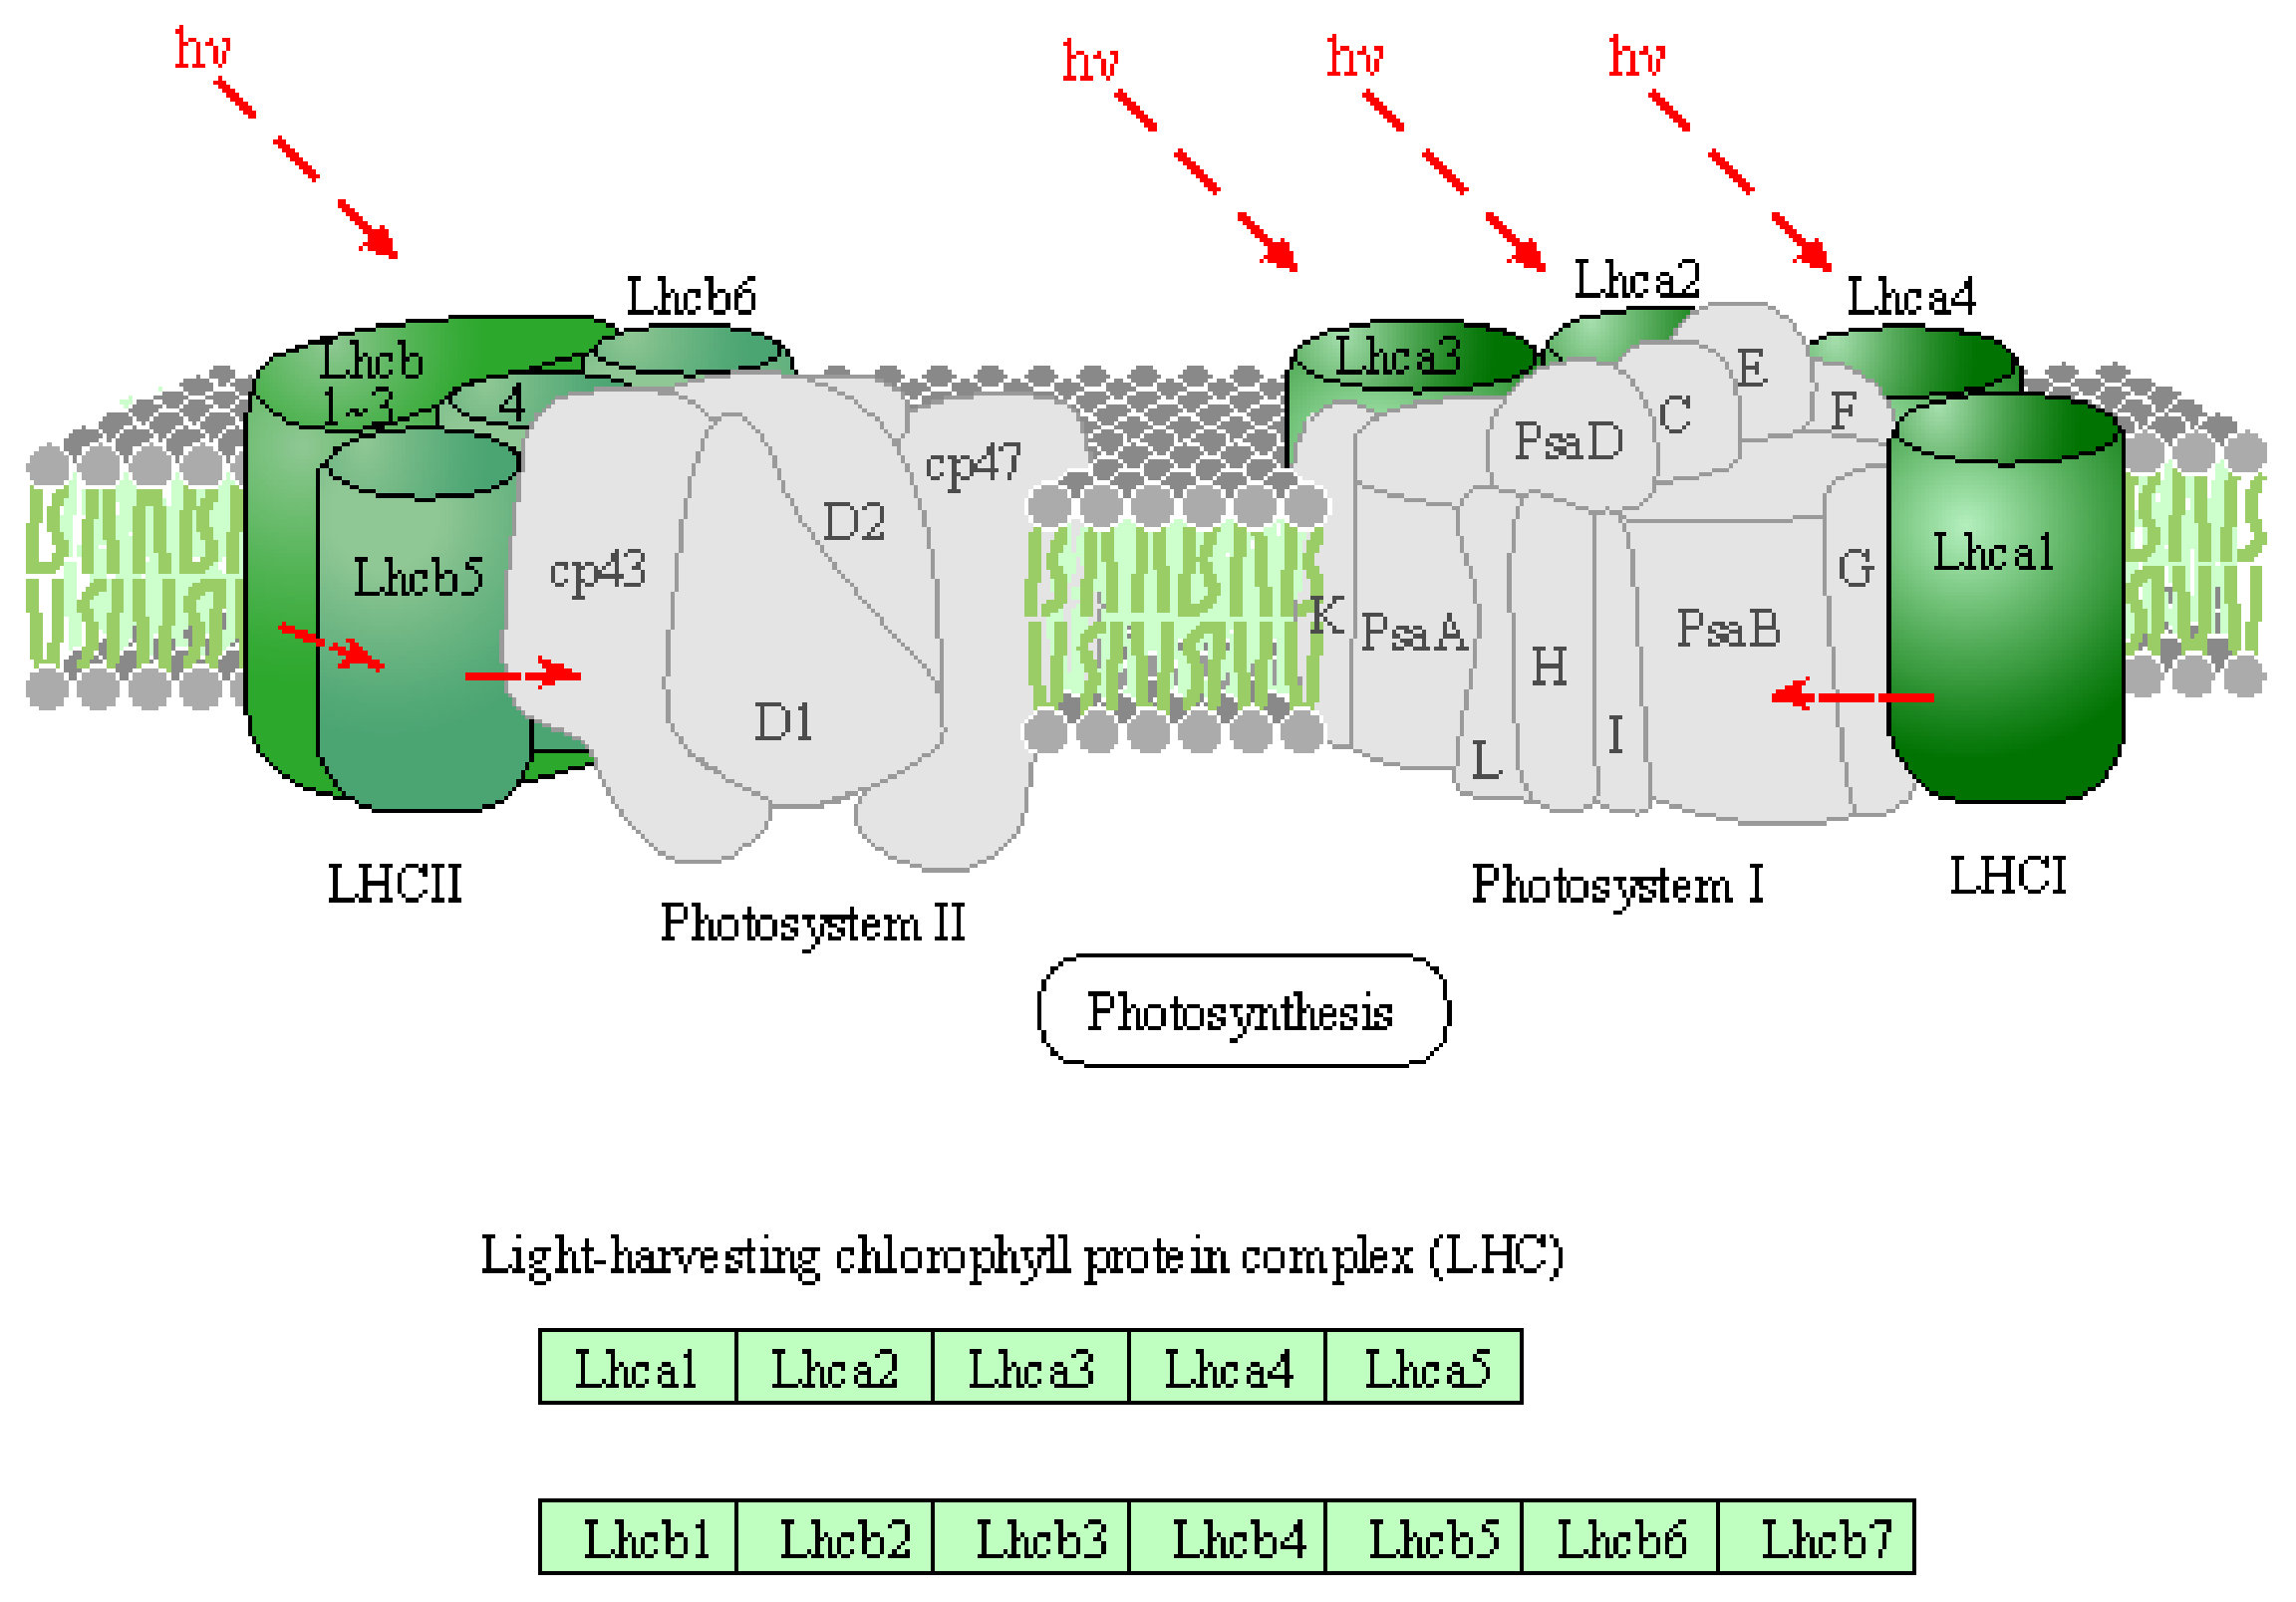
Figure 9 shows the KEGG pathway for the light-collecting chlorophyll protein complex of green plants whose gene expression was significantly increased by irradiation seeds with active oxygen species in the oxygen plasma for 3 min. Acronyms Lhca1-a5 in LHCI and Lhcb1-b6 in LHCII stand for light-harvesting chlorophyll protein complexes [
36]. Moreover, acronyms in Photosystem I and II refer to the reference pages [
37,
38]. It is considered that the plasma irradiation for a relatively short time, 3 min enhanced the function of photosynthesis by increasing the expression of some genes, and promoted the production of energy such as sugar and ATP essential for protein synthesis and then plant growth. On the other hand, when the seeds were irradiated with oxygen plasma for a long time, 30 min, there was no significant difference in the function of expressed genes, which was significantly different from that of the leaves irradiated for 3 min. There are two possibilities for the lack of growth-enhancement effect after 30-min irradiation: (i) direct non-gene-mediated damage by active oxygen species to the seeds or (ii) the Calvin cycle catalytic enzyme is inactivated by being oxidized by plasma irradiation, the Calvin cycle is suppressed and the growth of leaves is suppressed.
- (3)
Activation of molecular chaperone: Hsp90 had a high gene expression level after 30 min of irradiation. Hsp90 is a molecular chaperone that interacts with various proteins, has a function of preventing protein aggregation during stress, and at the same time plays an important role in signal transduction [
39,
40]. The increased expression of HSP suggests that plasma irradiation caused abnormalities in the protein biosynthesis system and that the growth-enhancement effect was suppressed compared to 3-min irradiation.
- (4)
Suppression of DNA methylation: Gene concerning DNA methylation and epigenetics are found to be expressed by irradiation with the oxygen plasma [
7,
8,
9]. The plasma irradiation for 3 min reduced the expression level of genes related to DNA methylation. Transcription and translation of the methylated portion of DNA are suppressed. Details of the observed epigenetic gene expression induced by the plasma irradiation are described in the previous papers [
7,
8,
9].
- (5)
Decrease of DNA replication: The rate of cell division in the leaves decreases. On the other hand, as the leaf area was expanded, it is considered that this area expansion is not due to the increase in the rate of cell division but to the cell elongation. However, no increase in gene expression related to cell elongation could be confirmed. From these facts, it is possible that the expansion of the leaf area is due to the increase in turgor pressure of the cells due to the storage of water. If the photosynthetic function is improved, it may require a large amount of H2O. In addition, the pores used for gas exchange with the atmosphere, which are essential for photosynthesis, close to suppress transpiration when the turgor pressure is low. Thus, storing water and keeping the turgor pressure high is necessary for efficient photosynthesis.
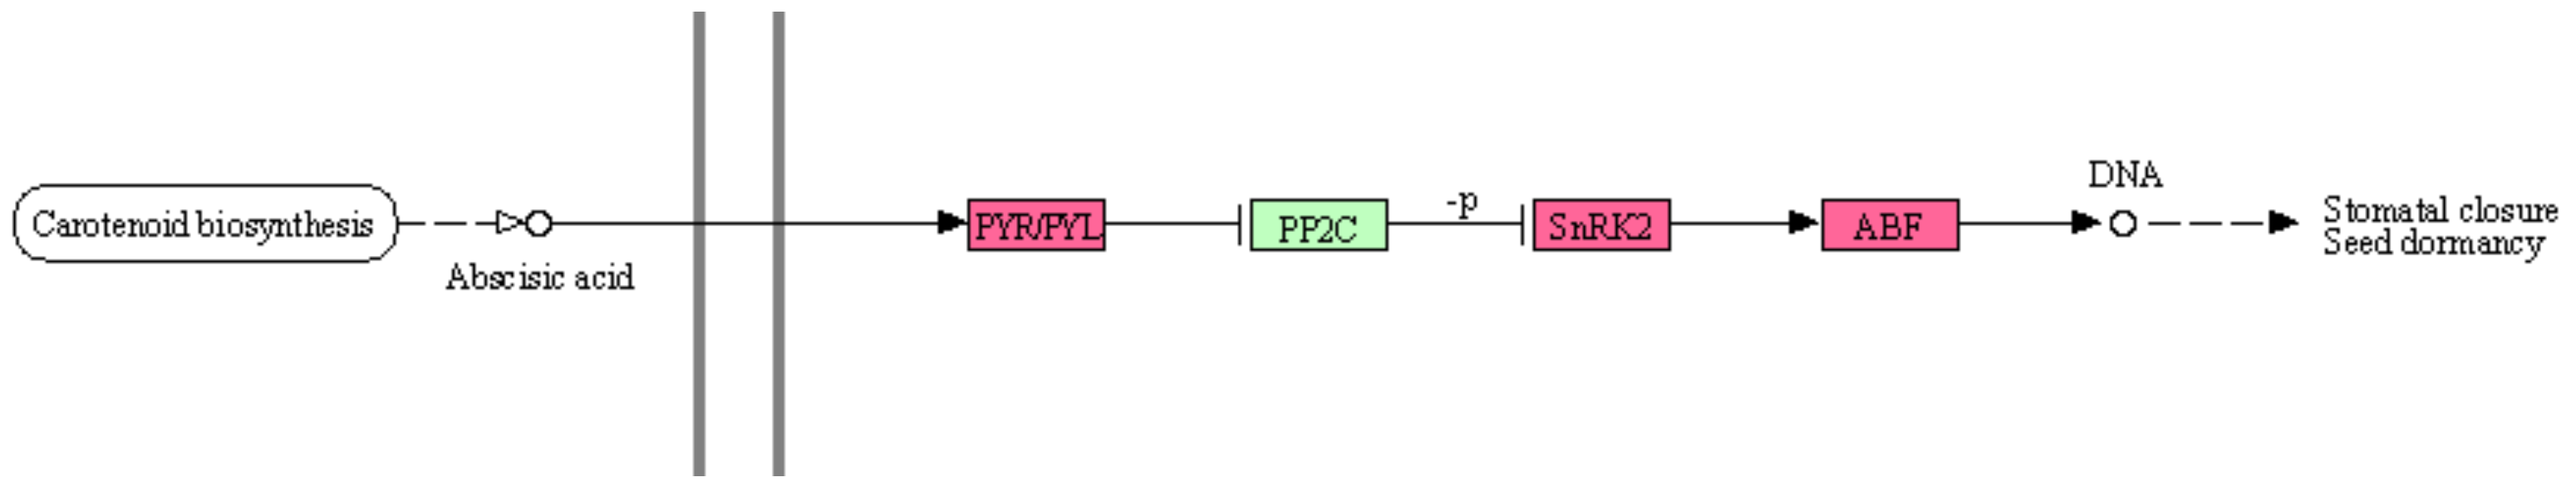
In addition, the gene expression level of the response to abscisic acid (ABA), which is one of the plant hormones, was increased in the KEGG signal pathway, as shown in
Figure 10. Acronyms of proteins in the pathway on this figure are PYR/PYL: abscisic acid receptor PYR/PYL family, PP2C: protein phosphatase 2C, SnRK2: serine/threonine-protein kinase SRK2, and ABF: ABA responsive element binding factor. Expression of the response to ABA increases in response to drought stress, and ABA contributes to the efficient use of water by closing the pores and suppressing the evaporation of water [
41]. It is speculated that the response to abscisic acid increased the area by storing the water.
In the previous study, the seeds were irradiated with oxygen plasma, and the gene expression of the seeds was analyzed. It was confirmed that genes that upwardly control each function of growth, stress response, hormone response, and photosynthesis were expressed. This leads to the enhancement of the energy production pathway [
6,
8]. Similarly, in the results of gene expression analysis of leaves in this experiment, an increase in gene expression related to stress responses such as photosynthetic function and antioxidant activity was confirmed. In addition, changes in gene expression related to epigenetics such as DNA methylation were confirmed in the same way as seeds. This result suggested that oxygen plasma irradiation of seeds affected gene expression even in the grown leaves and brought about a growth enhancement effect.
From the above results, the pathway by which plasma irradiation causes leaf growth enhancement can be inferred as follows. In the case of irradiation for 3 min, the gene expression of seeds subjected to oxidative stress due to active oxygen in plasma changed to improve antioxidant activity and suppress DNA methylation in leaves. Signals related to antioxidant activity are retained even after differentiation from seed to leaf. It is considered that the enzyme that catalyzes photosynthesis is reduced and activated by the improvement of the antioxidant activity. Moreover, the production of NADPH, which is a reducing agent, is increased, and then the photosynthetic electron transfer reaction function would be enhanced. In addition, genes concerning water storage improve photosynthetic efficiency. From the above, it is inferred that the efficiency of photosynthesis and the increase in ATP synthesis led to the enhancement of leaf growth. One of the reaction sequences from plasma irradiation seed to leaf growth enhancement is as follows:
Plasma irradiation of seeds
Seeds are subjected to oxidative stress and improved antioxidant activity
Obtained functions remains after germination (methylation: epigenetics)
Improvement of leaf antioxidant activity
Increase chlorophyll and activate photosynthetic electron transfer reaction
Increase water storage to improve photosynthetic efficiency, adjust circadian rhythm
Increase ATP synthesis
Promote growth (increase in leaf area).
According to the gene expression variation results, the plasma irradiation for 30 min is expected to have the same growth enhancement effect as the 3-min irradiation; on the other hand, the Calvin cycle is suppressed by long-term irradiation, and protein denaturation tends to occur. Therefore, the growth-promoting effect would not be obtained.
3.5. Gene Expression Analysis of Leaf Irradiated with Ozone
Genes whose expression varied were extracted in comparison with
Arabidopsis thaliana unirradiated with plasma or ozone. Among these expression-variable genes, GO terms judged to be statistically significantly changed (
p < 0.05) are shown in
Table 4. The GO terms in the table are selected by searching from the GO term of expressed genes after irradiating leaves with oxygen plasma. Increased expression of some genes involved in protein synthesis reactions was observed in the table. There was a marked increase in the expression of genes related to chaperone proteins and antioxidants. Chaperones act as catalysts in protein folding and perform endoplasmic reticulum-related degradation that removes abnormal proteins from the endoplasmic reticulum. Normally, chaperones remove abnormal proteins immediately, but when protein synthesis in the endoplasmic reticulum is active, the removal may not catch up, and abnormal proteins may accumulate. At that time, a reaction called the endoplasmic reticulum stress response [
42] that increases the production of factors such as chaperones occur.
Plasma irradiation of seeds increased the expression of some genes related to heat shock protein, which is a type of chaperone. Gene expression of heat shock proteins such as Hsp70 and Hsp90 was increased after the plasma irradiation, as shown in
Table 5. Hsp70 covers a wide range of proteins such as folding and association of nascent proteins, inhibition, and repair of aggregation of proteins partially decomposed by stress such as heat, transport of proteins to cell organs, regulation of cell division, and transcription, and the regulation of protein activity. Hsp90 is a molecular chaperone that prevents protein aggregation during stress, as described above. From the whole pathway of protein synthesis in the endoplasmic reticulum, the expression of genes involved in the mechanism for detecting abnormal proteins (Protein Recognition by luminal chaperon) and the mechanism for removing abnormal proteins (ERAD) significantly increased by the plasma irradiation. In leaf cells, while atmospheric pressure plasma irradiation produced a growth-promoting effect, the growth would be suppressed as a result of damage such as protein denaturation. It is presumed that protein synthesis in the endoplasmic reticulum became active due to the recovery of the damaged site and the increase in resistance. The molecular chaperone production improved in response to the accompanying accumulation of abnormal proteins generated by the plasma irradiation.
Table 6 shows a cluster of gene expressions related to the redox reaction in which the expression variation was increased by the plasma irradiation leaves. Thioredoxin is a protein that functions as an antioxidant that reduces disulfide bonds and promotes conversion to thiol groups [
43,
44]. As mentioned above, some enzymes involved in the carbon fixation reaction of photosynthesis, such as RubisCO, are activated by being reduced by antioxidative substances like Thioredoxin. Protein disulfide isomerase (PDI) is a protein with a Thioredoxin-like structure that catalyzes the thiol-disulfide exchange reaction of proteins and assists in the folding of proteins [
45,
46]. From the increase in the expression of these genes, it is inferred that proteins concerning the redox reactions in plants were oxidized by plasma irradiation. It is inferred that the active species in the plasma have reached the inside of the plant.
Genes with reduced gene expression are investigated.
Table 7 shows the cluster of gene expression related to photosynthesis in which gene expression was reduced. The gene expression concerning the photosynthetic electron transfer reaction function was significantly reduced in this experiment. The gene expression level of the light-harvesting chlorophyll protein complex (LHC) containing chlorophyll was decreased by plasma irradiation [
47].
Table 8 shows the gene expression cluster for glycoproteins whose gene expression was reduced. In many cases, oligosaccharides covalently bind to proteins that enter the endoplasmic reticulum cavity or endoplasmic reticulum membrane to become glycoproteins. It is suggested that the production amount of sugar produced decreased because the amount of ATP, which is the energy in the body, decreased due to the impaired photosynthetic function, and the production of glycoprotein was also suppressed accordingly. One of the reaction sequences from plasma irradiation leaf to growth enhancement of leaf is as follows:
Ozone exposure to leaves
Damage to the photosystem antenna complex due to oxidative stress
Decrease in the reaction rate of photosynthetic electron transfer reaction
Increased production of chaperone for protein repair
Decrease of ATP and sugar synthesis amount due to carbon fixation reaction
Protein decrease in biosynthesis
Promote growth (increase in leaf area)
To investigate the effect of nitrogen species on the gene expression variations of the plant, atmospheric air discharge plasma is employed to irradiate the plant leaves.
Table 9 shows GO terms that have statistically significantly changed between the expressed genes in
Arabidopsis thaliana leaves that had been exposed to the atmospheric air plasma for 30 s and the genes of the unirradiated leaves. The ozone CT Values of the atmospheric oxygen and air plasmas are the same, 1.0 ppm·min, to reveal the effect of active nitrogen species in the air plasma. There was almost no significant difference between the air and the oxygen plasmas in the function of the expressed gene that was significantly varied compared to the atmospheric oxygen plasma case. Moreover, the main reaction pathways of the plant for the air and the oxygen plasmas are almost similar. Compared with oxygen plasma, nitrogen-based active species are produced in air plasma, but the influence of oxygen-active species is large on plants.
3.6. Comparison of Leaf Gene Expression Variation Analysis before and after Germination
The gene expression analysis of the leaves that were plasma-irradiated to the seeds before germination is compared with the leaves that were plasma-irradiated to seeds after germination. Gene expression related to photosynthetic function increased when plasma irradiation was performed before germination but decreased when plasma irradiation was performed after germination. Gene expression related to stress response, such as antioxidant activity, tended to increase under both conditions. From these facts, it is speculated that it is possible to improve the resistance of leaves to oxidative stress after germination by irradiating them with ozone before germination. If it has resistance to oxidative stress due to plasma irradiation, it may apply to agricultural product sterilization with ozone.


