Abstract
Interest in phenolic compounds has recently increased due to their potential as antioxidant agents. Moringa leaves (Moringa oleifera) have a high content of phenolic compounds, which presents them as a promising source for the extraction of these compounds. However, it is necessary to use analytical techniques to identify and quantify their actual compound content to determine the quality of the raw material and the potential of the final product. Ultrasound assisted extraction is a green, rapid and environmentally friendly extraction technique that produces high quality extracts from natural products. Hence, the aim of this research is to optimize the variables of the ultrasound-assisted extraction (UAE) process for the extraction of moringa leaves using response surface methodology (RSM) to extract the main flavonoids using methanol as the extraction solvent. A Box–Behnken design (BBD) has been used to evaluate the effect of the ultrasound extraction process variables. Finally, the optimal extraction time in the range between 2 and 30 min was determined. The results revealed that the methanol concentration was the most influential variable. The optimal extraction time was established at 15 min. Six of the main flavonoids were quantified by UHPLC-DAD and identified by UHPLC-QToF-MS. The results confirmed that UAE is an efficient method for the extraction and subsequent analysis and quality control of the flavonoids that can be found in moringa leaves.
1. Introduction
The medicinal properties of different plant matrices are mainly attributed to the presence of secondary metabolites, which are used in pharmaceutical or nutraceutical products as food additives or fine chemicals [1,2]. In recent years, it has been demonstrated that there is a link between the consumption of natural antioxidants and the prevention of various diseases caused by oxidative stress, such as neurodegenerative diseases, obesity or some types of cancer [3,4,5,6].
Moringa oleifera is a tree native to the southern Himalayas in north-eastern India, Bangladesh, Afghanistan and Pakistan that is currently cultivated across large areas in the world for its unique combination of antioxidant properties and adaptability to any type of soil [7,8]. Its leaves are edible and rich in protein, with a well-balanced essential amino acid profile. At the same time, it contains high levels of vitamins A and C, as well as potent natural antioxidants. A number of studies have tested the antioxidant effect of dehydrated leaves and have demonstrated that their antioxidant power is higher than that of some green fruits or seeds [9,10]. Phenolic compounds, mainly flavonoids, which have anti-carcinogenic, hypotensive, hypoglycaemic or antibiotic properties, stand out among the antioxidants reported in moringa leaves [2,11,12]. It also contains other compounds with antioxidant capacity (chlorophyll, ascorbic acid, vitamin E) and minerals (iron, potassium and calcium among others) that are capable of preventing certain degenerative processes associated with stress [2,13]. These compounds have the ability to react with free radicals and thus prevent their harmful effects on cells [14,15].
Phenolic compounds are often found within a solid matrix, and their extraction and analysis usually require their extraction from the solid phase into a liquid phase by employing a number of different methods. The solvent used for this process must diffuse into the solid to extract the soluble compounds, which, in turn, are transferred to the liquid phase, thus allowing a separation of the original components from the solid. This process is called solid–liquid extraction or leaching [16]. To obtain the compounds present in moringa leaves, an optimal extraction method that allows to control the quality of the final extract, which must be rich in flavonoids, is to be developed. Solid–liquid extraction methods are commonly used for the extraction of bioactive compounds, and specifically for the extraction of phenolic compounds from different plant matrices [17,18]. There are reports of traditional techniques used to obtain these compounds, such as maceration, Soxhlet or agitation. However, these techniques present certain inconveniences, such as long extraction times, which implies a higher consumption of solvents, which results in higher operating costs. Because of the aforementioned, different non-conventional extraction techniques, such as ultrasound-assisted extraction, microwave-assisted extraction, pressurized liquid extraction or supercritical fluid extraction, which use fewer solvents, are faster and more environmentally friendly and efficient [19,20,21,22,23] and are becoming more frequently used. This study aims to evaluate the efficacy of ultrasound-assisted extraction (UAE) when applied to the withdrawal of the main flavonoids in moringa leaves. Ultrasound-assisted extraction is based on cavitation, a phenomenon by which cell walls are ruptured and the target compounds are released out of their natural matrices [24]. As a consequence of this cavitation phenomenon, a higher dispersion of the solid phase in the liquid is achieved and the contact interface is improved. This explains why UAE is often preferred over other traditional methods: it allows higher yields to be obtained in a shorter time using smaller amounts of solvent. This results in lower operating costs and also makes it a more environmentally friendly technique [25].
In this study, response surface methodology (RSM) has been selected to maximise the recovery of the compounds of interest. RSM is a multi-factor approach that involves a limited number of experimental runs and allows to evaluate multiple parameters and their interactions in a single experiment [26,27]. It is also the most widely used method for the development and optimisation of extraction processes. The Box–Behnken design (BBD) is one of the most frequently used methods for optimisation, i.e., the study of the best process performance, the interaction effect and the relevance of the factors. This type of design is characterised by the measurement of only three levels per factor, which makes it a less costly design than others with the same number of factors (such as five-level factorial designs). In addition, the design scores are placed in the middle of the subareas of the k−1 dimension, and, therefore, it does not contain any scores at the ends of the cubic region, which represent extreme conditions.
It is, therefore, the aim of the present study to develop and optimise an ultrasound-assisted extraction method for the major flavonoids that can be found in moringa. Such an optimised extraction method based on the use of methanol/water mixtures as solvent would allow to evaluate the quality of the different moringa varieties and an improved selection of the final product thanks to its analytical quantification. The method would thereby be of great value for analytical laboratories, as well as for other businesses from different industries that make use of moringa leaves for the development or manufacturing of their products.
2. Materials and Methods
2.1. Reagents
The methanol and acetonitrile for the experiments were purchased from Panreac Química, S.A.U. (Castellar del Vallés, Barcelona, Spain) and the acetic acid from Merck (Darmstadt, Germany), all of them HPLC grade. Milli-Q water was produced by means of a Millipore water purification system (Bedford, MA, USA). Hydrochloric acid (1 M) and sodium hydroxide (0.5 M) solutions (Panreac Química, S.A.U, Castellar del Vallés, Barcelona, Spain) were used to adjust the pH values of the extraction solvents, employing a Crison GLP 21 pH-meter (Crison, Barcelona, Spain). Quercetin 3-glucoside (Q3GLU), isorhamnetin 3-glucoside (I3GLU) and kaempferol 3-glucoside (K3GLU) standards were purchased from Sigma-Aldrich Chemical Co. (St. Louis, MO, USA) for quantification purposes.
2.2. Plant Material
The fresh moringa leaves were cultivated at the Instituto Tecnológico Nacional de México campus Veracruz (Veracruz City, Veracruz, Mexico). The leaves were washed us-ing distilled water to remove dust, drained through a colander and the excess water was removed by patting them dry with paper towels. The leaves were then stored in small batches of 200 g wrapped in paper and placed in Ziploc bags until fluidised-bed drying, which was performed by means of an Apex Model SSE65 fluidised-bed dryer (Veracruz, Mexico). For this purpose, 150 g of fresh moringa leaves was placed into the drying chamber at a temperature of 55 °C under a 0.5 m s−1 air stream for 90 min. Finally, the dehydrated moringa leaves were crushed using a conventional electric blade mill (Mandine MCG2013B-16, Carrefour, Madrid, Spain) to produce moringa leaf powder, which was stored in vacuum laminated polyethylene bags at −20 °C until analysis.
2.3. Ultrasound-Assisted Extraction
For the UAE process, an ultrasonic processor UP200S sonifier (200 W, 24 kHz) (Hielscher Ultrasonics GmbH, Teltow, Germany) that features ultrasonic cycle and amplitude control was employed. A Micro tip S7 (Hielscher Ultrasonics GmbH, Teltow, Germany) probe with the following characteristics was also employed: 90 mm maximum immersed depth, 7 mm diameter, 175 μm maximum amplitude and 300 W cm−2 acoustic power density. The temperature was controlled by means of a thermostatic bath (FRIGITERM-10, J.P. Selecta S.A., Abrera, Barcelona, Spain), which allowed the temperature to be set according to each experimental condition. 50 mL “Falcon” tubes were used for the extractions. The sample weight was approximately 0.2 g, to which the corresponding amount of solvent for each experiment was added. The Falcon tubes with the samples were placed inside a double-walled vessel to maintain the desired temperature according to the thermostatic bath settings. In the experiment design, the temperature, cycle and amplitude were set according to each experiment, while 10 min extraction time was used for all the experiments. Once the extractions were completed, the extract was centrifuged at 5985× g for 5 min. The supernatant was added to a 25 mL volumetric flask, and then the precipitate was re-dissolved using 5 mL of the same extraction solvent. This second extract was centrifuged again under the same conditions, and the supernatant was placed into the same volumetric flask and then rinsed. The final extracts were stored in a freezer at −20 °C until analysis.
2.4. Identification of Flavonoids by UHPLC-QToF-MS
Before the extracts obtained by UAE were characterised, the samples were filtered through a 0.20 μm nylon syringe filter (Membrane Solutions, Dallas, TX, USA). The major flavonoids present in moringa were identified by ultra-high-performance liquid chromatography (UHPLC) coupled to a quadrupole-time of flight mass spectrometer (Q-ToF-MS) (Synapt G2, Waters Corp., Milford, MA, USA). The method used was the one described by (Stipcovich et al. 2018), and the full scan negative mode (m/z = 100–800) was applied. The following compounds were individually identified based on their retention time and molecular weight m/z for the identification of deprotonated [M − H]− molecular ions: quercetin 3-glucoside (Q3GLU), 463.4038; quercetin malonyl glucoside (QMGLU), 549.4083; quercetin hydroxy methyl glutaroyl glucoside (QHMGGLU), 607.5027; quercetin acetyl glycoside (QAGLU), 505.4038; kaempferol 3-glucoside (K3GLU), 447.0931 and isorhamnetin 3-glucoside (I3GLU), 477.1031, with retention times of: 5.316, 5.321, 5.338, 5.343, 5.363 and 5.408 min, respectively.
2.5. Analysis of the Flavonoids by UHPLC-DAD
The separation and quantification of the flavonoids present in moringa were carried out by ultra-high-performance liquid chromatography coupled to a photodiode array detector (UHPLC-PDA) (ACQUITY UPLC®, Waters Corporation, Milford, MA, USA). The column used was an RP-C18 (UPLC®BEH C18, Waters Corporation, Milford, MA, USA, 50 mm × 2.1 mm i.d., particle size 1.7 mm). The column temperature was 47 °C, the flow rate was 0.6 mL min−1 and the injection volume amounted to 3.0 μL. The mobile phase consisted of a gradient with two solvents: phase A was made up of 2% acetic acid in Milli Q water and phase B was formed by 2% acetic acid in acetonitrile [23]. The separation gradient used was as follows: 0.0 min, 0% B; 1 min, 5% B; 2 min, 10% B; 3 min, 15% B; 4 min, 20% B; 5 min, 30% B; 7 min, 35% B; 8 min, 40% B; 10 min, 75% B and 12 min, 0% B. The total analysis time was 15.0 min, including the return to the initial conditions and re-equilibration. The chromatogram obtained, where the separation of the 6 identified flavonoids is represented, is shown in Figure S1. This chromatogram has been obtained at a wavelength of 280 nm. The compound Q3GLU was quantified based on its calibration curve using the following range of concentrations: 0.5–50 mg L−1. For K3GLU and I3G, the range used was: 0.8–80 mg L−1. The rest of the identified compounds (QMGLU, QHMGGLU and QAGLU) were quantified from the calibration curve of Q3GLU, assuming similar molar absorptivity and taking into account the molecular weight that corresponded to each compound to be quantified. The calibration data and retention times are shown in Table S1. Prior to their quantification, the extracts obtained by UAE were filtered through a 0.20 μm nylon syringe filter (Membrane Solutions, Dallas, TX, USA).
2.6. Experimental Design
A Box–Behnken design (BBD) was used to determine the optimal extraction conditions. Six factors (the independent variables) were considered at three different levels: −1 (low), 0 (medium), 1 (high). The independent variables were: % methanol in water (X1), extraction temperature (X2), amplitude (% of maximum amplitude) (X3), extraction cycle (X4), pH (X5) and sample to solvent ratio (X6). The response variable was the total concentration of flavonoids, which represents the sum of the concentrations of the major compounds (Q3GLU, QMGLU, QHMGGLU, QAGLU, K3GL, I3GLU) in the moringa leaves [28,29], which had been quantified by (UHPLC-DAD). The Box–Behnken design consisted of 54 experiments, including six replicates at the centre point (0, 0, 0, 0, 0, 0).
The second order polynomial equation to predict the optimal conditions and to determine the correlation between the independent variables and the response is Equation (1).
where y is the predicted response (TPC); β0 is the model constant; Xi and Xj are the independent variables; βi are the linear coefficients; βij are the coefficients corresponding to the interactions; βii are the quadratic coefficients and r is the sum of the mean squares of the error. The results from the analysis of variance (ANOVA) and the graphical representations of the data obtained were analysed using the statistical package Statgraphic Centurion XVII (Statgraphics Technologies, Inc., The Plains, VA, USA).
3. Results and Discussion
3.1. Determining the Operating Temperature Range
Prior to the experimental design, the degradability by temperature of the major flavonoids present in moringa leaves was evaluated. Temperatures of 10-20-30-40-50-60-70 °C, for 10 min, were evaluated at the intermediate conditions of the experimental design (amplitude: 50%; cycle: 0.6 s−1). The extractions were carried out in duplicate. These conditions were applied to 15 mL of extract previously obtained from a parent extract using UAE (methanol–water: 50%; pH: 4.5; sample-to-solvent ratio: 0.2 g-10 mL; 50% amplitude; 0.6 s−1 cycle). The results obtained are shown in Figure 1, where it can be observed that there is no significant degradation of these compounds in the temperature range studied, so a range of 10 to 70 °C was established for the design. This temperature range is within the ranges reported by different authors who have studied the degradation of flavonoids from different plant matrices [30,31].
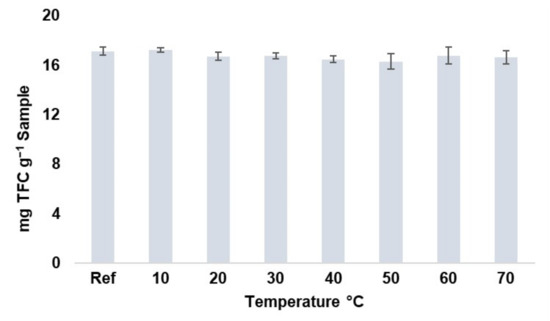
Figure 1.
Total flavonoids content (TFC) stability at different temperatures (10–70 °C) (n = 2).
3.2. Optimization of the Conditions for the Ultrasound-Assisted Extraction
Once the operating temperature range was established, the Box–Behnken design was applied because of its high efficiency and the limited number of experiments required [32] to optimize the variables that mainly influence the UAE with respect to the total flavonoids extraction yields. The composition of the extraction solvent and the extraction temperature as well as the amplitude or power of the ultrasound, the extraction cycle, the pH and the sample-to-solvent ratio are the main variables affecting the efficiency of UAE [33]. Table 1 shows the variables and the respective ranges used in this work. These values have been set based on different previous experiences, as well as on the extensive experience of our research group in the extraction of phenolic compounds from different plant matrices: Aristotelia chilensis [34], Allium cepa L. [35], Myrtus communis L. [36], Aronia melanocarpa L. [18].

Table 1.
Range of values used in the Box–Behnken design (BBD).
As discussed in Section 2.6, the experimental design consisted of 54 experiments. Once the extractions were completed, the major flavonoids in the extracts were quantified. Table 2 shows the experimental and the predicted values of the extractions of total flavonoids (sum of the six compounds with the highest contents). In this case, the extraction yields ranged from 6.16 to 20.42 mg flavonoids g−1 sample.
Table 2.
Conditions of the Box–Behnken design for the six variables, including experimental and predicted values.
The polynomial Equation (2) to calculate the total flavonoids content was derived from the coefficients of the effects and interactions (Table 3).
Total flavonoids = 12.62 + 2.55163·X1 − 1.23397·X2 − 0.797525·X3 +
0.0990653·X4 + 0.857853·X5 + 0.614827·X6 + 0.0312568·X12 − 0.789189 X1X2 −
0.82874·X1X3 + 0.240567·X1X4 + 1.20702·X1X5 − 0.852022·X1X6 + 0.226193·X22 +
1.26963·X2X3 − 0.0353688·X2X4 − 0.840221·X2X5 + 1.76922·X2X6 − 1.1988·X32 −
0.324918·X3X4 − 0.724265·X3X5 + 0.630495·X3X6 − 1.00415·X42 − 0.0125434·X4X5 +
0.0266482·X4X6 − 1.68016·X52 − 0.336261·X5X6 − 0.74665·X62,
Table 3.
Analysis of variance (ANOVA) of the quadratic model fitted to the TPC extraction yield.
The Pareto diagram in Figure 2 represents the relevant effects of all the variables, both linear and quadratic, as well as their interactions. The effects are shown in decreasing order of importance. The length of each bar is proportional to the absolute magnitude of the coefficients of the estimated effects, while the vertical line represents the minimum magnitude for the statistically significant effects (95% confidence level) with respect to the response.
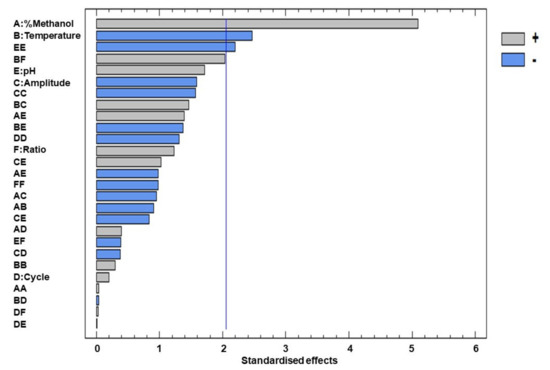
Figure 2.
Pareto chart of the standardised effects of the total flavonoids.
Considering the data obtained from the Pareto chart and from the ANOVA, the following factors and/or interactions can be considered relevant for this study: % methanol in water, extraction temperature and the quadratic interaction of pH. Among the linear terms, the most significant factor was the percentage of methanol in water since this factor had a positive effect on the response (2.551), which means that a high percentage of methanol in water within the studied range is more efficient for the extraction of the flavonoids. This variable was followed by temperature, which had a negative significant effect (−1.233), which means that, at lower temperatures, a higher content of flavonoids is obtained, and, finally, by the quadratic interaction of pH, which had a negative significant effect (−1.680.)
3.3. Optimal Extraction Conditions
The values of the independent variables that maximise the yield of total flavonoids from moringa leaves, obtained by the BBD design, are presented in Table 4.
Table 4.
Optimum extraction conditions for total flavonoids in methanolic extracts from moringa leaves.
The values obtained to maximise the response coincide with those reported by several studies, which have reported that higher extraction yields of total flavonoids are obtained when working with hydroalcoholic mixtures. The percentage of methanol is determined by the polar profiles of both the compounds to be analysed (moderately polar molecules) and the solvent [37,38]. The optimum pH value established for this study was 7.7. Several studies have reported that a pH around 7 favours a higher extraction of phenolic compounds from certain matrices, as has been observed in the case of moringa in this study [39,40,41]. On the other hand, acidified solvents can intensify the formation of free radicals in aqueous solutions due to the concentration of H+ [42], which could lead to the degradation of these compounds. Finally, the optimum temperature value was 10 °C, which is closely correlated with the possibility of degrading these compounds at higher temperatures.
3.4. Optimal Extraction Time
Having determined the optimum extraction conditions, a study of the optimum extraction time was conducted in order to determine the minimum time required to obtain the maximum concentration of flavonoids in the extract. Extraction times between 2 and 30 min were evaluated. The extractions were performed in triplicate. The results obtained are presented in Figure 3, which shows an increment in the content of the flavonoids extracted as the extraction time per UAE was increased up to 5 min. No significant differences are observed between 5 and 20 min. On the other hand, longer extraction times (>25 min) resulted in a slight decrease in the content of flavonoids. This behaviour could be explained by the degradation caused by a longer exposure to ultrasounds, which may lead to the appearance of free radicals in the medium that would favour the eventual degradation of these compounds. In addition, the maximum concentration of flavonoids (14.16 mg TFC g−1 sample) was obtained in a shorter period of time in comparison to those reported by other authors [43] (15 min), or Zhao et al. [44], who conducted 42 min extractions to obtain the largest amount of TPC by means of 300 W ultrasonic extraction equipment. This shortening of the extraction time is a consequence of the ultrasound effect, which can disrupt plant cell walls and thus increase solvent penetration [45]. Given that the diffusion of the solute into the solvent takes place in the first minutes of the extraction [46], 5 min was established as the optimal extraction time.
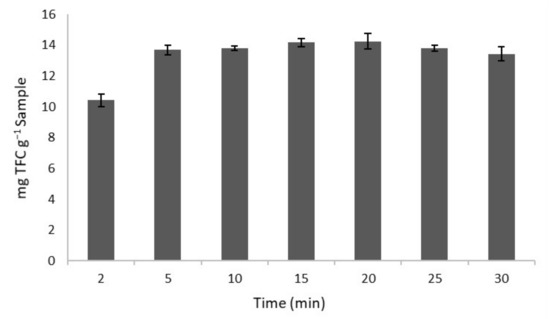
Figure 3.
Total flavonoids content (TFC) obtained at different extraction times under optimal conditions (n = 3).
3.5. Repeatability and Intermediate Precision of the Method
The accuracy of the developed UAE method was assessed for repeatability and intermediate precision. To do so, 12 extractions were carried out on the same day as well as 12 extractions per day for three consecutive days to determine repeatability and intermediate precision, respectively. The extractions were performed under the optimal conditions that had been previously established. The results were expressed by the coefficient of variation, which was 2.78% for repeatability and 3.92% for intermediate precision. These results, with coefficients below 5%, are within the acceptable limits defined by the Association of Official Agricultural Chemists (AOAC) [47], so it can be concluded that the developed method presented good precision.
3.6. Application to Real Samples
Once the extraction method had been developed, it was applied to the analysis of three dried moringa samples received from different suppliers. The resulting data are shown in Table 5, which shows that the concentration values for total major flavonoids are between 16.30 and 27.09 mg TFC g−1 moringa DW. These values are in agreement with those obtained by other authors [43,44]. It is observed that the major flavonoids in moringa are Q3GLU and QMGLU and that they account for 80 to 90% of the total amount of flavonoids present in moringa. These two major flavonoids are in agreement with those obtained by other authors in moringa leaves [28,43]. There are numerous works in the literature that report the excellent biological properties of the flavonoids present in moringa leaves. It has been widely studied that moringa leaves, as well as seeds and roots, have high antioxidant and anti-inflammatory activity, mainly due to their flavonoid composition [28,48,49]. In addition, flavonoids have other health-promoting effects, such as prevention of damage to normal cell DNA and promotion of cancer cell apoptosis, thereby reducing the burden of non-communicable diseases (NCDs) [50].
Table 5.
Amount of flavonoids (mg g−1 DW) in three moringa samples (n = 3).
4. Conclusions
In this study, a Box–Behnken design has been used to investigate the effect exerted by certain factors on the UAE extraction of flavonoids from moringa leaves. UAE, which minimizes the processing time and the amount of extraction solvent required, has been confirmed as an efficient technique for the extraction of flavonoids from moringa leaves. Thus, the experimental results revealed that the most influential extraction variables were: the percentage of methanol in the extraction solvent (74.5% methanol in water), the temperature (11 °C) and the pH of the extraction solvent (7.7). The time to achieve the maxi-mum extraction of the main flavonoids was 15 min. The developed method has been evaluated for repeatability and intermediate precision (RSD < 5%) with good results. The major flavonoids in moringa are Q3GLU and QMGLU, and they account for 80 to 90% of the total amount of flavonoids present in moringa. Flavonoids have excellent biological properties, such as antioxidant and anti-inflammatory activity, among others. This study has demonstrated that optimized UAE is a trouble-free and efficient alternative for the recovery, characterization and evaluation of the quality of flavonoids extracted from the leaves of different moringa species.
Supplementary Materials
The following are available online at https://www.mdpi.com/article/10.3390/agronomy12020261/s1, Figure S1: Chromatogram of the flavonoids present in the moringa extract obtained by UHPLC-DAD (λ = 280 nm). Q3GLU (1): quercetin 3-glucoside; QMGLU (2): quercetin malonyl glucoside; QHMGGLU (3): quercetin hydroxy methyl glutaroyl glucoside; QAGLU (4): quercetin acetyl glycoside; K3GLU (5): kaempferol 3-glucoside; I3GLU (6): isorhamnetin 3-glucoside. Table S1: Calibration curves of the major flavonoids present in moringa.
Author Contributions
Conceptualization, M.Á.G.-A., G.F.B. and M.P.; methodology, B.J.Y.-P., M.V.-E. and A.V.G.-d.-P.; software, G.d.C.R.-J. and G.F.B.; validation, G.F.B. and M.Á.G.-A.; formal analysis, M.G.-G., B.J.Y.-P., M.V.-E. and A.V.G.-d.-P.; investigation, G.d.C.R.-J. and G.F.B.; resources, G.d.C.R.-J. and G.F.B.; data curation, B.J.Y.-P., M.P. and G.F.B.; writing—original draft preparation, B.J.Y.-P., M.V.-E. and A.V.G.-d.-P.; writing—review and editing, G.F.B.; visualization, G.F.B.; supervision, M.P., M.Á.G.-A., G.d.C.R.-J. and G.F.B.; project administration, G.F.B. and G.d.C.R.-J.; funding acquisition, G.F.B. and G.d.C.R.-J. All authors have read and agreed to the published version of the manuscript.
Funding
This work has been supported by the project “EQC2018-005135-P” (Equipment for liquid chromatography by means of mass spectrometry and ion chromatography) of the State Subprogram of Research Infrastructures and Technical Scientific Equipment. The authors express their gratitude to the Consejo Nacional de Ciencia y Tecnologia (CONACyT), to the University of Cádiz (UCA) and the Aula Universitaria Iberoamericana (R80REC) for scholarships provided to Beatriz Juliana Yerena Prieto (No. CVU: 766097). The authors express their gratitude to the Tecnológico Nacional de México (Project TNM 10088.21-P) for financial support.
Institutional Review Board Statement
Not applicable.
Informed Consent Statement
Not applicable.
Data Availability Statement
The data presented in this study are contained within the article.
Acknowledgments
The authors are grateful to the “Instituto de Investigación Vitivinícola y Agroalimentaria” (IVAGRO) for providing the necessary facilities to carry out the research.
Conflicts of Interest
The authors declare no conflict of interest.
References
- Zhao, J.; Davis, L.C.; Verpoorte, R. Elicitor signal transduction leading to production of plant secondary metabolites. Biotechnol. Adv. 2005, 23, 283–333. [Google Scholar] [CrossRef]
- Olson, M.E.; Fahey, J.W.; Jed, W. Moringa oleifera: A multipurpose tree for the dry tropics. Rev. Mex. Biodiv. 2011, 82, 1071–1082. [Google Scholar]
- Mehta, K.; Balaraman, R.; Amin, A.H.; Bafna, P.A.; Gulati, O. Effect of fruits of Moringa oleifera on the lipid profile of normal and hypercholesterolaemic rabbits. J. Ethnopharmacol. 2003, 86, 191–195. [Google Scholar] [CrossRef]
- Ndong, M.; Uehara, M.; Katsumata, S.I.; Suzuki, K. Effects of oral administration of Moringa oleifera Lam on glucose tolerance in Goto-Kakizaki and Wistar rats. J. Clin. Biochem. Nutr. 2007, 40, 229–233. [Google Scholar] [CrossRef] [PubMed]
- Ahmad, N.; Zuo, Y.; Lu, X.; Anwar, F.; Hameed, S. Characterization of free and conjugated phenolic compounds in fruits of selected wild plants. Food Chem. 2016, 190, 80–89. [Google Scholar] [CrossRef] [PubMed]
- Bharali, R.; Jawahira, T.; Azad, M.R.H. Chemomodulatory effect of Moringa oleifera, Lam, on hepatic carcinogen metabolising enzymes, antioxidant parameters and skin papillomagenesis in mice. Asian Pac. J. Cancer Prev. 2003, 4, 131–139. [Google Scholar] [PubMed]
- Parrota, J.A. Moringa oleifera. In Bioecología de Árboles Nativos y Exóticos de Puerto Rico y las Indias Occidentales; United States Department of Agriculture (USDA): Río Piedras, Puerto Rico, 2000; pp. 366–370. [Google Scholar]
- Mora, J.S.; Gacharná, N. El árbol milagroso: La Moringa oleifera. Biodivers. Colomb. 2015, 1, 45–58. [Google Scholar]
- Siddhuraju, P.; Becker, K. Antioxidant Properties of Various Solvent Extracts of Total Phenolic Constituents from Three Different Agroclimatic Origins of Drumstick Tree (Moringa oleifera Lam.) Leaves. J. Agric. Food Chem. 2003, 51, 2144–2155. [Google Scholar] [CrossRef]
- Singh, B.N.; Singh, B.R.; Singh, R.L.; Prakash, D.; Dhakarey, R.; Upadhyay, G.; Singh, H.B. Oxidative DNA damage protective activity, antioxidant and anti-quorum sensing potentials of Moringa oleifera. Food Chem. Toxicol. 2009, 47, 1109–1116. [Google Scholar] [CrossRef]
- Manguro, L.O.A.; Lemmen, P. Phenolics of Moringa oleifera leaves. Nat. Prod. Res. 2007, 2, 56–68. [Google Scholar] [CrossRef]
- Fahey, J.W.; Dinkova-Kostova, A.T.; Stephenson, K.K.; Talalay, P. The ‘Prochaska’ Microtiter Plate Bioassay for Inducers of NQO1. Methods Enzymol. 2004, 382, 243–258. [Google Scholar] [CrossRef]
- Reddy, V.; Urooj, A.; Kumar, A. Evaluation of antioxidant activity of some plant extracts and their application in biscuits. Food Chem. 2004, 90, 317–321. [Google Scholar] [CrossRef]
- Guija, H.; Troncoso, L.; Guija, E. Propiedades prooxidantes del camu camu (Myrciaria dubia). An. Fac. Med. 2005, 66, 261–268. [Google Scholar] [CrossRef][Green Version]
- Vuolo, M.M.; Lima, V.S.; Junior, M.R.M. Phenolic compounds: Structure, classification, and antioxidant power. In Bioactive Compounds; Woodhead Publishing: Sawston, UK, 2019; pp. 33–50. [Google Scholar] [CrossRef]
- Geankoplis, C.J. Transport Processes and Separation Process Principles (Includes Unit Operations), 4th ed.; Prentice Hall Press: Hoboken, NJ, USA, 1993; p. 895. ISBN 9780131013674. [Google Scholar]
- González de Peredo, A.V.; Vázquez-Espinosa, M.; Espada-Bellido, E.; Jiménez-Cantizano, A.; Ferreiro-González, M.; Amores-Arrocha, A.; Barbero, G.F. Development of New Analytical Microwave-Assisted Extraction Methods for Bioactive Compounds from Myrtle (Myrtus communis L.). Molecules 2018, 23, 2992. [Google Scholar] [CrossRef] [PubMed]
- Vázquez-Espinosa, M.; González-de-Peredo, A.V.; Espada-Bellido, E.; Ferreiro-González, M.; Toledo-Domínguez, J.J.; Carrera, C.; Barbero, G.F. Ultrasound-Assisted Extraction of Two Types of Antioxidant Compounds (TPC and TA) from Black Chokeberry (Aronia melanocarpa L.): Optimization of the Individual and Simultaneous Extraction Methods. Agronomy 2019, 9, 456. [Google Scholar] [CrossRef]
- Lasta, H.F.B.; Lentz, L.; Rodrigues, L.G.G.; Mezzomo, N.; Vitali, L.; Ferreira, S.R.S. Pressurized liquid extraction applied for the recovery of phenolic compounds from beetroot waste. Biocatal. Agric. Biotechnol. 2019, 21, 101353. [Google Scholar] [CrossRef]
- Díaz-de-Cerio, E.; Arráez-Román, D.; Segura-Carretero, A.; Ferranti, P.; Nicoletti, R.; Perrotta, G.M.; Gómez-Caravaca, A.M. Establishment of pressurized-liquid extraction by response surface methodology approach coupled to HPLC-DAD-TOF-MS for the determination of phenolic compounds of myrtle leaves. Anal. Bioanal. Chem. 2018, 410, 3547–3557. [Google Scholar] [CrossRef]
- Rodríguez-Pérez, C.; Gilbert-López, B.; Mendiola, J.A.; Quirantes-Piné, R.; Segura-Carretero, A.; Ibáñez, E. Optimization of microwave-assisted extraction and pressurized liquid extraction of phenolic compounds from Moringa oleifera leaves by multiresponse surface methodology. Electrophoresis 2016, 37, 1938–1946. [Google Scholar] [CrossRef]
- Pan, X.; Niu, G.; Liu, H. Microwave-assisted extraction of tea polyphenols and tea caffeine from green tea leaves. Chem. Eng. Process. 2003, 42, 129–133. [Google Scholar] [CrossRef]
- Quiles-Carrillo, L.; Mellinas, C.; Garrigós, M.D.C.; Balart, R.; Torres-Giner, S. Optimization of Microwave-Assisted Extraction of Phenolic Compounds with Antioxidant Activity from Carob Pods. Food Anal. Methods 2019, 12, 2480–2490. [Google Scholar] [CrossRef]
- Mason, T.J.; Paniwnyk, L.; Lorimer, J.P. The uses of ultrasound in food technology. Ultrason. Sonochem. 1996, 3, S254–S260. [Google Scholar] [CrossRef]
- Carrera, C.; Ruiz-Rodríguez, A.; Palma, M.; Barroso, C.G. Ultrasound assisted extraction of phenolic compounds from grapes. Anal. Chim. Acta 2012, 732, 100–104. [Google Scholar] [CrossRef] [PubMed]
- Zhao, G.; Wang, H.; Liu, G.; Wang, Z. Box–Behnken response surface design for the optimization of electrochemical detection of cadmium by Square Wave Anodic Stripping Voltammetry on bismuth film/glassy carbon electrode. Sens. Actuators B Chem. 2016, 235, 67–73. [Google Scholar] [CrossRef]
- Myers, R.H.; Montgomery, D.C.; Anderson-Cook, C.M. Response Surface Methodology: Process and Product Optimization Using Designed Experiments, 4th ed.; John Wiley & Sons: Hoboken, NJ, USA, 2016; pp. 235–287. [Google Scholar]
- Coppin, J.P.; Xu, Y.; Chen, H.; Pan, M.H.; Ho, C.T.; Juliani, R.; Wu, Q. Determination of flavonoids by LC/MS and anti-inflammatory activity in Moringa oleifera. J. Funct. Foods. 2013, 5, 1892–1899. [Google Scholar] [CrossRef]
- Rodríguez-Pérez, C.; Quirantes-Piné, R.; Fernández-Gutiérrez, A.; Segura-Carretero, A. Comparative characterization of phenolic and other polar compounds in Spanish melon cultivars by using high-performance liquid chromatography coupled to electrospray ionization quadrupole-time of flight mass spectrometry. Int. Food Res. 2013, 54, 1519–1527. [Google Scholar] [CrossRef]
- Liazid, A.; Palma, M.; Brigui, J.; Barroso, C.G. Investigation on phenolic compounds stability during microwave-assisted extraction. J. Chromatogr. A 2007, 1140, 29–34. [Google Scholar] [CrossRef]
- Daskalaki, D.; Kefi, G.; Kotsiou, K.; Tasioula-Margari, M. Evaluation of phenolic compounds degradation in virgin olive oil during storage and heating. Food Nutr. Res. 2009, 48, 31–41. [Google Scholar]
- Pittol, V.; Ortega, G.G.; Doneda, E.; Bianchi, S.E.; Santos, M.C.; Koetz, M.; Bassani, V.L. Box-Behnken design for extraction optimization followed by high performance countercurrent chromatography: Production of a flavonoid-enriched fraction from Achyrocline satureioides. Planta Med. 2020, 86, 151–159. [Google Scholar] [CrossRef]
- Bridgers, E.N.; Chinn, M.S.; Truong, V.D. Extraction of anthocyanins from industrial purple-fleshed sweet potatoes and enzymatic hydrolysis of residues for fermentable sugars. Ind. Crops Prod. 2010, 32, 613–620. [Google Scholar] [CrossRef]
- Vázquez-Espinosa, M.; González de Peredo, A.V.; Ferreiro-González, M.; Carrera, C.; Palma, M.; Barbero, G.F.; Espada-Bellido, E. Assessment of ultrasound assisted extraction as an alternative method for the extraction of anthocyanins and total phenolic compounds from maqui berries (Aristotelia chilensis (Mol.) Stuntz). Agronomy 2019, 9, 148. [Google Scholar] [CrossRef]
- González-de-Peredo, A.V.; Vázquez-Espinosa, M.; Espada-Bellido, E.; Carrera, C.; Ferreiro-González, M.; Barbero, G.F.; Palma, M. Flavonol Composition and Antioxidant Activity of Onions (Allium cepa L.) Based on the Development of New Analytical Ultrasound-Assisted Extraction Methods. Antioxidants 2021, 10, 273. [Google Scholar] [CrossRef]
- González de Peredo, A.V.; Vázquez-Espinosa, M.; Espada-Bellido, E.; Ferreiro-González, M.; Amores-Arrocha, A.; Palma, M.; Jiménez-Cantizano, A. Alternative Ultrasound-Assisted Method for the Extraction of the Bioactive Compounds Present in Myrtle (Myrtus communis L.). Molecules 2019, 24, 882. [Google Scholar] [CrossRef]
- Mustafa, A.; Turner, C. Pressurized liquid extraction as a green approach in food and herbal plants extraction: A review. Anal. Chim. Acta 2011, 703, 8–18. [Google Scholar] [CrossRef]
- Kidak, R.; Ince, N.H. Ultrasonic destruction of phenol and substituted phenols: A review of current research. Ultrason. Sonochem. 2006, 13, 195–199. [Google Scholar] [CrossRef]
- Sepúlveda, C.T.; Zapata, J.E. Efecto de la Temperatura, el pH y el Contenido en Sólidos sobre los Compuestos Fenólicos y la Actividad Antioxidante del Extracto de Bixa orellana L. Inf. Tecnológica 2019, 30, 183–194. [Google Scholar] [CrossRef]
- Bashi, D.S.; Mortazavi, S.A.; Rezaei, K.; Rajaei, A.; Karimkhani, M.M. Optimization of ultrasound-assisted extraction of phenolic compounds from yarrow (Achillea beibrestinii) by response surface methodology. Food Sci. Biotechnol. 2012, 21, 1005–1011. [Google Scholar] [CrossRef]
- González-de-Peredo, A.V.; Vázquez-Espinosa, M.; Espada-Bellido, E.; Ferreiro-González, M.; Carrera, C.; Palma, M.; Álvarez, J.A.; Barbero, G.F.; Ayuso, J. Optimization of Analytical Ultrasound-Assisted Methods for the Extraction of Total Phenolic Compounds and Anthocyanins from Sloes (Prunus spinosa L.). Agronomy 2020, 10, 966. [Google Scholar] [CrossRef]
- Ince, N.H.; Tezcanli, G.; Belen, R.K.; Apikyan, G. Ultrasound as a catalyzer of aqueous reaction systems: The state of the art and environmental applications. Appl. Catal. B 2001, 29, 167–176. [Google Scholar] [CrossRef]
- Rodríguez-Pérez, C.; Quirantes-Piné, R.; Fernández-Gutiérrez, A.; Segura-Carretero, A. Optimization of extraction method to obtain a phenolic compounds-rich extract from Moringa oleifera Lam leaves. Ind. Crops Prod. 2015, 66, 246–254. [Google Scholar] [CrossRef]
- Zhao, B.; Deng, J.; Li, H.; He, Y.; Lan, T.; Wu, D.; Chen, Z. Optimization of phenolic compound extraction from Chinese Moringa oleifera leaves and antioxidant activities. J. Food Qual. 2019, 19, 13. [Google Scholar] [CrossRef]
- Vinatoru, M. An overview of the ultrasonically assisted extraction of bioactive principles from herbs. Ultrason. Sonochem. 2001, 8, 137–142. [Google Scholar] [CrossRef]
- Zhao, S.; Kwok, K.C.; Liang, H. Investigation on ultrasound assisted extraction of saikosaponins from Radix Bupleuri. Sep. Purif. Technol. 2007, 55, 307–312. [Google Scholar] [CrossRef] [PubMed]
- Association of Official Analytical Chemists. AOAC® Peer-Verified Methods Program: Manual on Policies and Procedures; AOAC International: Rockville, MD, USA, 1998. [Google Scholar]
- Yong-Bing, X.; Gui-Lin, C.; Ming-Quan, G. Antioxidant and anti-inflammatory activities of the crude extracts of Moringa oleifera from Kenya and their correlations with flavonoids. Antioxidants 2019, 8, 296. [Google Scholar] [CrossRef]
- Vongsak, B.; Sithisarn, P.; Mangmool, S.; Thongpraditchote, S.; Wongkrajang, Y.; Gritsanapan, W. Maximizing total phenolics, total flavonoids contents and antioxidant activity of Moringa oleifera leaf extract by the appropriate extraction method. Ind. Crops Prod. 2013, 44, 566–571. [Google Scholar] [CrossRef]
- Lin, M.; Zhang, J.; Chen, X. Bioactive flavonoids in Moringa oleifera and their health-promoting properties. J. Funct. Foods 2018, 47, 469–479. [Google Scholar] [CrossRef]


Publisher’s Note: MDPI stays neutral with regard to jurisdictional claims in published maps and institutional affiliations. |
© 2022 by the authors. Licensee MDPI, Basel, Switzerland. This article is an open access article distributed under the terms and conditions of the Creative Commons Attribution (CC BY) license (https://creativecommons.org/licenses/by/4.0/).