Article

Bunch Weight Determination in Relation to the Source-Sink Balance in 12 Cavendish Banana Cultivars

1
Vitropic SA, 3 Avenue du Grand Chêne, 34270 Saint-Mathieu-de-Tréviers, France
2
UPR GECO, CIRAD (Centre de Coopération Internationale en Recherche Agronomique pour le Développement), 97130 Capesterre-Belle-Eau, France
*
Author to whom correspondence should be addressed.
Agronomy 2022, 12(2), 333; https://doi.org/10.3390/agronomy12020333
Submission received: 30 December 2021 / Revised: 23 January 2022 / Accepted: 25 January 2022 / Published: 27 January 2022
(This article belongs to the Section Horticultural and Floricultural Crops)

Abstract

:
This study was carried out to compare bunch weight determination in relation to the source-sink balance in a selection of 12 Cavendish banana cultivars. Fruit number and individual fruit weight are the main bunch weight components. The fruit number depended on the growth potential during floral induction, which we estimated according to the active leaf area at floral induction (ALAfi). We studied fruit weight determination by measuring the source-sink balance during bunch growth, carbohydrate reserves and bunch-sucker biomass partitioning. Throughout the experiment, we monitored the global radiation (Rg), which exhibited seasonal variations. We noted a source variation from the first to the second cycle during bunch growth because of a decrease in the Rg and active leaf area. Our results showed significant differences between Cavendish cultivars regarding bunch weight, fruit number and susceptibility to source variations. There was an overall positive linear relation between ALAfi and fruit number, but the ALAfi/fruit number ratio varied between cultivars. We also found that the bunch weight was mainly determined by the fruit number rather than the fruit weight when the source was not limited. Finally, we assessed the cultivar susceptibility to source decreases, thereby revealing some cultivars of interest for agroecological cropping systems.

1. Introduction

Cavendish (Musa AAA) banana cultivars were selected for their capacity to produce high fruit yields in intensive cropping systems meeting international banana market requirements. Among cultivars of the Cavendish group, ‘Grande Naine’ and ‘Williams’ are considered to be ‘model bananas’ [1,2] and are the main cultivars cropped for export. However, banana cropping systems are currently moving towards agroecological systems based on limited chemical input use. Soil resource availability is often reduced in these systems as a result of competition with weeds or accompanying cover plants and/or the use of organic fertilizers with hard-to-predict nutrient release patterns. Moreover, as fungicide usage for black Sigatoka control has been curbed, prophylactic practices are now being implemented that involve extensive sanitary deleafing, thereby reducing the banana leaf area and photosynthetic production [3].
The Cavendish group includes various cultivars that are mainly distinguishable by their height, leaf length/width ratio and fruit number/bunch [4,5]. The agronomic performances of these cultivars have been compared in non-limiting conditions to select cultivars suitable for the banana industry and export market [1,6,7,8,9,10]. To this end, the cultivars have basically been compared on the basis of traits related to yield components: bunch weight, fruit number, fruit size and number of bunches/year. However, few studies have addressed the mechanisms involved in the yield build-up process of the cultivars.
It is of interest to study the carbon source-sink balance so as to assess the ability of plants to withstand non-optimal cropping conditions. The term ‘source-sink balance’ is more commonly used in reference to the carbon source-sink balance. The sources are photoassimilate-producing leaves, while the sinks are organs requiring carbohydrates for their growth. In banana, the main source consists of the eight last emitted leaves, whereas the main sinks are the bunch and sucker [11]. The source strength depends on the leaf area, the global radiation (Rg) and the radiation use efficiency. The bunch sink strength depends on the fruit number and on the number of cells contained in each fruit [12]. The source-sink balance is involved in bunch weight determination as the fruit number depends on the active leaf area at floral induction [13], and the fruit growth rate and final individual fruit weight depend on the source-sink balance after bunch emergence [12]. The source strength varies with the environment and cropping conditions and may be reduced by a radiation decrease, water deficit or low nitrogen availability. The source strength is also affected by defoliation and foliar diseases such as black Sigatoka disease caused by Mycosphaerella fijiensis. However, source-sink balance variations between banana cultivars are poorly documented.
We hypothesized that cultivars of the Cavendish groups would differ in terms of bunch weight determination and the source-sink balance. To test this hypothesis, we measured a set of plant traits in 12 representative Cavendish banana cultivars in an experimental plot over two crop cycles.

2. Materials and Methods

2.1. Experimental Design and Growing Conditions

This experiment was conducted in Capesterre-Belle-Eau (Guadeloupe, French West Indies), at the CIRAD Neufchâteau research station (16°04′48″ N, 61°36′09″ W) from August 2019 to March 2021. The climatic conditions over this period and the plant stages for both cycles are presented in Figure 1.
The soil is classified as an andosol [14]. The cultivar evaluation trial was conducted on a 0.2 ha plot in which 12 banana cultivars were planted (10 plants/cultivar). The plants were randomly planted at a density of 930 plants/ha (3 m × 3 m spacing). We assumed that this plant density was low enough to limit light competition in the banana population.
The experimental field had lain fallow for 2 years and the soil was tilled before planting. The planting materials were tissue culture plants supplied by Vitropic SA.
After banana planting, fertilizers were applied twice monthly, for a total annual applied amount of 530 kg of nitrogen, 800 kg of potassium, 110 kg of phosphorus and 150 kg of magnesium.
For each crop cycle, we kept a single successive sucker and removed all others once they emerged aboveground. We selected a successive sucker during the first cycle 5 months after plantation. For the second cycle, we selected a successive sucker 4 months after the first cycle harvest.
Sanitary deleafing was performed weekly, and a mixture of triazole fungicide and mineral oil, composed of 5 g of difenoconazole in 10 L of mineral oil, was sprayed monthly to control black Sigatoka disease.

2.2. Cultivars

The Cavendish cultivars were selected in the Vitropic SA brochure with the aim of covering the plant size range prevailing in the Cavendish group, i.e., from the Dwarf to the Robusta type [4]. From the smallest to the tallest, the cultivars were as follows:
  • Dwarf type: These are the most cultivated cultivars in the subtropics, especially in the Canary Islands. We monitored the Dwarf Cavendish ‘DC-01’ cultivar in this study. This cultivar was selected for its high fruit number and its high bunch weight in subtropical climate, where it exhibited the highest bunch weight compared to some Giant cultivars (unpublished data).
  • Giant type: These are major cultivars cultivated for world export, including the mainstreamed cultivars ‘Grande Naine’ and ‘Williams’. For this study, we monitored nine commercial Giant cultivars that were selected in ‘Grande Naine’ populations: ‘Gua-01’ (considered as the standard ‘Grande Naine’); ‘Gua-02’; ‘Mat-01’; ‘Mat-02’; ‘Mat-03’; ‘Mat-11’; ‘Mat-12’; ‘Cot-01’ and ‘Ruby’. The latter ‘Ruby’ cultivar is nematode-tolerant and has shown resistance to TR4 disease under in vitro conditions.
  • Robusta type: These were once major export cultivars that replaced the Gros Michel cultivar, which is highly susceptible to Panama disease. In many exporting areas, they have now been replaced by Giant Cavendish types, which are shorter and produce larger bunches. We monitored two cultivars: ‘Ame-01’, an American cultivar that used to be mostly cropped in Latin America, and ‘Poyo’ that used to be traditionally cultivated in the West Indies.

2.3. Measurements

During two banana crop cycles, a set of measurements was applied on 10 plants/cultivar to describe the plant morphology, the plant phenology and to assess the bunch characteristics and their determination.

2.3.1. Plant Phenology and Morphology

We noted the date of each leaf emission, of bunch emergence and of harvest. Bunches were harvested 900 cumulative degree-days after bunch emergence, with a base temperature of 14 °C. Since 11 leaves are emitted between floral induction and bunch emergence [15], we retroactively estimated the floral induction date by the date of emission of the twelfth leaf before bunch emergence.
The first cycle duration was measured as the interval between plantating and harvest in the first cycle, while the second cycle duration was the interval between the first and second cycle harvests.
For every leaf, the leaf length and width were measured to calculate the leaf area according to Formula (1) [16]:
leaf area = 0.83 × leaf length × leaf width
We calculated the total emitted leaf area (TELA) as the cumulative area of all emitted leaves/cycle. At bunch emergence, the pseudostem height and basal girth were measured and the robustness was evaluated as the girth/height ratio. The pseudostem volume of the parent plant (Vps) at bunch emergence, and the pseudostem volume of the sucker (Vpsr) at the parent plant harvest were calculated according to the method described by Stevens et al. [17]. At bunch emergence, we also measured the corm height and girth at its largest section on the parent plant to calculate the corm volume (Vc) (Formula (2)):
Vc = 1/6π × corm girth2 × corm height.
In order to realize the measurements on the corm, we delicately dug around the corm on a width of 20 cm and depth of 40 cm; then we put the ground back around the corm.

2.3.2. Bunch Characteristics

The fruit number and weight/bunch were determined at harvest. We also measured the diameter and length of two fruits of the third hand. We calculated an indicator of the individual fruit weight (Indfw) as the volume of a cylinder whose diameter and length were those of the fruit, according to Formula (3):
Indfw= π × fruit length × (fruit diameter/2)2

2.3.3. Bunch Weight Determination

The bunch weight depended on the fruit number and on the individual fruit weight.
Fruit number was determined at an early bunch formation stage as it depends on the growth potential at floral induction [13]. The active leaf area at floral induction (ALAfi) is an indicator of the growth potential at floral induction [13], and was calculated as the sum of the areas of living leaves at floral induction. We calculated the ratio between ALAfi and the fruit number/bunch.
The individual fruit weight depended on the quantity of carbohydrates allocated to the fruit, which depends on the quantity of carbohydrates allocated to the bunch and on the fruit number/bunch. The quantity of carbohydrates allocated to the bunch depended on the source-sink balance from bunch emergence to harvest, on the carbohydrate reserves and on the bunch-sucker biomass partitioning.
To evaluate the source-sink balance from bunch emergence to harvest, we calculated the source (in m2), as the sum of the active leaf area for each time t (ALA(t)) from bunch emergence to harvest. We used the fruit number/bunch to evaluate the bunch sink potential. As bananas mostly store carbohydrates in the corm and pseudostem, we used Vps and Vc to quantify the carbohydrate reserves. We calculated the ratio between the bunch weight (in kg) and Vpsr (in dm3) in order to measure the bunch-sucker biomass partitioning.

2.4. Statistical Analysis

All statistical analyses were performed with R software (version 3.5.3) [18]. A principal component analysis (PCA) was performed on seven variables (height, TELA, fruit length, cycle duration, bunch weight, fruit number and robustness) of the cultivars. For each cycle, the effects of the cultivar on the banana plant characteristics were tested with ANOVA (α = 0.05). A Tukey post hoc test was conducted to compare average values/cultivar.

3. Results

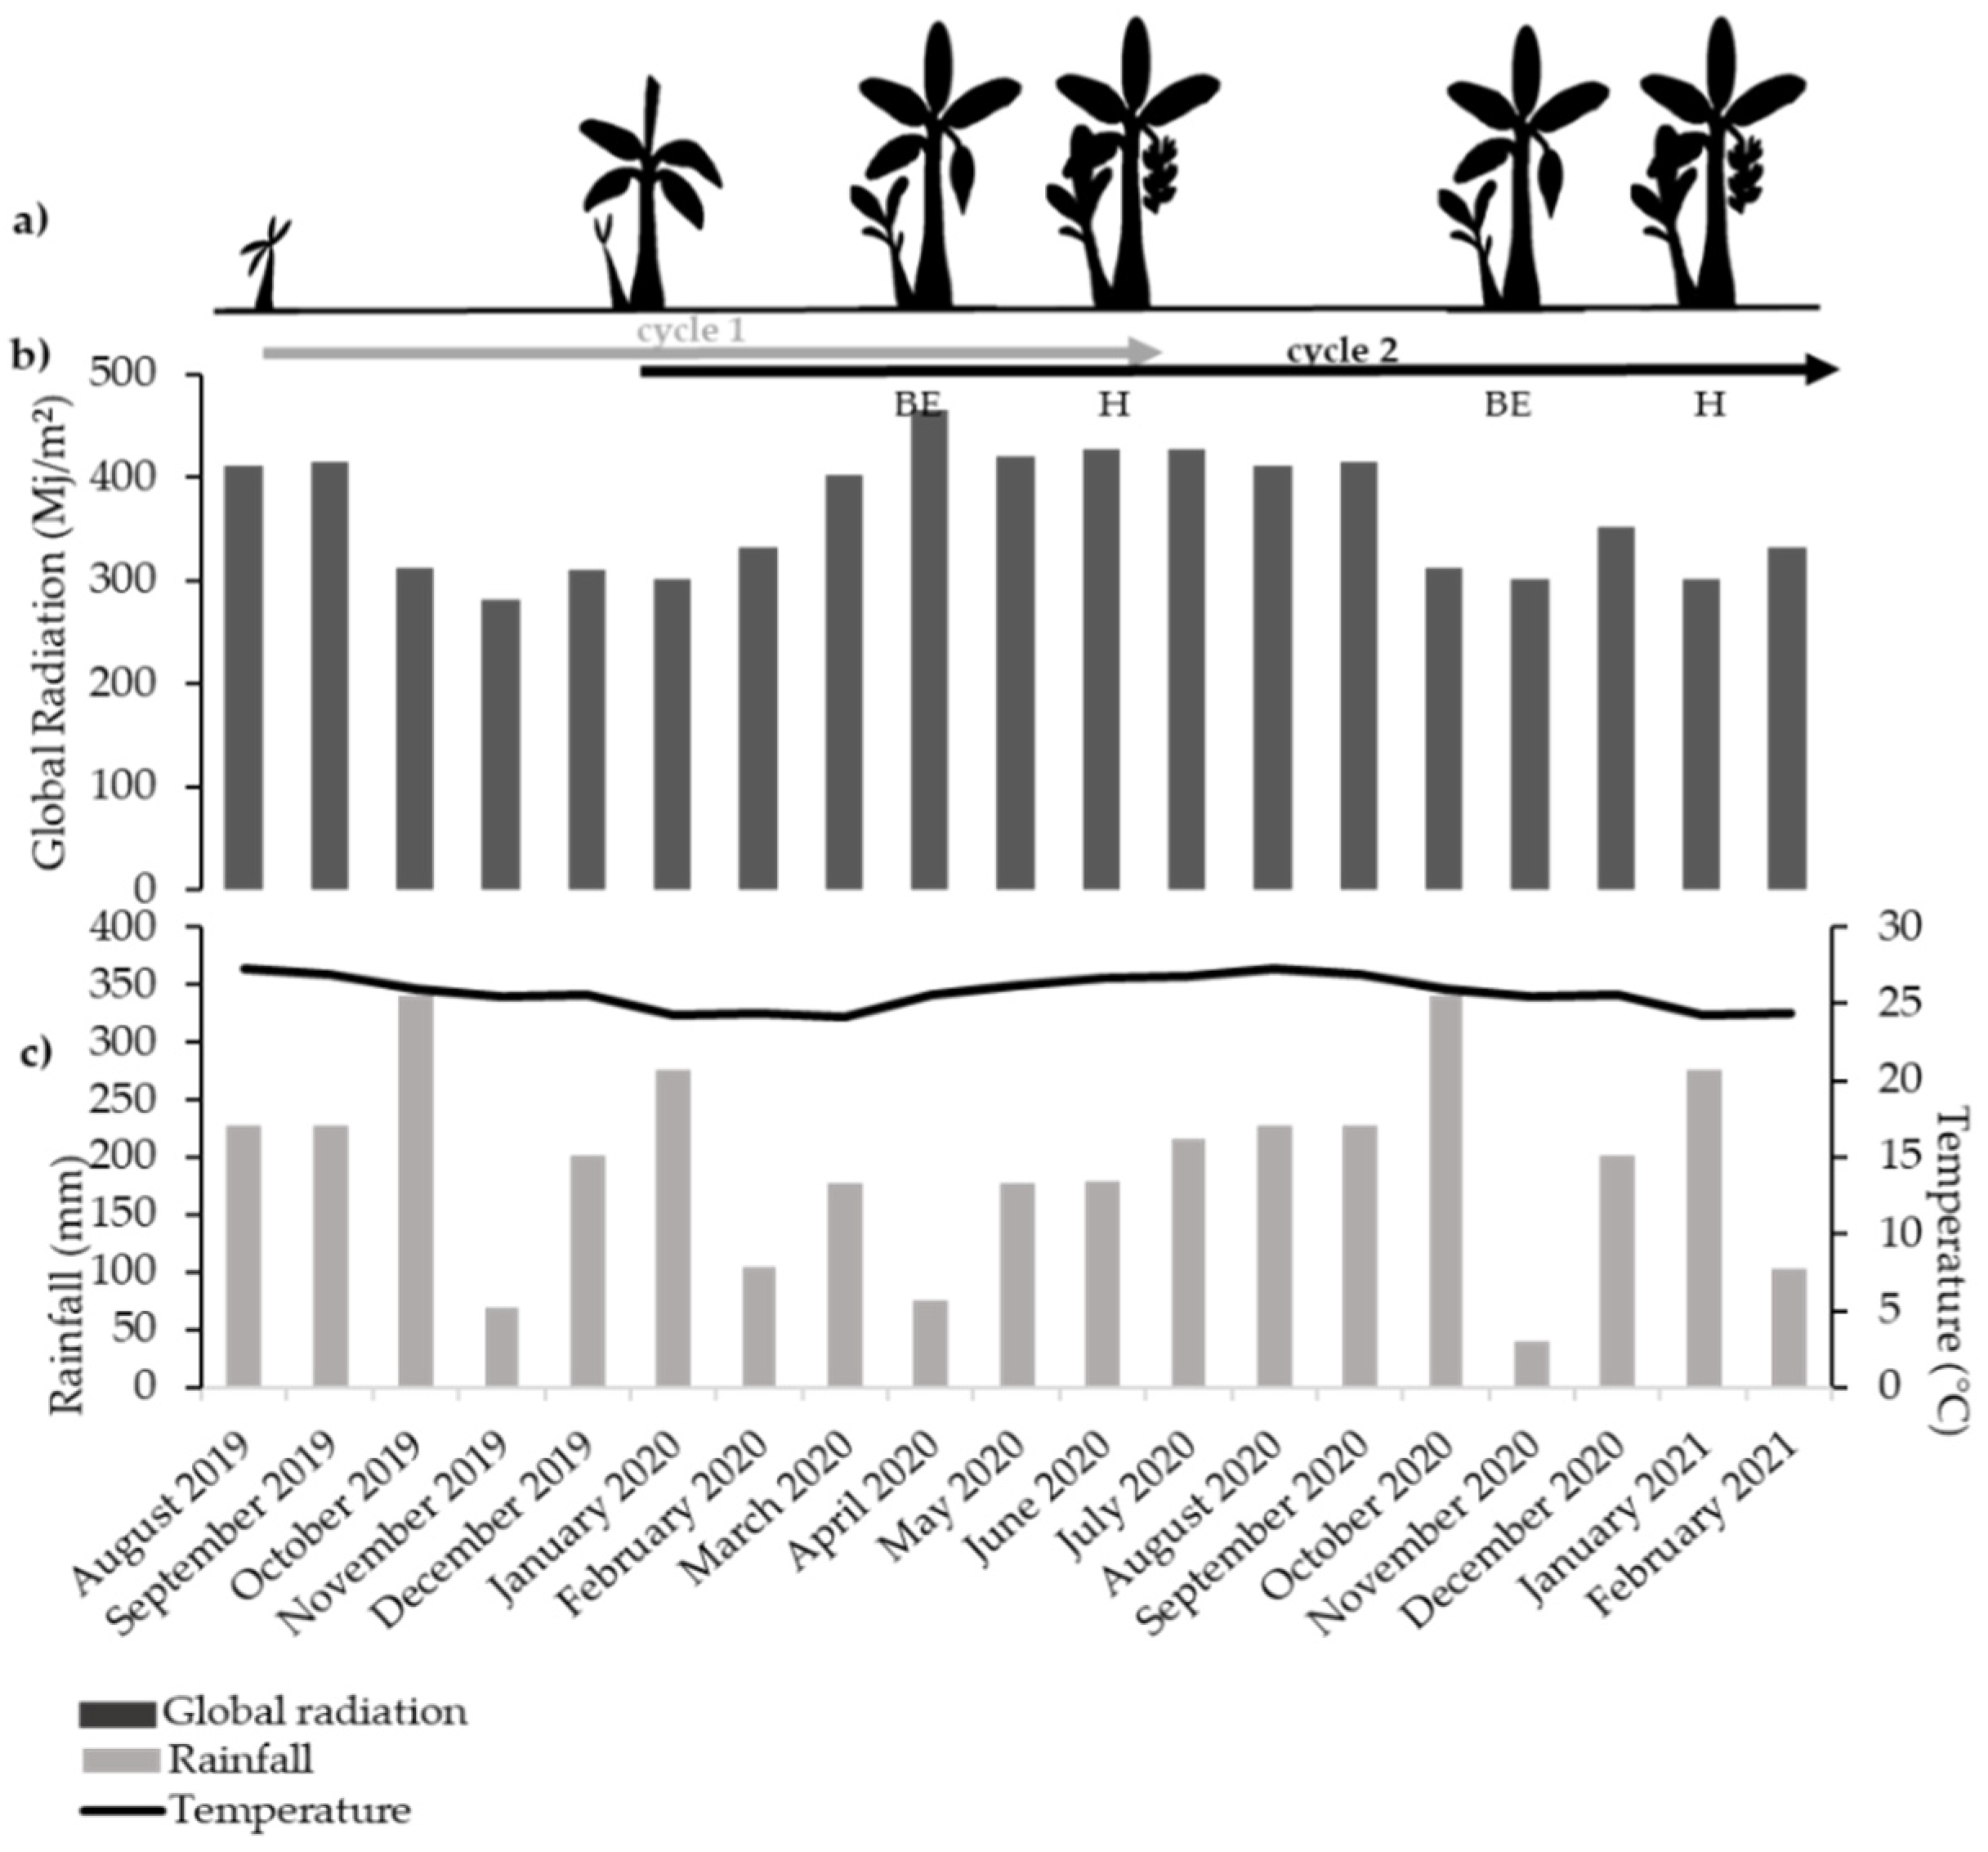
3.1. Climatic Conditions of the Experiment

As shown in Figure 1, in line with the differences in day length, we observed periods of low Rg from October to March and periods of higher Rg from April to September. For the first cycle, growth of the vegetative part (from planting to bunch emergence) occurred during a low Rg period whereas fruit growth occurred during a high Rg period. Conversely, for the second cycle, growth of the vegetative part occurred during a high Rg period whereas fruit growth occurred during a low Rg period.

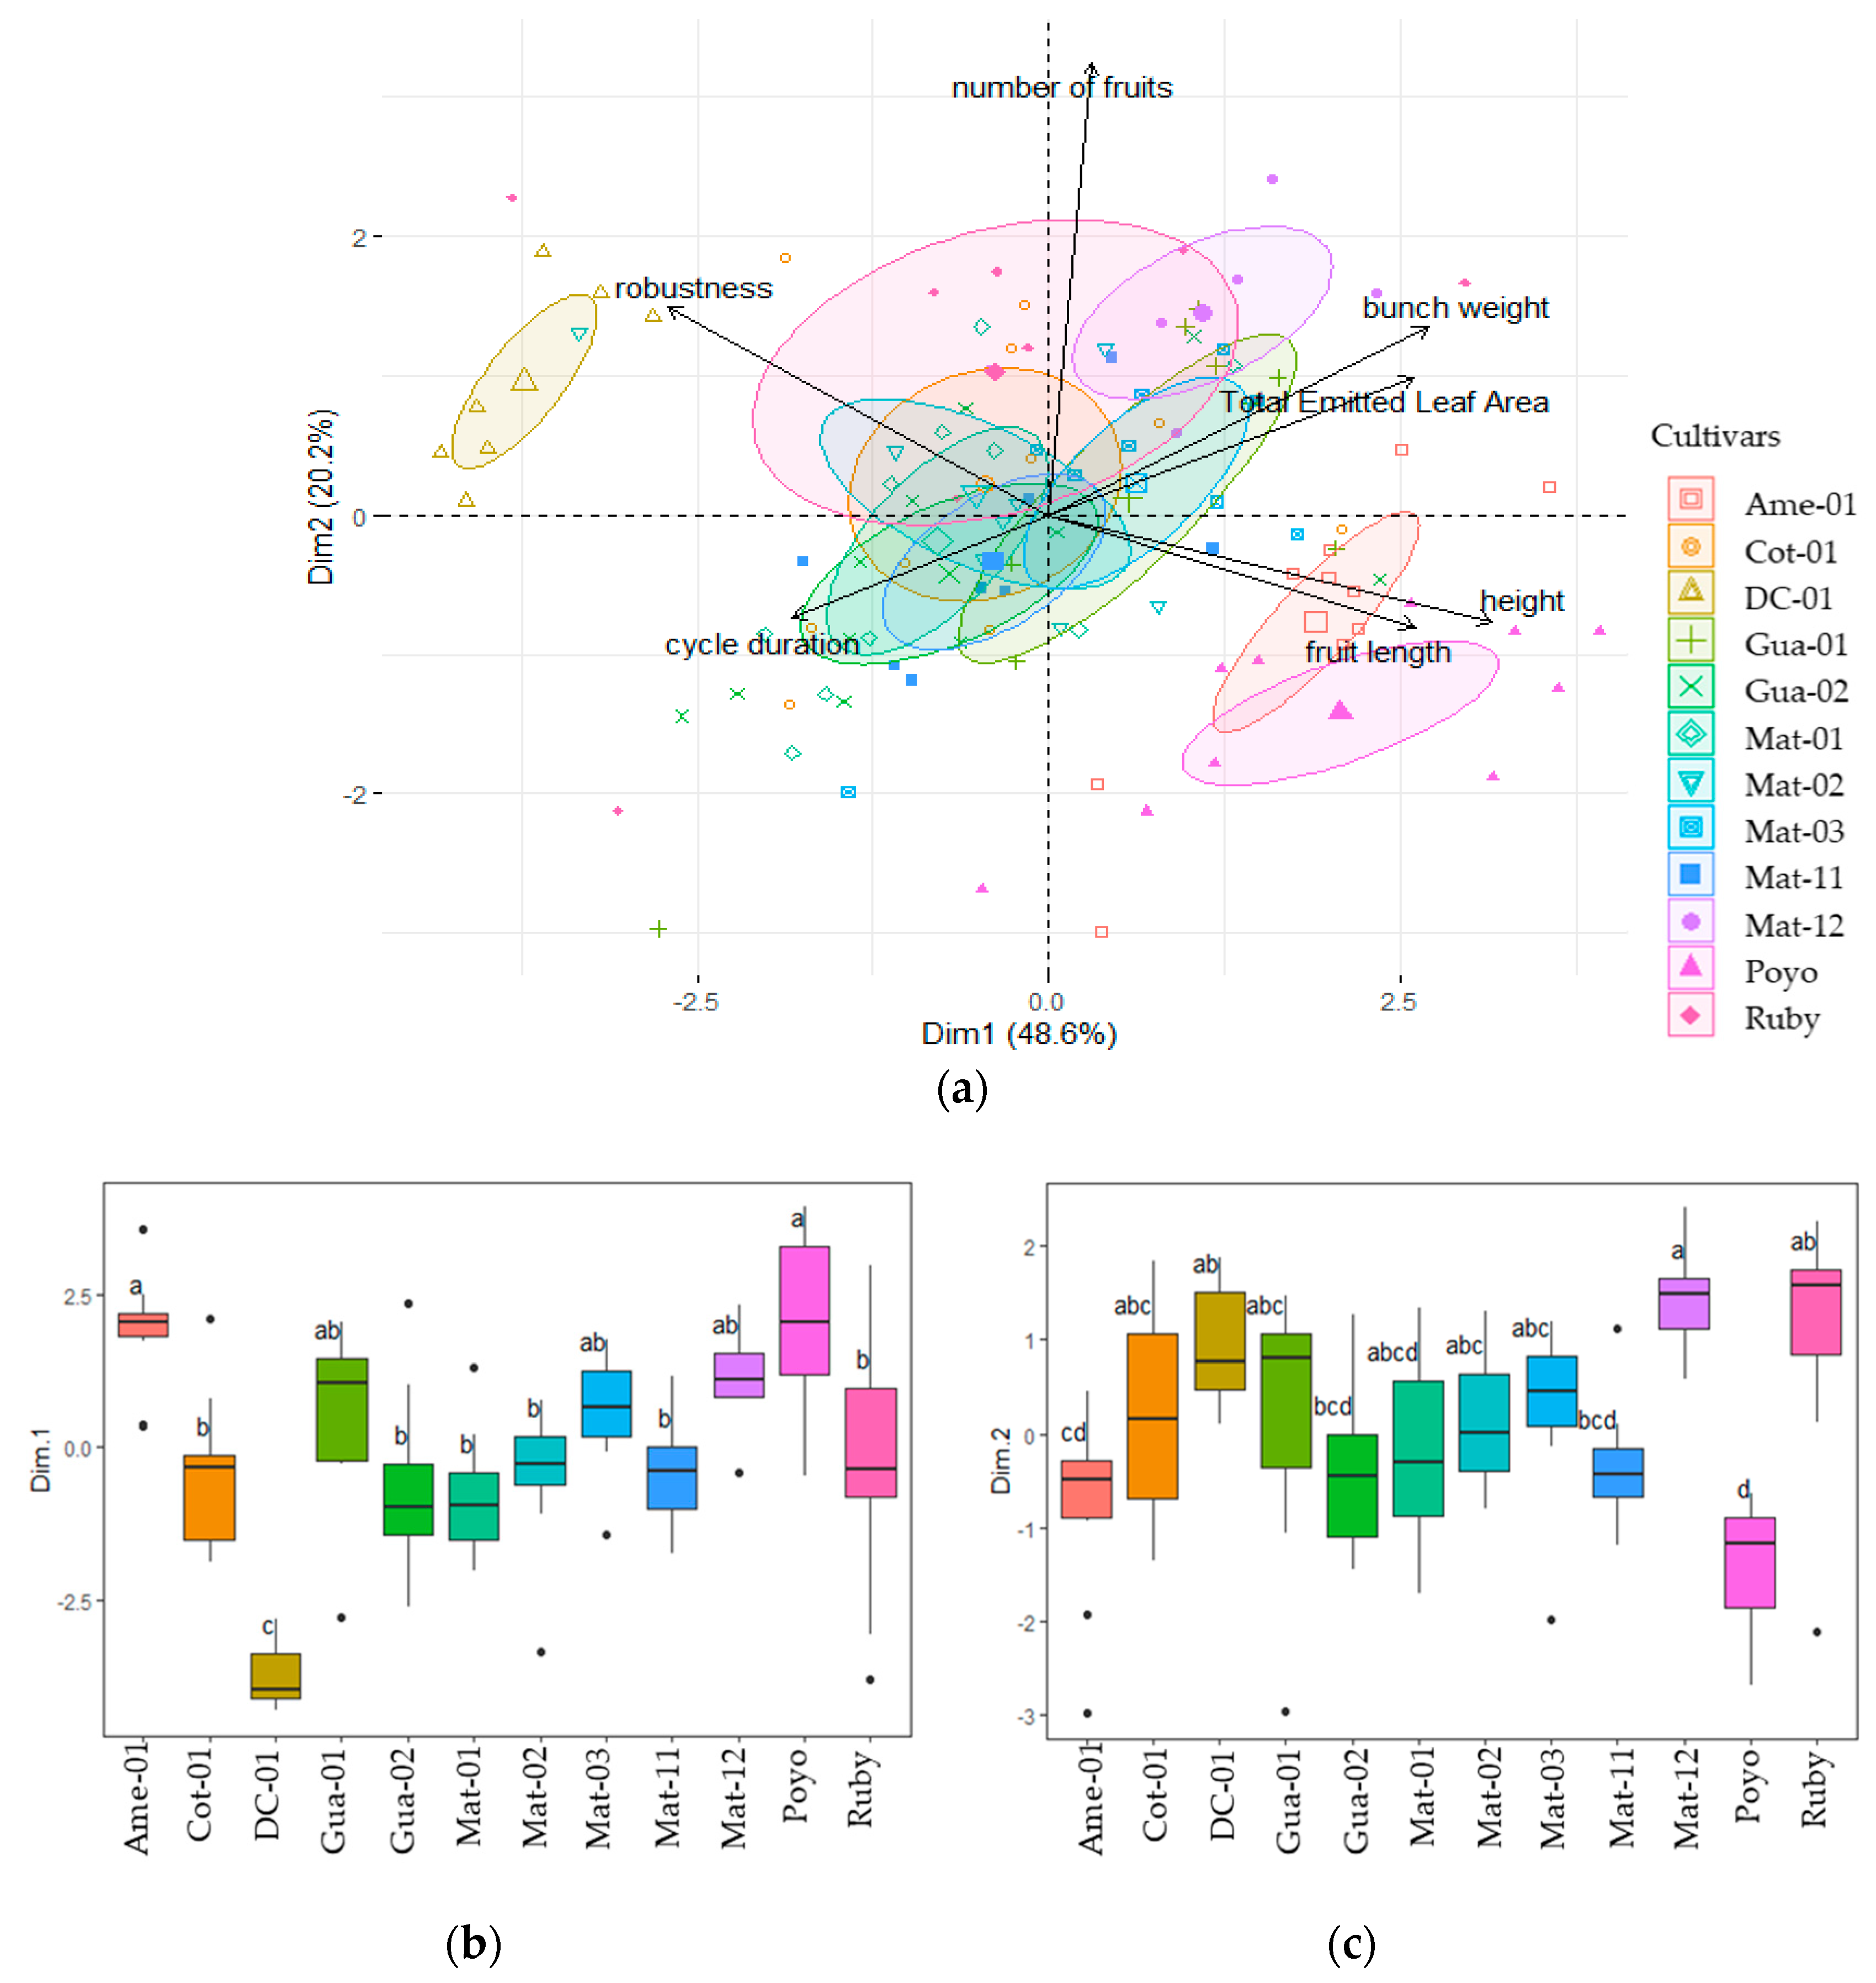
3.2. Multivariate Analysis of Descriptive Variables

3.2.1. First Cycle

Dimensions 1 and 2 explained 73% of the variance of the seven descriptive variables (Figure 2a). Bunch weight and cycle duration, respectively, contributed 28% and 20% to dimension 1, while pseudostem height and robustness, respectively, contributed 38% and 24% to dimension 2. This figure shows three clusters of cultivars: ‘Poyo’, ‘DC-01’ and the other cultivars. These clusters differed significantly on both axes, mainly in terms of their height and robustness (Figure 2b,c). ‘Poyo’ was the tallest and least robust cultivar, whereas ‘DC-01’ was the smallest and most robust. The other cultivars had intermediate height and robustness. Note that bunch weight was positively correlated with the cycle duration, fruit number and fruit length (Figure 2a).

3.2.2. Second Cycle

Dimensions 1 and 2 explained 68% of the variance of the seven descriptive variables (Figure 3a). Height and robustness, respectively, contributed 25% and 18% to dimension 1. Fruit number contributed 62% to dimension 2. The figure shows three clusters which significantly differed on dimension 1 (Figure 3b): ‘Poyo’ and ‘Ame-01’ were the tallest and least robust cultivars, ‘DC-01’ was the smallest and most robust, while the other cultivars exhibited intermediate height and robustness. Note that these clusters corresponded to the three Cavendish types, i.e., Robusta, Giant and Dwarf Cavendish. For this cycle, the bunch weight was positively correlated with the TELA, negatively correlated with the cycle duration and was independent of the fruit number (Figure 3a).

3.3. Bunch Characteristics and Cycle Duration

The bunch characteristics of the two cycles are compared in Table 1. For all cultivars, the bunch weight decreased from the first to second cycle. Note that these bunch weight variations from the first to the second cycle were particularly marked for ‘DC-01’ (−50%), which exhibited the heaviest bunches in the first cycle and the lightest in the second cycle. In contrast, we only observed a slight decrease in bunch weight with ‘Poyo’ (−3.5%), which produced some of the smallest bunches in the first cycle and some of the heaviest in the second cycle.
Concerning the fruit number, there were significant differences between cultivars. In the first cycle, ‘DC-01’ had the highest fruit number, while ‘Poyo’ had the fewest. In the second cycle, ‘Mat-12’ and ‘Ruby’ had the highest fruit number, and ‘Poyo’ had the fewest. For all cultivars, the fruit number increased from the first to the second cycle, with a mean increase of 50%. ‘Mat-12’ exhibited the highest increase (+66%) and ‘DC-01’ the lowest (+19%).
However, despite the increased fruit number, the indicator of individual fruit weight (Indfw) of the 12 cultivars decreased from the first to the second cycle. The Indfw decrease was not offset by the increased fruit number and resulted in a decreased bunch weight in the 12 cultivars. Note that in the second cycle, the cultivars with the smallest Indfw (‘Mat-12’, ‘Ruby’ and ‘DC-01’) had the highest fruit number.
The first cycle duration (interval between planting and the first cycle harvest) and second cycle duration (interval between the first cycle harvest and the second cycle harvest) are shown in Table 1. We only observed significant differences in the first cycle. ‘DC-01’ had the longest first cycle duration (335 days) while ‘Mat-02’ had the shortest (295 days).

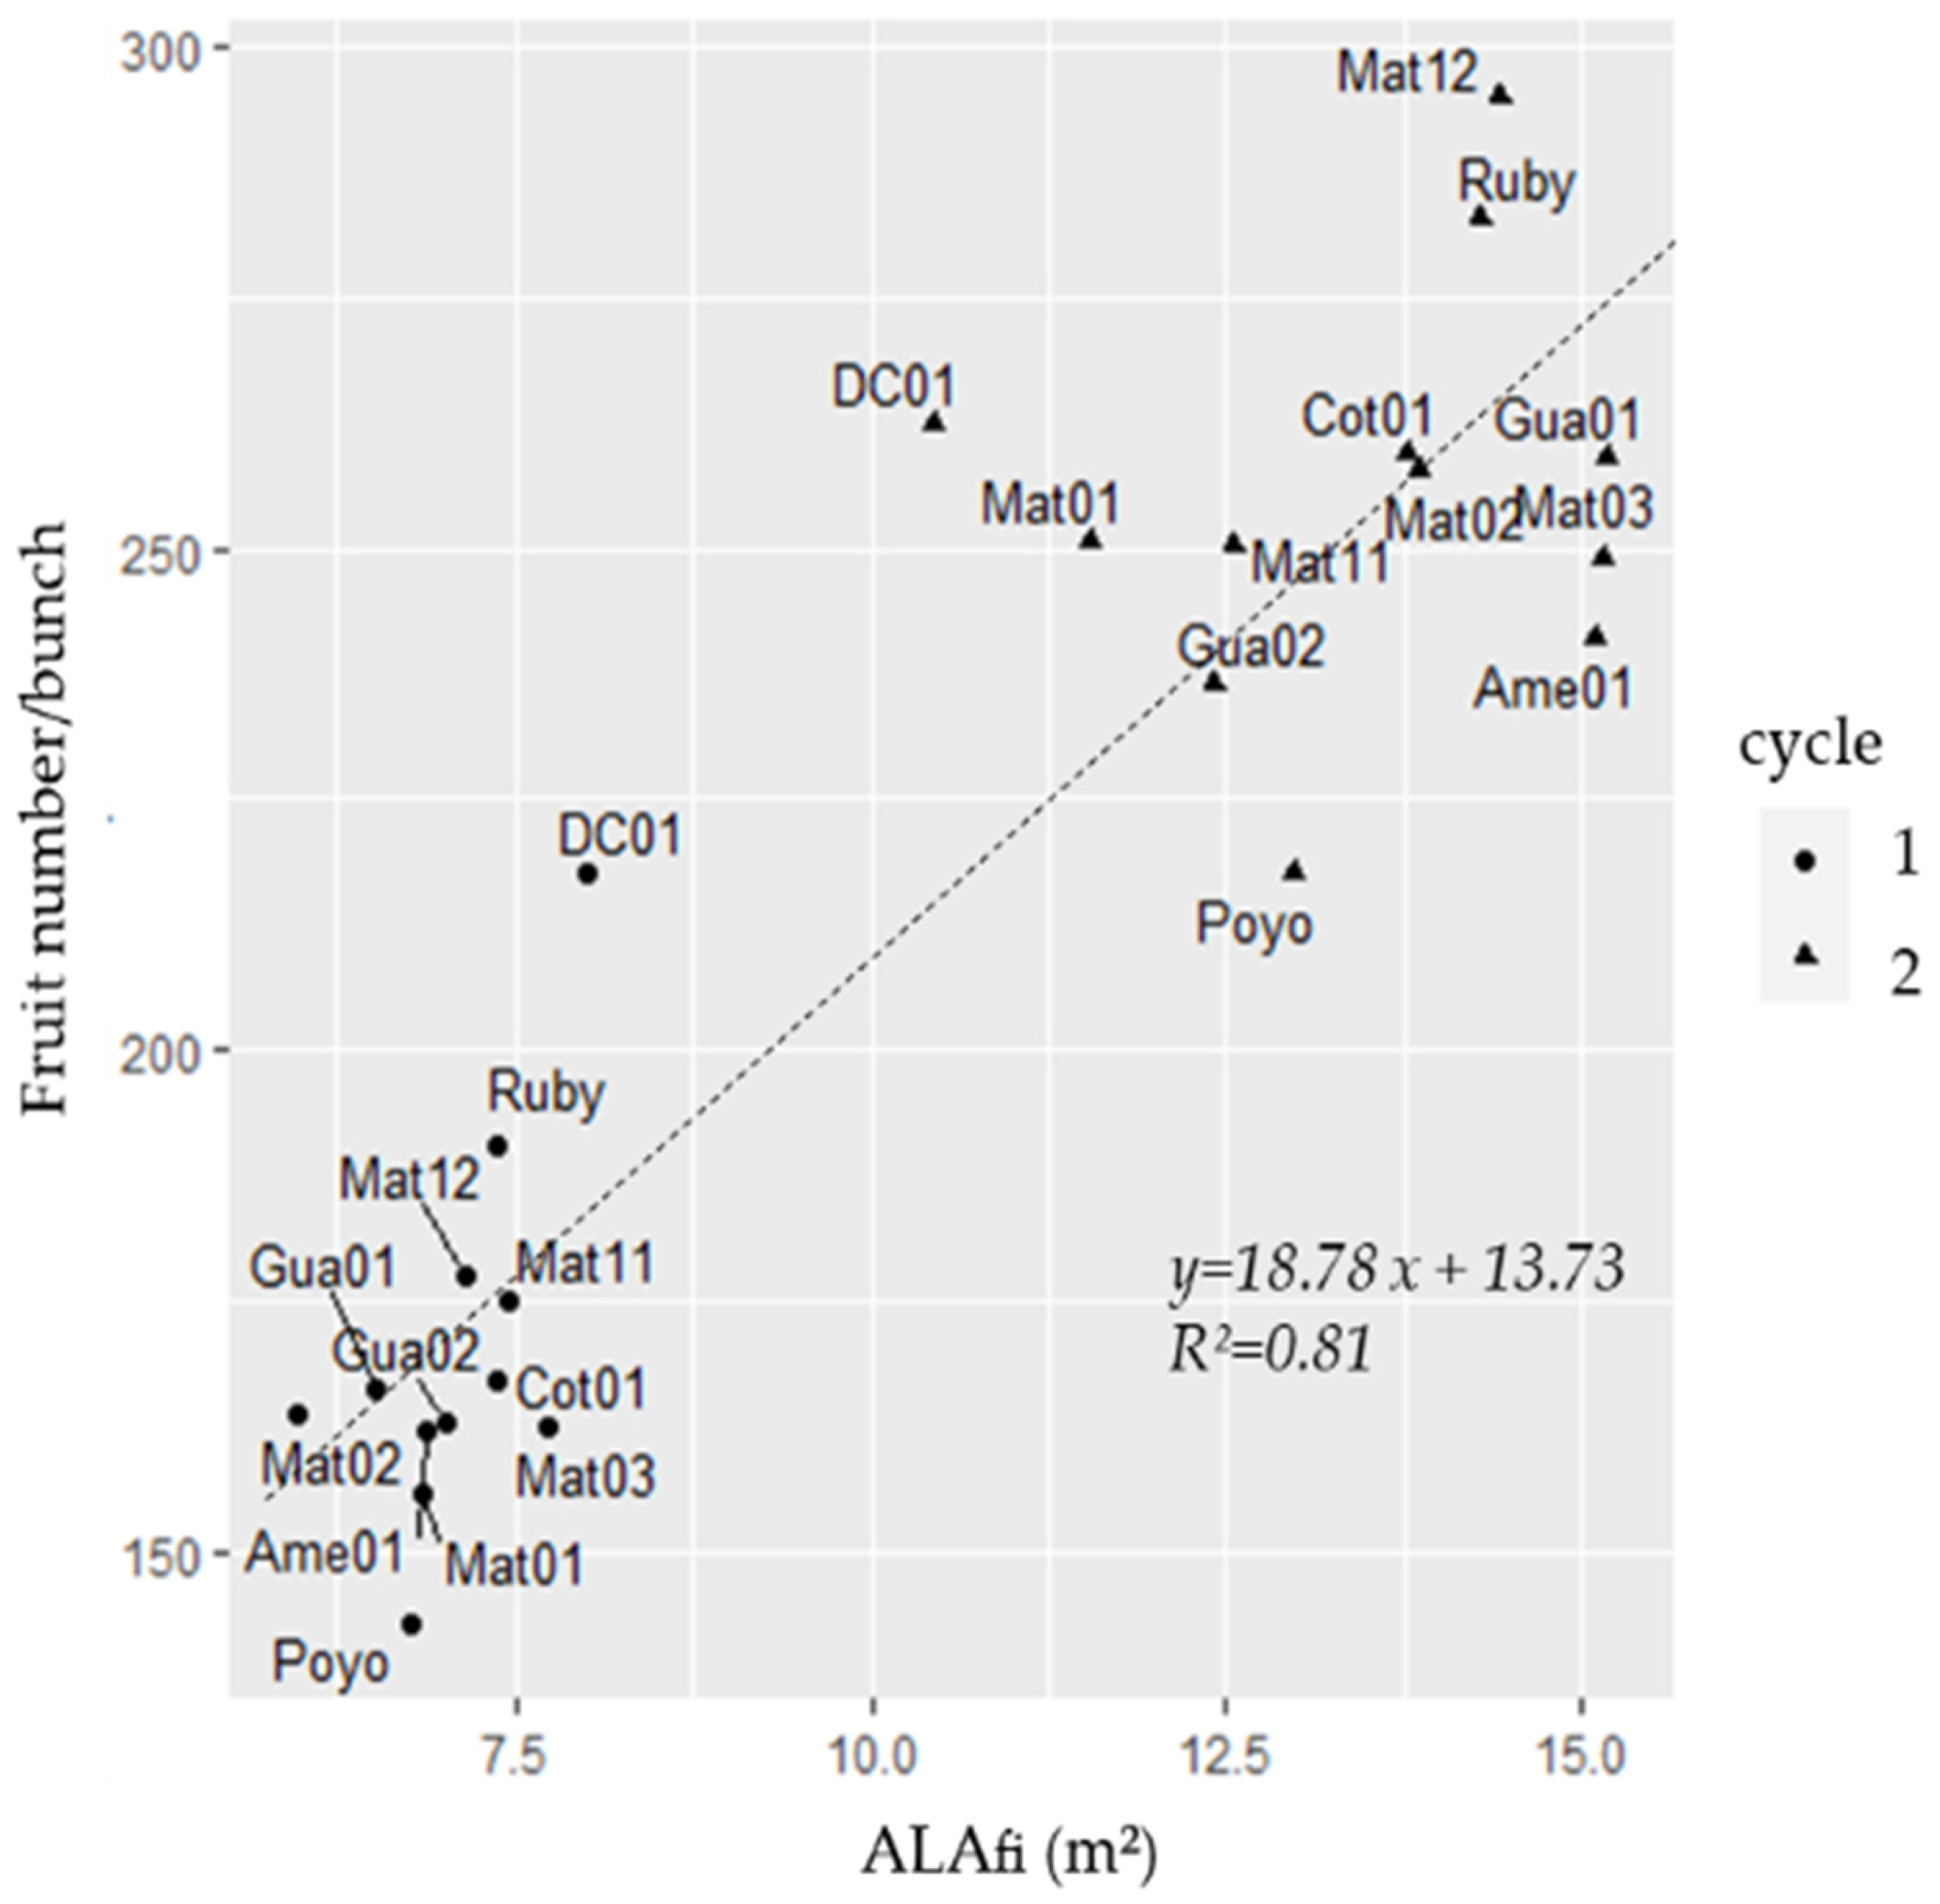
3.4. Fruit Number Determination According to the Fruit Number/ALAfi Ratio

The fruit number as a function of the ALAfi for each cultivar and both cycles is presented in Figure 4. We observed a positive linear correlation between the fruit number and ALAfi (R2 = 0.81).
ALAfi was significantly different between cultivars for both cycles (p < 0.01). As shown in Table 2, the fruit number/ALAfi ratio also presented significant differences between cultivars for both cycles. In the first cycle, ‘DC-01’ and ‘Mat-02’ had the highest fruit number/ALAfi ratio, whereas ‘Poyo’ and ‘Mat-03’ had the lowest. In the second cycle, ‘DC-01’ also had the highest ratio due to its significantly lower ALAfi, whereas ‘Mat-03’ and ‘Ame-01’ had the lowest ratio due to their significantly higher ALAfi.
Note that the mean increase in ALAfi from the first to the second cycle (84%) was higher than the mean increase in fruit number (50%), thereby explaining the decrease in the fruit number/ALAfi ratio from the first to the second cycle.

3.5. Biomass Allocated to the Bunch: Source-Sink Balance, Carbohydrate Reserves and Bunch-Sucker Biomass Partitioning

We characterized the source-sink balance from bunch emergence to harvest by monitoring the leaf area between bunch emergence and harvest (source) as a function of the fruit number/bunch (sink) (Figure 5). We observed differences between cycles, as the cultivars had higher source in the first cycle than in the second, with a mean source of 791 m2 and 670 m2, respectively. Hence, as the fruit number increased from the first to the second cycle, the source-sink balance decreased markedly from the first to the second cycle. Moreover, we observed differences in the source-sink balance between cultivars. Indeed, in both cycles, ‘Poyo’ appeared to have a high source-sink balance, with a small fruit number, whereas ‘DC-01’, ‘Ruby’ and ‘Mat-12’ had a low source-sink balance with a high fruit number.
We monitored Vps and Vc to estimate the carbohydrate reserves. For Vc, ANOVA revealed no significant differences between cultivars (p > 0.05). Conversely, for Vps, ANOVA showed significant differences between cultivars, with ‘Mat-12’ having the highest Vps in both cycles (Table 3). In the second cycle, ‘Mat-03’ and ‘Ame-01’ also had significantly higher Vps than the rest of the cultivars. ‘Mat-02’ had the smallest Vps in the first cycle and ‘DC-01’ in the second cycle.
The mean Vps increased from the first to the second cycle, due to the tallest plant with the highest growth being in the second cycle. Those differences of height and growth explained the mean ALAfi increase from the first to the second cycle that we observed. However, note that the ALAfi was independent of the source during the fruit growth. This explained why, despite the higher ALAfi in the second cycle, the bunch weight decreased from the first to the second cycle because of the source decrease during the fruit growth.

4. Discussion

4.1. Bunch Weight in Source- vs. Sink-Limiting Conditions

In the first cycle, the bunch weights were positively correlated with the fruit number, suggesting that in the first cycle the bunch weights were limited by the fruit number, i.e., the bunch sink potential. In this case, cultivars such as ‘Poyo’ with a low fruit number in the bunch had the lightest bunches. In contrast, cultivars such as ‘DC-01’ with a high fruit number in the bunch had the heaviest bunches.
In the second cycle, we observed that the bunch weight was positively correlated with the TELA. This suggests that the bunch weight was limited by the source strength of the leaves. Climatic conditions and foliar disease pressure differed between the first and the second cycle. In the second cycle, the severe sanitary deleafing and the reduced Rg during the bunch-filling period lowered the source from bunch emergence to harvest. This explained the lower bunch weight that we measured in the second cycle compared to the first cycle. In these conditions, bunches produced by cultivars such as ‘DC-01’ with a low source-sink balance were highly impacted and were the lightest. On the contrary, ‘Poyo’, a cultivar with a high source-sink balance and a low number of fruits, was less impacted by the source decrease during the second cycle.
Differences in influence of the source-sink balance of the plant on its yield had previously not been measured in banana cultivars, but they have been described in tomatoes with similar results by Li et al. [19]. In this latter study, the authors showed that when sources were not limiting and when the yield was only limited by the sink strength, the best yields (at the plant scale) were obtained with large-fruit tomato varieties (high sink strength). Conversely, under source-limiting conditions, the best yields at the plant scale were obtained with a small-fruit variety (low sink strength). In source-limiting conditions, plants with low sink strength perform better than plants with high sink strength. The source-sink balance could be altered by fruit pruning or bloom abortion, which may reduce the final sink strength and favor fruit growth, as described in oil palm, canola, peach and soybean [20,21,22,23]. Source-sink management is already commonly mainstreamed in banana cultural practices with the ablation of male buds [24] and the last hands of the bunch [25].
Moreover, factors other than the source-sink balance could be involved in fruit growth under source-limiting conditions. Those factors could be related to compensatory mechanisms in response to source decreases [26]. Indeed, Robinson et al. [27] observed an increase in the CO2 assimilation rate in response to leaf removal in banana, in turn suggesting an increase in the net photosynthesis rate [28]. Moreover, Daniells et al. [24] observed an increase in the bunch-filling period when they applied severe defoliation.

4.2. Bunch Weight and Fruit Number Determination

We found differences between cultivars in fruit number and individual fruit weight in the second crop cycle. ‘DC-01’, ‘Mat-12’ and ‘Ruby’ had a high fruit number, but these cultivars also exhibited the smallest Indfw in the second cycle. In contrast, ‘Poyo’ had a low fruit number but the highest Indfw in the second cycle. The negative relation between Indfw and fruit number in the second cycle, which was source-limited, may be explained by the competition between fruits of the same bunch for assimilates [29]. However, we found no differences in terms of Indfw between the cultivars in the first cycle. This indicated that when the source was not limited, the cultivars had the same individual fruit weight and that the differences in terms of bunch weight were only due to the fruit number. Those findings showed that the fruit number was the main factor determining the bunch weight when the source was not limited.
In our study, the fruit number was positively correlated with ALAfi, which confirmed the findings of Ganry [13] showing that the growth potential at floral induction—which we assessed by ALAfi—was closely correlated with the fruit number and could be considered as a key determinant of fruit number. Moreover, we observed significant differences in the fruit number/ALAfi ratio between the cultivars. ‘Poyo’, ‘Ame-01’ and ‘Mat-03’ had a low ratio, whereas ‘DC-01’ exhibited a high ratio.
In his experiments, Ganry [13] also observed differences between Cavendish cultivars in terms of the fruit number to ALAfi ratio. He interpreted this as being due to a difference in floral meristem efficiency of fruit production. In cereal species, grain number determination, or so-called fruiting efficiency, involves a similar mechanism, as the grain number is dependent on the growth of vegetative parts during anthesis [30]. Studies on several species also described differences in fruiting efficiency between different cultivars: bread wheat [31], durum wheat and sorghum [32].

5. Conclusions

We validated our hypothesis as the bunch weight determination differed between cultivars due to differences in the source-sink balance. Moreover, those differences enabled us to identify cultivars of interest according to cropping systems. ‘DC-01’—a cultivar with a high fruit number/bunch—had a high bunch weight when the source was not limited. However, it was very sensitive to reductions in leaf photosynthetic production. This suggested that ‘DC-01’ was not adapted to agroecological cropping systems with sanitary deleafing or low nitrogen availability. In contrast, ‘Poyo’ produced small bunches with fewer fruits, but its bunch weight remained stable despite variations in light energy acquisition thanks to its high source-sink balance. This resilient cultivar could be of considerable interest for agroecological cropping systems, where the source may be reduced by the control of black Sigatoka disease with severe deleafing or by low nitrogen amount due to organic fertilizer and/or competitive live mulch. However, its high stature makes bunch care difficult, which is why this cultivar is less attractive for export-oriented banana production. ‘Ame-01’ and ‘Mat-03’ exhibited a low fruit number to ALAfi ratio, reflecting a low efficiency in fruit number development and a high pseudostem volume. Those cultivars had a high source-sink balance, high sources and high carbohydrate reserves. They should perform well in agroecological systems. ‘Mat-12’ exhibited a high bunch weight in different light resource acquisition conditions, along with a high fruit number. With its high pseudostem volume, ‘Mat-12’ had high carbohydrate reserves, which could offset source decreases due to sanitary deleafing. This cultivar could also be adapted to cropping systems involving low pesticide application conditions.

Author Contributions

Conceptualization, M.R. and M.D.; data curation, M.R.; formal analysis, M.R. and M.D.; funding acquisition, M.D.; investigation, M.R.; methodology, M.R. and M.D.; supervision, M.D.; validation, M.R. and M.D.; visualization, M.R.; writing—original draft, M.R.; writing—review and editing, M.D. All authors have read and agreed to the published version of the manuscript.

Funding

This work was funded by the European Regional Development Fund for the RIVAGE project. The research work was carried out in the framework of the CIFRE scheme, which is financed by the French Ministry of Higher Education, Research and Innovation.

Institutional Review Board Statement

Not applicable.

Informed Consent Statement

Not applicable.

Data Availability Statement

The experimental data of the trial are deposited on a Dataverse: https://doi.org/10.18167/DVN1/2GVORV.

Acknowledgments

We first thank Régis Ramassamy, technician at the CIRAD research station in Guadeloupe, for helping with field measurements and for the maintenance of the experimental field, Cyril Truc for helping with field measurements. Then, we thank Jérôme Saint-Marc, Rony Saint Hilaire and Dimitri Ramdaya, technicians at the CIRAD research station in Guadeloupe for the maintenance of the experimental field, and Mylène Ramassamy and Laura Peraire-Brudey, for their help in field and laboratory measurements. We also thank Vitropic SA for providing the planting material.

Conflicts of Interest

The authors declare no conflict of interest. The funders had no role in the design of the study; in the collection, analyses, or interpretation of data; in the writing of the manuscript, or in the decision to publish the results.

References

  1. Robinson, J.C.; Nel, D.J.; Eckstein, K. A Field Comparison of Ten Cavendish Sub-Group Banana Cultivars and Selections (Musa AAA) over Four Crop Cycles in the Subtropics. J. Hortic. Sci. 1993, 68, 511–521. [Google Scholar] [CrossRef]
  2. Stover, R.H. ’Valery’ and ’Grand Nain’: Plant and Foliage Characteristics and a Proposed Banana Ideotype. Trop. Agric. Trinidad 1982, 59, 303–306. [Google Scholar]
  3. Risède, J.-M.; Achard, R.; Brat, P.; Chabrier, C.; Damour, G.; Guillermet, C.; de Lapeyre, L.; Loeillet, D.; Lakhia, S.; Meynard, P.; et al. Chapitre 6. La Transition Agro-Écologique Des Systèmes de Culture de Bananes Cavendish Aux Antilles Françaises. In La Transition Agro-Ecologiqes des Agricultures du Sud; Agricultures et défis du monde; Éditions Quæ: Versailles, France, 2019; p. 368. [Google Scholar]
  4. Simmonds, N.W. Varietal Identification in the Cavendish Group of Bananas. J. Hortic. Sci. 1956, 29, 81–86. [Google Scholar] [CrossRef]
  5. Stover, R.H. Variation and Cultivar Nomenclature in Musa, AAA Group, Cavendish Subgroup. Fruits 1988, 43, 353–357. [Google Scholar]
  6. Cabrera Cabrera, J.; Galán Saúco, V. Evaluation of the Banana Cultivars Zelig, Grande Naine and Gruesa under Different Environmental Conditions in the Canary Islands. Fruits 2005, 60, 357–369. [Google Scholar] [CrossRef]
  7. Eckstein, K.; Fraser, C.; Husselmann, J.; Temple Murray, N. The Evaluation of Promising New Banana Cultivars. Acta Hortic. 1998, 490, 57–69. [Google Scholar] [CrossRef]
  8. Fonsah, E.G.; Adamu, C.A.; Okole, B.N.; Mullinix, B.G. Field Evaluation of Cavendish Banana Cultivars Propagated Either by Suckers or by Tissue Culture, over Six Crop Cycles in the Tropics. Fruits 2007, 62, 205–212. [Google Scholar] [CrossRef] [Green Version]
  9. Galán Saúco, V.; Cabrera Cabrera, J.; Hernàndez, D.; Rodriguez Pastor, M.C. Evaluation of Medium-Height Cavendish Banana Cultivars under the Subtrpical Conditions of the Canary Islands. Acta Hortic. 1998, 490, 103–116. [Google Scholar] [CrossRef]
  10. Nuno, L.; Ribeiro, V.P.; Alcino da Silva, J. Preliminary Studies of Cavendish Banana Cultivars under the Edafoclimatic Conditions of Madeira Island. Acta Hortic. 1998, 490, 85–88. [Google Scholar] [CrossRef]
  11. Eckstein, K.; Robinson, J.C.; Davie, S.J. Physiological Responses of Banana (Musa AAA; Cavendish Sub-Group) in the Subtropics. III. Gas Exchange, Growth Analysis and Source-Sink Interaction over a Complete Crop Cycle. J. Hortic. Sci. 1995, 70, 169–180. [Google Scholar] [CrossRef]
  12. Jullien, A.; Munier-Jolain, N.G.; Malézieux, E.; Chillet, M.; Ney, B. Effect of Pulp Cell Number and Assimilate Availability on Dry Matter Accumulation Rate in a Banana Fruit [Musa sp. AAA Group ‘Grande Naine’ (Cavendish Subgroup)]. Ann. Bot. 2001, 88, 321–330. [Google Scholar] [CrossRef] [Green Version]
  13. Ganry, J. Le développement du bananier en relation avec les facteurs du milieu: Action de la température et du rayonnement d’origine solaire sur la vitesse de croissance des feuilles. Etude du rythme de développement de la plante. Fruits 1980, 35, 727–743. [Google Scholar]
  14. FAO. World Reference Base for Soil Resources 2014: International Soil Classification System for Naming Soils and Creating Legends for Soil Maps; FAO: Rome, Italy, 2014; ISBN 978-92-5-108369-7. [Google Scholar]
  15. Ganry, J. Détermination “in situ” du stade de transition entre la phase végétative et la phase florale chez le bananier, utilisant le “coefficient de vitesse de croissance des feuilles”. Essai d’interprétation de quelques processus de développement durant la période florale. Fruits 1977, 32, 373–386. [Google Scholar]
  16. Robinson, J.C.; Nel, D.J. Comparative Morphology, Phenology and Production Potential of Banana Cultivars “Dwarf Cavendish” and Williams’ in the Eastern Transvaal Lowveld. Sci. Hortic. 1985, 25, 149–161. [Google Scholar] [CrossRef]
  17. Stevens, B.; Diels, J.; Brown, A.; Bayo, S.; Ndakidemi, P.A.; Swennen, R. Banana Biomass Estimation and Yield Forecasting from Non-Destructive Measurements for Two Contrasting Cultivars and Water Regimes. Agronomy 2020, 10, 1435. [Google Scholar] [CrossRef]
  18. R Core Team. R: A Language and Environment for Statistical Computing; R Foundation for Statistical Computing: Vienna, Austria, 2018. [Google Scholar]
  19. Li, T.; Heuvelink, E.; Marcelis, L.F.M. Quantifying the Source–Sink Balance and Carbohydrate Content in Three Tomato Cultivars. Front. Plant Sci. 2015, 6, 416. [Google Scholar] [CrossRef] [Green Version]
  20. Kumar, M.; Rawat, V.; Rawat, J.M.S.; Tomar, Y.K. Effect of Pruning Intensity on Peach Yield and Fruit Quality. Sci. Hortic. 2010, 125, 218–221. [Google Scholar] [CrossRef]
  21. Pallas, B.; Mialet-Serra, I.; Rouan, L.; Clément-Vidal, A.; Caliman, J.-P.; Dingkuhn, M. Effect of Source/Sink Ratios on Yield Components, Growth Dynamics and Structural Characteristics of Oil Palm (Elaeis Guineensis) Bunches. Tree Physiol. 2013, 33, 409–424. [Google Scholar] [CrossRef] [Green Version]
  22. Proulx, R.A.; Naeve, S.L. Pod Removal, Shade, and Defoliation Effects on Soybean Yield, Protein, and Oil. Agron. J. 2009, 101, 971–978. [Google Scholar] [CrossRef]
  23. Zhang, H.; Flottmann, S. Source-Sink Manipulations Indicate Seed Yield in Canola Is Limited by Source Availability. Eur. J. Agron. 2018, 96, 70–76. [Google Scholar] [CrossRef]
  24. Daniells, J.W.; Lisle, A.T.; Bryde, N.J. Effect of Bunch Trimming and Leaf Removal at Flowering on Maturity Bronzing, Yield, and Other Aspects of Fruit Quality of Bananas in North Queensland. Aust. J. Exp. Agric. 1994, 34, 259–265. [Google Scholar] [CrossRef]
  25. Meyer, J.-P. Influence de l’ablation de mains sur le rendement en poids des régimes de bananes par catégories de conditionnement aux Antilles. Fruits 1975, 30, 663–668. [Google Scholar]
  26. Ney, B.; Bancal, M.O.; Bancal, P.; Bingham, I.J.; Foulkes, J.; Gouache, D.; Paveley, N.; Smith, J. Crop Architecture and Crop Tolerance to Fungal Diseases and Insect Herbivory. Mechanisms to Limit Crop Losses. Eur. J. Plant Pathol. 2013, 135, 561–580. [Google Scholar] [CrossRef]
  27. Robinson, J.C.; Anderson, T.; Eckstein, K. The Influence of Functional Leaf Removal at Flower Emergence on Components of Yield and Photosynthetic Compensation in Banana. J. Hortic. Sci. 1992, 67, 403–410. [Google Scholar] [CrossRef]
  28. Turner, D.W.; Fortescue, J.A.; Thomas, D.S. Environmental Physiology of the Bananas (Musa spp.). Braz. J. Plant Physiol. 2007, 19, 463–484. [Google Scholar] [CrossRef]
  29. Jullien, A.; Malézieux, E.; Michaux-Ferrière, N.; Chillet, M.; Ney, B. Within-Bunch Variability in Banana Fruit Weight: Importance of Developmental Lag Between Fruits. Ann. Bot. 2001, 87, 101–108. [Google Scholar] [CrossRef] [Green Version]
  30. Garcia, A.L.; Savin, R.; Slafer, G.A. Fruiting Efficiency Differences between Cereal Species. Field Crops Res. 2019, 231, 68–80. [Google Scholar] [CrossRef]
  31. Elía, M.; Savin, R.; Slafer, G.A. Fruiting Efficiency in Wheat: Physiological Aspects and Genetic Variation among Modern Cultivars. Field Crops Res. 2016, 191, 83–90. [Google Scholar] [CrossRef]
  32. Van Oosterom, E.J.; Hammer, G.L. Determination of Grain Number in Sorghum. Field Crops Res. 2008, 108, 259–268. [Google Scholar] [CrossRef]
Figure 1. Climatic conditions and plantation stages during the experiment. (a) Banana development phases during two crop cycles; (b) monthly cumulative global radiation (Rg); (c) monthly cumulative rainfall and average daily temperature. BE: bunch emergence; H: harvest.
Agronomy 12 00333 g001
Figure 2. (a) Principal component analysis (PCA) performed on seven descriptive variables for the first cycle (95% confidence ellipse). For each cultivar, the largest symbol corresponds to the cultivar average position on both dimensions. (b) Cultivar coordinates on dimension 1. (c) Cultivar coordinates on dimension 2. Different letters indicate significant differences according to a Tukey test (α = 0.05).
Agronomy 12 00333 g002
Figure 3. (a) Principal component analysis (PCA) performed on seven descriptive variables for the first cycle (95% confidence ellipse). For each cultivar, the largest symbol corresponds to the cultivar average position on both dimensions. (b) Cultivar coordinates on dimension 1. (c) Cultivar coordinates on dimension 2. Different letters indicate significant differences according to a Tukey test (α = 0.05).
Agronomy 12 00333 g003
Figure 4. Fruit number according to the active leaf area at floral induction (ALAfi). For more visibility, cultivars are represented on the figure by their average value/cycle.
Agronomy 12 00333 g004
Figure 5. Sum of the active leaf area from bunch emergence to harvest (source) as a function of the fruit number (sink). For more visibility, cultivars are represented on the figure by their average value/cycle.
Agronomy 12 00333 g005
Table 1. Average yield components of the 12 cultivars: fruit number, indicator of individual fruit weight (Indfw), bunch weight and cycle duration.
CultivarsFruit NumberIndfw (cm3)Bunch Weight (kg)Cycle Duration (days)
Cycle 1Cycle 2Cycle 1Cycle 2Cycle 1Cycle 2Cycle 1Cycle 2
Ame-01162cd241cd257127ab35.9bcd28.1ab311bc195
Cot-01168c260abc253117ab36.5bcd27.2ab321ab198
DC-01220a262abc28589b46.4a23.3b335a216
Gua-01166c270abc255130ab36.0bcd30.8a312abc206
Gua-02163c236cd269117ab37.1bcd26.1ab321ab196
Mat-01156cd251abcd273115ab37.4bcd26.3ab317abc221
Mat-02162cd258abcd232112ab31.1d26.7ab295c215
Mat-03163cd249bcd245134ab34.9cd29.5ab306bc199
Mat-11175bc250abcd277130ab41.0abc28.0ab313abc224
Mat-12177bc295a26699b42.2ab32.5a320abc193
Poyo143d218d240153a32.2d31.1a309bc191
Ruby190bc283ab221105b37.3bcd27.9ab321ab198
p-value******n.s.**********n.s
Indfw was calculated as the volume of a cylinder whose diameter and length were those of the fruit. ANOVA: n.s.: non-significant; **: p < 0.01; ***: p < 0.001. If p < 0.05, different letters indicate that the average values are significantly different (Tukey test, α < 0.05).
Table 2. Average fruit number/ALAfi ratio of the 12 cultivars.
CultivarsFruit Number/ALAfi
(Fruit Number/m2)
Cycle 1Cycle 2
Ame-0124.0ab16.0c
Cot-0123.0ab19.2bc
DC-0128.0a25.6a
Gua-0126.7ab18.6bc
Gua-0223.5ab19.2bc
Mat-0123.2ab21.2ab
Mat-0228.4a18.9bc
Mat-0321.7b15.8c
Mat-1123.7ab19.9bc
Mat-1225.5ab19.6bc
Poyo21.2b17.0bc
Ruby26.3ab20.0bc
p-value*****
ANOVA: n.s.: non-significant; **: p < 0.01; ***: p < 0.001. If p < 0.05, different letters indicate that the average values are significantly different (Tukey test, α < 0.05).
Table 3. Average pseudostem volume at bunch emergence (Vps), sucker pseudostem volume at the parent plant harvest (Vpsr) and bunch weight/Vpsr ratio of the 12 cultivars.
CultivarsVps (dm3)Vpsr (dm3)Bunch Weight/Vpsr (kg/dm3)
Cycle 1Cycle 2Cycle 1Cycle 2Cycle 1Cycle 2
Ame-0193.9ab169.6a40.5ab80.1ab0.93cd0.41abc
Cot-0181.3ab142.5abc34.4ab53.3bc1.19abcd0.59ab
DC-0188.6ab109.7c24.6b44.6c2.04ab0.64a
Gua-0192.1ab148.6abc38.7ab83.3ab1.01bcd0.39abc
Gua-0286.1ab143.1abc35.5ab64.2abc1.16bcd0.45abc
Mat-0189.7ab131.7bc23.2b62.8abc2.22a0.44abc
Mat-0280.2b149.2ab31.3ab71.1abc1.14bcd0.41abc
Mat-0397.0ab168.8a47.1a92.2a0.80d0.37bc
Mat-1191.3ab131.2bc26.8b59.0abc1.88ab0.52abc
Mat-12102.7a171.8a45.3ab87.5ab1.03bcd0.38abc
Poyo97.5ab151.9ab39.6ab91.6a0.99bcd0.36c
Ruby91.4ab136.8abc49.7a75.6abc0.86d0.41abc
p-value***************
ANOVA: n.s.: non-significant; *: p ≤ 0.05; **: p < 0.01; ***: p < 0.001. If p < 0.05, different letters indicate that the average values are significantly different (Tukey test, α < 0.05).
Publisher’s Note: MDPI stays neutral with regard to jurisdictional claims in published maps and institutional affiliations.

