Article

A Simple, Semi-Automated, Gravimetric Method to Simulate Drought Stress on Plants

by
Dilrukshi Kombala Liyanage
,
Ishan Chathuranga
,
Boyd A. Mori
and
Malinda S. Thilakarathna
*
Department of Agricultural, Food and Nutritional Science, University of Alberta, Edmonton, AB T6G 2P5, Canada
*
Author to whom correspondence should be addressed.
Agronomy 2022, 12(2), 349; https://doi.org/10.3390/agronomy12020349
Submission received: 24 November 2021 / Revised: 13 January 2022 / Accepted: 27 January 2022 / Published: 29 January 2022
(This article belongs to the Special Issue Drought Resistance Mechanisms in Crops)

Abstract

:
Drought is a major constraint of global crop production. Given that drought-induced crop losses can threaten world food security, it has been and continues to be the focus of a large body of interdisciplinary research. Most drought experiments are conducted under controlled environmental conditions, where maintaining accurate soil moisture content is critical. In this study, we developed a simple, Arduino microcontroller-based, semi-automated, lysimeter that uses the gravimetric method to adjust soil moisture content in pot experiments. This method employs an Arduino microcontroller interfaced with a balance as part of a portable lysimeter and irrigation system which can weigh and record the mass of plants growing in pots, determine water loss due to evapotranspiration, and adjust soil moisture automatically to a desired relative soil water content. The system was validated with a greenhouse pot experiment using a panel of 50 early-maturity Canadian soybean varieties. Drought was induced in the experiment by adjusting soil moisture content to 30% field capacity while maintaining control pots at 80%. Throughout the experiment, the two moisture levels were efficiently maintained using the Arduino-based lysimeter. Plant physiological responses confirmed that plants in the drought treatment were under physiological stress. This semi-automated lysimeter is low-cost, portable, and easy to handle, which allows for high-throughput screening.

1. Introduction

Drought is the foremost abiotic stress that reduces plant growth and crop production throughout the world [1,2]. As the world population is predicted to surpass 9.5 billion [3] and drought risk and severity are predicted to increase due to climate change [4], future global crop production will be under significant pressure to keep pace with food demand. To supply this demand, research on drought stress is needed to improve crop resiliency and increase food production.
A wide variety of interdisciplinary studies have shown that plants exhibit a vast array of mechanisms to tolerate drought stress [5,6,7,8,9,10,11]. However, to study these mechanisms it is crucial to accurately maintain soil moisture content [12]. As it is challenging to maintain precise soil moisture in the field, most drought experiments are conducted under controlled environmental conditions. Small pot or tube-based laboratory experiments are commonly used to explore plant drought stress [13,14,15,16,17] and numerous methods were developed to adjust soil moisture content including dual-probe heat pulse, electromagnetic (e.g., time-domain reflectometry (TDR) and time-domain transmission (TDT) techniques) and gravimetric methods [18,19,20,21,22,23,24,25]. However, the most popular, direct, and accurate method used to measure soil moisture content is the gravimetric method [24,26]. The usage of other indirect methods for measuring soil moisture content depends on accuracy, cost, response time, ease of installation, and durability of the instruments [26].
Gravimetric-based soil moisture content is the ratio of the mass of the moisture present in a soil sample to the dried soil sample mass [26]. Gravimetric methods are usually more time-consuming and labor-intensive than other methods, but there is no need for expensive equipment [24], and drawbacks can be reduced by integrating computer-based automation techniques along with computational methods [21,27]. Gravimetric-based methods are used to measure evapotranspiration in pot experiments and to adjust soil moisture content to target levels [21,27,28,29,30,31]. These methods involve frequently measuring the mass of pots and replacing transpired water to maintain a targeted soil moisture content [21,23,31]. However, the higher cost and complexity of the previous computer-based automated systems have limited their wider use for adjusting soil moisture levels in pot-based experiments.
Here, we developed a simple, low-cost, Arduino microcontroller-based lysimeter to gravimetrically adjust soil moisture content in pot experiments without the need for specialized facilities or equipment. The system measures soil moisture deficit and automatically adjusts the soil moisture content to a targeted level. We then demonstrated the effectiveness of this system with a drought experiment using a panel of 50 early-maturity Canadian soybean varieties. Ultimately, this system will reduce costs and help researchers efficiently conduct drought-related experiments.

2. Materials and Methods

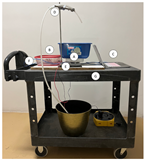
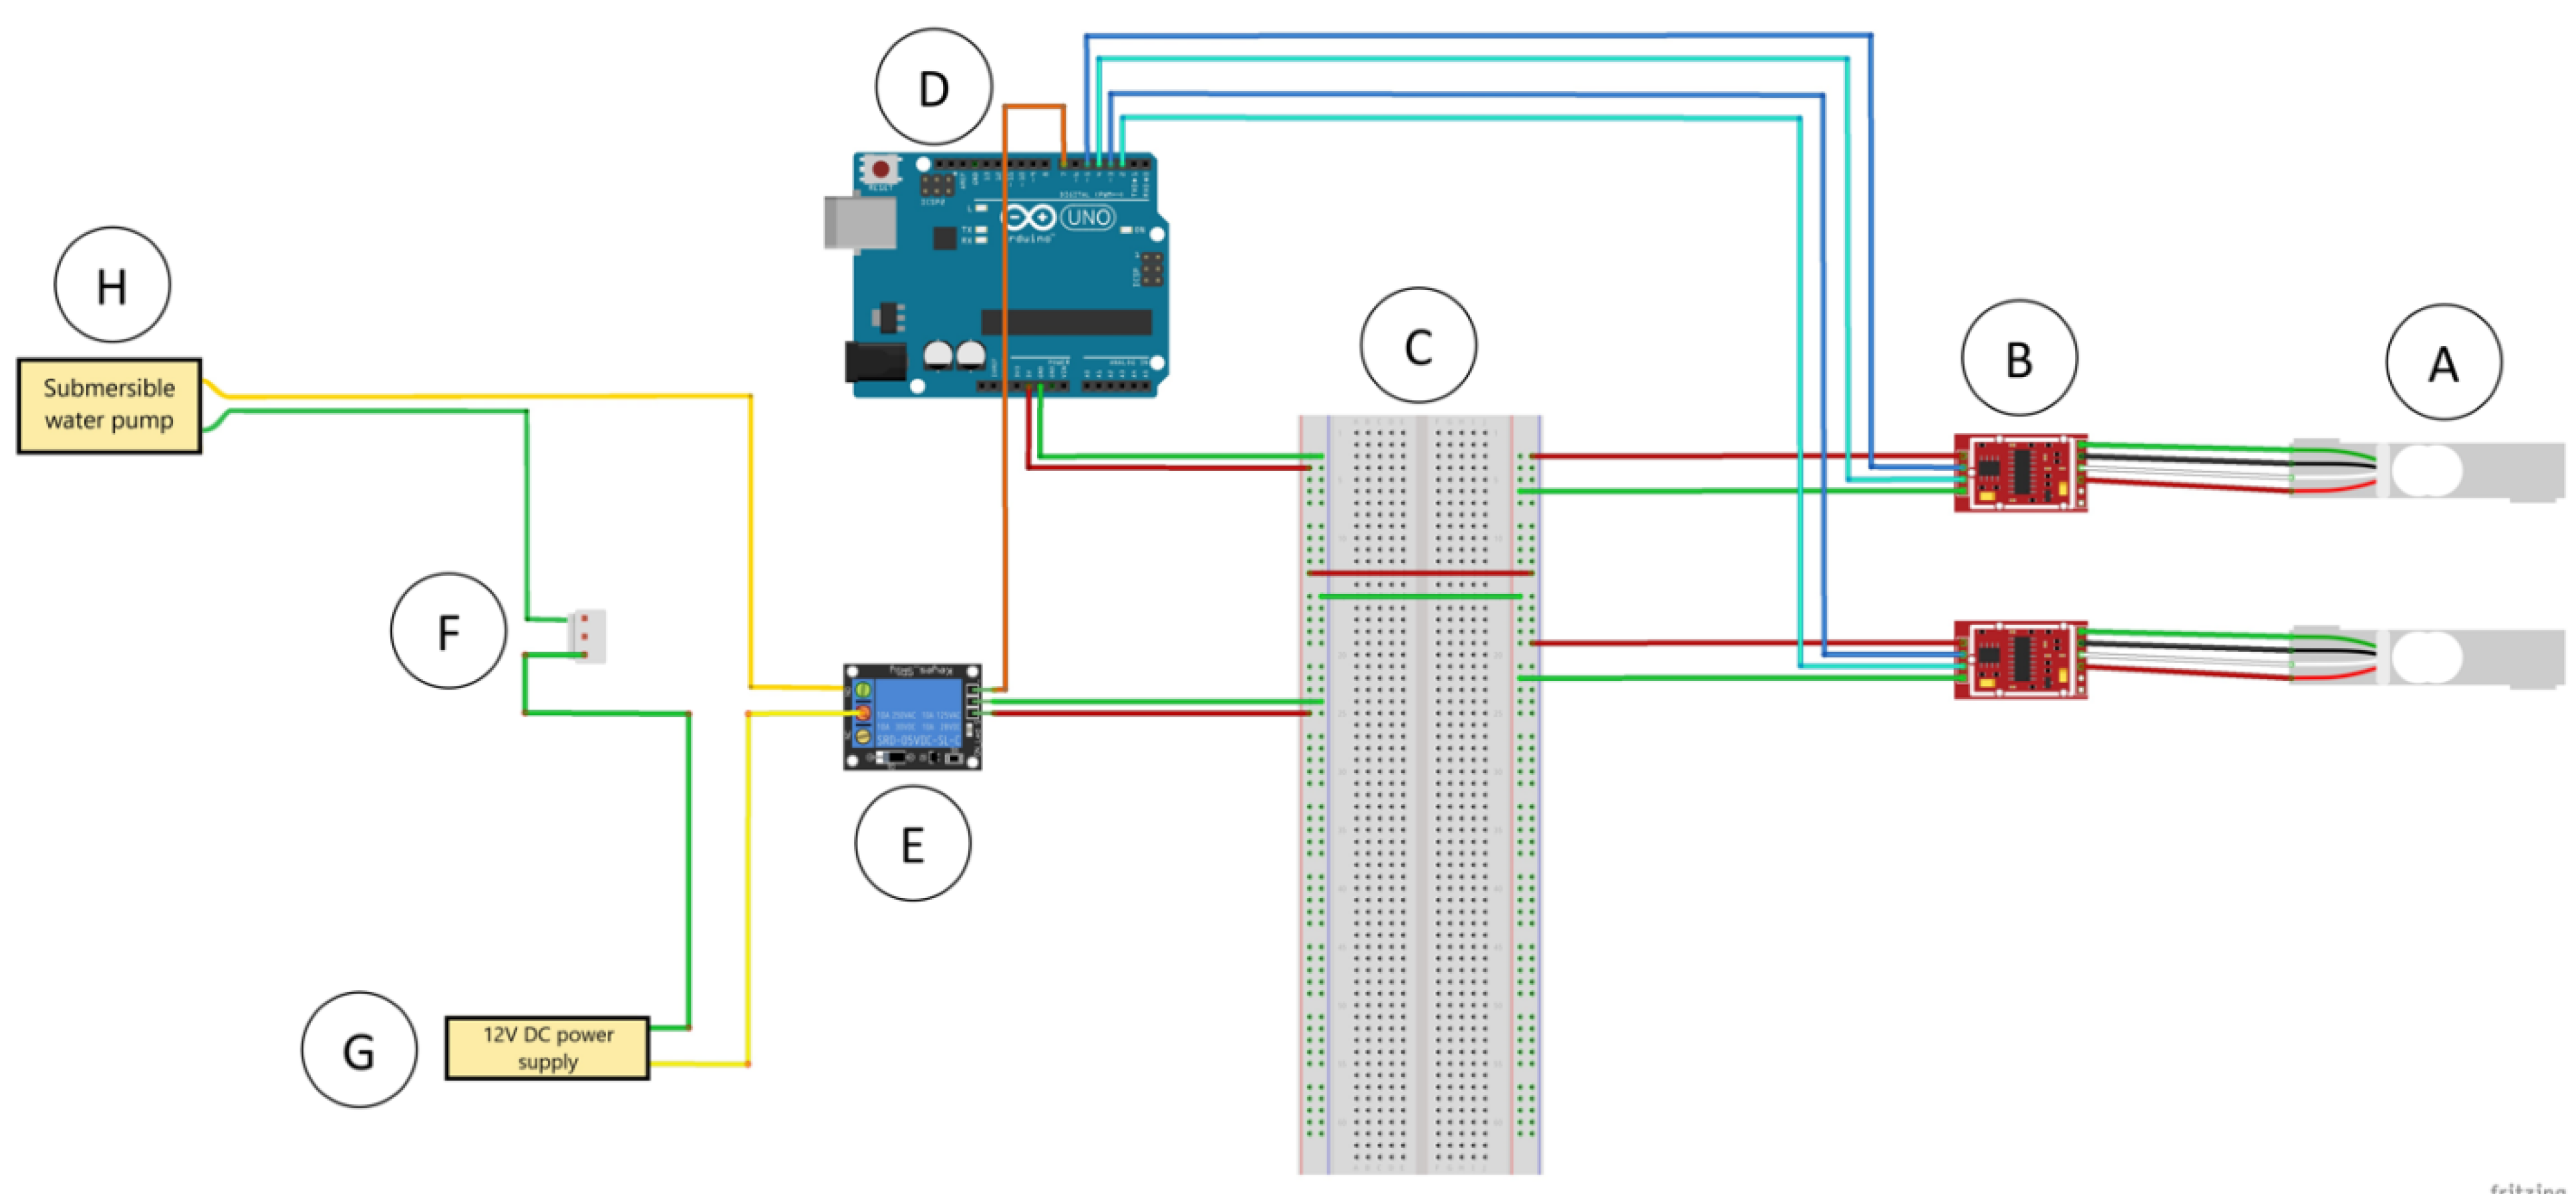
2.1. Lysimeter System

2.1.1. Design and Components

In this system (Figure 1 and Figure 2; Table 1), water loss due to transpiration and evaporation in each pot is determined and recorded based on mass, and soil moisture content automatically adjusted to a targeted moisture level. A balance was made with two load cells (20 kg HX711AD pressure sensor modules; SZYT, Shenzhen, China) attached to a 10 cm diameter plastic tray, which served as a platform to place pots A and Figure 2A). Two load cell amplifiers (HX711 load cell amplifiers; SZYT, Shenzhen, China), one per load cell, were used to amplify the signal generated from the load cells (Figure 2B). A standard breadboard (MT Technology Co., Ltd., Shenzhen, China) (Figure 2C) was used to connect the load cell amplifiers, a 1-channel 5 V relay module, and an Arduino R3 USB microcontroller (Arduino, A000066; Arduino SRL, Torino, Italy) (Figure 2D) which was used to control the irrigation system. The 1-channel 5 V relay module was used to connect the Arduino to the submersible water pump (ultra-quiet, 12 V, 4.2 W; ANSELF, Shenzhen, China) and power supply (1 A 12 V DC power adaptor with US plug type; ELECAPITAL, Shenzhen, China). Following the signal given by the Arduino, the relay (Figure 2E) connects or breaks the circuit, which turns on or turns off the water pump, respectively. A compact wire wiring connector (VENSTPOW, Shenzhen, China) was used to connect the submersible water pump and the power supply. This compact wire wiring connector was used to avoid manual soldering. The wiring diagram of the lysimeter system is illustrated in Figure 2. The submersible water pump (Figure 2H) was placed in a reservoir and pumped water via a flexible silicone hose (8 mm diameter; UXCELL, Shenzhen, China) (Figure 1D) to the pot following the signal given by the Arduino. A ring stand with a burette holder was used to direct the hose to the pot (Figure 1E). To avoid water damage, the Arduino, breadboard, and relay were placed in a water-resistant plastic container (Figure 1B). The system was connected via a USB cable (YCDC, Shenzhen, China) (Figure 1F) from the Arduino to a laptop computer (Figure 1C) to record the respective pot identification numbers and weights. For easy mobility, the entire system can be placed on a trolley and moved between locations within and between greenhouses (Figure 1). All components including their specifications and sources are listed in Table 1 and Supplementary File S1, respectively.

2.1.2. Software and Code

To set up the system, Arduino IDE (https://www.arduino.cc/en/Guide/Windows, accessed on 21 November 2021) and PuTTy (https://www.putty.org/, accessed on 21 November 2021) were installed on a laptop computer. PuTTy is used as the console as it has the capability of recording the data from the Arduino directly into a text (.txt) file. Data can also be saved to the cloud by configuring PuTTy if needed.
The Arduino Uno board was coded using C++. A specific algorithm was created to carry out the moisture adjustment. The HX711_ADC library was used with the algorithm to calibrate and measure weight data from the load cells. The given calibration example code was used to find the calibration values of the load cells, and those values were included in the main algorithm at the coding stage (Supplementary File S2). As this system consisted of two load cells, the pot weight was determined by adding the two load cell readings. Before starting the watering process, the user should upload the algorithm to the Arduino by selecting the correct code and pressing the upload button in the software. After uploading it once, the Arduino will keep the algorithm in its memory for all the other trials. The relevant C++ codes are listed in Supplementary File S2 and GitHub (https://github.com/IshanChathuranga/Arduino-Irrigation-system-for-plant-moisture-management-researchers, accessed on 21 November 2021).

2.2. Operating the Lysimeter System

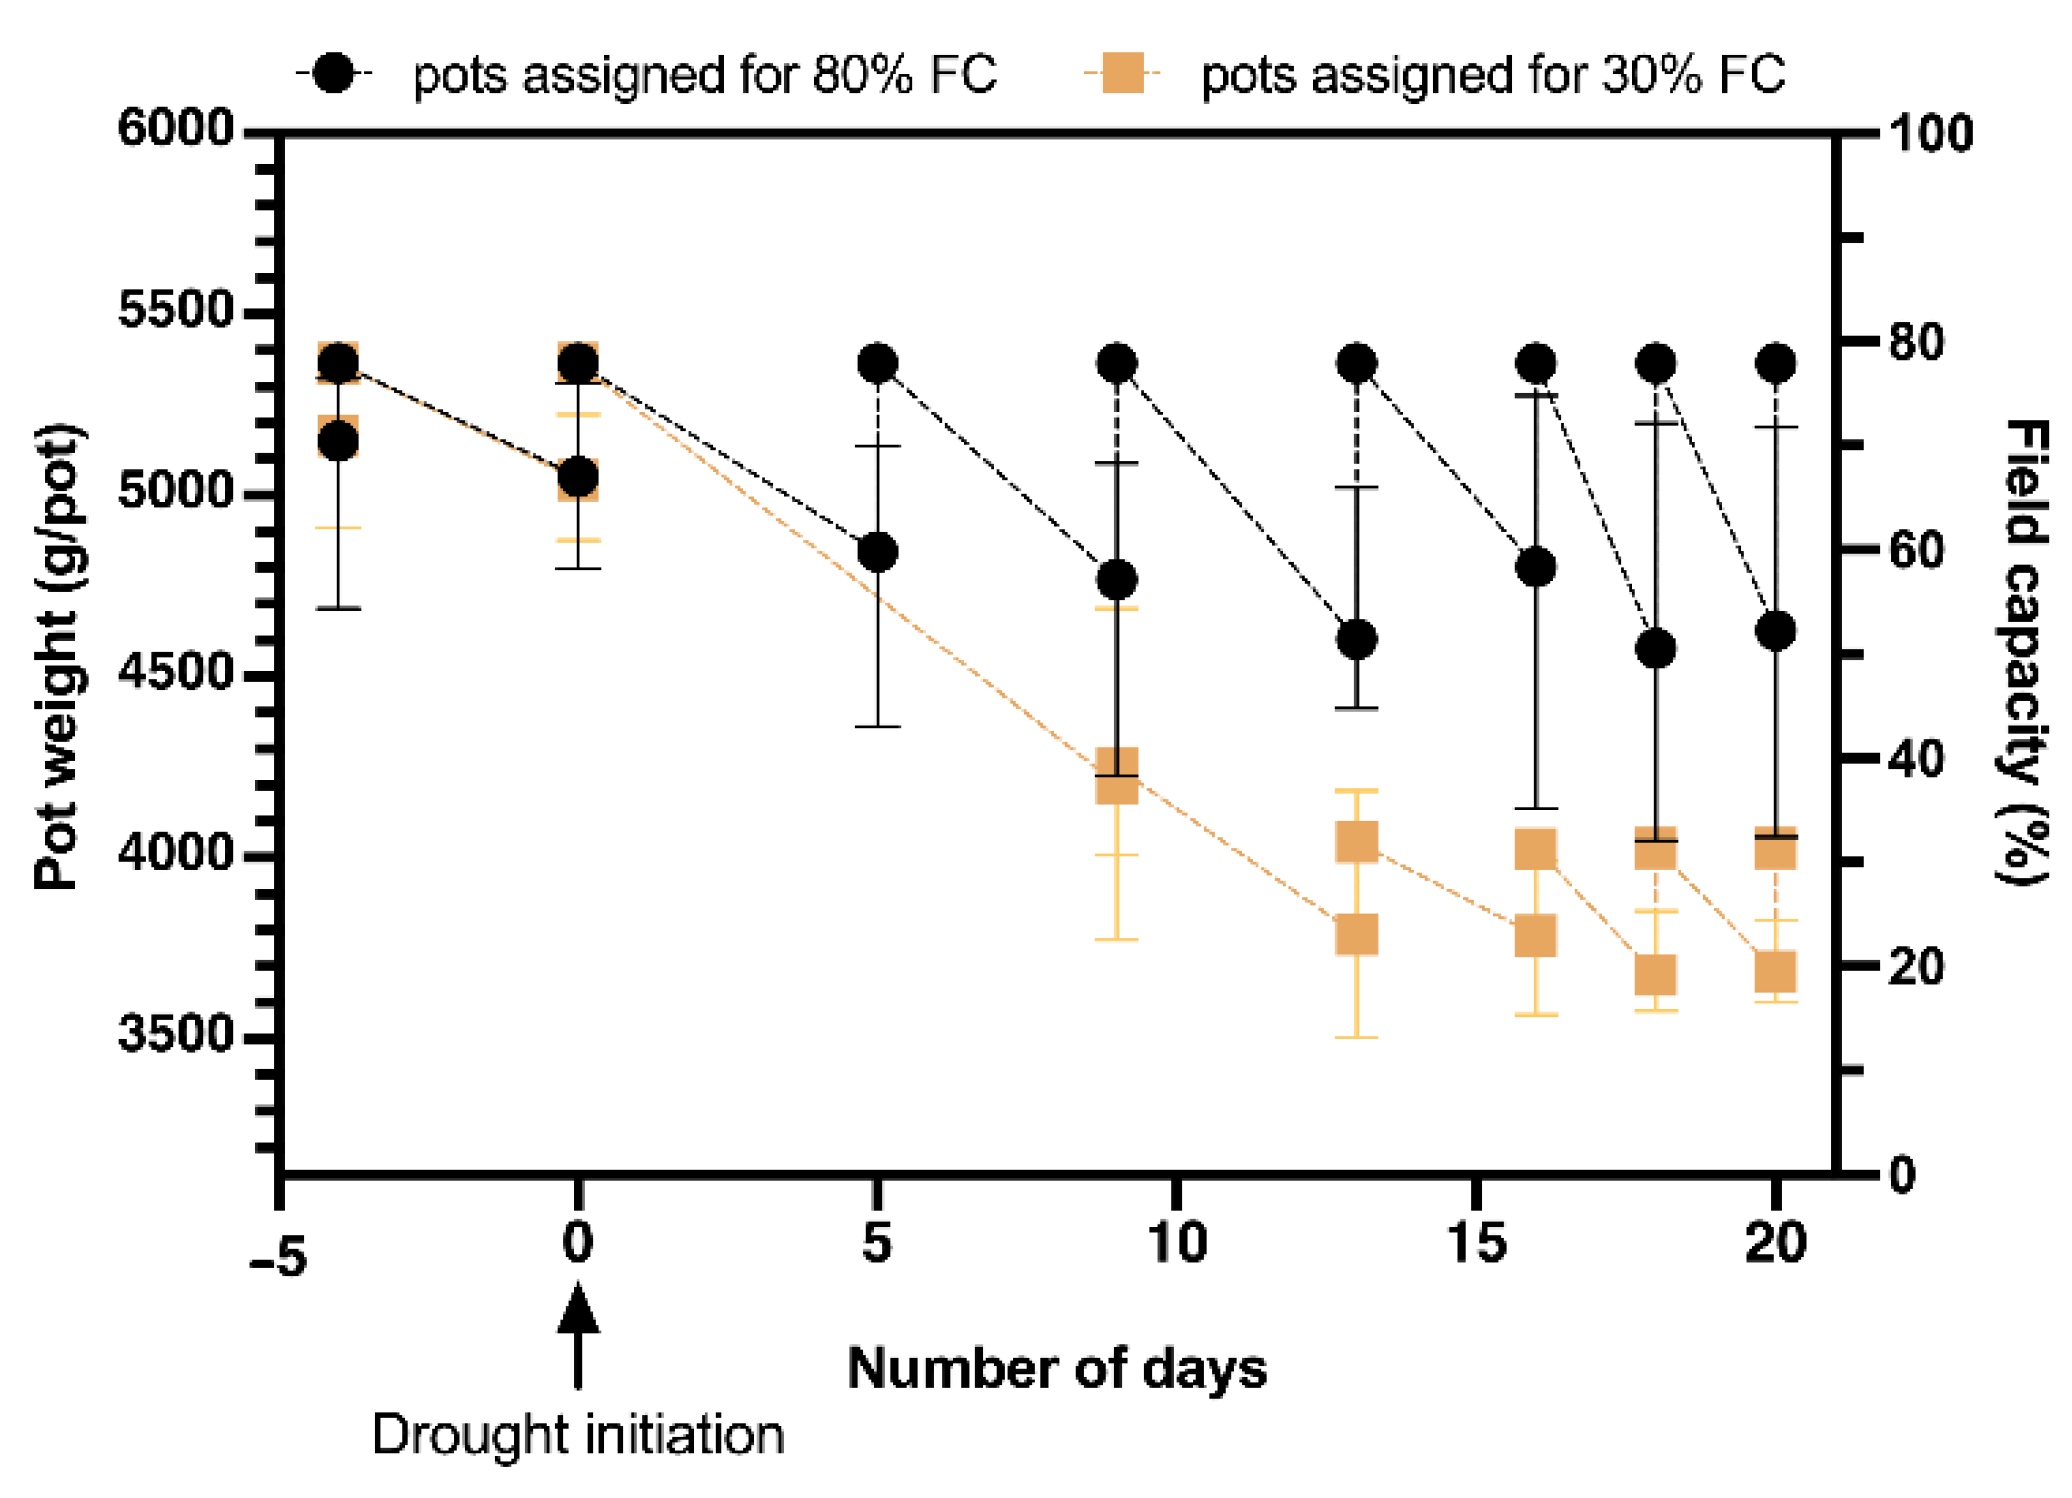
2.2.1. Determining Soil Water Holding Capacity

Before experiments begin, soil water holding capacity needs to be determined. Here, we used field capacity as a proxy for soil water holding capacity. Field capacity is defined as the amount of soil moisture or water content retained in the soil when all excess water has drained away [32]. For this experiment, 6.52 L plastic pots were filled with a mixture of sand (QUIKRETE® Premium Play Sand, QUIKRETE, Atlanta, GA, USA) and growing mix (Sunshine Mix #4 Gro Professional, SunGro, Vancouver, BC, Canada) (1:3 volume basis) until a final constant weight was reached (e.g., 4500 g). The bottom of each pot was lined with a coffee filter (12″ Mother Parkers Coffee Filters, Mother Parkers Tea and Coffee, Mississauga, ON, Canada) to prevent soil loss. The initial weight of the dry soil (Dw) was measured after drying the soil in an oven at 80 °C until a constant weight was reached [21]. The pots were watered slowly until the soil was saturated and water drained out from the holes in the bottom. The top of the pots was covered with aluminum foil and then kept for 24 h until water no longer drained from the bottom. The final saturated weights of the pots were recorded (Sw). Field capacity was calculated as FC = Sw − Dw. From here, treatment weights can be calculated for a well-watered (W) and a drought (D) treatment. These treatment values (W, D) are then supplied to the algorithm using the Arduino IDE prior to the start of the experiment.

2.2.2. Applying Soil Water Treatments

To initiate the process, the correct Arduino code file (Supplementary File S2) has to be opened using the Arduino IDE (integrated development environment). Once the upload button is pressed in the Arduino IDE, it will upload the algorithm to the Arduino board. Then the plastic tray has to be placed on the load cells and the PuTTy console software opened on the laptop. This will run the algorithm on the Arduino Board and will open a monitor on the laptop screen which will be used to show the outputs and to send the input values to the Arduino board, also a pre-saved data entry text (.txt) file (Supplementary File S3) is opened in the laptop. The algorithm will then initiate the load cells and tare the reading with the weight of the tray. Once this operation is completed, the system will consider the weight of the tray as zero or the tare point and will ask the user to place the first pot on the tray. Once the pot is on the tray, the algorithm will start monitoring the weight readings of the load cells and will identify the peak value readings by determining the point at which the load cell readings will increase and, subsequently, slightly decrease. A minimum threshold weight value was included in the algorithm to improve the accuracy of this operation. If the user accidentally touches the pot or hits the trolley while keeping the pot on the tray, it may affect the load cells and cause the algorithm to read an incorrect peak value. However, the threshold will prevent the algorithm from reading such false peak values before it hits the actual peak weight. Once the algorithm successfully determines the initial weight of the pot, it will ask the user to enter the pot identification number on the laptop. The algorithm will identify whether the user has started typing the number of the pot or not, and it will wait until the user starts typing the pot number. For example, the pot number will denote as 010W4 or 010D4, wherein the first three numbers represent the numerical number given to the pot and the W or D character represents whether it is a well-watered or a drought conditioned pot, respectively. The coding can be modified to assign more than two moisture treatments as well (Supplementary File S4). Finally, the last number will represent the replicate number of the pot. Once the pot identification number is typed on the laptop screen, the algorithm will count the number of characters in the given pot number, then run a loop to search whether there is W or D character in the pot number. The algorithm will identify both capital and simple representations of W and D as valid characters. If it finds a W character, then it will input the prescribed weight corresponding to a well-water conditioned pot in the algorithm. Similarly, if the algorithm finds a D character, it will input the prescribed weight corresponding to the specific drought condition pot in the algorithm. If more than two treatments are needed, the algorithm is available in supplementary methods (Supplementary File S4). Additionally, if the user mistakenly entered any other character or forgot to enter any character in the pot number, the algorithm will show a notification to check the pot number and will give space to re-enter it. This loop will run until the user enters a valid pot number.
Once a valid number is entered, the algorithm will check whether the pot weight is below the prescribed weight value (e.g., 5000 g for the well-watered condition and 3000 g for the drought condition). If the weight is equal to or higher than the prescribed value, the program will ask the user to remove the pot, and the data will be saved in a database. If the weight of the pot is below the prescribed value, the program will switch on the water pump. The algorithm will continue monitoring the weight of the pot, where once the pot weight reaches the prescribed value it will switch off the water pump. Once the water pump is switched off, a portion of the residual water in the tube will fall into the pot, each user must determine the weight of this residual water prior to using this system (e.g., We measured this as 40 g) and update in the coding (Supplementary File S4). The program will terminate the water pump as soon as the weight scale hits the value of the prescribed weight minus the residual water weight (e.g., 40 g). The laptop display will show the initial weight and the final weight of the pot, and the data will be saved in the text (.txt) file. It is important to note that the weight of the residual water (e.g., 40 g) needs to be added to the final weight as the software only records the weight before adding this residual water to the pot. At the next step, the algorithm will ask the user to remove the pot and wait until the system is ready for the next iteration. This step will take around 1–2 s. However, if ≥100 g of water spilled on the tray in the previous iteration, the system will pause this step until the tray is cleaned and placed on the load cells. If <100 g of water spilled into the tray, the user can either remove the spilled water from the tray before going to the next iteration or the system will automatically tare the scale with a new tare point accounting for the weight of the spilled water. Thus, it is only necessary to clean the tray after each iteration if ≥100 g of water spilled on the tray. The algorithm is also equipped with the capacity of the water reservoir. It is advised to fill the water reservoir completely prior to the start of data collection. The algorithm will notify the user when the water reservoir is almost empty (i.e., when 2 kg of water remains), which will prevent interruptions in the water supply while the pot is being watered. This will improve the life span of the pump as it will prevent the pump from running without water in the reservoir. A demonstration of the system operating is provided in Video S1.

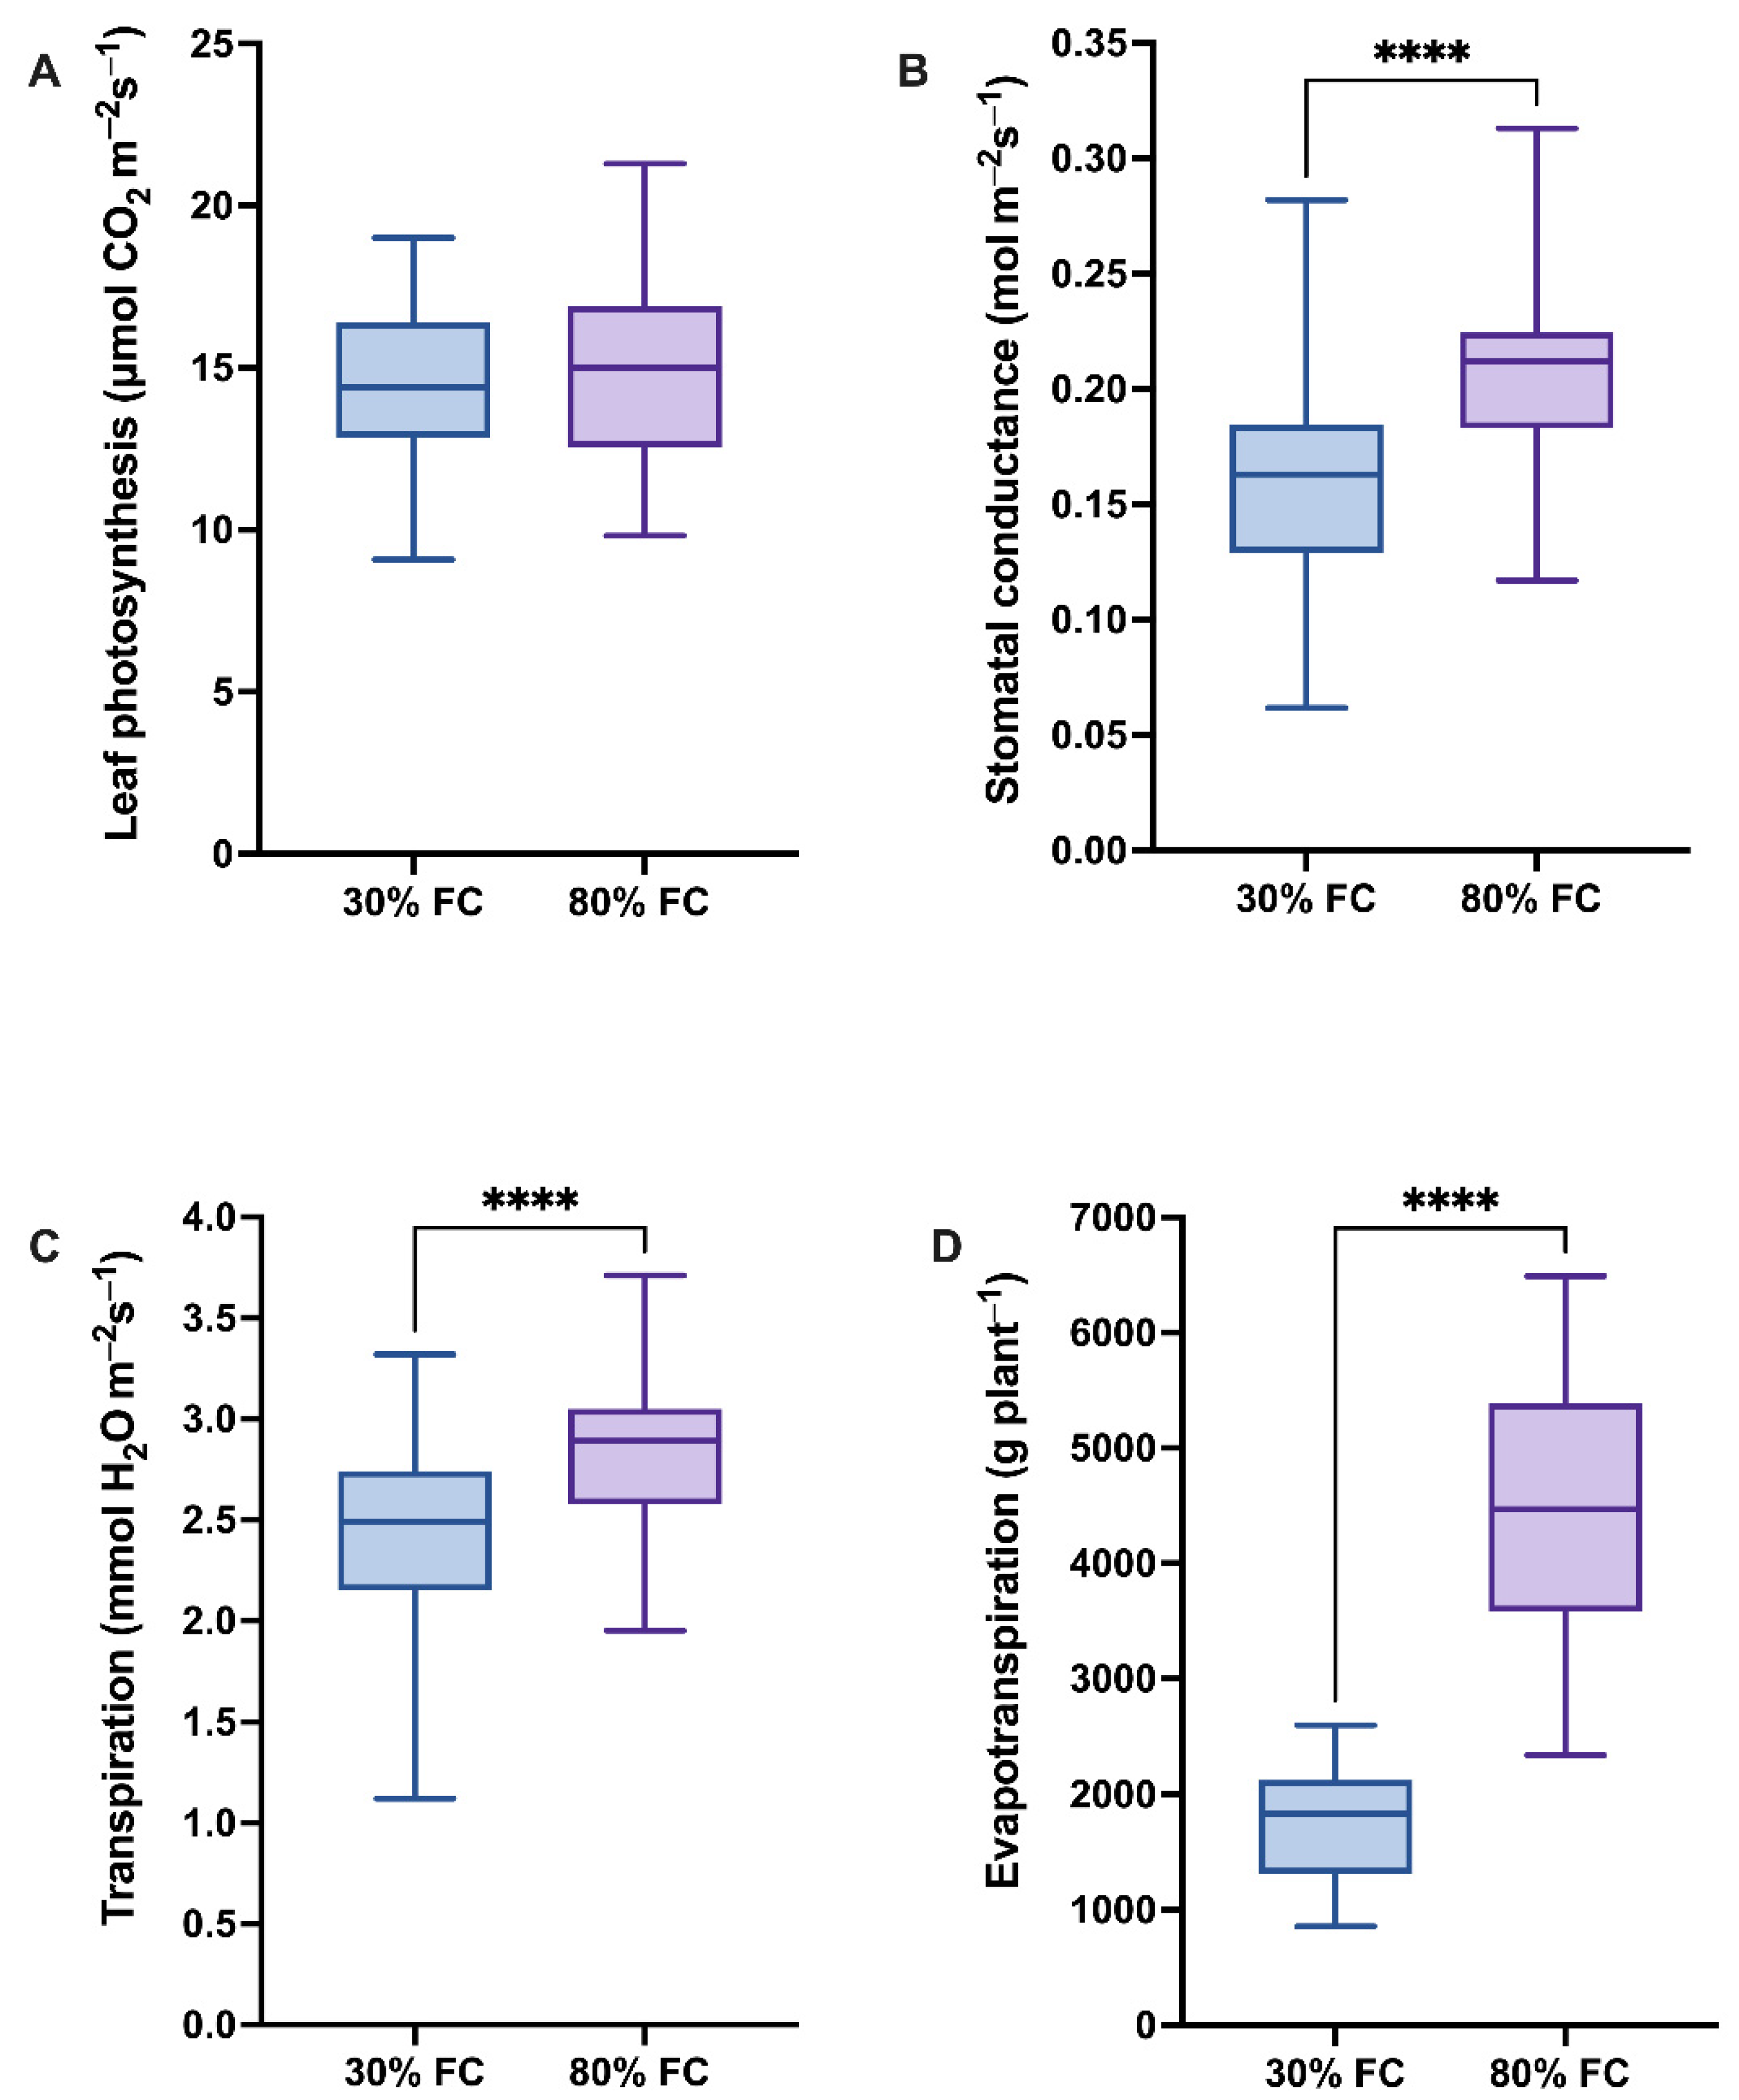
2.3. Validation of Arduino-Based Lysimeter

The lysimeter was tested using a greenhouse pot experiment with two soil moisture treatments maintaining the final soil moisture content at 80% and 30% field capacity (FC). The soil was mixed as above, and field capacity determined. Based on the FC data, final weights corresponding to 80% FC (well-watered) and 30% FC (drought) were calculated as 5363.4 g and 4025.9 g, respectively.
The greenhouse pot experiment was conducted using a variety panel of 50 early maturity Canadian soybean varieties. Pots were prepared as described above. Surface sterilized soybean seeds were planted at a depth of 2.5 cm in each pot (three seeds per pot; two pots per variety) and supplied with sufficient water to germinate. Plants were grown at 24 ± 2 °C with supplemental lighting (range: 500–600 μmol m−2 s−1 at the top of the canopy, Fortimo LED Line, High Flux VO), maintaining a photoperiod of 16:8 h light:dark. One week after germination, seedlings were thinned, leaving one per pot. Seedlings were inoculated with 2 mL of Bradyrhizobium japonicum USDA 110, adjusted to a rhizobial density of OD600 = 0.1 [33]. Bradyrhizobium japonicum form root nodules in soybean and fix atmospheric nitrogen, making it available to host soybean plants. Plants were supplied with quarter strength N-free Hoagland’s nutrient solution (HOP03-50LT, Caisson Labs, Smithfield, UT, USA) weekly (100 mL per pot). After three weeks of plant growth, two treatments were applied (80% FC (well-watered) and 30% FC (drought)) using the lysimeter system. One pot of each of the 50 lines was used in each treatment (n = 50 per treatment). The drought treatment was induced by withholding water until pots reached 30% FC. Moisture adjustment in all the pots was carried out based on the gravimetric method using the lysimeter until six weeks of plant growth (i.e., 3 weeks after treatments were applied).
Cumulative evapotranspiration during the drought-imposed period was calculated based on the moisture deficit (g) between the consecutive irrigation events (amount of water supplied). In addition, plant physiological traits, including photosynthesis, stomatal conductance, and transpiration, were measured using an LI-6400XT portable infrared gas analyzer (LI-COR, Inc., Lincoln, NE, USA). To measure the physiological traits, a photon flux density of 500 μmol m–2 s−1 and CO2 concentration of 400 mol m–2 s−1 inside the chamber were maintained. Data were collected on a single fully expanded young soybean leaf on each plant in each treatment (n = 50 per treatment).
All statistical analyses were performed using GraphPad Prism Software (v9, GraphPad Software, San Diego, CA, USA). We compared the leaf photosynthesis, stomatal conductance, transpiration, and evapotranspiration between the drought and well-watered treatments with paired t-tests.

3. Results and Discussion

The semi-automated lysimeter accurately maintained soil moisture levels in both the 80% and 30% FC treatments (Figure 3 and Figure S1). Over the course of 3 weeks, pots were weighed every 2–5 days depending on the rate of evapotranspiration, and soil moisture content was adjusted back to the targeted FC levels (Figure 3) based on the pot weight (Figure S2). The error variance under each irrigation event may be due to differences in plant size, where the larger genotypes depleted soil water more quickly than the smaller plants. Plants in the 30% FC treatment had significantly lower stomatal conductance (Figure 4B), transpiration (Figure 4C), and evapotranspiration (Figure 4D). However, there was no significant difference in leaf photosynthesis between the 30% and 80% FC treatments (Figure 4A). Soybean plants’ response to drought stress in terms of leaf stomatal conductance, transpiration, and evapotranspiration is well studied and our results corroborate previous findings [34,35,36,37,38]. Our results confirmed that the semi-automated lysimeter was effective in inducing and maintaining drought and well-watered soil conditions. Therefore, this system could be applied to other studies aimed at examining plant responses to different soil moisture levels.
Mini-lysimeters are portable, accurate, and effective in measuring evapotranspiration in pots [39,40]. Although other mini-lysimeters were developed to simulate drought stress in pot-based experiments [21,27], this newly described system is more portable and economical to build. All the components can be purchased for less than 200 USD and will run with a standard laptop that most research groups already have. The data collected can be automatically saved in the cloud, making it easier to handle and access. This semi-automated system is very user-friendly and does not require high technical competence to set up and operate. In the current experiment, it took ca. 1 min to complete a single pot, which included the time to bring the pot to the lysimeter, enter the pot identification number on the laptop, supply the water to the pot, and return the pot to the greenhouse bench. This time will vary depending on different greenhouse arrangements but is quite efficient. One limiting factor can be the time required to fill the reservoir when the water level is low, but this can be overcome by using a larger reservoir and having a water supply close at hand. On average, we were able to adjust the moisture content in 50 pots per hour, so in 5 working hours in the greenhouse, ca. 250 pots can be adjusted. The current system was created to implement two treatments (well-watered and drought) only; however, we supplied the necessary code (Supplementary File S4) to increase the number of treatments. Users can set up any number of soil moisture treatments while using the Arduino RAM memory efficiently.
There are some limitations associated with this Arduino-based lysimeter. This semi-automated system is not fully water-resistant as its housing was made using a commonly available plastic box. It will withstand small water splashes, but to make the system fully water-resistant, a custom-made housing compartment with water barrier passages for the wires to pass through could be made. Another alternative solution would be to use two separate and independent systems for the weight measuring load cell section and the data processing Arduino section. However, in this setup, power must be supplied separately to the two units and wireless technology would be needed to transmit the weight data to the Arduino circuitry. This would minimize the complexity of making the whole system water-resistant; however, it would increase the complexity of the system as wireless connectivity would be essential on both devices.
In the validation experiment, we did not consider the weight of the plants for adjusting the FC as the plants grew over time. To make the FC values more accurate, extra pots of plants can be grown and shoot biomass destructively measured at each water adjustment period and added to the final target weight (e.g., 80% FC = 5363.4 g + shoot biomass; 30% FC = 4025.9 g + shoot biomass) [21]. In the future, it is possible to increase the efficiency and functionality of this system. The laptop could be replaced with a small LCD display and a wireless keyboard which could make the system more user-friendly (but potentially increase the technical competence to set up the system). A barcode reader or a QR code reader could also be attached to the system to identify the pot identification numbers, improving the accuracy of the data collection and making the process more efficient [41]. To make the system fully portable, the current wall power connector could be replaced with a rechargeable battery module

4. Conclusions

Maintaining accurate soil moisture content is critical in drought experiments. This semi-automated Arduino-based, lysimeter, irrigation system is an economical and high-throughput system for moisture adjustment in pot experiments. It can be further developed to minimize human errors and to reduce the cycle time, which will increase productivity.

Supplementary Materials

The following supporting information can be downloaded at: https://www.mdpi.com/article/10.3390/agronomy12020349/s1, Figure S1: Field capacity adjustment in pots growing soybean plants using the semi-automated Arduino-based lysimeter, Figure S2: Gravimetric moisture adjustment in pots growing soybean plants using the semi-automated Arduino-based lysimeter, Supplementary File S1: Orginal source of different components of the irrigation system, Supplementary File S2: C++ Code for Arduino, Supplementary File S3: Weight data recording .txt file, Supplementary File S4: C++ Code for Arduino with dynamic watering conditions, Video S1: A video of the Arduino-based lysimeter system in operation.

Author Contributions

Conceptualization, D.K.L., I.C. and M.S.T.; methodology, D.K.L. and I.C.; software, I.C.; validation, D.K.L. and I.C.; formal analysis, D.K.L. and I.C.; investigation, D.K.L.; resources, M.S.T.; data curation, D.K.L.; writing—original draft preparation, D.K.L. and I.C.; writing—review and editing, D.K.L., I.C., M.S.T. and B.A.M.; visualization, D.K.L., I.C. and M.S.T.; supervision, M.S.T.; project administration, M.S.T.; funding acquisition, M.S.T. and B.A.M. All authors have read and agreed to the published version of the manuscript.

Funding

This research was supported by a Natural Sciences and Engineering Research Council of Canada (NSERC) Discovery Grant (RGPIN-2020-04425) to M.S.T. Financial support was provided to B.A.M. by an NSERC Industrial Research Chair (Grant 545088) and partner organizations (Alberta Wheat Commission, Alberta Barley Commission, Alberta Canola Producers Commission, Alberta Pulse Growers Commission) during the preparation of the manuscript.

Data Availability Statement

The original contributions presented in the study are included in the article/Supplementary Material, further inquiries can be directed to the corresponding author.

Acknowledgments

We thank Kelley Dunfield and Shay Missiaen (University of Alberta) for their help with the greenhouse trial.

Conflicts of Interest

The authors declare that the research was conducted in the absence of any commercial or financial relationships that could be construed as potential conflicts of interest.

References

  1. Keyantash, J.; Dracup, J.A. The Quantification of Drought: An Evaluation of Drought Indices. Bull. Am. Meteorol. Soc. 2002, 83, 1167–1180. [Google Scholar] [CrossRef]
  2. Bacelar, E.L.V.A.; Moutinho-Pereira, J.M.; Gonçalves, B.M.C.; Brito, C.V.Q.; Gomes-Laranjo, J.; Ferreira, H.M.F.; Correia, C.M. Water Use Strategies of Plants under Drought Conditions. In Plant Responses to Drought Stress; Aroca, R., Ed.; Springer: Berlin/Heidelberg, Germany, 2012; pp. 145–170. ISBN 9783642326530. [Google Scholar]
  3. United Nations. Department of Economics and Social Affairs. 2019. Available online: https://www.un.org/development/desa/en/news/population/world-population-prospects-2019.html.Html (accessed on 21 November 2021).
  4. Sheffield, J.; Wood, E.F.; Roderick, M.L. Little Change in Global Drought over the Past 60 Years. Nature 2012, 491, 435–438. [Google Scholar] [CrossRef] [PubMed]
  5. Basu, S.; Ramegowda, V.; Kumar, A.; Pereira, A. Plant Adaptation to Drought Stress. F1000Research 2016, 5, 1554. [Google Scholar] [CrossRef] [PubMed]
  6. Wasaya, A.; Zhang, X.; Fang, Q.; Yan, Z. Root Phenotyping for Drought Tolerance: A Review. Agronomy 2018, 8, 241. [Google Scholar] [CrossRef] [Green Version]
  7. Earl, H.J.; Davis, R.F. Effect of Drought Stress on Leaf and Whole Canopy Radiation Use Efficiency and Yield of Maize. Agron. J. 2003, 95, 688–696. [Google Scholar] [CrossRef]
  8. Ganjeali, A.; Porsa, H.; Bagheri, A. Assessment of Iranian Chickpea (Cicer Arietinum L.) Germplasms for Drought Tolerance. Agric. Water Manag. 2011, 98, 1477–1484. [Google Scholar] [CrossRef]
  9. Janiak, A.; Kwaśniewski, M.; Szarejko, I. Gene Expression Regulation in Roots under Drought. J. Exp. Bot. 2016, 67, 1003–1014. [Google Scholar] [CrossRef] [Green Version]
  10. Jabbari, M.; Fakheri, B.A.; Aghnoum, R.; Nezhad, N.M.; Ataei, R. GWAS Analysis in Spring Barley (Hordeum Vulgare L.) for Morphological Traits Exposed to Drought. PLoS ONE 2018, 13, e0204952. [Google Scholar] [CrossRef] [Green Version]
  11. Tarawneh, R.A.; Alqudah, A.M.; Nagel, M.; Börner, A. Genome-Wide Association Mapping Reveals Putative Candidate Genes for Drought Tolerance in Barley. Environ. Exp. Bot. 2020, 180, 104237. [Google Scholar] [CrossRef]
  12. Marchin, R.M.; Ossola, A.; Leishman, M.R.; Ellsworth, D.S. A Simple Method for Simulating Drought Effects on Plants. Front. Plant Sci. 2020, 10, 1715. [Google Scholar] [CrossRef] [Green Version]
  13. Gorim, L.Y.; Vandenberg, A. Evaluation of Wild Lentil Species as Genetic Resources to Improve Drought Tolerance in Cultivated Lentil. Front. Plant Sci. 2017, 8, 1129. [Google Scholar] [CrossRef] [PubMed]
  14. Gorim, L.Y.; Vandenberg, A. Root Traits, Nodulation and Root Distribution in Soil for Five Wild Lentil Species and Lens Culinaris (Medik.) Grown under Well-Watered Conditions. Front. Plant Sci. 2017, 8, 1632. [Google Scholar] [CrossRef] [PubMed] [Green Version]
  15. Lehnert, H.; Serfling, A.; Friedt, W.; Ordon, F. Genome-Wide Association Studies Reveal Genomic Regions Associated with the Response of Wheat (Triticum Aestivum L.) to Mycorrhizae under Drought Stress Conditions. Front. Plant Sci. 2018, 9, 1728. [Google Scholar] [CrossRef] [PubMed]
  16. Shirinbayan, S.; Khosravi, H.; Malakouti, M.J. Alleviation of Drought Stress in Maize (Zea mays) by Inoculation with Azotobacter Strains Isolated from Semi-Arid Regions. Appl. Soil Ecol. 2019, 133, 138–145. [Google Scholar] [CrossRef]
  17. Turner, N.C. Imposing and Maintaining Soil Water Deficits in Drought Studies in Pots. Plant Soil 2019, 439, 45–55. [Google Scholar] [CrossRef]
  18. Blonquist, J.M.; Jones, S.B.; Robinson, D.A. Standardizing Characterization of Electromagnetic Water Content Sensors: Part 2. Evaluation of Seven Sensing Systems. Vadose Zone J. 2005, 4, 1059–1069. [Google Scholar] [CrossRef]
  19. Bogena, H.R.; Huisman, J.A.; Schilling, B.; Weuthen, A.; Vereecken, H. Effective Calibration of Low-Cost Soil Water Content Sensors. Sensors 2017, 17, 208. [Google Scholar] [CrossRef] [Green Version]
  20. Campbell, D.I.; Laybourne, C.E.; Ian, J. Blair Measuring Peat Moisture Content Using the Dual-Probe Heat Pulse Technique. Aust. J. Soil Sci. 2002, 40, 177–190. [Google Scholar]
  21. Earl, H.J. A Precise Gravimetric Method for Simulating Drought Stress in Pot Experiments. Crop Sci. 2003, 43, 1868–1873. [Google Scholar] [CrossRef]
  22. Kojima, Y.; Shigeta, R.; Miyamoto, N.; Shirahama, Y.; Nishioka, K.; Mizoguchi, M.; Kawahara, Y. Low-Cost Soil Moisture Profile Probe Using Thin-Film Capacitors and a Capacitive Touch Sensor. Sensors 2016, 16, 1292. [Google Scholar] [CrossRef]
  23. Ortiz, D.; Litvin, A.G.; Salas Fernandez, M.G. A Cost-Effective and Customizable Automated Irrigation System for Precise High-Throughput Phenotyping in Drought Stress Studies. PLoS ONE 2018, 13, e0198546. [Google Scholar] [CrossRef] [PubMed] [Green Version]
  24. Susha Lekshmi, S.U.; Singh, D.N.; Shojaei Baghini, M. A Critical Review of Soil Moisture Measurement. J. Int. Meas. Confed. 2014, 54, 92–105. [Google Scholar] [CrossRef]
  25. Robinson, D.A.; Jones, S.B.; Wraith, J.M.; Or, D.; Friedman, S.P. A Review of Advances in Dielectric and Electrical Conductivity Measurement in Soils Using Time Domain Reflectometry. Vadose Zo. J. 2003, 2, 444–475. [Google Scholar] [CrossRef]
  26. Dobriyal, P.; Qureshi, A.; Badola, R.; Hussain, S.A. A Review of the Methods Available for Estimating Soil Moisture and Its Implications for Water Resource Management. J. Hydrol. 2012, 458, 110–117. [Google Scholar] [CrossRef]
  27. Chard, J.; van Iersel, M.W.; Bugbee, B. Mini-Lysimeters to Monitor Transpiration and Control Drought Stress: System Design and Unique Applications; Utah State University: Logan, UT, USA, 2010. [Google Scholar]
  28. Gebre, M.G.; Earl, H.J. Effects of Growth Medium and Water Stress on Soybean [Glycine Max (L.) Merr.] Growth, Soil Water Extraction and Rooting Profiles by Depth in 1-m Rooting Columns. Front. Plant Sci. 2020, 11, 487. [Google Scholar] [CrossRef]
  29. McCauley, D.; Levin, A.; Nackley, L. Reviewing Mini-Lysimeter Controlled Irrigation in Container Crop Systems. Hort Technol. 2021, 31, 634–641. [Google Scholar] [CrossRef]
  30. Gebre, M.G.; Earl, H.J. Soil Water Deficit and Fertilizer Placement Effects on Root Biomass Distribution, Soil Water Extraction, Water Use, Yield, and Yield Components of Soybean [Glycine Max (L.) Merr.] Grown in 1-m Rooting Columns. Front. Plant Sci. 2021, 12, 581127. [Google Scholar] [CrossRef]
  31. Wright, D.E.J.; Cline, J.A.; Earl, H.J. Physiological Responses of Four Apple (Malus × Domestica Borkh.) Rootstock Genotypes to Soil Water Deficits. Can. J. Plant Sci. 2019, 99, 510–524. [Google Scholar] [CrossRef]
  32. Ahuja, L.R.; Nachabe, M.H.; Rockiki, R. Soils: Field Capacity. Encycl. Water Sci. Second Ed. 2008, 2, 1128–1131. [Google Scholar]
  33. Thilakarathna, M.S.; Moroz, N.; Raizada, M.N. A Biosensor-Based Leaf Punch Assay for Glutamine Correlates to Symbiotic Nitrogen Fixation Measurements in Legumes to Permit Rapid Screening of Rhizobia Inoculants under Controlled Conditions. Front. Plant Sci. 2017, 8, 1714. [Google Scholar] [CrossRef] [Green Version]
  34. Liu, F.; Jensen, C.R.; Andersen, M.N. Hydraulic and Chemical Signals in the Control of Leaf Expansion and Stomatal Conductance in Soybean Exposed to Drought Stress. Funct. Plant Biol. 2003, 30, 65–73. [Google Scholar] [CrossRef] [PubMed]
  35. Liu, F.; Andersen, M.N.; Jacobsen, S.E.; Jensen, C.R. Stomatal Control and Water Use Efficiency of Soybean (Glycine Max L. Merr.) during Progressive Soil Drying. Environ. Exp. Bot. 2005, 54, 33–40. [Google Scholar] [CrossRef]
  36. Ohashi, Y.; Nakayama, N.; Saneoka, H.; Fujita, K. Effects of Drought Stress on Photosynthetic Gas Exchange, Chlorophyll Fluorescence and Stem Diameter of Soybean Plants. Biol. Plant. 2006, 50, 138–141. [Google Scholar] [CrossRef]
  37. He, J.; Du, Y.L.; Wang, T.; Turner, N.C.; Yang, R.P.; Jin, Y.; Xi, Y.; Zhang, C.; Cui, T.; Fang, X.W.; et al. Conserved Water Use Improves the Yield Performance of Soybean (Glycine Max (L.) Merr.) under Drought. Agric. Water Manag. 2017, 179, 236–245. [Google Scholar] [CrossRef]
  38. Medina, V.; Gilbert, M.E. Physiological Trade-Offs of Stomatal Closure under High Evaporative Gradients in Field Grown Soybean. Funct. Plant Biol. 2016, 43, 40–51. [Google Scholar] [CrossRef] [PubMed]
  39. Misra, R.K.; Padhi, J.; Payero, J.O. A Calibration Procedure for Load Cells to Improve Accuracy of Mini-Lysimeters in Monitoring Evapotranspiration. J. Hydrol. 2011, 406, 113–118. [Google Scholar] [CrossRef] [Green Version]
  40. Meena, H.M.; Singh, R.K.; Santra, P. Design and Development of a Load-Cell Based Cost Effective Mini-Lysimeter. J. Agric. Phys. 2015, 15, 1–6. [Google Scholar]
  41. Walden-Coleman, A.E.; Rajcan, I.; Earl, H.J. Dark-Adapted Leaf Conductance, but Not Minimum Leaf Conductance, Predicts Water Use Efficiency of Soybean (Glycine max L. Merr.). Can. J. Plant Sci. 2013, 93, 13–22. [Google Scholar] [CrossRef]
Figure 1. Arduino-based lysimeter. (A) Load cell and the pot holding tray, (B) Plastic water-resistant container holding the circuitry, (C) Laptop computer, (D) Hose from water reservoir, (E) Ring stand with burette holder, (F) USB cable to connect the system to the laptop, (G) trolley.
Agronomy 12 00349 g001
Figure 2. Wiring diagram of the Arduino-based lysimeter. (A) Two 20 kg load cells, (B) HX711 load cell amplifier, (C) Breadboard, (D) Arduino Uno microcontroller board, (E) One channel 5 V relay, (F) Compact wire wiring connector with lever, (G) 12 V DC power supply, (H) Submersible water pump (quiet, 12 V, 4.2 W).
Agronomy 12 00349 g002
Figure 3. Total pot weight and soil water content as a percentage of field capacity (FC) in the well-watered (80% FC) and drought (30% FC) treatments over the soybean plant growth period measured using the Arduino-based lysimeter. The black color represents the 80% FC treatment pot weights, and the orange color represents the 30% FC pot weights. Data are means and ± range (n = 50).
Agronomy 12 00349 g003
Figure 4. Plant physiological parameters and evapotranspiration under drought (30% field capacity) and well-watered (80% field capacity) conditions in soybean. (A) Leaf photosynthesis, (B) Stomatal conductance, (C) Transpiration, (D) Evapotranspiration. Box plots show the median (horizontal line), first and third quartiles (the lower and upper bounds respectively), and whiskers above and below the box plot indicate the range. FC; field capacity. **** indicates p < 0.0001.
Agronomy 12 00349 g004
Table 1. Lysimeter components and specifications.
ComponentComponent ImageSpecificationsNumber of Units Required
Arduino Uno R3 USB Microcontroller Agronomy 12 00349 i001
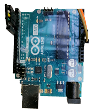
Microcontroller: ATmega328
Operating Voltage: 5 V
Input Voltage (recommended): 7–12 V
Input Voltage (limits): 6–20 V
Digital I/O Pins: 14
(of which 6 provide PWM output)
Analog Input Pins: 6
DC Current per I/O Pin: 40 mA
DC Current for 3.3 V Pin: 50 mA
Flash Memory: 32 KB (ATmega328)
of which 0.5 KB used by the bootloader
SRAM: 2 KB (ATmega328)
EEPROM: 1 KB (ATmega328)
Clock Speed: 16 MHz
1
Submersible water pump Agronomy 12 00349 i002
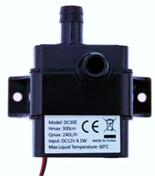
Ultra-quiet
DC12 V 4.2 W
Power: Electric
Pressure: Low Pressure
Structure: Submersible Pump
Theory: Brushless Submersible pump
1
Power Adaptor Agronomy 12 00349 i0031 A
Output Voltage: 12 V
Plug Type: US Plug
1
Relay Module for Arduino
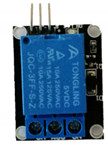
 Agronomy 12 00349 i0041 Channel
5 V
1
Flexible Hose Agronomy 12 00349 i005
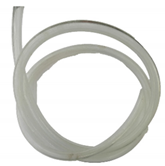
Material: Silicon
Main Color: Clear
Inner Dia (ID): 8 mm
Outer Dia (OD): 10 mm;
Wall Thickness: 1.2 mm
Length: 1 m
1
Compact Wire Wiring Connector with lever Agronomy 12 00349 i006
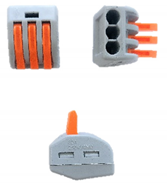
Model Number: 222–412 413 415
Material of Insulation:
modified nylon (PA66)
Contact material: phosphor copper
Wire Cross section: 0.08~2.5 mm2 (single hardwire), 0.08~4 mm2 (multi soft wire)
Rated Current: 32 A
Rated power: 7 KW
Gauge: 28~12 AWG
Strip length: 9–10 mm
1
Transparent Box Case Shell for Arduino UNO R3 Agronomy 12 00349 i007Material: Acrylic
Locking mechanism: Screwless locking
Color: Transparent
1
USB cable Agronomy 12 00349 i008
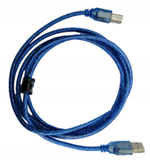
Material: Metal and environmental PVC
Connectors: 4-pin USB type A (male) to 4-pin USB type B (male)
Shield: Metal woven mesh + aluminum foil
Transmission Rate: Up to 480 Mbps
Approval: RoHS
Color: Black, light blue
Length: 1 m/3.28 ft
1
20 kg pressure sensor + HX711AD module weighing scale Agronomy 12 00349 i009
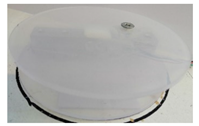
20 kg
Tray diameter 10 cm
Operating voltage DC 5 V
HX711AD (24-bit conversion)
2
Solderless Breadboard Agronomy 12 00349 i010
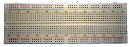
400 tie points in total, 100 in 2 power rails, 300 in a 30 × 10 matrix
Transparent plastic, with black legend.
Colored power rails
For wires 21 to 26 AWG
2-sided peelable adhesive tape
1
Dupont Jumper Wire Agronomy 12 00349 i011Length: 30 cm
Package: 20 wires per each category
1
Lab Trolly Agronomy 12 00349 i012
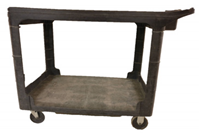
Material: Hard Plastic
Functions: portable
Weight: Lightweight
1
Burette holder/clamp Agronomy 12 00349 i013
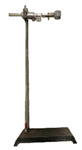
Material: Metal
Functions: Fully adjustable
1
Laptop Agronomy 12 00349 i014Operating system:
Windows/Apple operating systems
1
Power extension code Agronomy 12 00349 i015Length: As per your requirement1
Water reservoir Agronomy 12 00349 i016
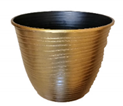
Any plastic container to hold sufficient amount of water1
Publisher’s Note: MDPI stays neutral with regard to jurisdictional claims in published maps and institutional affiliations.

