1. Introduction
Maize occupies a leading position globally in terms of sown area and yield. The creation of new (hybrid) cultivars tolerant to lower temperatures enabled an extension of the maize cultivation range to include countries in colder climate zones. In Poland, the area under maize cultivation has increased significantly over the past 10 years (from 628,000 ha in 2011 to 1,257,000 ha in 2019) [
1]. About half of this area is occupied by grain cultivation and another half by the cultivation of whole-crop silage. Maize is an extremely important and energy-rich food source for humans (grains) and feed for animals (both grains and biomass). Due to the high production of carbohydrate-rich biomass, maize is increasingly used to produce biofuels and biogas [
2].
Photosynthesis is a fundamental process that affects plant growth, biomass, and productivity. The photosynthetic capacity of plants is determined by environmental factors, crop production techniques applied, the species and the characteristics of plants, and their growth stage [
3,
4,
5]. The main abiotic environmental factors that affect this process include solar radiation intensity, the atmospheric air condition, temperature, water availability, atmospheric CO
2 concentration, soil fertility, and relative humidity [
3,
4]. The efficient course of photosynthesis is also aided by endogenous factors, i.e., those related to the anatomy and morphology of plants (particularly the leaves), their structure, and physiological and biochemical characteristics [
3,
4,
6]. The leaf characteristics that affect the absorption and utilisation of solar energy include the size, weight, chlorophyll, nitrogen and carbohydrate contents, and the presence or absence of sinks [
6,
7]. Greater stomatal conductance combined with better leaf parameters (more chlorophyll, N, greater mesophyll weight, and thickness) allows more light to be captured and converted into chemical energy. A close positive relationship was demonstrated between stomatal conductance (gs) and net assimilation (A) and between these parameters and the leaf characteristics (chlorophyll and nitrogen contents, palisade parenchyma content, thickness, etc.). The higher A is attributed to the greater volume weight of the leaves, their higher chlorophyll content, a higher palisade parenchyma content, and thicker leaves [
8]. Under unfavourable conditions, stomata are closed, which protects the plant against water loss while reducing the absorption of light and carbon from the atmosphere, which has an adverse effect on the net assimilation rate. In such situations, the plant, to maintain the turgor pressure, reduces the transpiration (by closing the stomata) and manages water more efficiently [
9]. The net assimilation rate also changes during the plant’s growing season. As the plants grow, A increases to reach a maximum level at flowering [
8]. However, not only is the total plant dry matter productivity determined by the capture of light by the plant and its utilisation in the photosynthetic process, but also by plant respiration. For this reason, a close correlation between plant biomass and photosynthesis is not always found.
The photosynthetic process course is also determined by the crop production techniques applied, as it affects the soil environment fertility, which affects the growth and foliage of plants. One of the crop production technique factors that affects the volume of produced plant biomass is crop rotation [
10].
In farming on arable fields, a shift away from the traditional (multi-field) crop rotation to the cultivation of crops in short rotations and succession of the same plant has been observed for many decades for economic and administrative reasons. However, numerous studies show that such practices (particularly monoculture cultivation) lead to many adverse changes in the soil and plant (in the morphology and physiological and biochemical processes) and, consequently, result in a reduced yield of poorer quality. In practice, maize is often sown after maize or other monocotyledonous plants. Bennett et al. [
11] noted in a review article based on numerous studies that maize cultivation in short crop rotation cycles and monoculture results in a reduction in yield, ranging (depending on the crop rotation cycle, the level of the crop production technique, and habitat conditions) from 10% to 22%. The reasons for a severe yield reduction are diverse and have not yet been fully explained. Crookston et al. [
12] reported that a reduction in yield is linked to a combination of different interrelated factors.
In monoculture and short rotation cycles, yield decreases due to deterioration of soil quality. [
13,
14]. This impedes root development and the uptake of water and nutrients. Crop rotation (even a short-term one) improves root function [
15] and increases its area and activity [
16]. All plants alternative to maize (e.g., monocotyledon or dicotyledon plants), used as a forecrop, can improve yield compared to maize sown after maize.
The literature also provides a report on the rather good tolerance of this plant to the sowing of the same crop after itself, particularly under conditions of more abundant N fertilization [
17].
The current paper proposes the hypothesis that by altering the environmental characteristics, a forecrop will affect the leaf development and anatomy as well as the plant physiology (gas exchange), which will translate into the yield volume obtained. The current study is one of the first to address the role of a forecrop on the physiological leaf characteristics of plants. It was assumed that both photosynthesis and yielding would be favourably affected by growing maize after multi-species grassland, while growing it in succession after winter triticale and after maize would have a limiting effect on this process.
The aim of the study was to examine: (i) whether the cultivation of silage maize in a short (2-year) crop rotation succeeding a multi-species grassland, winter triticale, and after maize will affect the course of gas exchange in the leaves of the cereal; (ii) whether this process will be determined by the maize development stage; (iii) whether there is a relationship between the gas exchange parameters the foliage characteristics and the silage maize biomass yield.
2. Materials and Methods
2.1. Site, Soil, and Climate
The on-farm experimentation was carried out in two growing seasons (2017 and 2018) on a commercial farm located in a hilly area in north-eastern Poland, in the Warmia and Mazury region (the village of Baowo 53°53′49″ N, 21°10′38″ E, 160 m above sea level). The experimental soil fields were classified as typical lessive soil. Within the 0–30 cm layer, the soil contained: 63.6% sand, 16.5% coarse silt, 16.2% fine silt, and 3.7% clay. It showed a slightly acid reaction (pH 5.9–6.2), Corg content ranging from 8.6 to 9.3 g·kg−1, mineral N content ranging from 13.0 to 15.3 mg·kg−1, a medium-to-high content of P (5.72–7.94 g·kg−1) and K (9.46–13.61 g·kg−1), and a low Mg content (3.36–4.56 g·kg−1).
Since the area where the trial was conducted is under the influence of interpenetrating Atlantic and continental air masses, it is characterised by weather variability. The average annual air temperature was 6.5 °C. In the summer months (June, July, August), it ranges from 15.5 to 17.4 °C, while in the winter months (December, January, February), it ranges from −1.4 to −2.2 °C. Spring starts in mid-April and is relatively cool, with occasional frosts, while autumn is long and warm. Air humidity in the summer period ranges from 60% to 80%. The annual precipitation depth is 550 mm. The maximum precipitation occurs in June and July (75–95 mm), and the minimum precipitation is in January and February (30 and 40 mm). The average annual sum of active photosynthetic radiation (PAR) in the studied area amounts to 8079.2 mol photon m−2·s−1, with approximately 50% occurring in June, July, and August. The number of sunshine hours per year is 1746, including 1013 h from April to September, while the average number of sunny days in a year is 97.
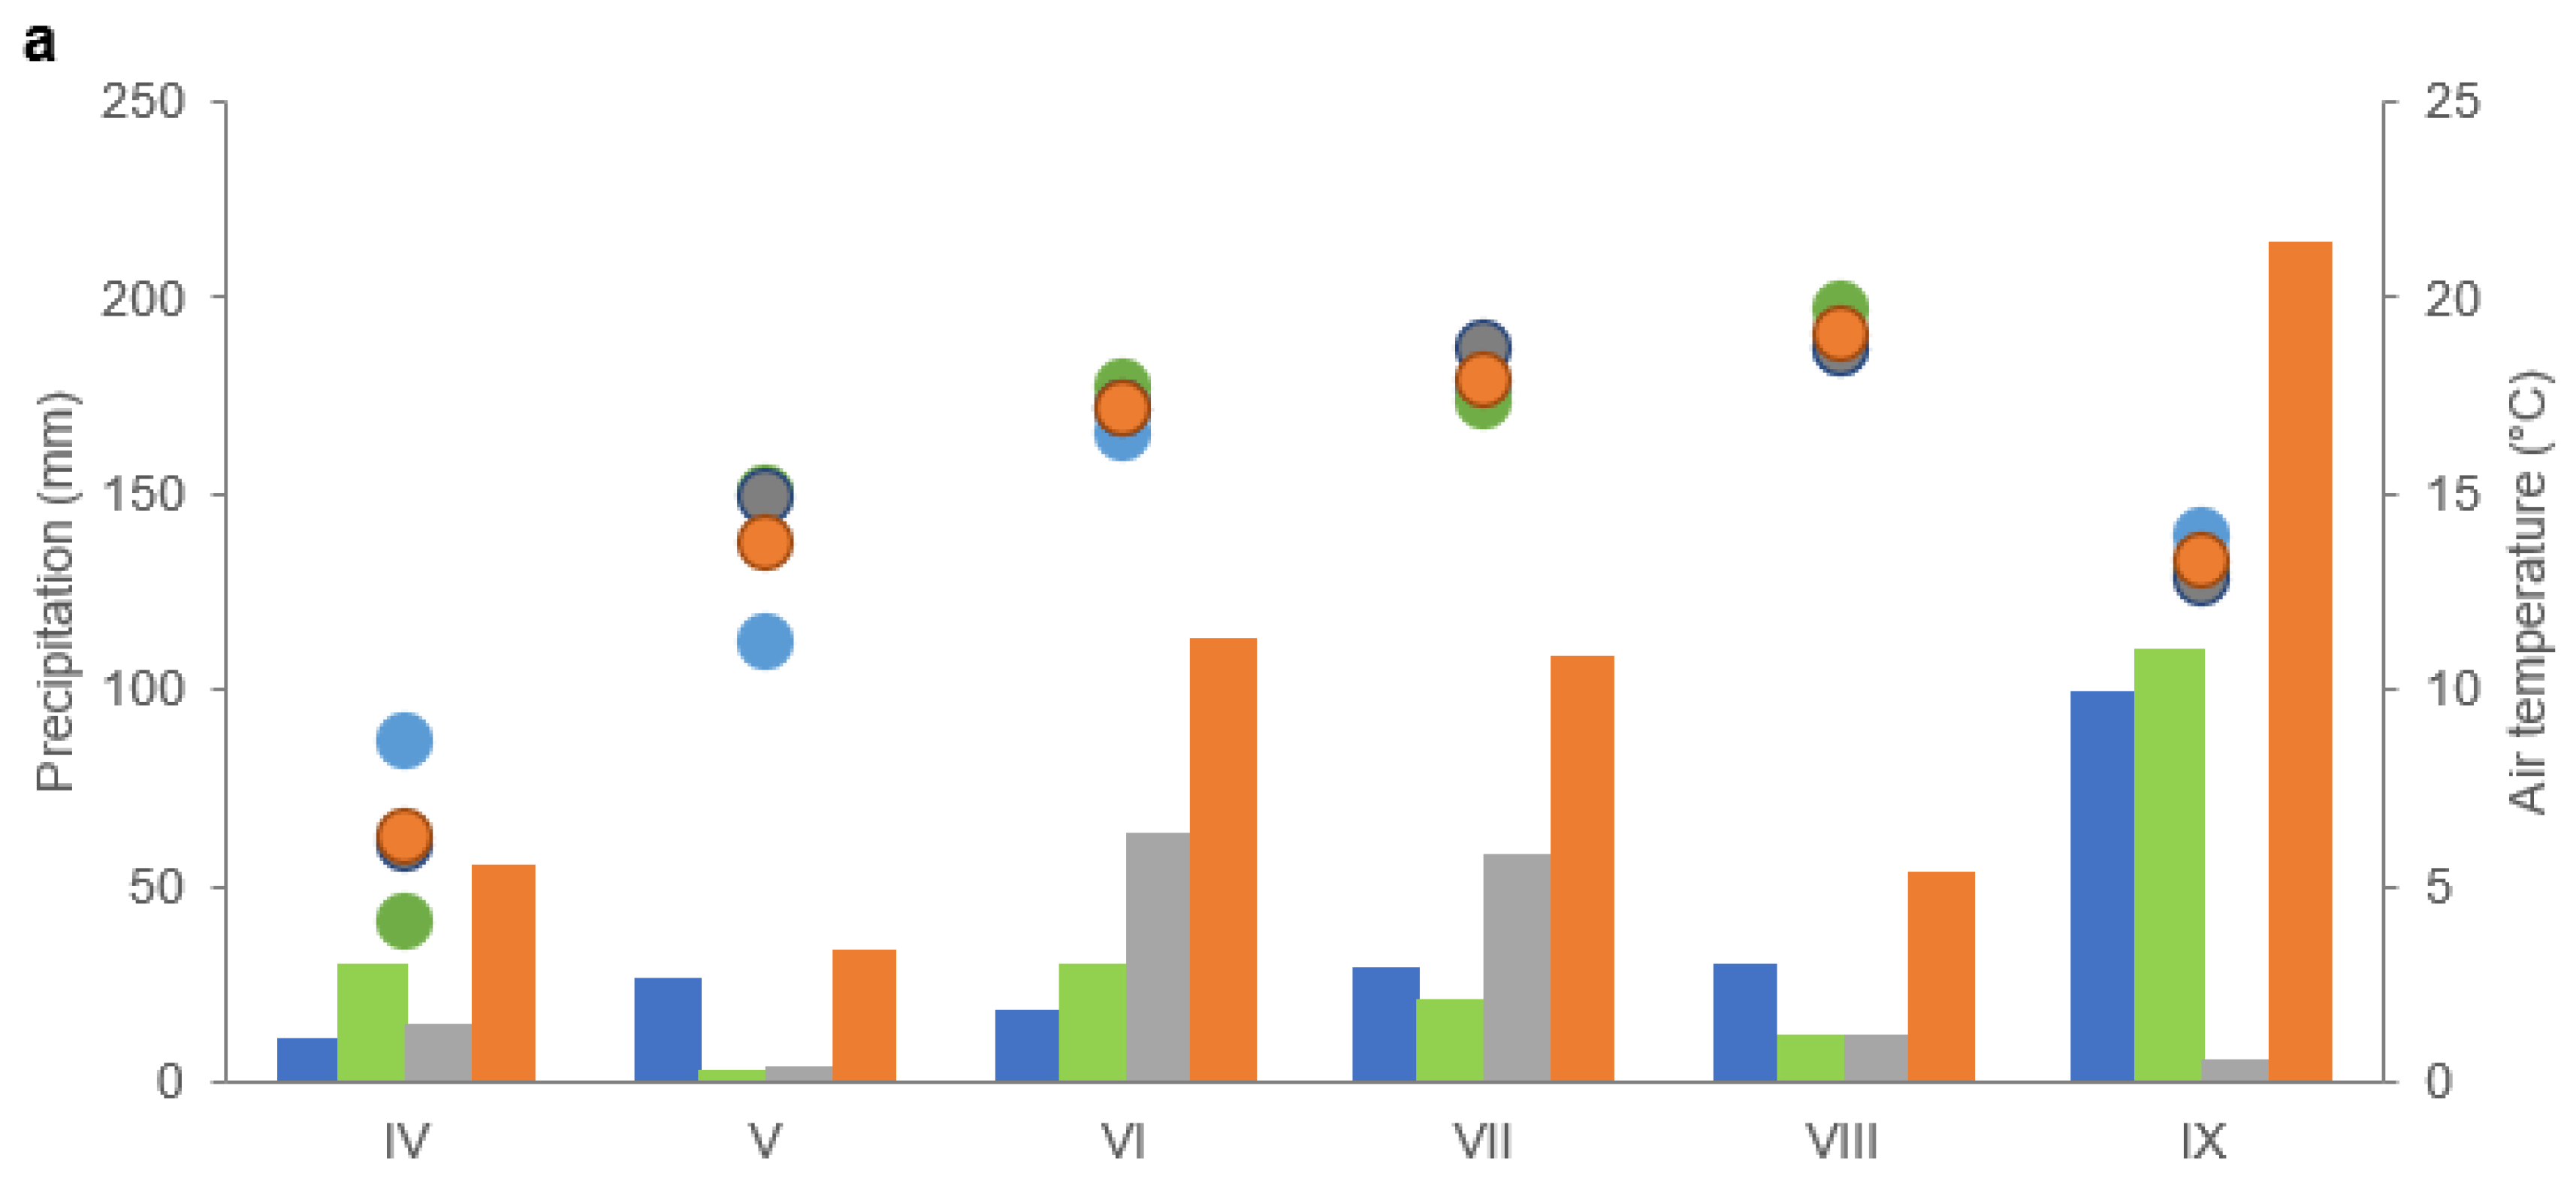
During the maize growing season (from April to September), the average air temperature (
Figure 1a,b) was 14.5 °C in 2017 and 15.8 °C in 2018 and did not differ significantly from the average multi-annual values for this village (from the years 1962–2002). During this period, precipitation depths were 2017–579.4 mm, and 2018–389.6 mm, higher than multiannual precipitation depths by 81% and 22%, respectively.
The following factors proved to be unfavourable for maize growing: in 2017—drought in the second and third week of May (at that time, maize was at the emergence stage) and in the second and third week of August (the flowering and anthesis stages) and very high precipitation in September (the development of fruit and ripening stage); in 2018—low precipitation in the third week of May and the first and second decade of June (the growth stage: emergence, leaf development). In all experimental years, the air temperature was sufficient for maize cultivation. In the BBCH 36 stage (third decade of June) and the BBCH 65 stage (second decade of August), the maize water demand was met during both study periods.
2.2. Experimental Design
In 2017 and 2018, the maize was cultivated on three production fields located close to one another. The area of each field was 10 ha. In each of the three fields, four plots with an area of 30 m2 were randomly designated as replications (each year, the total number of plots was 12). In the year preceding the sowing of maize, these areas were sown with the following: field 1–2-year-old, multi-species grassland; field 2—winter triticale; field 3—maize. Therefore, the following vegetal successions were assessed as treatments (crop rotations): 1. grassland-maize, 2. Triticale-maize, and 3. Maize-maize.
The species composition of the grassland was as follows: Medicago sativa (36%), Lolium perenne (13%), Phleum pratense (13%), Trifolium pratense (11%), Lolium multiflorum (9%), Lolium hybridum (9%), and Festulolium spp. (9%). For the study, a Pioneer P8451 hybrid maize cultivar cultivated for silage was selected. The winter triticale (forecrop) cultivar was Sekret.
Each year, the maize was sown over the first 10 days of May (7 May 2017, and 5 May 2018) at a rate of 90,000 seeds per 1 ha, which provided a density of 8.5–9 plants per 1 m−2. The silage biomass was harvested when the dry matter content in the plants was approximately 35% (8 October 2017 and 27 September 2018). Before sowing the maize, the field was fertilised with slurry at a rate of 60,000 dcm3·ha−1. The dose of minerals applied under this plant was (kg·ha−1): N—176, P—60, K—90, S—9. To control weeds, the preparation Adengo 315 SC (thiencarbazone-methyl—90 g·dm3 + isoxaflutole—225 g·dm3) was applied at a dose of 0.3 dcm3·ha−1, following the emergence at the BBCH stage 10–11.
2.3. Leaf Gas Exchange and N Concentration in Leaf Analysis
Measurements of gas exchanges in the maize plants were taken at two development (BBCH) stages: stem elongation (36) and flowering (65), on the highest positioned leaf on the stem. For the measurements, five plants were randomly selected from each plot.
The tests were carried out on cloudless days, before noon (between 10:00 AM and 12:00 AM). Gas exchanges were measured using a compact photosynthesis system (LCi/N, ADC Bioscientific Ltd., Hoddesdon, UK). Photosynthetic photon flux density (PPFD) was 1500 µmol photon m
−2·s
−1, the ambient CO
2 concentration (c) was 381–400 (µmol·mol
−1), the vapour pressure was 9.6–10.8 kPa, and the chamber temperature ranged from 24.7–32.5 °C. Testing included measurement of atmospheric CO
2 concentration (c), stomatal conductance (gs), intercellular CO
2 concentration (ci), net assimilation rate (A), and transpiration rate (E). The apparatus was also used to determine the leaf temperature. In the laboratory, the N concentration in the leaves was determined by the Kjeldahl method (the results were used to calculate the photosynthetic N-use efficiency and N
area). Based on the measurements, the following indices were calculated: photosynthetically-active radiation use efficiency in the photosynthetic process (LUE) by dividing A/PAR; mesophyll conductance (gm) was determined as A/ci; stomatal limitation value (ls) as 1-ci/c; the water use efficiency (WUE) by dividing A/E; the photosynthetic water use efficiency (PWUE) as A/gs; photosynthetic N-use efficiency (PNUE) by dividing A/N [
18], and N
area as N mass of the dry mass of leaves/leaf area.
2.4. Leaf Surface of Assimilation of Plants, Leaf Mass Area, and Relative Chlorophyll Content of Leaves
Measurements of the maize leaf area were taken each year at the flowering stage (BBCH 65) using a leaf area meter (CI—202 Portable Laser Leaf Area Meter). The measurements were carried out on all leaves found on ten plants chosen randomly from each plot. All these leaves were then oven-dried at 80 °C to a constant weight. The leaf mass per area (LMA) was calculated as the ratio of leaf dry mass to leaf area. The leaf area index (LAI) was calculated by dividing the assimilation area of all the leaves of one plant by the area it occupied. At the stem elongation (BBCH 36) and flowering (BBCH 65) stages, the relative chlorophyll content was determined in maize leaves using a Minolta SPAD 502 chlorophyll meter. The measurements were carried out on the central part of the three highest positioned leaves on 10 plants from each plot.
2.5. Maize Silage Biomass Yield
At the stage of maize kernel development (BBCH 79–83), the dry matter yield of maize green silage biomass and cobs from each plot was determined. The results were converted into t·ha−1, and the proportion of cobs in the yield (%) was calculated, excluding the edge strips on both sides (the area of 0.5 m2). The yield values are expressed in fresh mass (with 35% water content).
2.6. Statistical Analysis
The analysis was conducted using the STATISTICA 13.3 program [
19]. To assess the effect of three different short-term crop rotation cycles (grassland-maize, triticale-maize, maize-maize) on the course of leaf gas exchange, a non-parametric Kruskal-Wallis test was applied at a significance level of α = 0.05. The significance of the differences between the tested groups was assessed based on Dunn’s test with
p < 0.05.
Furthermore, to assess the effect of three different short-term crop rotation cycles on the single leaf area (LA), leaf area index (LAI), leaf mass per area (LMA), leaf nitrogen content per unit area of leaves (Narea), yield of maize silage biomass, and proportion of cobs in the yield, a parametric one-way analysis of variance (ANOVA) was applied with p < 0.05. The significance of the differences between the tested groups was evaluated based on Tukey’s test at a significance level of α = 0.05.
Based on the Spearman rank correlation, the strength of the relationship between the tested features was assessed.
3. Results
In 2017 and 2018, at the BBCH 36 stage (
Table 1,
Figure 2a), maize leaves grown in the field after grassland were characterized by significantly higher stomatal conductance—gs (by 2.2–5.1-fold), transpiration rate—E (by 42.5–121.8%), and chlorophyll content—Cl (by 1.1–4.9%), compared to leaves from the (undistinguished) fields after winter triticale and maize. The advantage of grassland over the other forecrops for gs and Cl was more pronounced in 2017, and for E in 2018. On the plot with maize after maize, intercellular CO
2 concentration—ci was higher than after triticale (by 6.1% in 2017 and by 59.2% in 2018) and after grassland (by 65.6% in 2017 and by 79.3% in 2018). The triticale forecrop had a more positive effect on ci than the grassland forecrop in both years of the study (by 12.7% to 56.1%). The leaves of maize grown after grassland had lower temperatures than after triticale and maize in both years of the study (by 1.4–1.7 °C). In 2017, the net assimilation rate A was significantly higher after grasslands than after triticale (by 94.6%) and after maize (by 16%). In 2018, the opposite situation was noted. The highest A was found in maize grown after triticale, and the lowest was after grassland (the difference between triticale and grassland was 34%).
During this period, maize used water more efficiently in the photosynthesis process in the stand after maize (
Table 2). This was confirmed by the WUE index, which reached significantly higher values than after grassland (by 27.3–172.5%), triticale (by 3.8–75%), and the PWUE index (whose value after maize was higher than after grassland (by168.6–338.3%), and after triticale in 2017 (by 74.6%).
No clear effect of forecrops on the transfer of CO2 within the mesophyll—gm was observed. This parameter was significantly higher after grassland than after triticale and maize in 2017 (3- and 2-fold). However, in 2018 a different situation was found—the CO2 movement within the mesophyll was significantly higher after triticale than after grassland and maize (by 19.5% and 75%). The triticale forecrop also had a positive effect on light utilisation in photosynthesis (LUE index). After this forecrop, in both years, it was significantly higher (by 41.9–207.4%) than after the undistinguished forecrops, i.e., grasslands and maize (especially in 2018). No clear effect of forecrops on the resistance to stomatal CO2 transfer—ls was recorded. In 2017, significantly higher ls values were found after maize than after grassland and triticale (by 62.2% and 81.8%, respectively), and in 2018 significantly higher values were found after grassland and triticale than after maize (on average by 8-fold). In both years of the study, the utilisation of N in the process of photosynthesis (PNUE index) was the highest on the plot with maize cultivation after maize, and in 2017 after grassland.
At BBCH 65, in both years of the study, the stand with maize cultivation after grassland had the most beneficial effect on gas exchange (
Table 3). On this plot, significantly higher: gs (by 97–425%), E (by 22.2–60.5%), ci (by 40.8–101.4%), and A (by 11.5–57%) were found, compared to plots with triticale and maize. In 2018, the lowest values of gs, E and ci were obtained on the plot of cultivation of maize after maize, and in 2017, the lowest value of ci was noted after triticale. The triticale and maize forecrops reduced A similarly (not significant between each other) in both years of the study. Maize leaves grown after grassland were characterised by lower T (by 0.7–1.0 °C) in relation to the other, undistinguished forecrops. The significant effect of the compared crop rotations on the chlorophyll (Cl) content in the leaves was evident only in 2017 (
Figure 2a). Its highest content was found in maize grown after grassland and was significantly lower after triticale (by 3.7%) and maize (by 4.2%).
The stand with the cultivation of maize-after-maize provided significantly better water use in the process of photosynthesis by this plant (
Table 4). The WUE index was higher (on average by more than 30%) than in the plots after undistinguished grassland and after triticale in both study years. Larger differences between experimental objects were noted in 2018. However, PWUE was characterised by higher values (76.1% to 371.1%) both after maize and after triticale than after grassland. The effect of forecrops on gm (as at BBCH 35 stage) was ambiguous. In 2017, gm was significantly higher after triticale than after grassland, while in 2018, higher values after grassland and triticale than after the other forecrops were noted. Different results from those obtained at BBCH 36 stage were found for PNUE. In 2017, the highest efficiency of nitrogen use in the photosynthesis process was observed in maize on the plot after triticale and the lowest after grassland. However, in 2018, the PNUE index reached the highest values after grasslands and the lowest after triticale.
On the plot after grassland (
Table 4), stomata displayed significantly lower resistance (ls) to CO
2 transfer, while leaves used PAR more efficiently in photosynthesis (LUE) than after triticale and maize. The Ls on this plot in both years of the study were 36.4% to 64.4% lower than after triticale and maize. However, the LUE in this graph in 2017 was higher than after triticale and maize by 18.8% and 58.3%, respectively, and in 2018 it was more than five times higher after triticale.
Maize grown after grasslands (
Table 5) developed leaves with a greater area (LA), higher leaf area index (LAI), lower leaf mass per area (LMA), and higher N content per unit of leaf area (N
area) in both years of the study, compared to the other forecrops (except LA in 2018, in which no significant differences were found between grasslands and triticale). In terms of foliage and yield (
Figure 3), the least favourable plot appeared to be maize-after-maize. On this plot, compared to the plots after grasslands, the plants had lower LA (by 4.2–8.0%), LAI (by 9.6–11.3%), N
area (by 4.3–5.1%), and higher LMA (by 4.8–8.8%). This was reflected in silage biomass yield, which was significantly higher after grassland than after triticale (by 16.6% in 2017 and by 12.3% in 2018) and after maize (by 27.1% and 25.9%, respectively). The forecrops significantly differentiated the share of cobs in the silage biomass yield only in 2018 (
Figure 4). This share was higher after triticale than after the other forecrops.
Correlation analysis at BBCH 36 stage in the post-grassland stand (
Supplementary Materials Table S1) showed a significant positive relationship between A and: Cl (0.78), LUE (0.97), and gm (0.83), and a negative correlation with WUE (−0.92). At the same time, an increase in ci was accompanied by a decrease in ls (−0.99). In the maize stands cultivated after triticale and after maize (
Supplementary Materials Tables S2 and S3), the studied traits showed a significant relationship with each other (except for ci and g
m and ci and l
s in the stand after triticale and A and PWUE in the stand after maize). In the maize stand after triticale, A was significantly positively correlated with Cl content in leaves (0.70), gs (0.70), ci (0.64), gm (0.94), and LUE (0.93), and negatively correlated with WUE (−0.74) and PWUE (−0.93). Significantly, this process (A) was also positively correlated with ls (0.79). There was a negative correlation between A and T (−0.86) and A and E (−0.64). On the plot with maize cultivation after maize, A was significantly, positively correlated with Cl content in leaves (0.80), gs (0.81), ci (0.79), and LUE (0.91) and WUE (0.86) indices. Simultaneously, a decrease in A was accompanied by an increase in T (−0.76), E (−0.75), gm (−0.59), and ls (−0.82).
At BBCH 65 stage (
Supplementary Materials Table S1), on the post-grassland maize crop plot, A was significantly positively correlated with the Cl (0.77), LUE (0.93), WUE (0.94), and PWUE indices (0.65), gm (0.91) N area (0.45) and silage biomass yield (0.81). In the maize-growing plot after triticale (
Supplementary Materials Table S2), A was significantly positively correlated with LUE (0.74), WUE (0.96), and gm (0.70), and negatively correlated to LMA (−0.49). On the maize cultivation plot after maize (
Supplementary Materials Table S3), A was positively correlated with Cl (0.93) WUE (0.97), PWUE (0.89) ls (0.87), and with yield (0.64). A negative relationship was found between A and: T (−0.78), gs (−0.71), E (−0.75), ci (−0.84), gm (−0.95), LUE (−0.75)), and PNUE (−0.71).
4. Discussion
The yield of maize biomass is largely determined by photosynthesis, which lasts throughout the plant’s growing season. Limiting environmental factors has an inhibiting effect on this process [
5,
20]. Although maize is considered a plant more tolerant to changes in applied environmental factors and crop production techniques, the study demonstrated a significant effect of 2-year crop rotation cycles (grassland-maize, triticale-maize, maize-maize) on the course of leaf gas exchange and the yield of silage biomass.
The present study documented the beneficial and consequent effect of multi-species, gramineous, and papilionaceous grasslands on stomatal conductance (gs) and transpiration rate (E) and, in addition, at BBCH 65 stage, on intercellular CO
2 concentration (ci) and net assimilation rate (A). This was due to the greater assimilation area of the leaves, greater LAI, and a higher (although not significantly) chlorophyll content in the leaves, which supported the photosynthetic process. Studies by Janusauskaite et al. [
21] and Wang et al. [
22] also demonstrated that physiological processes ran more smoothly under favourable environmental conditions. The multi-species grassland composed of highly productive grasses and productive papilionaceous plants (whose proportion was almost 50%) had a positive effect on the soil structure, the contents of Corg, nitrogen, and other elements in the soil, the moisture content and the rich, diverse, and sustainable biological life of the soil [
23]. Thus, it created favourable conditions for the maize grown after it. This contributed to plants with larger leaf area and lower leaf mass per area (LMA), which was documented in the current study. LMA is an important leaf trait closely related to the physiological, biochemical, and structural features of the leaves. Lower values of this trait indicate a faster transfer of CO
2 to a carboxylation place due to, among others, lower leaf density, lower thickness of cell walls, lower concentration of structural carbohydrates (SCs), and lignin, as well as larger intercellular spaces [
24,
25]. In the present study, at this experimental site, a significant (negative) correlation between LMA and the gas exchange parameters (such as CI, GM, and A) was found, and this correlation confirms the above statements.
Zhang et al. [
26] demonstrated that an increase in N fertilisation increased the CI content in the leaves. Nitrogen can affect both the regulation of the stomatal apparatus in plants and the efficiency of the photosynthetic apparatus by increasing the chlorophyll content in leaves [
27]. The current study also found that the Cl content after this forecrop was higher than after triticale and maize (except for the BBCH 65 phase in 2018). A close relationship between Cl and LUE (0.80), A (0.77), and the yield of silage biomass (0.79) was proved. A significantly higher Narea was also noted after grassland, which indicated a positive correlation with Cl and A. Transpiration could be regulated by the root conductivity, which, in turn, is determined by nutrients [
28]. After this forecrop, an increase in E was observed compared to the triticale and particularly the maize forecrops in both studied periods. This could have led to an increase in nutrient content in plants, which increased plant metabolism, including the enzymatic activity of RuBisCo (the crucial enzyme in photosynthesis). Consequently, this translated into photosynthetic efficiency [
29,
30]. As part of the analysed experiment, after grassland (at the BBCH 65 stage), a significant relationship was demonstrated between gs and E and A. This is consistent with the results of studies by other authors [
7] and indicates the important role played by gs in the photosynthetic capacity of the leaves.
The increase in E resulted in a reduction in T. A lower leaf temperature is an important indicator of more intense plant metabolism [
31]. An efficiently functioning assimilation apparatus enabled the rapid transport of CO
2 absorbed from the intercellular space (ci) to the carboxylation site (gm) at the stem elongation stage (BBCH 35). However, at the flowering stage (BBCH 65), a greater accumulation of CO
2 in the intercellular spaces was noted after this forecrop than after triticale and maize. In this case, the photosynthetic apparatus could not ’transport’ the CO
2 absorbed in large quantities due to the opening of the stomata to the mesophyll cells. This could have been due to the structural characteristics of the mesophyll, such as its thickness or weight [
32,
33,
34]. After grassland, the yield of maize silage biomass was significantly higher than after winter triticale and after maize (by 41% and 75%, respectively). Photosynthesis had a significant effect on mean biomass. This was confirmed by the results of the authors’ study, which demonstrated a close relationship between A and the yield at the site of maize cultivation after grassland (0.81). The yield was also significantly positively correlated with the contents of Cl, gs, ci, gm, LUE, WUE, and PWUE in the leaves and inversely correlated with ls. Therefore, the lower resistance to stomatal (ls) allowed for a smooth transfer of CO
2 from the atmosphere to the leaf’s interior. The plants also made more efficient use of light, water, and nitrogen in the photosynthetic process, which translated into the yield biomass. However, the site after grassland had no effect on the proportion of cobs in the yield, which, after the analysed forecrops, was at a similar level.
The cultivation of maize after winter triticale and in succession to maize resulted in adverse changes in the soil environment. In this environment, the plants were under stress, which disrupted the photosynthetic process. Carmo-Silva et al. [
35] showed that under the influence of minor or medium stress, photosynthesis is limited by the closing of the stomata. The stomatal apparatus is very susceptible to changes in the environment. Under unfavourable conditions, the stomata are closed, which restricts the fixation of CO
2 from the atmosphere to the cell interior [
36]. This is one of the main reasons for the drop in plant productivity. However, closing the stomata protects the plant against water loss, which was confirmed by the results of the current trial. Gs at the sites after triticale and after maize was significantly lower than after grassland in both studied periods. This had a limiting effect on E and the increase in ls in CO
2 flow (at the BBCH 65 stage). The stomata closure resulted in a smaller CO
2 flow to the mesophyll cells, leading to a reduction in the A value. This was confirmed by analysing the correlation between gs and A (BBCH 65). The relationship between gs and A is also indicated by Brito et al. [
9] and Boughalleb et al. [
37]. The stomatal closure (and thus a reduction in transpiration due to the conditions being unfavourable for maize) resulted in an increase in the WUE and PWUE indices that are very important and determined by stomatal opening or closure. WUE is species-specific and is controlled by the partial or full opening of the stomata as well as by partial closure of the stomata, which contributes to plant turgidity. It may be varying the transpiration rate from the leaf canopy level [
3,
9]. An improvement in these indicators occurs through a reduction in E due to stomatal limitation [
38,
39]. At the same time, it protects the plant against water loss and a reduction in the turgor pressure. The situation was similar in the current study. After maize, an increase in WUE and PWUE (also after triticale) was noted in relation to the field after grassland. Furthermore, a negative correlation was found between gs and WUE and PWUE at the site after triticale (except WUE at the BBCH 65 stage) and after maize. At the sites of maize cultivation after triticale and after maize, the gs and E values decreased more than the A values, which resulted in an increase in the WUE and PWUE indices. As in the case of the object with maize cultivation after grassland on the objects after triticale and maize, correlations between gs and A were demonstrated, which once again emphasised the significant role played by the stomatal apparatuses in the photosynthetic process.
The closing of the stomata reduced E, which led to an increase in T [
40]. Fang et al. [
41] report that the increase in leaf temperature is linked to decreased plant metabolism (a reduction in both the CO
2 flow and transpiration). This is confirmed by the correlation analysis, which demonstrated a significant negative correlation between T and gs, gm (except the site of maize cultivation after maize at the BBCH 65 stage), E, and A. At the BBCH 65 stage, at the sites of maize cultivation after triticale and after maize, the higher T was also significantly related to the lower ci, after triticale to LUE and, after maize, to LA, LAI, PNUE, and Yield. At the same time, at the BBCH 36 stage after triticale and, particularly after maize, there was a significant increase in ci, accompanied by an increase in T. This indicates a disruption that occurred in the CO
2 flow inside the leaves [
38]. The assimilation apparatus, due to the lower efficiency, was not able to use up the CO
2 accumulated in the intercellular spaces. However, at the BBCH 65 stage, the closing of the stomata resulted in a reduction in ci in the leaves of maize cultivated after triticale. However, a lower ci did not contribute to a significant reduction in gm. On the contrary, a negative correlation between these parameters was noted at this site. However, after this forecrop, a close correlation was found between gm and A, proving that at the carboxylation site, the assimilation apparatus was functioning efficiently. On the other hand, the opposite situation was noted after maize, as the greater concentration of ci did not translate into an increase in gm. The obtained result may indicate a disturbance in CO
2 flow to the mesophyll and its cells. Therefore, at this site, the reductions in CO
2 flow were related to both the stomatal aperture and the effect of non-stomatal factors involved in assimilation. This is indicated by the assimilation being lower than after grassland, demonstrating a negative relationship with gm. Mesophyll conductance (gm) is an indicator of a nonstomatal factor involved in CO
2 assimilation, such as disruptions in chloroplast morphology and arrangement, lower activity of enzymes in the C4 pathway (including RuBisCo, PEPC), or a greater density of the mesophyll cells, impaired cell membrane conductance, and photophosphorylation [
42]. Ultimately, despite the lack of significant differences between the forecrops in gm, there was a decrease in carboxylation at the site after maize [
43,
44]. Therefore, a combination of unfavourable environmental factors related to maize cultivation in succession to triticale and maize resulted in a reduction in A, and after maize, it additionally increased the susceptibility of the stomatal apparatus to photoinhibition [
45]. Disturbances in the course of photosynthesis under the conditions of cereal cultivation after cereals were also noted by Wanic and Treder [
10].
When the environment fails to support plant growth, poorer leaf development often occurs, to the point of wilting and dying out [
3,
46]. This results in a reduction in LAI, which determines the reduction in PAR absorption [
47]. In the current study, the cultivation of maize after triticale and maize after maize resulted in a significant reduction in both LA and LAI (except for the site after triticale in 2018). This had a negative effect on the efficiency of PAR use in the photosynthetic process and ultimately on the yield of maize silage biomass; confirmed at the BBCH 65 stage by the significance of correlation coefficients at the site of maize cultivation after maize between LAI and LUE (0.80) and between LAI and Yield (0.71). However, at the site after triticale, no such relationship was noted. After this forecrop, the reduction in the yield must have been determined by other factors not related to foliage. At the leaf level, if the stress is not great, the reduction in CO
2 uptake is a consequence of the reduction in gs, without damaging the photosynthetic apparatus, due to the morphological and physiological adaptation [
35]. Based on the current study, it can be concluded that in both measurements periods after triticale and at the BBCH 36 stage after maize, assimilation was determined by factors related to the stomatal aperture. This is indicated by the positive correlation between gs and A. Furthermore, under the conditions of maize cultivation after maize, the value of A was also determined by non-stomatal factors.
Flowering is the phase of the transition of a plant from vegetative to generative development. During this period, the maize exhibits high susceptibility to stress, which affects the net assimilation rate and the yield. In the authors’ own study, the maize cultivated after triticale and after maize was also characterised at the flowering stage by a reduction in A. Also, Setter et al. [
48] showed that a reduction in A occurs to a similar extent in the pre- and post-flowering periods.
The reduction in assimilation was reflected in the yield of silage biomass, which, after triticale and after maize, was lower than after grassland (averaged for years by 12.5% and 20.9%, respectively). Księżak et al. [
49] also noted a reduction in the yield of monocultured maize. The yield of silage biomass of maize cultivated after grassland showed a significant dependence on A (0.81). However, in the fields after triticale and after maize, no significant correlation between these characteristics was demonstrated. At these sites, a decrease in the photosynthesis rate was noted, but it was not as great as the reduction in maize yield. Therefore, it can be assumed that the quantity of the yield of the maize cultivated after grassland was mainly determined by photosynthesis-related factors. After poorer forecrops, factors unrelated to the assimilation apparatus also affected the yield volume. Meanwhile, Ahmad et al. [
50] and Ҫakir [
51] reported that under adverse environmental conditions (drought), both the maize dry biomass and the net photosynthetic rate decreased to a similar extent. Therefore, it can be assumed that the quantity of the yield of the maize cultivated after grassland was mainly determined by photosynthesis-related factors, and after poorer forecrops, factors not related to the assimilation apparatus also affected the yield volume. Explaining the causes of reduced yielding other than by photosynthesis is difficult since they are determined by a combination of many different factors.


