
Postharvest Changes in the Nutritional Properties of Commercial and Traditional Lettuce Varieties in Relation with Overall Visual Quality

 ,
,  ,
,  ,
,  , ,
, ,
Abstract
:1. Introduction
2. Materials and Methods
2.1. Plant Material
2.2. Field Experiment
2.3. Storage Conditions
2.4. Visual Characterization and Weight Loss Determination
2.5. Sample Preparation
2.6. Nutraceutical Compounds and Antioxidant Capacity
2.6.1. Chlorophyll and Carotenoid Concentration
2.6.2. Anthocyanin Concentration
2.6.3. Ascorbic Acid Concentration
2.6.4. Total Phenolic Analysis
2.6.5. Antioxidant Capacity Measurements
2.7. Lipid Peroxidation
2.8. Hydrogen Peroxide Concentration
2.9. Nitrate Quantification
2.10. Mineral Determination
2.11. Statistical Analysis
3. Results
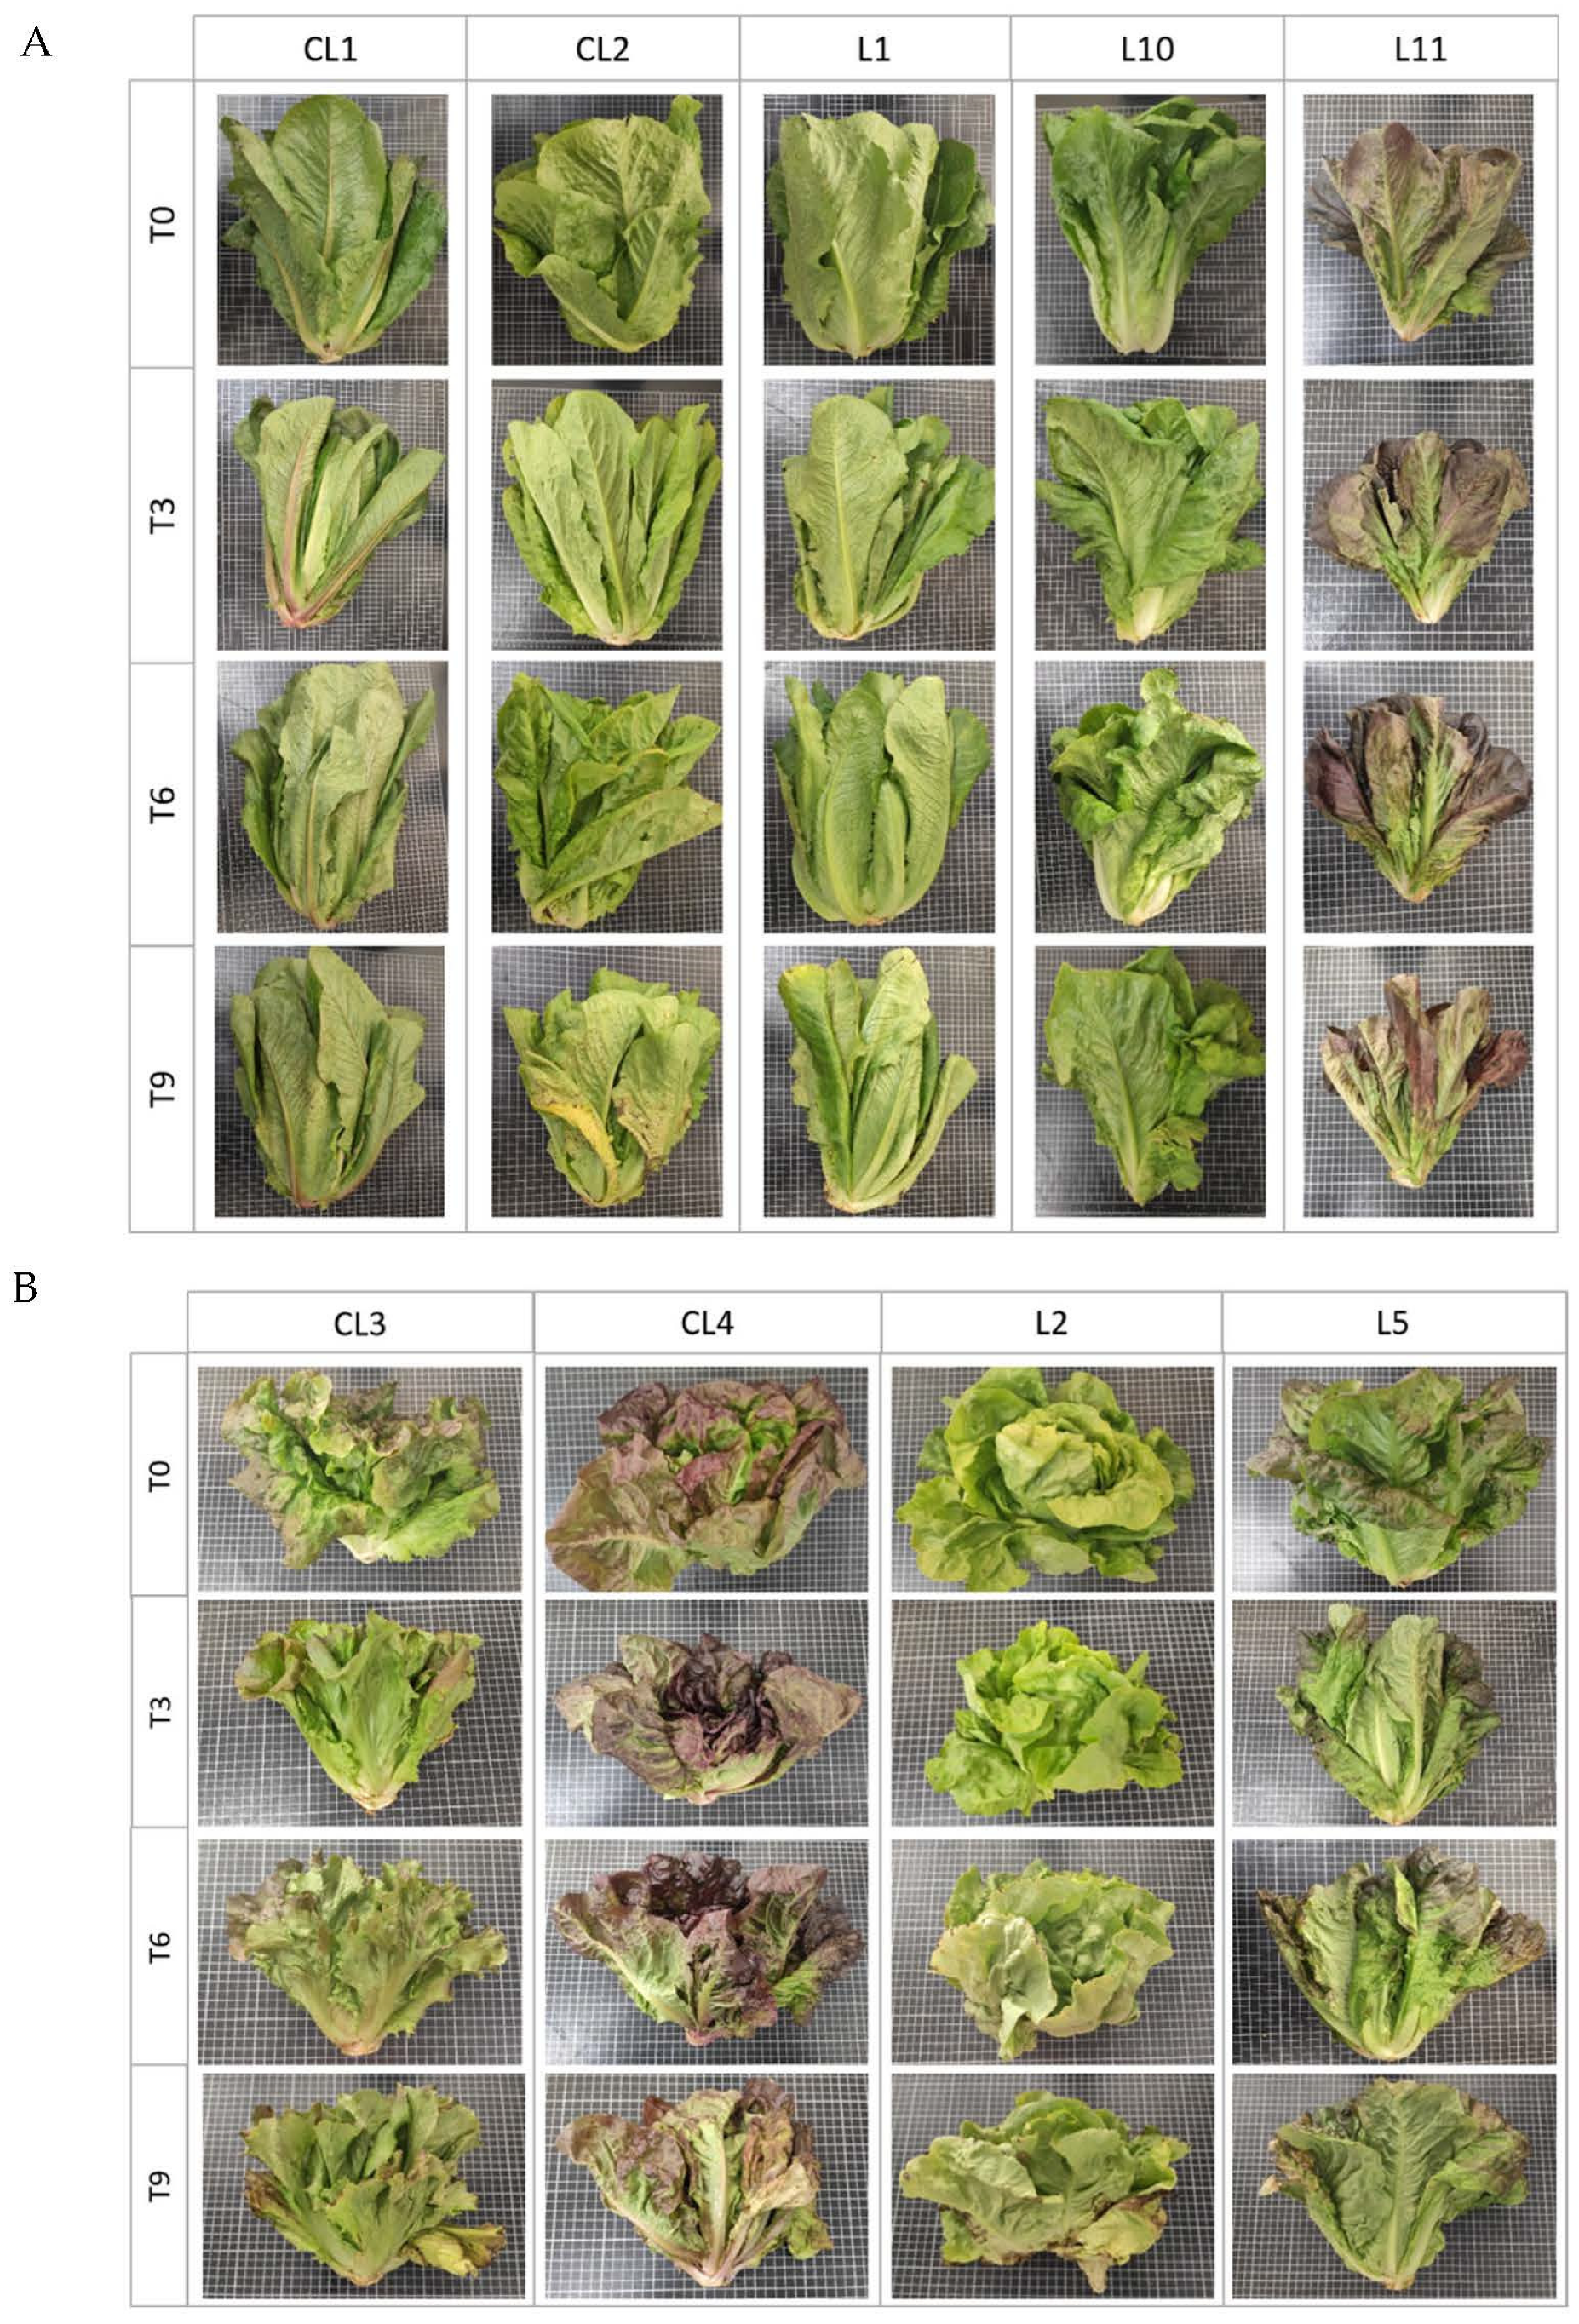
3.1. Visual Damage
3.2. Fresh Weight Loss
3.3. Nutraceutical Compounds and Antioxidant Capacity
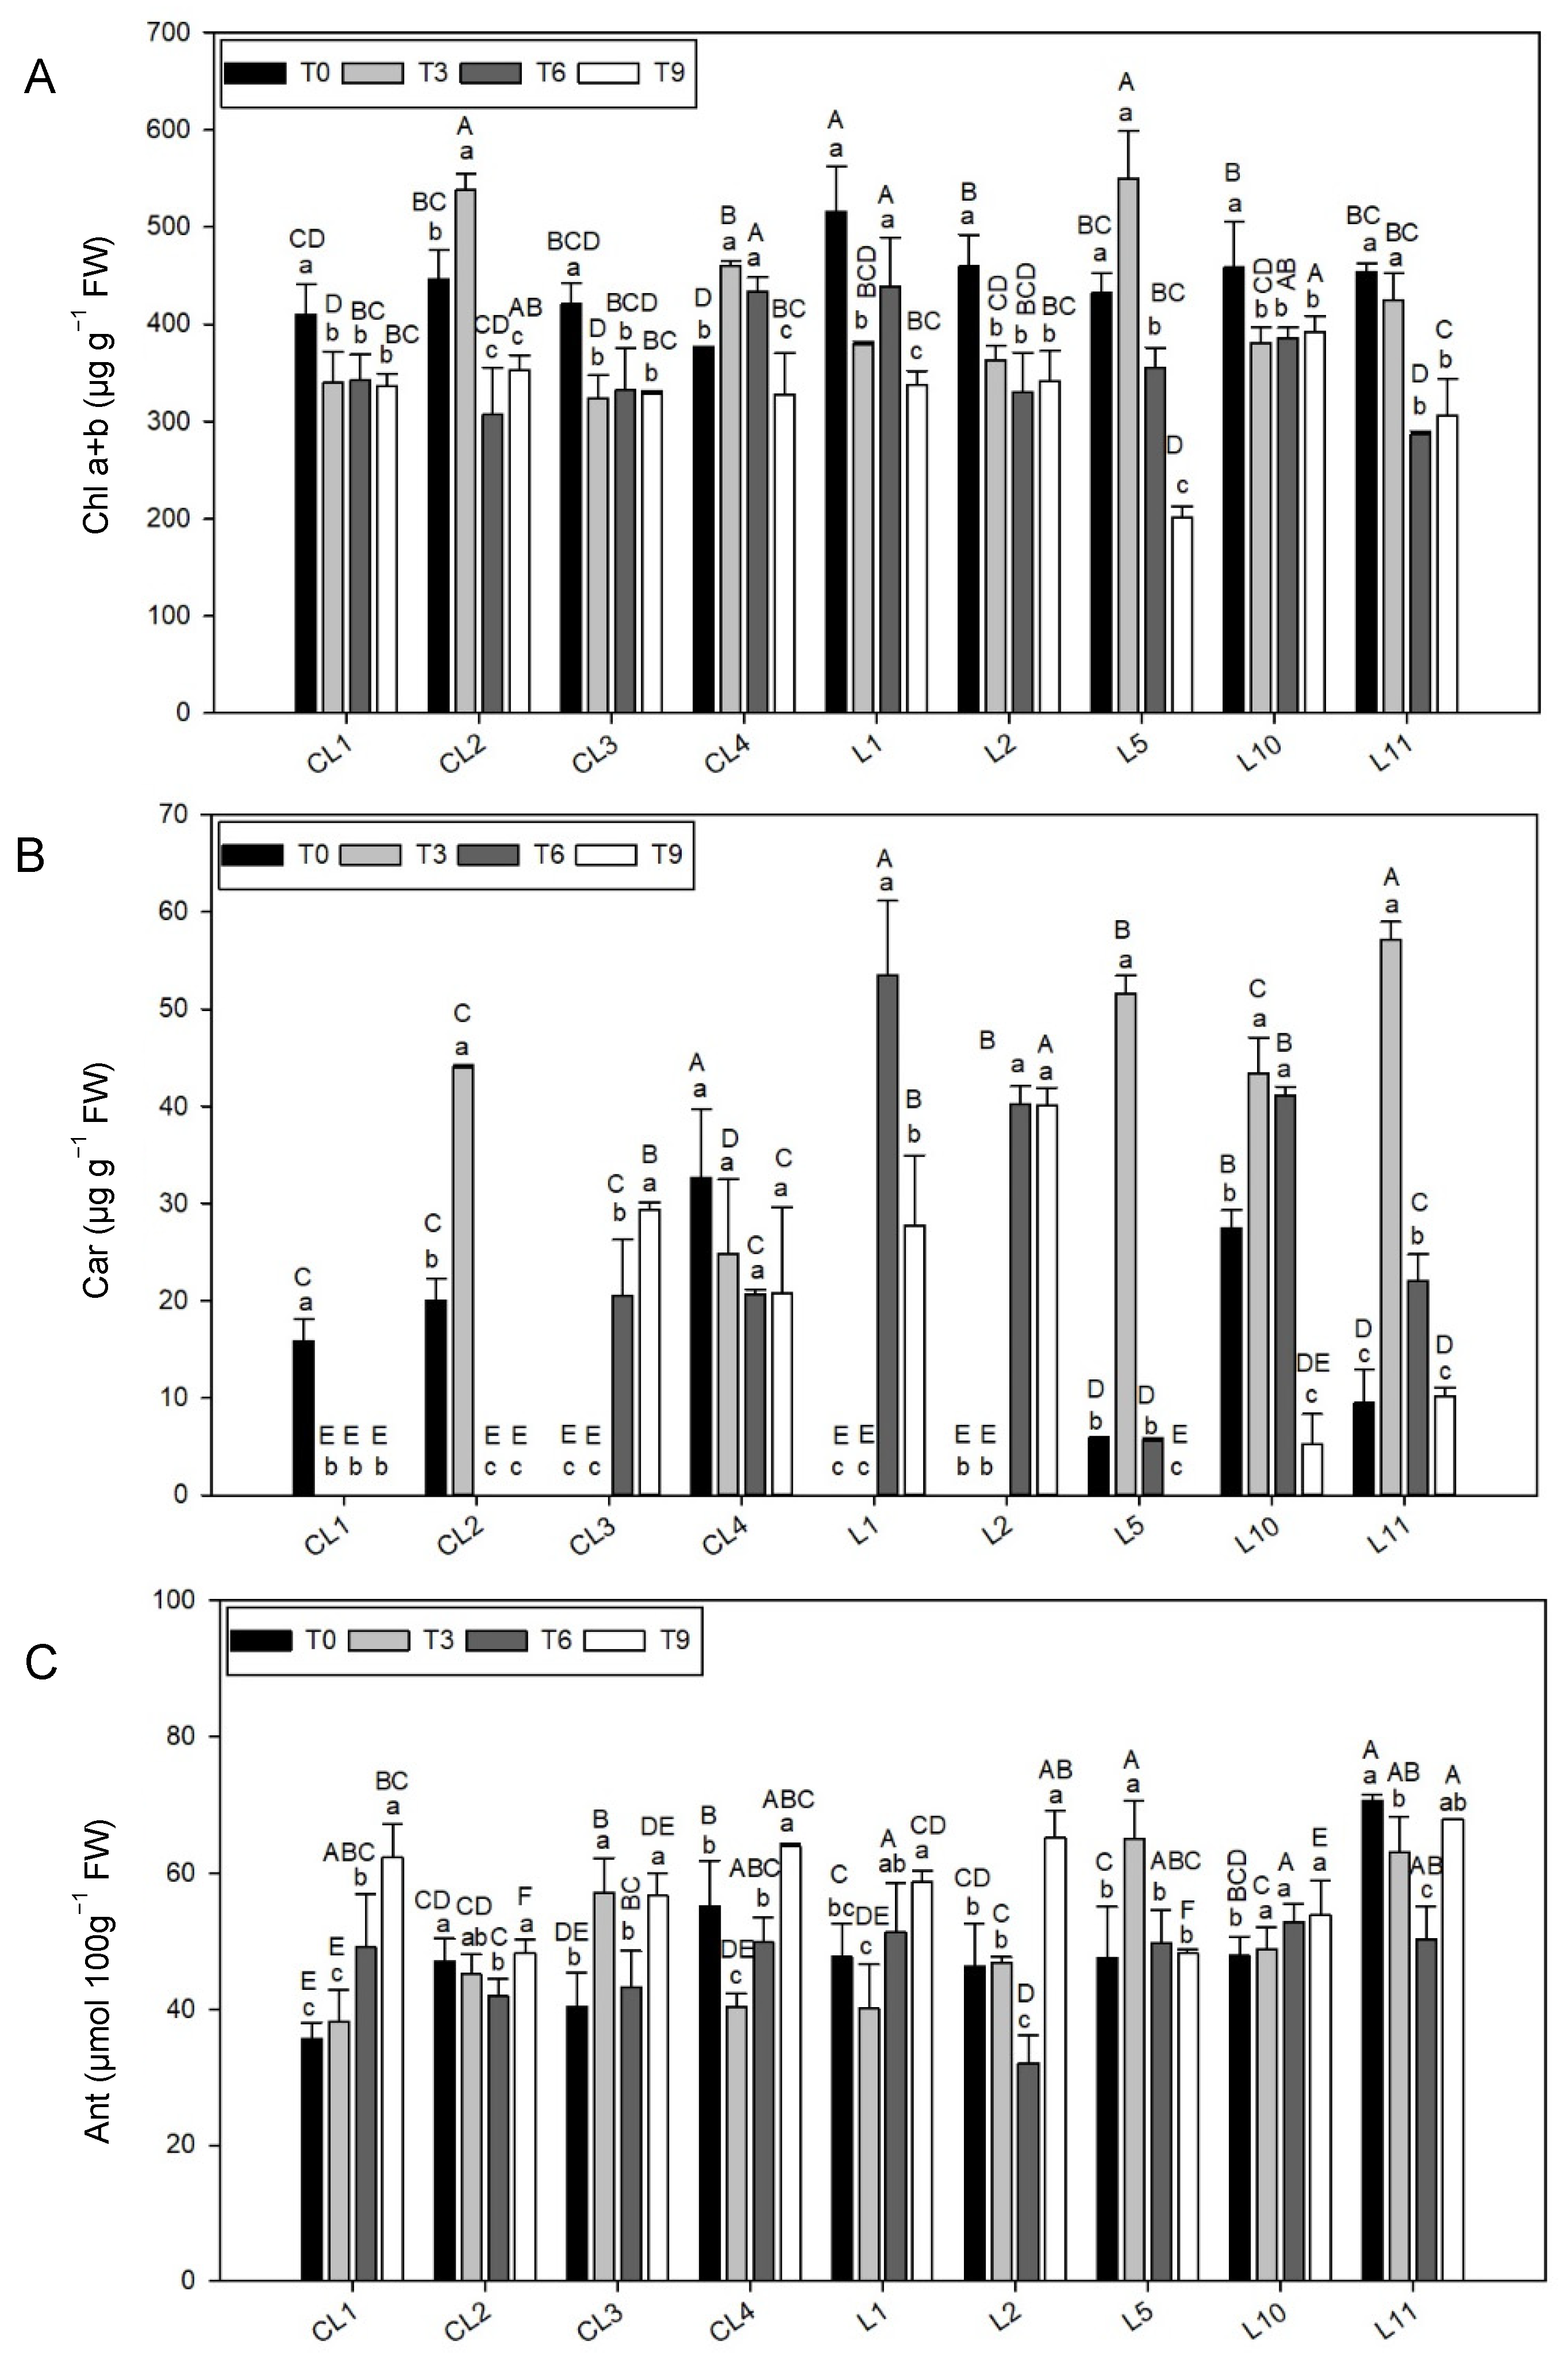
3.3.1. Total Chlorophyll Concentration
3.3.2. Total Carotenoid Content
3.3.3. Anthocyanin Concentration
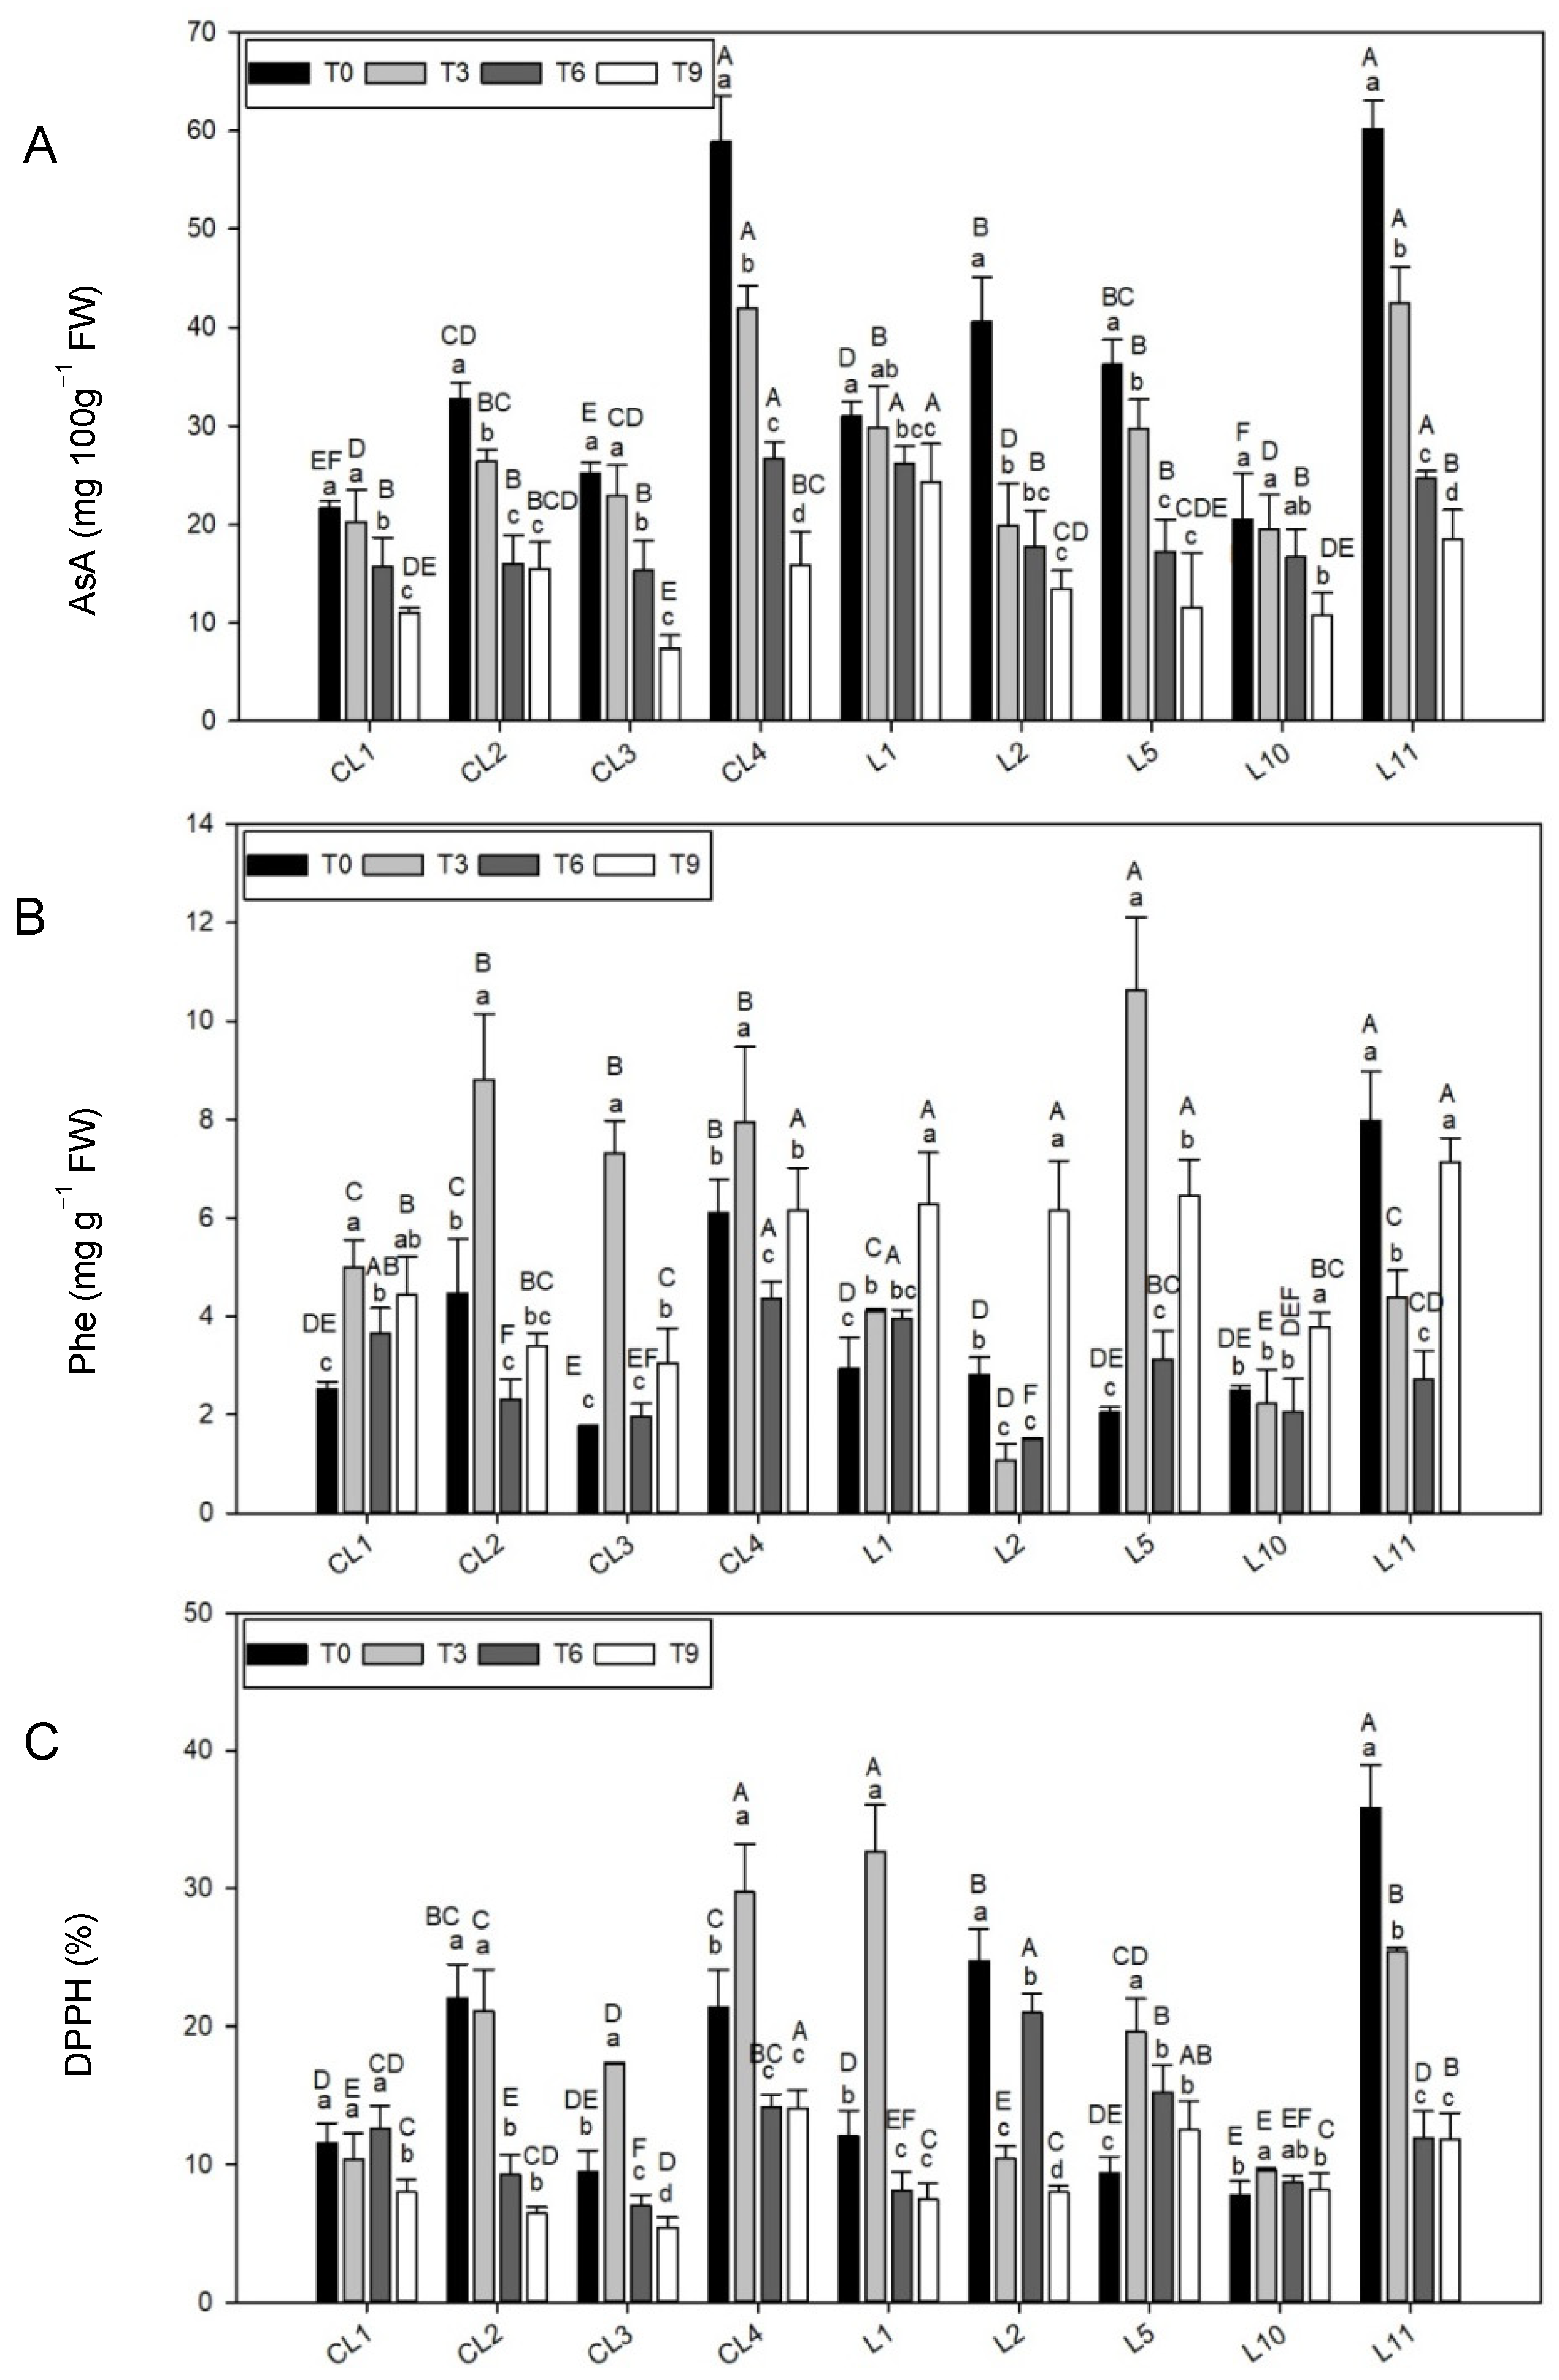
3.3.4. Ascorbic Acid Content
3.3.5. Total Phenolic Content
3.3.6. Antioxidant Capacity
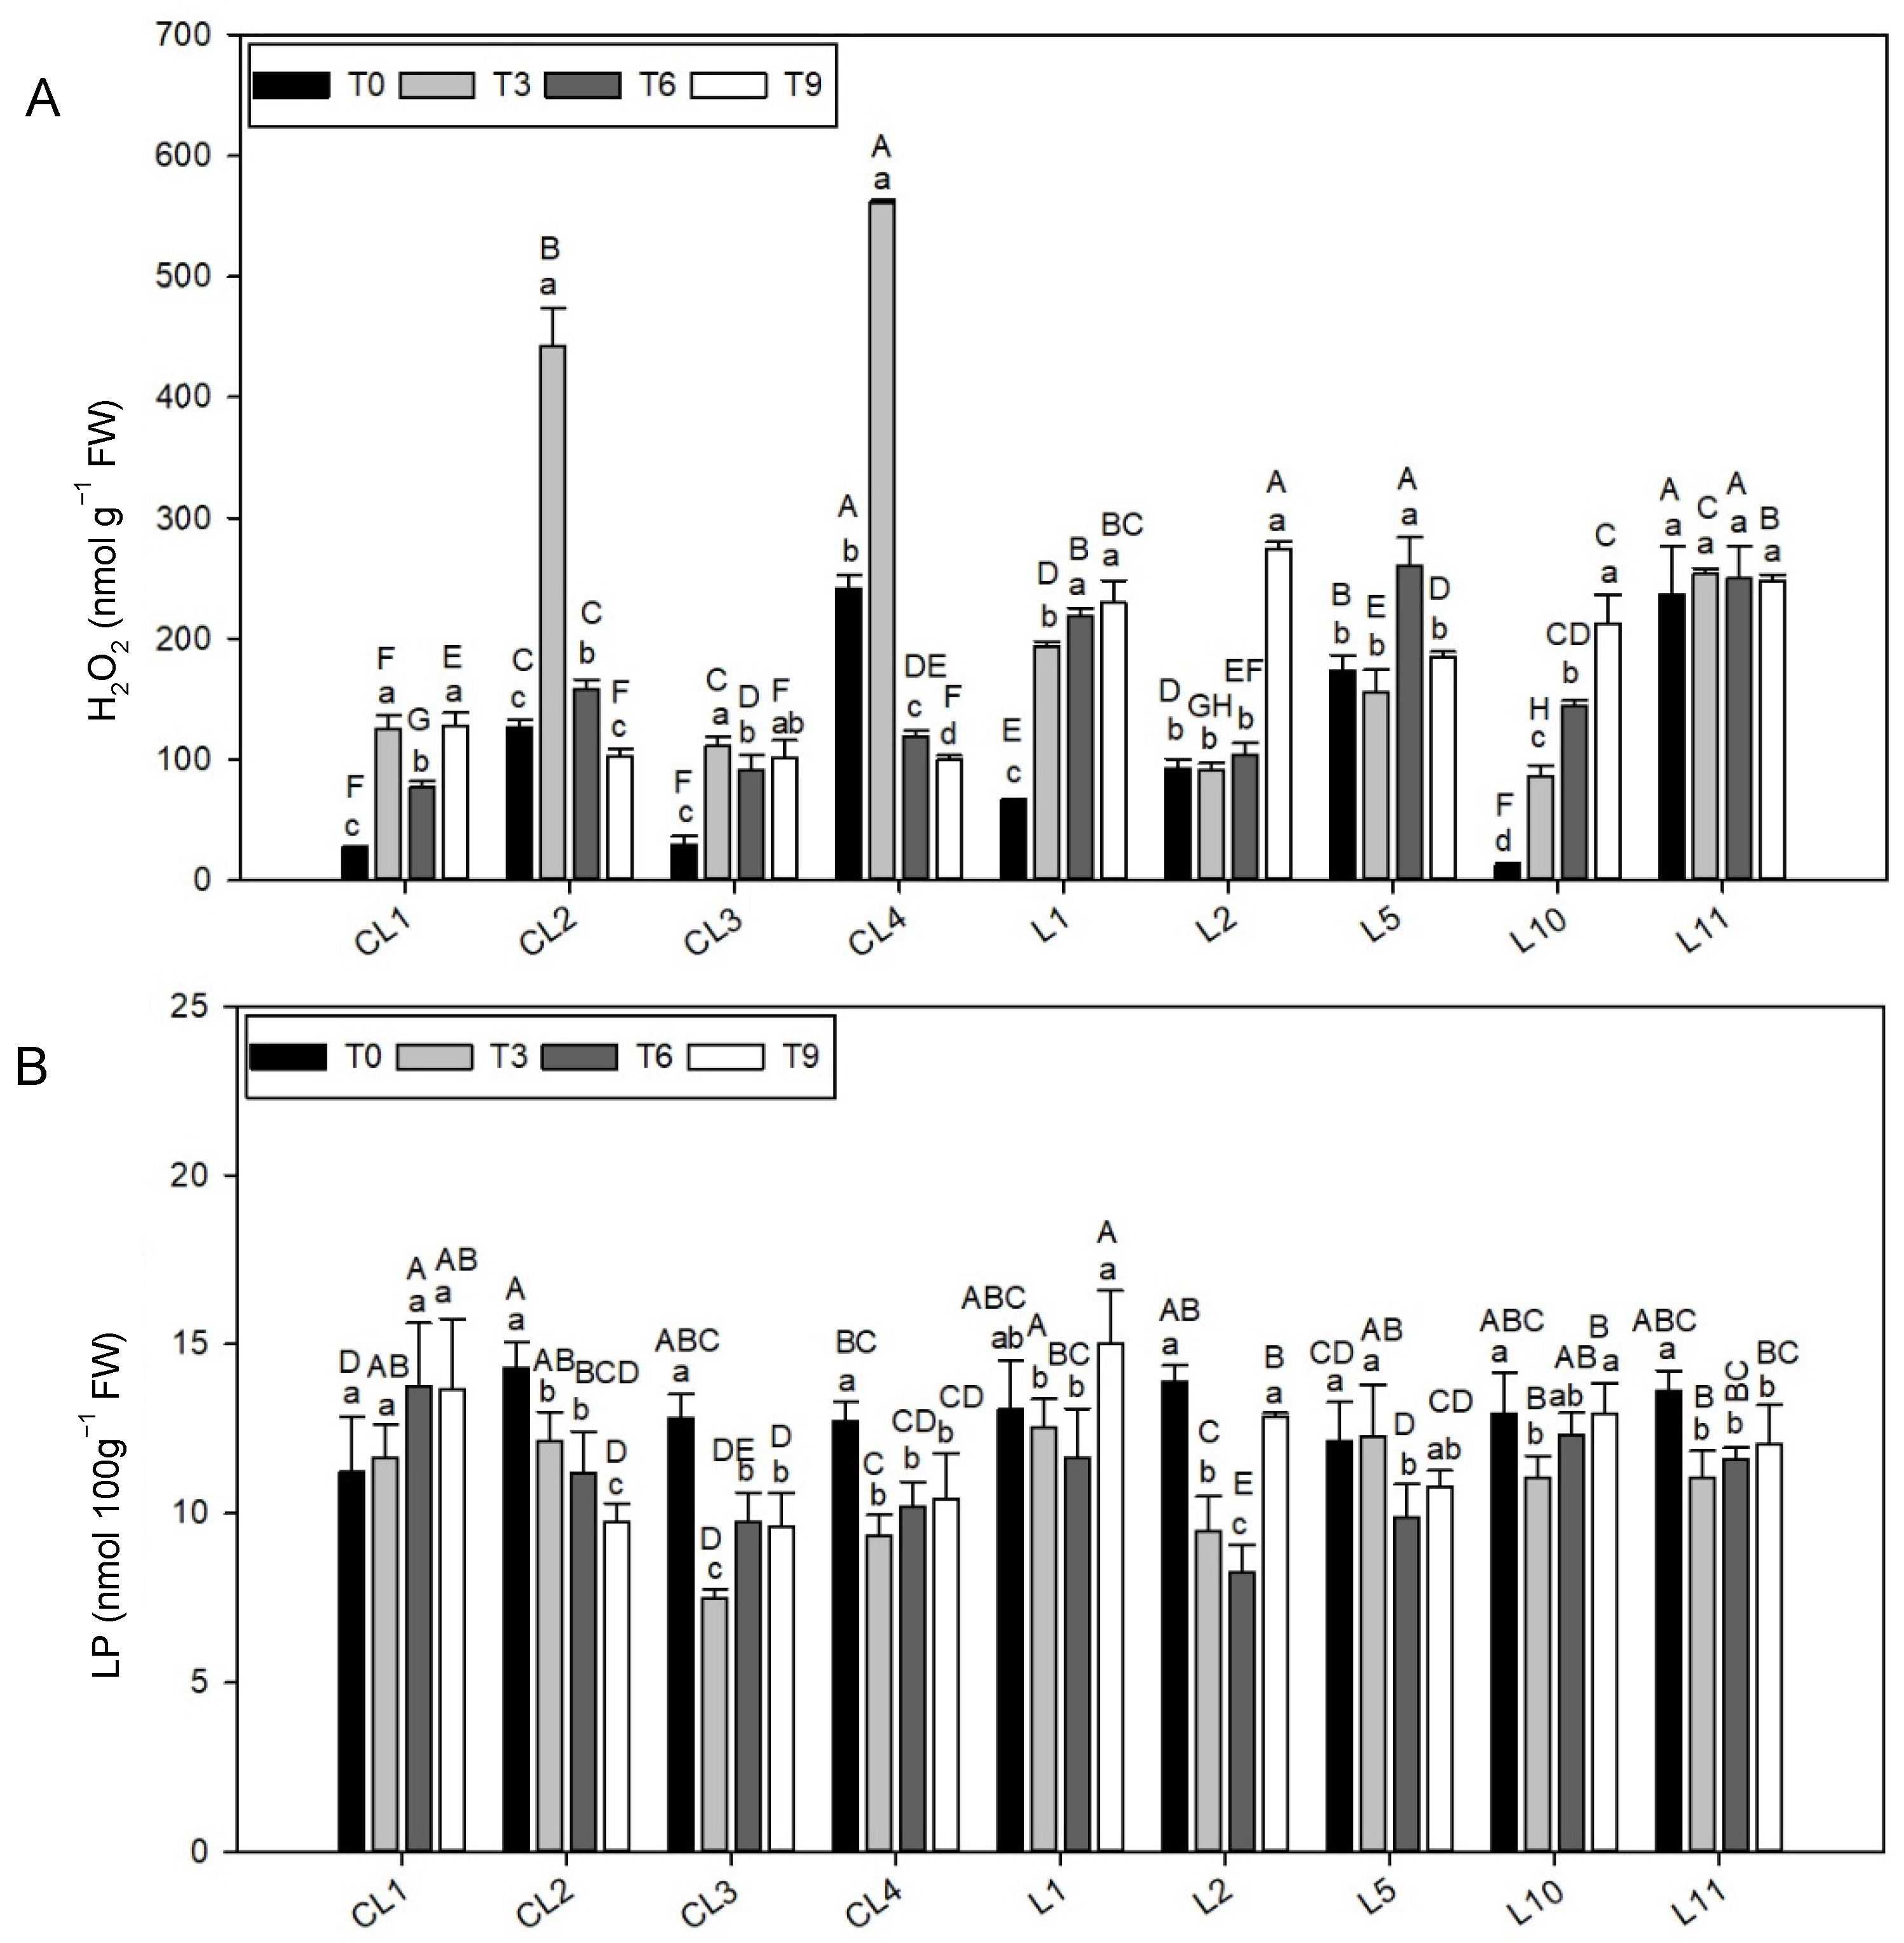
3.4. Hydrogen Peroxide
3.5. Lipid Peroxidation
3.6. Nitrate Concentration
3.7. Mineral Concentration
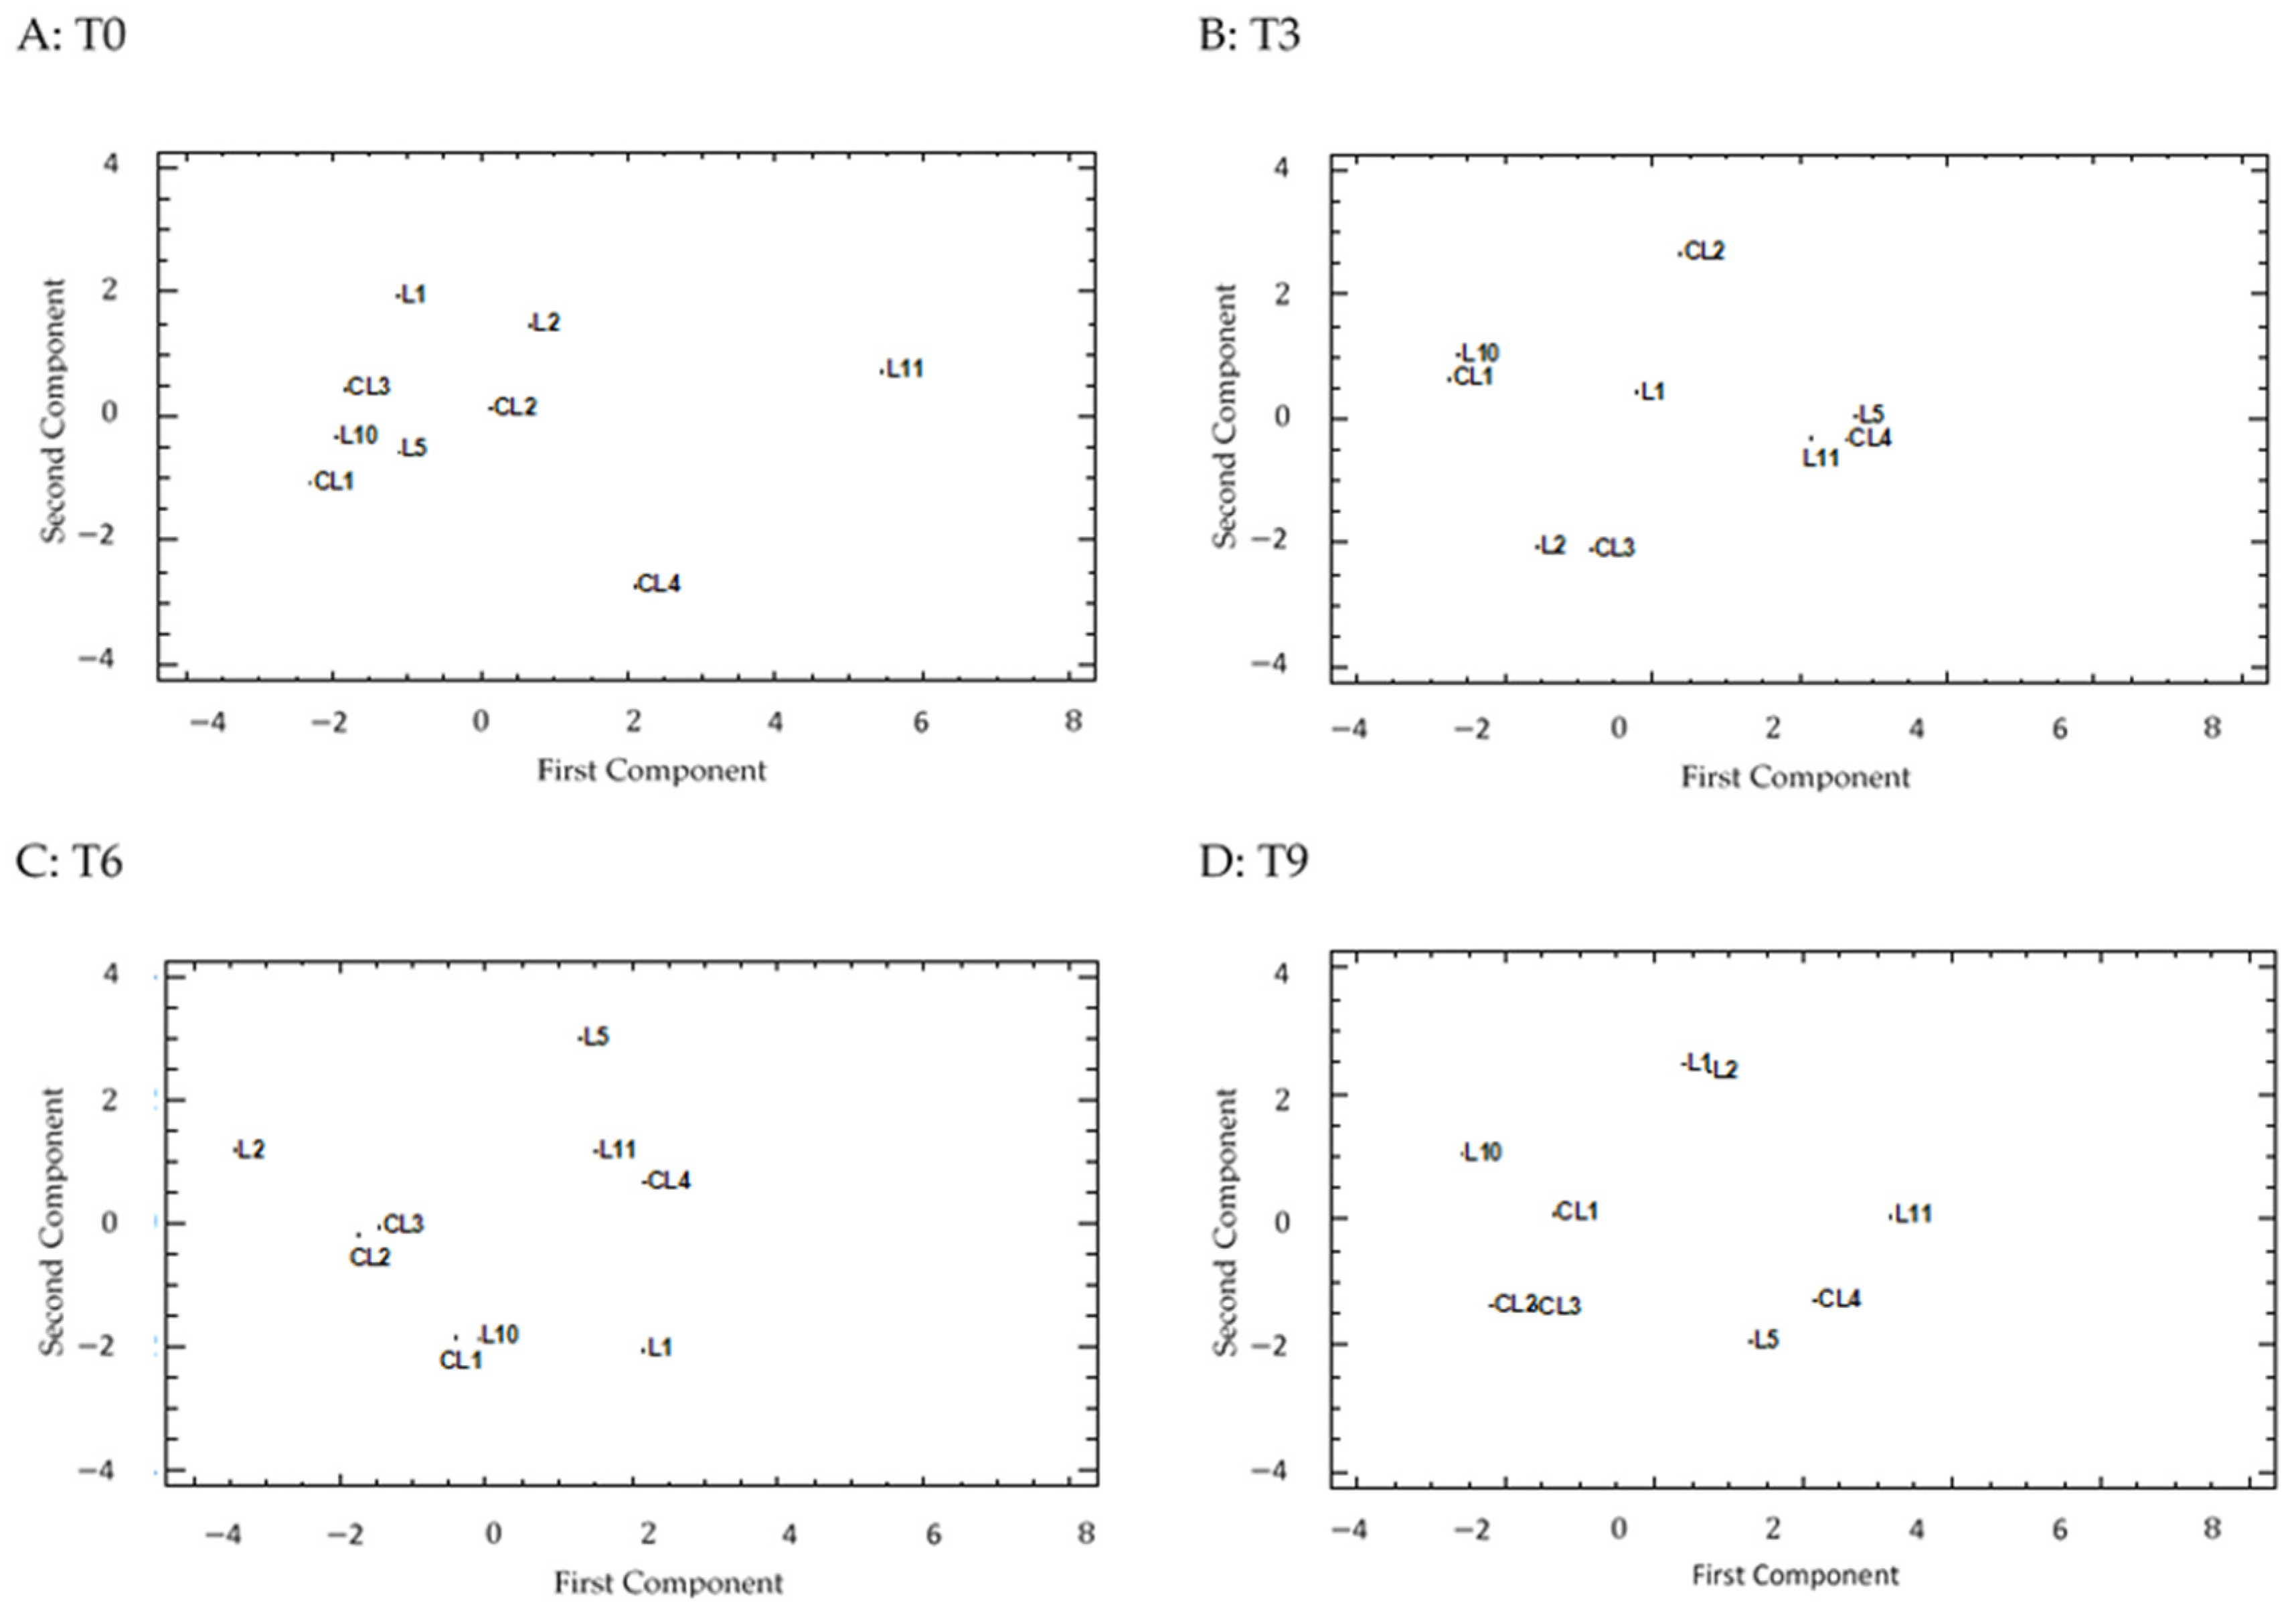
3.8. PCA Analysis
3.9. Correlation between Quality Compounds
4. Discussion
5. Conclusions
Supplementary Materials
Author Contributions
Funding
Institutional Review Board Statement
Informed Consent Statement
Data Availability Statement
Acknowledgments
Conflicts of Interest
References
- Ebert, A.W. Security and Vegetable Breeding. Plants 2020, 9, 736. [Google Scholar] [CrossRef]
- Sumalan, R.-L.; Ciulca, S.-I.; Sumalan, R.-M.; Popescu, S. Vegetable Landraces: The “Gene Banks” for Traditional Farmers and Future Breeding Programs. Landrac.-Tradit. Var. Nat. Breed 2021. [Google Scholar] [CrossRef]
- Brasil, I.M.; Siddiqui, M.W. Postharvest Quality of Fruits and Vegetables: An Overview; Elsevier Inc.: Amsterdam, The Netherlands, 2018; ISBN 9780128098080. [Google Scholar]
- Agüero, M.V.; Barg, M.V.; Yommi, A.; Camelo, A.; Roura, S.I. Postharvest changes in water status and chlorophyll content of lettuce (Lactuca Sativa, L.) and their relationship with overall visual quality. J. Food Sci. 2008, 73, 47–55. [Google Scholar] [CrossRef]
- Lee, S.K.; Kader, A.A. Preharvest and postharvest factors influencing vitamin C content of horticultural crops. Postharvest Biol. Technol. 2000, 20, 207–220. [Google Scholar] [CrossRef] [Green Version]
- Chiesa, A. Factores precosecha y postcosecha que inciden en la calidad de la lechuga. Hortic. Argentina. 2010, 29, 28–32. [Google Scholar]
- Kader, A.A. Postharvest Technology of Horticultural Crops; University of California Agriculture and Natural Resources: Richmond, CA, USA, 2022; p. 3311. [Google Scholar]
- Damerum, A.; Chapman, M.A.; Taylor, G. Innovative breeding technologies in lettuce for improved post-harvest quality. Postharvest Biol. Technol. 2020, 168, 111266. [Google Scholar] [CrossRef]
- Xu, T.; Chen, Y.; Kang, H. Melatonin Is a Potential Target for Improving Post-Harvest Preservation of Fruits and Vegetables. Front. Plant Sci. 2019, 10, 1388. [Google Scholar] [CrossRef] [Green Version]
- do Nascimento Nunes, M.C. Color Atlas of Postharvest Quality of Fruits and Vegetables; John Wiley & Sons: Hoboken, NJ, USA, 2009. [Google Scholar]
- Kim, M.J.; Moon, Y.; Tou, J.C.; Mou, B.; Waterland, N.L. Nutritional value, bioactive compounds and health benefits of lettuce (Lactuca sativa L.). J. Food Compos. Anal. 2016, 49, 19–34. [Google Scholar] [CrossRef]
- Mou, B.; Ryder, E.J. Relationship between the nutritional value and the head structure of lettuce. Acta Hortic. 2004, 637, 361–367. [Google Scholar] [CrossRef]
- Baslam, M.; Morales, F.; Garmendia, I.; Goicoechea, N. Nutritional quality of outer and inner leaves of green and red pigmented lettuces (Lactuca sativa L.) consumed as salads. Sci. Hortic. 2013, 151, 103–111. [Google Scholar] [CrossRef]
- Song, J.; Huang, H.; Hao, Y.; Song, S.; Zhang, Y.; Su, W.; Liu, H. Nutritional quality, mineral and antioxidant content in lettuce affected by interaction of light intensity and nutrient solution concentration. Sci. Rep. 2020, 10, 1–9. [Google Scholar] [CrossRef] [Green Version]
- Siomos, A.S.; Papadopoulou, P.P.; Dogras, C.C.; Niklis, N.D. Quality of Romaine and leaf lettuce at harvest and during storage. Acta Hortic. 2002, 579, 641–646. [Google Scholar] [CrossRef]
- Brücková, K.; Sytar, O.; Ẑivĉák, M.; Brestič, M.; Lebeda, A. Vplyv podmienok pestovania na akumuláciu flavonolov a antokyánov v zelenom a červenom šaláte. J. Cent. Eur. Agric. 2016, 17, 986–997. [Google Scholar] [CrossRef]
- Camejo, D.; Frutos, A.; Mestre, T.C.; del Carmen Piñero, M.; Rivero, R.M.; Martínez, V. Artificial light impacts the physical and nutritional quality of lettuce plants. Hortic. Environ. Biotechnol. 2020, 61, 69–82. [Google Scholar] [CrossRef]
- Rouphael, Y.; Cardarelli, M.; Bassal, A.; Leonardi, C.; Giuffrida, F.; Colla, G. Vegetable quality as affected by genetic, agronomic and environmental factors. J. Food. Agric. Environ. 2012, 10, 680–688. [Google Scholar]
- Pinto, E.; Almeida, A.A.; Aguiar, A.A.; Ferreira, I.M.P.L.V.O. Comparison between the mineral profile and nitrate content of microgreens and mature lettuces. J. Food Compos. Anal. 2015, 37, 38–43. [Google Scholar] [CrossRef]
- Pinto, E.; Almeida, A.A.; Aguiar, A.A.; Ferreira, I.M. Changes in macrominerals, trace elements and pigments content during lettuce (Lactuca sativa L.) growth: Influence of soil composition. Food Chem. 2014, 152, 603–611. [Google Scholar] [CrossRef]
- Koudela, M.; Petříková, K. Nutrients content and yield in selected cultivars of leaf lettuce (Lactuca sauva L. var crispa). Hortic. Sci. 2008, 35, 99–106. [Google Scholar] [CrossRef] [Green Version]
- Simko, I. Genetic variation and relationship among content of vitamins, pigments, and sugars in baby leaf lettuce. Food Sci. Nutr. 2019, 7, 3317–3326. [Google Scholar] [CrossRef] [Green Version]
- Colonna, E.; Rouphael, Y.; Barbieri, G.; De Pascale, S. Nutritional quality of ten leafy vegetables harvested at two light intensities. Food Chem. 2016, 199, 702–710. [Google Scholar] [CrossRef]
- Konstantopoulou, E.; Kapotis, G.; Salachas, G.; Petropoulos, S.A.; Karapanos, I.C.; Passam, H.C. Nutritional quality of greenhouse lettuce at harvest and after storage in relation to N application and cultivation season. Sci. Hortic. 2010, 125, 93.e1–93.e5. [Google Scholar] [CrossRef]
- Llorach, R.; Martínez-Sánchez, A.; Tomás-Barberán, F.A.; Gil, M.I.; Ferreres, F. Characterisation of polyphenols and antioxidant properties of five lettuce varieties and escarole. Food Chem. 2008, 108, 1028–1038. [Google Scholar] [CrossRef]
- Schreiner, M.; Huyskens-Keil, S. Phytochemicals in fruit and vegetables: Health promotion and postharvest elicitors. CRC. Crit. Rev. Plant Sci. 2006, 25, 267–278. [Google Scholar] [CrossRef]
- Liu, X.; Ardo, S.; Bunning, M.; Parry, J.; Zhou, K.; Stushnoff, C.; Stoniker, F.; Yu, L.; Kendall, P. Total phenolic content and DPPH radical scavenging activity of lettuce (Lactuca sativa L.) grown in Colorado. LWT-Food Sci. Technol. 2007, 40, 552–557. [Google Scholar] [CrossRef]
- Zhu, H.; Zhang, T.J.; Zhang, P.; Peng, C.L. Pigment patterns and photoprotection of anthocyanins in the young leaves of four dominant subtropical forest tree species in two successional stages under contrasting light conditions. Tree Physiol. 2016, 36, 1092–1104. [Google Scholar] [CrossRef] [Green Version]
- Tan, L.; Nuffer, H.; Feng, J.; Kwan, S.H.; Chen, H.; Tong, X.; Kong, L. Antioxidant properties and sensory evaluation of microgreens from commercial and local farms. Food Sci. Hum. Wellness 2020, 9, 45–51. [Google Scholar] [CrossRef]
- Atkinson, L.D.; Hilton, H.W.; Pink, D.A.C. A study of variation in the tendency for postharvest discoloration in a lettuce (Lactuca sativa) diversity set. Int. J. Food Sci. Technol. 2013, 48, 801–807. [Google Scholar] [CrossRef]
- Missio, J.C.; Rivera, A.; Figàs, M.R.; Casanova, C.; Camí, B.; Soler, S.; Simó, J. A comparison of landraces vs. Modern varieties of lettuce in organic farming during the winter in the mediterranean area: An approach considering the viewpoints of breeders, consumers, and farmers. Front. Plant Sci. 2018, 9, 871. [Google Scholar] [CrossRef]
- Watada, A.E.; Qi, L. Quality of fresh-cut produce. Postharvest Biol. Technol. 1999, 15, 201–205. [Google Scholar] [CrossRef]
- Van De Wouw, M.; Kik, C.; Van Hintum, T.; Van Treuren, R.; Visser, B. Genetic erosion in crops: Concept, research results and challenges. Plant Genet. Resour. 2010, 8, 1–15. [Google Scholar] [CrossRef] [Green Version]
- García-Martínez, S.; Andreani, L.; Garcia-Gusano, M.; Geuna, F.; Ruiz, J.J. Evaluation of amplified fragment length polymorphism and simple sequence repeats for tomato germplasm fingerprinting: Utility for grouping closely related traditional cultivars. Genome 2011, 49, 648–656. [Google Scholar] [CrossRef] [PubMed]
- Penella, C.; Nebauer, S.G.; Bautista, A.S.; López-Galarza, S.; Calatayud, Á. Rootstock alleviates PEG-induced water stress in grafted pepper seedlings: Physiological responses. J. Plant Physiol. 2014, 171, 842–851. [Google Scholar] [CrossRef] [PubMed]
- Maroto, J.V. Horticultura Herbácea Especial, 5th ed.; Mundi-Prensa: Madrid, Spain, 2002. [Google Scholar]
- Kader, A.A.; Lipton, W.J.; Morris, L.L. Systems for scoring quality of harvested lettuce. Hortsci 1973, 5, 408–409. [Google Scholar] [CrossRef]
- Porra, R.J.; Thompson, W.A.; Kriedemann, P.E. Determination of accurate extinction coefficients and simultaneous equations for assaying chlorophylls a and b extracted with four different solvents: Verification of the concentration of chlorophyll standards by atomic absorption spectroscopy. BBA-Bioenerg. 1989, 975, 384–394. [Google Scholar] [CrossRef]
- Szepesi, Á.; Csiszár, J.; Gallé, Á.; Gémes, K.; Poór, P.; Tari, I. Effects of long-term salicylic acid pre-treatment on tomato ( Lycopersicon esculentum Mill. L.) salt stress tolerance: Changes in glutathione S-transferase activities and anthocyanin contents. Acta Agron. Hungarica 2008, 56, 129–138. [Google Scholar] [CrossRef]
- Kampfenkel, K.; Van Montagu, M.; Inzé, D. Extraction and determination of ascorbate and dehydroascorbate from plant tissue. Anal. Biochem. 1995, 225, 165–167. [Google Scholar] [CrossRef]
- Dewanto, V.; Xianzhong, W.; Adom, K.K.; Liu, R.H. Thermal processing enhances the nutritional value of tomatoes by increasing total antioxidant activity. J. Agric. Food Chem. 2002, 50, 3010–3014. [Google Scholar] [CrossRef]
- Brand-Williams, W.; Cuvelier, M.E.; Berset, C. Use of a free radical method to evaluate antioxidant activity. LWT Food Sci. Technol. 1995, 28, 25–30. [Google Scholar] [CrossRef]
- Dhindsa, R.S.; Plumb-dhindsa, P.; Thorpe, T.A. Leaf Senescence: Correlated with Increased Levels of Membrane Permeability and Lipid Peroxidation, and Decreased Levels of Superoxide Dismutase and Catalase. J. Exp. Bot. 1981, 32, 93–101. [Google Scholar] [CrossRef]
- López-Serrano, L.; Canet-Sanchis, G.; Selak, G.V.; Penella, C.; Bautista, A.S.; López-Galarza, S.; Calatayud, Á. Pepper rootstock and scion physiological responses under drought stress. Front. Plant Sci. 2019, 10, 38. [Google Scholar] [CrossRef] [Green Version]
- Salunkhe, D.K.; Bolin, H.R.; Reddy, N.R. Storage, Processing, and Nutritional Quality of Fruits and Vegetables; CRC Press: Boca Raton, FL, USA, 1991. [Google Scholar]
- Hoque, M.M.; Ajwa, H.; Othman, M.; Smith, R.; Cahn, M. Yield and postharvest quality of lettuce in response to nitrogen, phosphorus, and potassium fertilizers. HortScience 2010, 45, 1539–1544. [Google Scholar] [CrossRef] [Green Version]
- Toivonen, P.M.A.; Brummell, D.A. Biochemical bases of appearance and texture changes in fresh-cut fruit and vegetables. Postharvest Biol. Technol. 2008, 48, 1–14. [Google Scholar] [CrossRef]
- Kizhedath, A.; Suneetha, V. Estimation of chlorophyll content in common household medicinal leaves and their utilization to avail health benefits of chlorophyll. J. Pharm. Resch. 2011, 4, 1412–1413. [Google Scholar]
- Sim, C.C.; Zaharah, A.R.; Tan, M.S.; Goh, K.J. Rapid determination of leaf chlorophyll concentration, photosynthetic activity and NK concentration of Elaies guineensis via correlated SPAD-502 chlorophyll index. Asian J. Agric. Res. 2015, 9, 132–138. [Google Scholar] [CrossRef] [Green Version]
- Sytar, O.; Zivcak, M.; Bruckova, K.; Brestic, M.; Hemmerich, I.; Rauh, C.; Simko, I. Shift in accumulation of flavonoids and phenolic acids in lettuce attributable to changes in ultraviolet radiation and temperature. Sci. Hortic. 2018, 239, 193–204. [Google Scholar] [CrossRef]
- Simko, I.; Hayes, R.J.; Furbank, R.T. Non-destructive phenotyping of lettuce plants in early stages of development with optical sensors. Front. Plant Sci. 2016, 7, 1985. [Google Scholar] [CrossRef] [Green Version]
- Neill, S.O.; Gould, K.S. Anthocyanins in leaves: Light attenuators or antioxidants? Funct. Plant Biol. 2003, 30, 865–873. [Google Scholar] [CrossRef] [Green Version]
- Cassetari, L.S.; Gomes, M.S.; Santos, D.C.; Santiago, W.D.; Andrade, J.; Guimarães, A.C.; Souza, J.A.; Cardoso, M.G.; Maluf, W.R.; Gomes, L.A. β-carotene and chlorophyll levels in cultivars and breeding lines of lettuce. Acta Hortic. 2015, 1083, 469–473. [Google Scholar] [CrossRef]
- Mamo, B.E.; Hayes, R.J.; Truco, M.J.; Puri, K.D.; Michelmore, R.W.; Subbarao, K.V.; Simko, I. The genetics of resistance to lettuce drop (Sclerotinia spp.) in lettuce in a recombinant inbred line population from Reine des Glaces × Eruption. Theor. Appl. Genet. 2019, 132, 2439–2460. [Google Scholar] [CrossRef] [PubMed]
- Ferreres, F.; Gil, M.I.; Castañer, M.; Tomás-Barberán, F.A. Phenolic Metabolites in Red Pigmented Lettuce (Lactuca sativa). Changes with Minimal Processing and Cold Storage. J. Agric. Food Chem. 1997, 45, 4249–4254. [Google Scholar] [CrossRef]
- DuPont, M.S.; Mondin, Z.; Williamson, G.; Price, K.R. Effect of Variety, Processing, and Storage on the Flavonoid Glycoside Content and Composition of Lettuce and Endive. J. Agric. Food Chem. 2000, 48, 3957–3964. [Google Scholar] [CrossRef] [PubMed]
- Fu, Y.; Li, H.Y.; Yu, J.; Liu, H.; Cao, Z.Y.; Manukovsky, N.S.; Liu, H. Interaction effects of light intensity and nitrogen concentration on growth, photosynthetic characteristics and quality of lettuce (Lactuca sativa L. Var. youmaicai). Sci. Hortic. 2017, 214, 51–57. [Google Scholar] [CrossRef]
- Giannakourou, M.C.; Taoukis, P.S. Kinetic modelling of vitamin C loss in frozen green vegetables under variable storage conditions. Food Chem. 2003, 83, 33–41. [Google Scholar] [CrossRef]
- Bureau, S.; Chahine, H.; Gouble, B.; Reich, M.; Albagnac, G.; Audergon, J.M. Fruit ripening of contrasted apricot varieties: Physical, physiological and biochemical changes. Acta Hortic. 2006, 701, 511–516. [Google Scholar] [CrossRef]
- Barrett, D.M.; Lloyd, B. Advanced preservation methods and nutrient retention in fruits and vegetables. J. Sci. Food Agric. 2012, 92, 7–22. [Google Scholar] [CrossRef]
- Mulabagal, V.; Ngouajio, M.; Nair, A.; Zhang, Y.; Gottumukkala, A.L.; Nair, M.G. In vitro evaluation of red and green lettuce (Lactuca sativa) for functional food properties. Food Chem. 2010, 118, 300–306. [Google Scholar] [CrossRef]
- Seeram, N.P.; Cichewicz, R.H.; Chandra, A.; Nair, M.G. Cyclooxygenase Inhibitory and Antioxidant Compounds from Crabapple Fruits. J. Agric. Food Chem. 2003, 51, 1948–1951. [Google Scholar] [CrossRef]
- Chowdhury, A.; Das, A. Nitrate Accumulation and Vegetable Quality. Int. J. Sci. Res. 2013, 4, 1668–1672. [Google Scholar]
- Britto, D.T.; Kronzucker, H.J. NH4+ toxicity in higher plants: A critical review. J. Plant Physiol. 2002, 159, 567–584. [Google Scholar] [CrossRef] [Green Version]
- Miller, A.J.; Cramer, M.D. Root Nitrogen Acquisition and Assimilation. Plant Soil 2005, 274, 1–36. [Google Scholar] [CrossRef]
- Santamaria, P. Nitrate in vegetables: Toxicity, content, intake and EC regulation. J. Sci. Food Agric. 2006, 86, 10–17. [Google Scholar] [CrossRef]
- Lara-Izaguirre, A.Y.; Rojas-Velázquez, A.N.; Romero-Méndez, M.J.; Ramírez-Tobías, H.M.; Cruz-Crespo, E.; Alcalá-Jáuregui, J.A.; Loredo-Ostí, C. Crecimiento y Acumulación de NO3− en lechuga hidropónica con relaciones nitrato/amonio en dos estaciones de cultivo. Rev. Fitotec. Mex. 2019, 42, 21–29. [Google Scholar] [CrossRef]
- Parks, S.E.; Huett, D.O.; Campbell, L.C.; Spohr, L.J. Nitrate and nitrite in Australian leafy vegetables. Aust. J. Agric. Res. 2008, 59, 632–638. [Google Scholar] [CrossRef]
- Pannico, A.; El-Nakhel, C.; Graziani, G.; Kyriacou, M.C.; Giordano, M.; Soteriou, G.A.; Zarrelli, A.; Ritieni, A.; De Pascale, S.; Rouphael, Y. Selenium biofortification impacts the nutritive value, polyphenolic content, and bioactive constitution of variable microgreens genotypes. Antioxidants 2020, 9, 272. [Google Scholar] [CrossRef] [Green Version]
- Andrews, M. The partitioning of nitrate assimilation between root and shoot of higher plants. Plant. Cell Environ. 1986, 9, 511–519. [Google Scholar] [CrossRef]
- Zhang, G.; Johkan, M.; Hohjo, M.; Tsukagoshi, S.; Maruo, T. Plant growth and photosynthesis response to low potassium conditions in three lettuce (Lactuca sativa) types. Hortic. J. 2017, 86, 229–237. [Google Scholar] [CrossRef] [Green Version]

| Abbreviation Code | Origin | Identification | Plant Description |
|---|---|---|---|
| CL1 | Commercial | Romaine lettuce long mule ear (Batlle, Molins de Rei, Spain) a1 | Dark green. Elongated shape. Compact and narrow head, barely prominent. |
| CL2 | Commercial | Romaine lettuce from the gardeners (Vilmorín, Alicante, Spain) a1 | Green-yellowish. Elongated shape. Compact and narrow head, barely prominent. |
| CL3 | Commercial | Wonder summer (Batlle) a1 | Green with reddish shades. Remarkable width in relation to height. Compact, rounded and quite prominent head. |
| CL4 | Commercial | Marvel of Four Seasons Butterhead (Batlle) a1 | Dark green with reddish shades; the red is prominent at the edges. Round shape. Quite rounded shape. Full-size head. |
| L1 | Local landrace | BGV005721 b2 | Dark green. Pink shades near the principal stem. Elongated shape. Compact and narrow head, barely prominent. |
| L2 | Local landrace | BGV005722 b2 | Green-yellowish. Round shape. Full-size head. |
| L5 | Local landrace | BGV005736 b2 | Dark green with reddish shades. Elongated shape. Compact and narrow head, quite prominent. |
| L10 | Local landrace | L-10 b3 | Dark green. Elongated shape. Compact and narrow head, barely prominent. |
| L11 | Local landrace | L-11 b3 | Dark red, almost purple. Remarkable width in relation to height. Head not appreciated. |
| Trait | Score | Description |
|---|---|---|
| Firmness description | 1 | Soft, easily compressed or spongy |
| 2 | Fairly firm, neither soft nor firm, good head formation | |
| 3 | Firm, compact but may yield slightly to moderate pressure | |
| 4 | Hard, compact and solid | |
| 5 | Extra hard, over-mature, may have cracked mid ribs | |
| Visual quality | 1 | Extremely poor, disposable |
| 3 | Poor, many defects, limit of salability | |
| 5 | Fair, slightly to moderately defects, lower limit of sales appeal | |
| 7 | Good, minor defects | |
| 9 | Excellent, essentially free from defects | |
| Decay | 1 | Extreme, disposable |
| 3 | Severe, salvageable but usually not salable | |
| 5 | Moderate, objectionable, definitely impairs salability | |
| 7 | Slight, slightly objectionable, may impair salability | |
| 9 | None | |
| Butt discoloration | 1 | Extreme, very dark |
| 3 | Severe | |
| 5 | Moderate | |
| 7 | Slight | |
| 9 | None, fresh cut appearance | |
| Wilting | 1 | Extreme, not acceptable under normal conditions |
| 3 | Severe, definitely objectionable | |
| 5 | Moderate, becoming objectionable | |
| 7 | Slight, not objectionable | |
| 9 | None, fresh cut appearance | |
| Internal part appearance | 1 | Damage |
| 2 | Objectionable appearance | |
| 3 | Good aspect |
| Variety | Time | Visual Quality (%) | Fresh Weight (%) | ||||
|---|---|---|---|---|---|---|---|
| CL1 | T0 | 100.00 | - | - | 100.00 | - | - |
| T3 | 83.46 ± 3.01 | C | a | 93.82 ± 1.40 | ABC | a | |
| T6 | 78.12 ± 3.16 | C | b | 93.85 ± 2.17 | A | a | |
| T9 | 75.60 ± 1.78 | B | b | 93.34 ± 1.08 | A | a | |
| CL2 | T0 | 100.00 | - | - | 100.00 | - | - |
| T3 | 89.09 ± 3.43 | AB | a | 94.23 ± 1.18 | AB | a | |
| T6 | 81.95 ± 2.43 | BC | b | 93.11 ± 1.22 | AB | ab | |
| T9 | 79.01 ± 2.74 | AB | b | 91.49 ± 1.84 | AB | b | |
| CL3 | T0 | 100.00 | - | - | 100.00 | - | - |
| T3 | 90.13 ± 3.73 | AB | a | 92.88 ± 0.82 | D | a | |
| T6 | 87.17 ± 1.90 | A | ab | 90.84 ± 1.01 | C | b | |
| T9 | 81.69 ± 5.80 | A | b | 89.21 ± 2.81 | B | c | |
| CL4 | T0 | 100.00 | - | - | 100.00 | - | - |
| T3 | 74.43 ± 5.04 | D | a | 91.56 ± 2.05 | E | a | |
| T6 | 69.70 ± 6.41 | D | a | 90.64 ± 1.41 | C | a | |
| T9 | 68.42 ± 3.37 | C | a | 85.54 ± 2.19 | C | b | |
| L1 | T0 | 100.00 | - | - | 100.00 | - | - |
| T3 | 86.93 ± 2.99 | BC | a | 94.78 ± 1.83 | A | a | |
| T6 | 83.93 ± 2.94 | AB | a | 93.78 ± 1.70 | A | a | |
| T9 | 75.28 ± 3.35 | B | b | 93.96 ± 1.30 | A | a | |
| L2 | T0 | 100.00 | - | - | 100.00 | - | - |
| T3 | 92.28 ± 3.23 | A | a | 93.10 ± 0.88 | CD | a | |
| T6 | 87.44 ± 2.63 | A | a | 90.40 ± 1.89 | CD | b | |
| T9 | 65.49 ± 5.22 | C | b | 89.09 ± 1.88 | B | b | |
| L5 | T0 | 100.00 | - | - | 100.00 | - | - |
| T3 | 77.71 ± 1.44 | D | a | 93.29 ± 0.91 | BCD | a | |
| T6 | 71.40 ± 1.73 | D | b | 91.72 ± 1.35 | C | b | |
| T9 | 59.94 ± 1.13 | D | c | 90.59 ± 1.44 | B | c | |
| L10 | T0 | 100.00 | - | - | 100.00 | - | - |
| T3 | 90.75 ± 3.25 | AB | a | 93.59 ± 1.01 | BCD | a | |
| T6 | 83.76 ± 2.11 | AB | b | 91.92 ± 1.37 | BCD | b | |
| T9 | 79.42 ± 5.18 | AB | b | 90.46 ± 1.78 | B | b | |
| L11 | T0 | 100.00 | - | - | 100.00 | - | - |
| T3 | 74.19 ± 2.83 | D | a | 93.24 ± 0.90 | BCD | a | |
| T6 | 60.75 ± 4.30 | E | b | 88.97 ± 1.66 | D | b | |
| T9 | 43.39 ± 2.92 | E | c | 83.31 ± 2.50 | C | c |
| Time | Trait | Unit/Scale | Mean | Range | CV (%) | F-Ratio |
|---|---|---|---|---|---|---|
| T0 | ||||||
| Chl | µg g−1 FW | 440.83 | 370.14–564.58 *** | 9.92 | 5.17 | |
| Car | µg g−1 FW | 11.53 | 0.00–39.73 *** | 103.25 | 39.62 | |
| Ant | µmol g−1 FW | 48.68 | 33.40–71.76 *** | 21.52 | 16.00 | |
| AsA | mg 100g−1 FW | 35.68 | 15.78–64.20 *** | 39.09 | 88.26 | |
| Phe | mg g−1 FW | 3.84 | 1.76–9.38 *** | 55.26 | 41.41 | |
| DPPH | % | 17.12 | 6.47–38.74 *** | 53.71 | 80.79 | |
| H2O2 | nmol g−1 FW | 111.79 | 8.69–276.61 *** | 77.02 | 102.63 | |
| LP | nmol 100g−1 FW | 12.98 | 9.18–14.88 * | 9.80 | 3.23 | |
| NO3− | mg g−1 FW | 1.47 | 1.09–2.06 * | 16.09 | 3.11 | |
| Ca | mg 100g−1 FW | 59.83 | 39.92–103.45 *** | 29.11 | 26.30 | |
| K | mg g−1 FW | 3.92 | 3.19–5.03 *** | 12.77 | 12.22 | |
| T3 | ||||||
| Chl | µg g−1 FW | 419.17 | 299.98–650.91 *** | 22.07 | 11.26 | |
| Car | µg g−1 FW | 23.54 | 0.00–58.98 *** | 101.38 | 250.47 | |
| Ant | µmol g−1 FW | 49.38 | 32.32–72.93 *** | 21.00 | 21.47 | |
| AsA | mg 100g−1 FW | 28.35 | 15.45–46.42 *** | 31.74 | 29.73 | |
| Phe | mg g−1 FW | 5.71 | 0.82–12.31 *** | 55.97 | 41.14 | |
| DPPH | % | 19.60 | 8.11–37.68 *** | 42.84 | 61.96 | |
| H2O2 | nmol g−1 FW | 220.96 | 76.19–562.95 *** | 72.52 | 465.14 | |
| LP | nmol 100g−1 FW | 10.78 | 7.23–15.52 *** | 16.70 | 14.12 | |
| NO3− | mg g−1 FW | 1.39 | 0.67–2.12 *** | 25.53 | 6.36 | |
| Ca | mg 100g−1 FW | 72.79 | 43.00–106.77 *** | 25.59 | 16.74 | |
| K | mg g−1 FW | 3.24 | 1.93–4.29 *** | 16.51 | 14.84 | |
| T6 | ||||||
| Chl | µg g−1 FW | 356.12 | 278.15–470.92 *** | 16.07 | 7.63 | |
| Car | µg g−1 FW | 23.58 | 0–81.43 *** | 91.96 | 6.37 | |
| Ant | µmol g−1 FW | 46.75 | 26.19–61.01 *** | 16.74 | 6.28 | |
| AsA | mg 100g−1 FW | 19.46 | 11.54–28.09 *** | 26.29 | 11.63 | |
| Phe | mg g−1 FW | 2.84 | 1.45–4.71 *** | 34.72 | 14.14 | |
| DPPH | % | 12.03 | 6.17–22.71 *** | 36.33 | 39.58 | |
| H2O2 | nmol g−1 FW | 164.56 | 71.36–290.49 *** | 41.73 | 73.09 | |
| LP | nmol 100g−1 FW | 10.95 | 7.55–16.45 *** | 16.65 | 8.85 | |
| NO3− | mg g−1 FW | 1.33 | 0.82–1.87 *** | 19.08 | 6.51 | |
| Ca | mg 100g−1 FW | 65.83 | 42.92–87.58 *** | 18.82 | 10.87 | |
| K | mg g−1 FW | 2.96 | 2.28–3.63 *** | 12.40 | 11.02 | |
| T9 | ||||||
| Chl | µg g−1 FW | 325.52 | 190.31–406.94 *** | 15.83 | 12.35 | |
| Car | µg g−1 FW | 13.81 | 0–41.88 *** | 107.50 | 50.72 | |
| Ant | µmol g−1 FW | 57.70 | 46.72–70.34 *** | 12.94 | 19.00 | |
| AsA | mg 100g−1 FW | 14.36 | 6.08–29.73 *** | 38.42 | 10.36 | |
| Phe | mg g−1 FW | 5.17 | 2.13–7.79 *** | 31.23 | 17.28 | |
| DPPH | % | 9.12 | 4.66–15.77 *** | 33.44 | 21.46 | |
| H2O2 | nmol g−1 FW | 171.26 | 85.59–280.32 *** | 39.06 | 95.71 | |
| LP | nmol 100g−1 FW | 11.89 | 8.49–17.10 *** | 17.42 | 10.32 | |
| NO3− | mg g−1 FW | 1.27 | 0.29–2.37 ** | 30.46 | 3.84 | |
| Ca | mg 100g−1 FW | 71.05 | 45.99–105.63 *** | 25.15 | 18.45 | |
| K | mg g−1 FW | 2.93 | 2.02–3.75 *** | 14.24 | 8.59 |
| Variety | Time | NO3− (mg g−1 FW) | Ca (mg 100g−1 FW) | K (mg g−1 FW) | ||||||
|---|---|---|---|---|---|---|---|---|---|---|
| CL1 | T0 | 1.36 ± 0.15 | BC | a | 48.24 ± 5.73 | CDE | - | 4.07 ± 0.38 | BC | a |
| T3 | 1.08 ± 0.18 | DE | b | 51.86 ± 4.56 | D | - | 2.79 ± 0.06 | E | b | |
| T6 | 1.25 ± 0.04 | D | ab | 50.67 ± 4.54 | CD | - | 2.70 ± 0.10 | CD | b | |
| T9 | 1.38 ± 0.06 | B | a | 54.05 ± 6.82 | D | - | 2.63 ± 0.22 | D | b | |
| CL2 | T0 | 1.27 ± 0.13 | C | - | 45.34 ± 2.00 | DE | b | 4.43 ± 0.36 | B | a |
| T3 | 0.98 ± 0.30 | E | - | 62.35 ± 7.75 | CD | a | 2.91 ± 0.06 | DE | b | |
| T6 | 0.99 ± 0.12 | E | - | 62.21 ± 6.43 | B | a | 3.01 ± 0.15 | B | b | |
| T9 | 1.29 ± 0.17 | BC | - | 54.61 ± 5.57 | D | a | 2.83 ± 0.23 | CD | b | |
| CL3 | T0 | 1.42 ± 0.13 | BC | - | 54.06 ± 6.27 | CD | b | 3.90 ± 0.23 | CD | a |
| T3 | 1.38 ± 0.34 | BCD | - | 75.80 ± 7.39 | B | a | 3.29 ± 0.32 | CD | b | |
| T6 | 1.29 ± 0.14 | D | - | 69.12 ± 10.12 | AB | a | 2.97 ± 0.28 | BC | b | |
| T9 | 1.43 ± 0.15 | B | - | 68.38 ± 6.35 | C | a | 2.94 ± 0.32 | BCD | b | |
| CL4 | T0 | 1.53 ± 0.35 | BC | - | 68.00 ± 9.59 | B | c | 3.63 ± 0.30 | DE | - |
| T3 | 1.59 ± 0.21 | ABC | - | 93.18 ± 13.14 | A | ab | 3.67 ± 0.38 | AB | - | |
| T6 | 1.56 ± 0.22 | AB | - | 78.38 ± 7.94 | A | bc | 3.33 ± 0.22 | A | - | |
| T9 | 1.47 ± 0.09 | AB | - | 94.83 ± 8.86 | A | a | 3.27 ± 0.06 | AB | - | |
| L1 | T0 | 1.50 ± 0.05 | BC | - | 42.53 ± 3.30 | E | c | 3.77 ± 0.20 | CDE | a |
| T3 | 1.48 ± 0.07 | ABC | - | 56.90 ± 6.07 | D | a | 3.35 ± 0.22 | BC | b | |
| T6 | 1.38 ± 0.28 | BCD | - | 48.08 ± 6.00 | D | bc | 2.79 ± 0.11 | BCD | c | |
| T9 | 1.27 ± 0.05 | BC | - | 55.51 ± 5.82 | D | ab | 2.91 ± 0.17 | BCD | c | |
| L2 | T0 | 1.63 ± 0.26 | AB | a | 73.21 ± 11.58 | B | b | 3.66 ± 0.17 | DE | a |
| T3 | 1.29 ± 0.18 | CDE | b | 96.64 ± 8.29 | A | a | 3.44 ± 0.34 | BC | ab | |
| T6 | 1.03 ± 0.09 | E | bc | 72.73 ± 6.99 | A | b | 2.59 ± 0.30 | D | bc | |
| T9 | 0.78 ± 0.13 | E | c | 80.28 ± 12.78 | B | b | 2.99 ± 0.36 | BCD | c | |
| L5 | T0 | 1.35 ± 0.07 | BC | bc | 55.27 ± 4.38 | C | c | 3.57 ± 0.18 | DE | a |
| T3 | 1.66 ± 0.23 | AB | a | 91.42 ± 9.32 | A | a | 3.96 ± 0.32 | A | b | |
| T6 | 1.51 ± 0.03 | ABC | ab | 77.79 ± 6.31 | A | b | 3.39 ± 0.16 | A | bc | |
| T9 | 1.16 ± 0.01 | CD | c | 80.28 ± 4.82 | B | b | 3.18 ± 0.27 | ABC | c | |
| L10 | T0 | 1.36 ± 0.19 | BC | - | 54.78 ± 6.40 | CD | - | 3.39 ± 0.26 | E | a |
| T3 | 1.11 ± 0.24 | DE | - | 53.14 ± 8.95 | D | - | 2.28 ± 0.25 | F | b | |
| T6 | 1.31 ± 0.15 | CD | - | 59.44 ± 6.79 | BC | - | 2.53 ± 0.26 | D | b | |
| T9 | 1.02 ± 0.27 | D | - | 56.08 ± 7.67 | D | - | 2.17 ± 0.13 | E | b | |
| L11 | T0 | 1.82 ± 0.22 | A | - | 97.02 ± 5.39 | A | a | 4.84 ± 0.20 | A | a |
| T3 | 1.80 ± 0.05 | A | - | 73.80 ± 9.94 | BC | b | 3.45 ± 0.18 | BC | b | |
| T6 | 1.63 ± 0.11 | A | - | 74.01 ± 5.12 | A | b | 3.35 ± 0.13 | A | b | |
| T9 | 1.67 ± 0.18 | A | - | 95.43 ± 10.02 | A | a | 3.42 ± 0.34 | A | b | |
| T0 | Chl | Car | Ant | AsA | Phe | DPPH | H2O2 | LP | NO3− | Ca | K |
|---|---|---|---|---|---|---|---|---|---|---|---|
| Chl | −0.348 | 0.193 | −0.037 | −0.124 | 0.072 | −0.091 | 0.311 | −0.089 | −0.058 | 0.025 | |
| Car | 0.189 | 0.095 | 0.378 * | 0.068 | 0.252 | −0.117 | −0.167 | 0.044 | 0.016 | ||
| Ant | 0.748 *** | 0.767 *** | 0.710 *** | 0.676 *** | 0.385 * | 0.477 ** | 0.738 *** | 0.449 ** | |||
| AsA | 0.829 *** | 0.779 *** | 0.927 *** | 0.229 | 0.465 ** | 0.744 *** | 0.329 | ||||
| Phe | 0.806 *** | 0.815 *** | 0.216 | 0.409 * | 0.668 *** | 0.539 ** | |||||
| DPPH | 0.654 *** | 0.410 * | 0.545 *** | 0.739 *** | 0.626 *** | ||||||
| H2O2 | 0.224 | 0.211 | 0.571 ** | 0.263 | |||||||
| LP | 0.121 | 0.188 | 0.160 | ||||||||
| NO3− | 0.645 *** | 0.340 * | |||||||||
| Ca | 0.388* | ||||||||||
| K | |||||||||||
| T3 | Chl | Car | Ant | AsA | Phe | DPPH | H2O2 | LP | NO3− | Ca | K |
| Chl | −0.739 *** | 0.742 *** | 0.660 *** | −0.744 *** | 0.640 *** | 0.528 ** | 0.810 *** | −0.745 *** | 0.740 *** | −0.811 *** | |
| Car | −0.726 *** | −0.491 ** | 0.982 *** | −0.561 *** | −0.253 | −0.715 *** | 0.872 *** | −0.763 *** | 0.966 *** | ||
| Ant | 0.306 | −0.750 *** | 0.349 * | 0.079 | 0.532 *** | −0.732 *** | 0.745 *** | −0.770 *** | |||
| AsA | −0.421 * | 0.832 *** | 0.761 *** | 0.417 * | −0.484 ** | 0.601 *** | −0.523 ** | ||||
| Phe | −0.500 ** | −0.217 | −0.695 *** | 0.997 *** | −0.713 *** | 0.986 *** | |||||
| DPPH | 0.649 *** | 0.562 *** | −0.554 *** | 0.528 *** | −0.590 *** | ||||||
| H2O2 | 0.299 | −0.277 | 0.378 * | −0.302 | |||||||
| LP | −0.682 *** | 0.490 ** | −0.744 *** | ||||||||
| NO3− | 0.72 5*** | 0.965 *** | |||||||||
| Ca | −0.770 *** | ||||||||||
| K | |||||||||||
| T6 | Chl | Car | Ant | AsA | Phe | DPPH | H2O2 | LP | NO3− | Ca | K |
| Chl | 0.408 * | 0.250 | 0.356 | 0.515 ** | −0.097 | 0.037 | 0.262 | 0.208 | −0.138 | −0.025 | |
| Car | −0.010 | 0.486 ** | −0.172 | 0.002 | 0.084 | −0.159 | 0.054 | −0.134 | −0.352 | ||
| Ant | 0.293 | 0.344 | −0.367 * | 0.442 * | 0.378 * | 0.545 ** | −0.068 | 0.265 | |||
| AsA | 0.465 ** | 0.021 | 0.327 | −0.062 | 0.481 ** | 0.010 | 0.322 | ||||
| Phe | −0.076 | 0.087 | 0.340 | 0.502 ** | −0.085 | 0.353 * | |||||
| DPPH | 0.041 | −0.430** | −0.074 | 0.413 * | 0.032 | ||||||
| H2O2 | 0.001 | 0.464 * | 0.294 | 0.530 ** | |||||||
| LP | 0.137 | −0.522 ** | −0.186 | ||||||||
| NO3− | 0.327 | 0.652 *** | |||||||||
| Ca | 0.668 *** | ||||||||||
| K | |||||||||||
| T9 | Chl | Car | Ant | AsA | Phe | DPPH | H2O2 | LP | NO3- | Ca | K |
| Chl | 0.178 | 0.124 | 0.089 | −0.257 | −0.324 | −0.020 | 0.297 | −0.128 | −0.353 | −0.431 * | |
| Car | 0.498 ** | 0.324 | 0.113 | −0.205 | 0.355 | 0.278 | −0.285 | 0.124 | 0.189 | ||
| Ant | 0.241 | 0.402 * | 0,158 | 0.338 | 0.423 * | 0.152 | 0.445 * | 0.290 | |||
| AsA | 0.519 ** | 0.208 | 0.396 * | 0.398 * | 0.051 | 0.064 | 0.212 | ||||
| Phe | 0.676 *** | 0.527 ** | 0.291 | 0.177 | 0.584 *** | 0.543 *** | |||||
| DPPH | 0.155 | −0.126 | 0.218 | 0.669 *** | 0.443 ** | ||||||
| H2O2 | 0.547 ** | −0.407 * | 0.153 | 0.054 | |||||||
| LP | −0.223 | −0.252 | −0.216 | ||||||||
| NO3− | 0.374 * | 0.536 ** | |||||||||
| Ca | 0.779 *** | ||||||||||
| K |
Publisher’s Note: MDPI stays neutral with regard to jurisdictional claims in published maps and institutional affiliations. |
© 2022 by the authors. Licensee MDPI, Basel, Switzerland. This article is an open access article distributed under the terms and conditions of the Creative Commons Attribution (CC BY) license (https://creativecommons.org/licenses/by/4.0/).
Share and Cite
Martínez-Ispizua, E.; Calatayud, Á.; Marsal, J.I.; Basile, F.; Cannata, C.; Abdelkhalik, A.; Soler, S.; Valcárcel, J.V.; Martínez-Cuenca, M.-R. Postharvest Changes in the Nutritional Properties of Commercial and Traditional Lettuce Varieties in Relation with Overall Visual Quality. Agronomy 2022, 12, 403. https://doi.org/10.3390/agronomy12020403
Martínez-Ispizua E, Calatayud Á, Marsal JI, Basile F, Cannata C, Abdelkhalik A, Soler S, Valcárcel JV, Martínez-Cuenca M-R. Postharvest Changes in the Nutritional Properties of Commercial and Traditional Lettuce Varieties in Relation with Overall Visual Quality. Agronomy. 2022; 12(2):403. https://doi.org/10.3390/agronomy12020403
Chicago/Turabian StyleMartínez-Ispizua, Eva, Ángeles Calatayud, Jose Ignacio Marsal, Federico Basile, Claudio Cannata, Abdelsattar Abdelkhalik, Salvador Soler, José Vicente Valcárcel, and Mary-Rus Martínez-Cuenca. 2022. "Postharvest Changes in the Nutritional Properties of Commercial and Traditional Lettuce Varieties in Relation with Overall Visual Quality" Agronomy 12, no. 2: 403. https://doi.org/10.3390/agronomy12020403
APA StyleMartínez-Ispizua, E., Calatayud, Á., Marsal, J. I., Basile, F., Cannata, C., Abdelkhalik, A., Soler, S., Valcárcel, J. V., & Martínez-Cuenca, M.-R. (2022). Postharvest Changes in the Nutritional Properties of Commercial and Traditional Lettuce Varieties in Relation with Overall Visual Quality. Agronomy, 12(2), 403. https://doi.org/10.3390/agronomy12020403