Abstract
Increased soil salinity significantly inhibits crop production worldwide, and biochar may alleviate salt stress. In the present study, the application of biochar significantly increased the biomass of rice under salt stress treatment. The analysis of soil properties demonstrated that biochar application significantly decreased electrical conductivity and soluble Na+ and Cl− contents in the soil under salt stress. In addition, biochar application increased the soil cation exchange capacity, soil organic matter, humic acid, total nitrogen, and total phosphorus contents in the soil, suggesting that biochar improved the soil nutrient conditions. The application of biochar further increased the abundance of soil bacteria and changed the bacterial community structure under salt stress. Proteobacteria, Chloroflexi, and Acidobacteria were the top three phyla in bacterial abundance. Biochar increased Proteobacteria abundance and decreased Chloroflexi abundance, which were considered to be eutrophic bacteria and oligotrophic bacteria, respectively. Redundancy analysis showed that soil bacterial communities were mainly affected by soil pH and EC (p < 0.05). In conclusion, the application of biochar alleviated salt stress in rice via modifying soil properties and regulating the bacterial abundance and community structure.
1. Introduction
According to the survey data of the Food and Agriculture Organization of the United Nations (FAO), as of 2017, about 7.6 million hm2 of cultivated land in China had saline–alkali soil, including 6.6 million hm2 of saline soil and 1.46 million hm2 of alkaline soil. Sodium salt is the main component in saline–alkali soil and one of the most easily dissolved salts. The accumulation of sodium salt in the soil causes ion imbalance, osmotic stress, and metabolic disorders in plants, in addition to affecting normal physiological processes [1]. Rice (Oryza sativa L.) is a moderately salt-sensitive crop, and soil salinization significantly restricts rice yield and quality. It is estimated that about one-fifth of paddy soils in China are under salt stress. Consequently, ameliorating saline–alkali paddy soil to improve rice growth and production is important for agricultural development in China.
There are three main ways to improve plant productivity in saline–alkali soil. The first method is desalination through engineering measures such as subsurface pipe drainage [2]; the second method is to improve the nutrient utilization efficiency of saline–alkali soil through agronomic measures such as straw return [3] and fertilization [4]; the third method is to optimize the saline soil environment by adding soil conditioners and other chemical measures [5]. Biochar application is an efficient strategy to reverse the negative impact of salt stress on plant growth [6,7,8,9]. In addition, biochar can modify the physiological processes of plants to improve their salt stress resistance. For example, the application of biochar increased xylem K+ content and reduced Na+/K+ in potatoes, thereby increasing tuber yield [8]. Biochar application in saline–alkali soil significantly increased the antioxidant enzyme activities of plants to reduce oxidative stress, improving plant growth and biomass [10,11]. Biochar can also modify the physical traits of salt-stressed soil, such as the soil water-holding capacity and nutrient-holding capacity, and can improve soil biological characteristics, such as microbial biomass and enzymatic activities in salt-stressed soil [12]. For example, adding biochar to the soil changed ion balance and adjusted the concentration of salt-based ions and pH and also significantly improved the activity and diversity of microorganisms in the soil, improved the adhesion of microorganisms, and promoted the growth of soil microorganisms, thereby strengthening the biological salt-resistance and biological purification in the soil [13]. Bacterial inoculation on plants significantly improved plant growth in salt-stressed soil by enhancing nutrient uptake [14] and increasing the activity of reactive oxygen species-scavenging enzymes [15]. Plant growth-promoting bacteria alleviate salt stress by increasing 1-aminocyclopropane-1-carboxylate deaminase activity [16], fixing atmospheric nitrogen [17], and colonizing root architecture [18]. The inoculation on rice of Brevibacterium linens RS16, which was isolated from the coastal regions of South Korea, regulated the volatile compound levels under salt stress conditions [19].
In the present study, a pot experiment was carried out using three years of biochar-amended soils with or without NaCl treatment. After rice harvest, the soil was collected and the soil properties, bacterial abundance, and bacterial community structure were measured. The findings may provide theoretical support for improving the microbial environment and rice yield in saline paddy fields.
2. Materials and Methods
2.1. Experimental Design and Sampling
The soil used for the cultivation experiment in the present study was obtained from Jiangsu Academy of Agriculture in Jiangsu Province, China, and collected from a long-term positioning experiment with three years of organic substitution and organic substitution + biochar. The soil basic physicochemical properties of organic substitution were pH 5.43 ± 0.10, EC 249.0 μS/cm ± 26.5 μS/cm, CEC 19.5 cmol/kg ± 1.31 cmol/kg, and SOM 37.06 g/kg ± 2.82 g/kg, and the basic physicochemical properties of organic substitution + biochar were pH 5.64 ± 0.02, EC 208.0 μS/cm ± 10.7 μS/cm, CEC 18.7 cmol/kg ± 1.55 cmol/kg, and SOM 66.27 g/kg ± 3.38 g/kg. The soluble Na+ and soluble Cl− contents were around 39 mg/kg ± 0.50 mg/kg and 76 mg/kg ± 6.19 mg/kg, respectively, in both CK and B. During the rice growth period, the application of nitrogen fertilizer was 240 kg N/hm2, of which 25% was replaced by organic substitution according to pure nitrogen content, and the P and K fertilizers were 60 kg P2O5/hm2 and 90 kg K2O/hm2, respectively. The application of biochar was 45,000 kg/hm2. Biochar was made from wood and calcined at 600 °C. The characteristics of biochar were biochar yield 35.87% ± 0.51%, ash content 33.16% ± 0.75%, pH 8.83 ± 0.57, EC 1185 μS/cm ± 117.07 μS/cm, CEC 33.5 cmol/kg ± 1.06 cmol/kg, and N 1.66% ± 0.02%.
The cultivation experiment used the above two types of soil with and without 3 g NaCl per kg soil. The specific treatments were as follows: CK (organic substitution), B (organic substitution + biochar), S (CK + NaCl), and BS (B + NaCl). There were three replicates per treatment.
The conventional japonica rice Jinyuan 85 was used in the present study, which is belong to the salt-tolerant rice cultivars. The whole growth period of Jinyuan 85 in the Huang-Huai-Hai area is 118 days, and the average plant height is 80.1 cm. Seeds were sown on 22 May 2020. After one month of growth in the seedling bed, uniform seedlings were selected and transplanted to pots for different treatments. The rice was harvested on 14 October 2020 and the biomass was measured and recorded after oven drying. The rhizosphere soil was collected and sieved through the mesh to remove the impurities. One portion of the soil samples was stored at −80 °C for DNA extraction, and another portion of the soil was air dried for soil property analysis.
2.2. Soil Property Analysis
The rice rhizosphere soils were obtained for further study. Soil pH and electrical conductivity (EC) were determined in deionized water (soil:water, 1:2.5) using a pH meter (Mettler Toledo FiveGoTM, Shanghai, China). The soil cation exchange capacity (CEC) was determined by the cobalt trichloride method [20]. Soil organic matter (SOM) was measured using the sulfuric acid-potassium dichromate oxidation method with external heating. Humic acid (HA) was extracted with 0.1 mol/L Na4P2O7 + 0.1 mol/L NaOH mixture. HA was then separated by 0.5 mol/L H2SO4. Soluble Na+ and soluble Cl− were extracted in deionized water (soil: water, 1:5). Soluble Na+ was determined by flame photometry (Inesa FP6410, Shanghai, China). Soluble Cl− was determined by QuantiChromTM chloride assay kit (DICL-250) [21]. Total nitrogen (TN) was measured with the Kjeldahl method (Hanon K9840, Jinan, China). Available nitrogen (AN) was determined by the alkali hydrolysis diffusion method. Total phosphorus (TP) was measured by the perchloric acid-sulfuric acid digestion method. Available phosphorus (AP) was extracted with 0.5 mol/L NaHCO3 and determined by the molybdenum-antimony resistance colorimetric method. Total potassium (TK) was melted with sodium hydroxide and determined by flame photometry (Inesa FP6410, Shanghai, China). Available potassium (AK) was extracted with 1.0 mol/L ammonium acetate and determined by flame photometry (Inesa FP6410, Shanghai, China).
2.3. Microbiological Measurement
Total genomic DNA from samples was extracted using the cetyltrimethylammonium bromide/sodium dodecyl sulfate (CTAB/SDS) method. DNA concentration and purity were monitored on 1% agarose gels. According to the concentration, DNA was diluted to 1 ng/µL using sterile water.
The 16S rRNA genes (V4: 515F-806R) were amplified using specific primers with barcodes. All PCR reactions were carried out in 30 µL reactions, with 15 µL of Phusion® High-Fidelity PCR Master Mix (New England Biolabs.inc.), 0.2 µM of forward and reverse primers, and about 10 ng template DNA. Thermal cycling consisted of initial denaturation at 98 °C for 1 min, followed by 30 cycles of denaturation at 98 °C for 10 s, annealing at 50 °C for 30 s, and elongation at 72 °C for 30 s, with a final extension at 72 °C for 5 min.
Equal volumes of 1X loading buffer (containing SYB green) were mixed with PCR products and electrophoresis was conducted on 2% agarose gel for detection. Samples with bright main strips between 400–450 bp were selected for further experiments.
PCR products were mixed in equidensity ratios. Then, the mixture of PCR products was purified with GeneJET Gel Extraction Kit (Thermo Fisher Scientific, Waltham, MA, USA).
Sequencing libraries were generated using the Illumina TruSeq DNA PCR-Free Library Preparation Kit (Illumina, San Diego, CA, USA), following the manufacturer’s recommendations, and index codes were added. The library quality was assessed on the Qubit@ 2.0 Fluorometer (Thermo Scientific) and Agilent Bioanalyzer 2100 system (Agilent, Palo Alto, CA, USA). Finally, the library was sequenced on an Illumina NovaSeq platform, and 250 bp paired-end reads were generated.
2.4. Data Analysis
The significance analysis, one-way analysis of variance, and Duncan’s comparison tests (p < 0.05) were performed using SAS 9.2. Origin 2018 software (OriginLab, Northampton, MA, USA) was used to draw the diagrams.
Paired-end reads from the original DNA fragments were merged using FLASH [22], a rapid and accurate analysis tool that is designed to merge paired-end reads when there are overlaps between reads1 and reads2. Paired-end reads were assigned to each sample according to the unique barcodes. Sequences were analyzed using the Quantitative Insights Into Microbiological Ecology (QIIME) [23] software package, and in-house Perl scripts were used to analyze alpha- (within samples) diversity. First, reads were filtered by QIIME quality filters. Then, pick_de_novo_otus.py was used to select operational taxonomic units (OTUs) by creating an OTU table. Sequences with ≥97% similarity were assigned to the same OTU. We selected a representative sequence for each OTU and used the Silva132 database [24] to annotate taxonomic information for each representative sequence. To compute the alpha diversity, we rarified the OTU table and calculated three metrics. Among them, Chao1 estimates the species abundance, Observed Species estimates the amount of unique OTUs found in each sample, and the Shannon index measures species diversity.
3. Results and Analysis
3.1. Rice Biomass and Soil Properties under Different Treatments
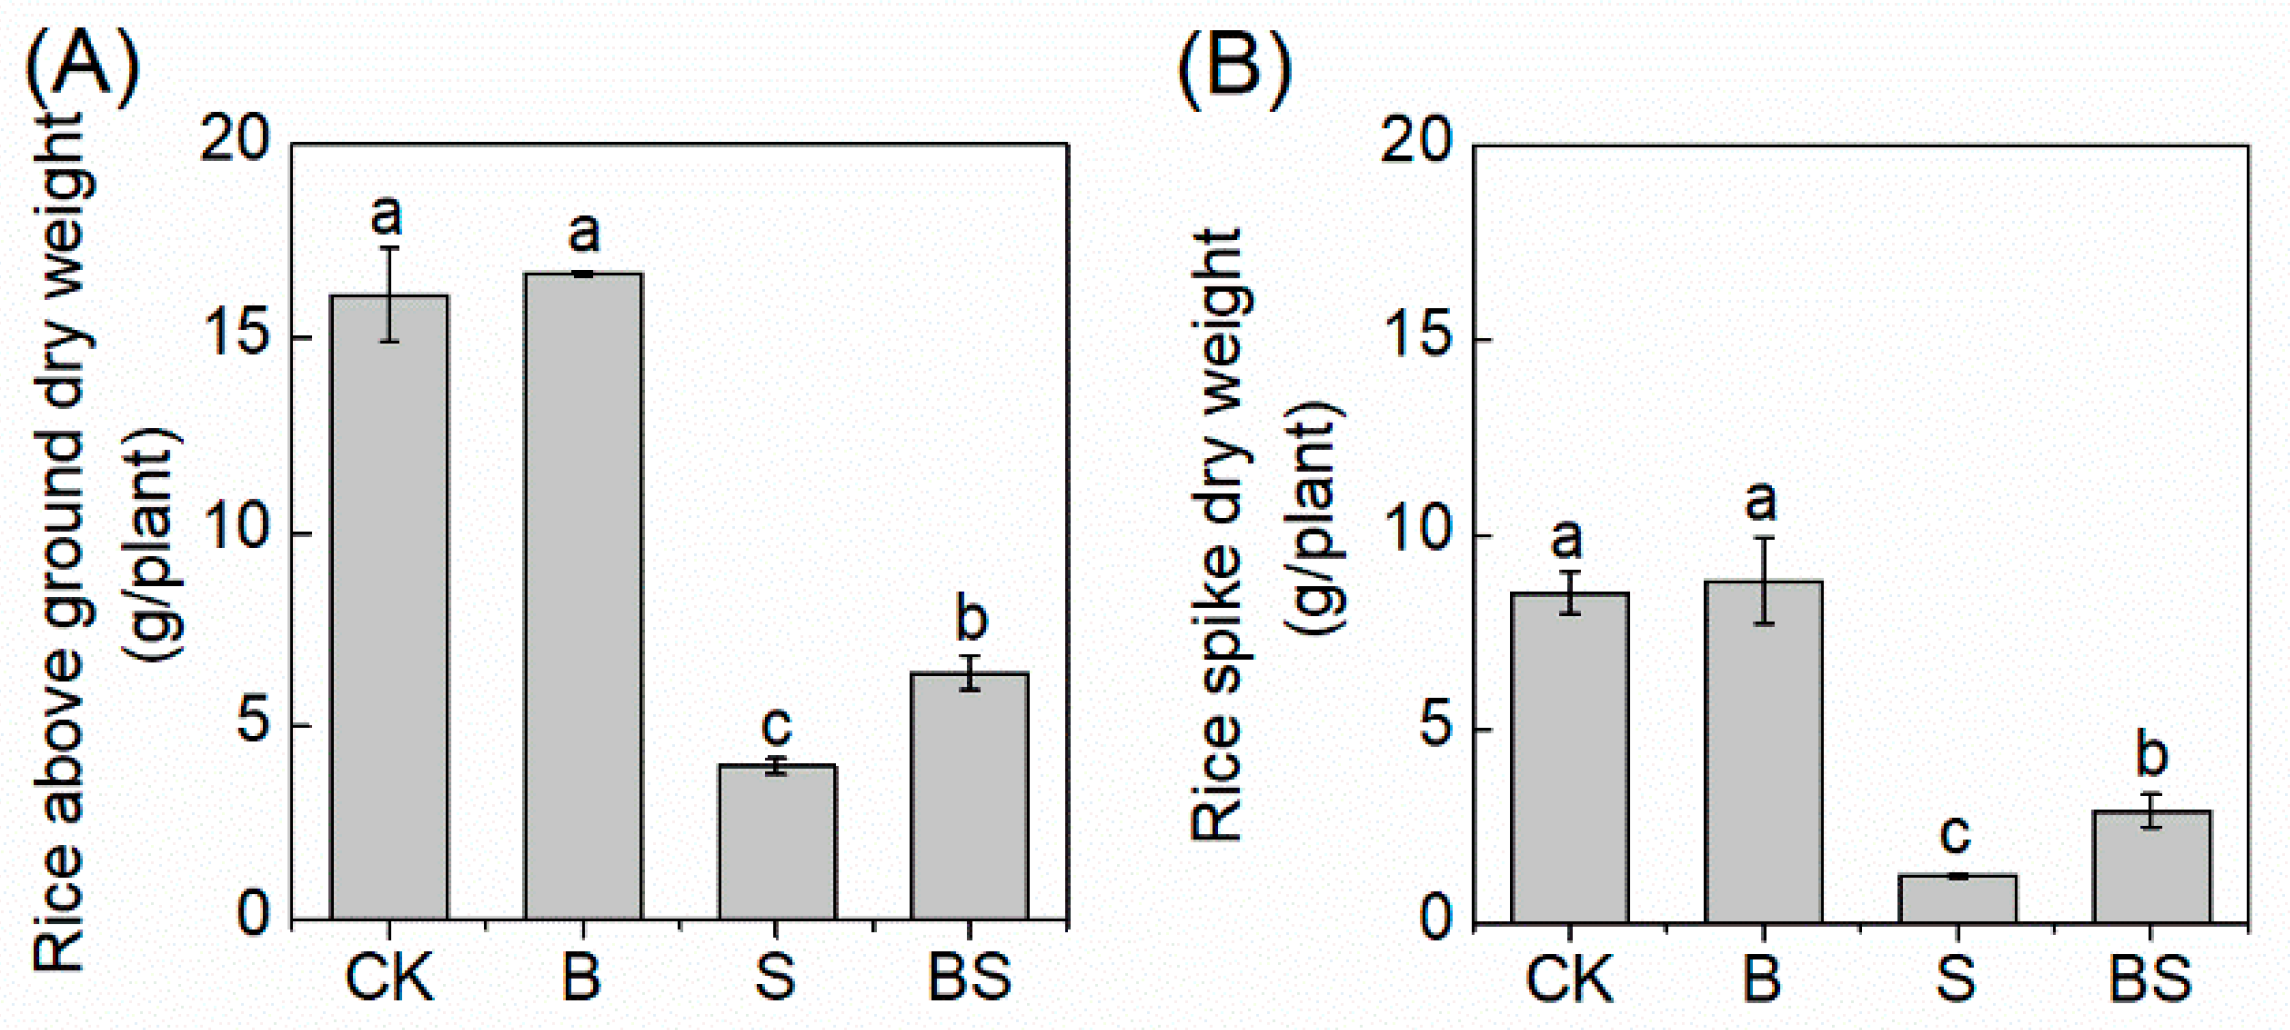
The salt stress significantly decreased the aboveground and spike dry weight of rice (Figure 1). However, biochar application dramatically reversed the inhibition of rice growth induced by salt stress. With biochar, the aboveground dry weight and the rice spike dry weight were 60.30% and 136.4%, respectively, which were greater than those without biochar application under salt stress conditions (Figure 1), indicating that biochar was involved in alleviating salt stress in rice. The application of biochar did not affect rice growth without S treatment (Figure 1).
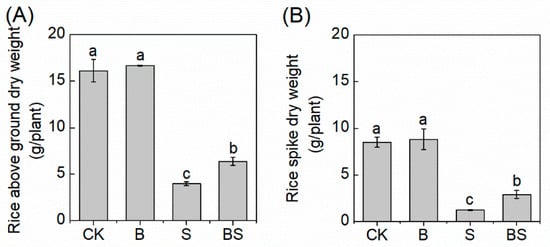
Figure 1.
Effects of different treatments on rice aboveground dry weight (A) and rice spike dry weight (B). Columns with different letters are significantly different at p < 0.05. CK: organic substitution; B: organic substitution + biochar; S: CK + NaCl; BS: B + NaCl.
The simple application of biochar and NaCl both significantly affected the physical and chemical properties of soils after the crop cycle. Compared with CK, S significantly decreased soil pH and HA content, dramatically increased EC from 150.0 cmol/kg ± 0.61 cmol/kg to 1229 cmol/kg ± 0.57 cmol/kg, and increased soluble Na+ and soluble Cl− content in the soil by 12.7-fold and 18.7-fold, respectively (Table 1).

Table 1.
The physical and chemical properties of soils after rice harvest.
Compared with simple NaCl treatment, the application of biochar in the NaCl treatment dramatically increased 6.80% of soil pH, 19.26% of CEC value, 75.07% of SOM value, and 34.42% of HA value. The application of biochar significantly decreased EC by 28.96%, soluble Na+ by 19.26%, and soluble Cl− content in soil by 30.58% (Table 1).
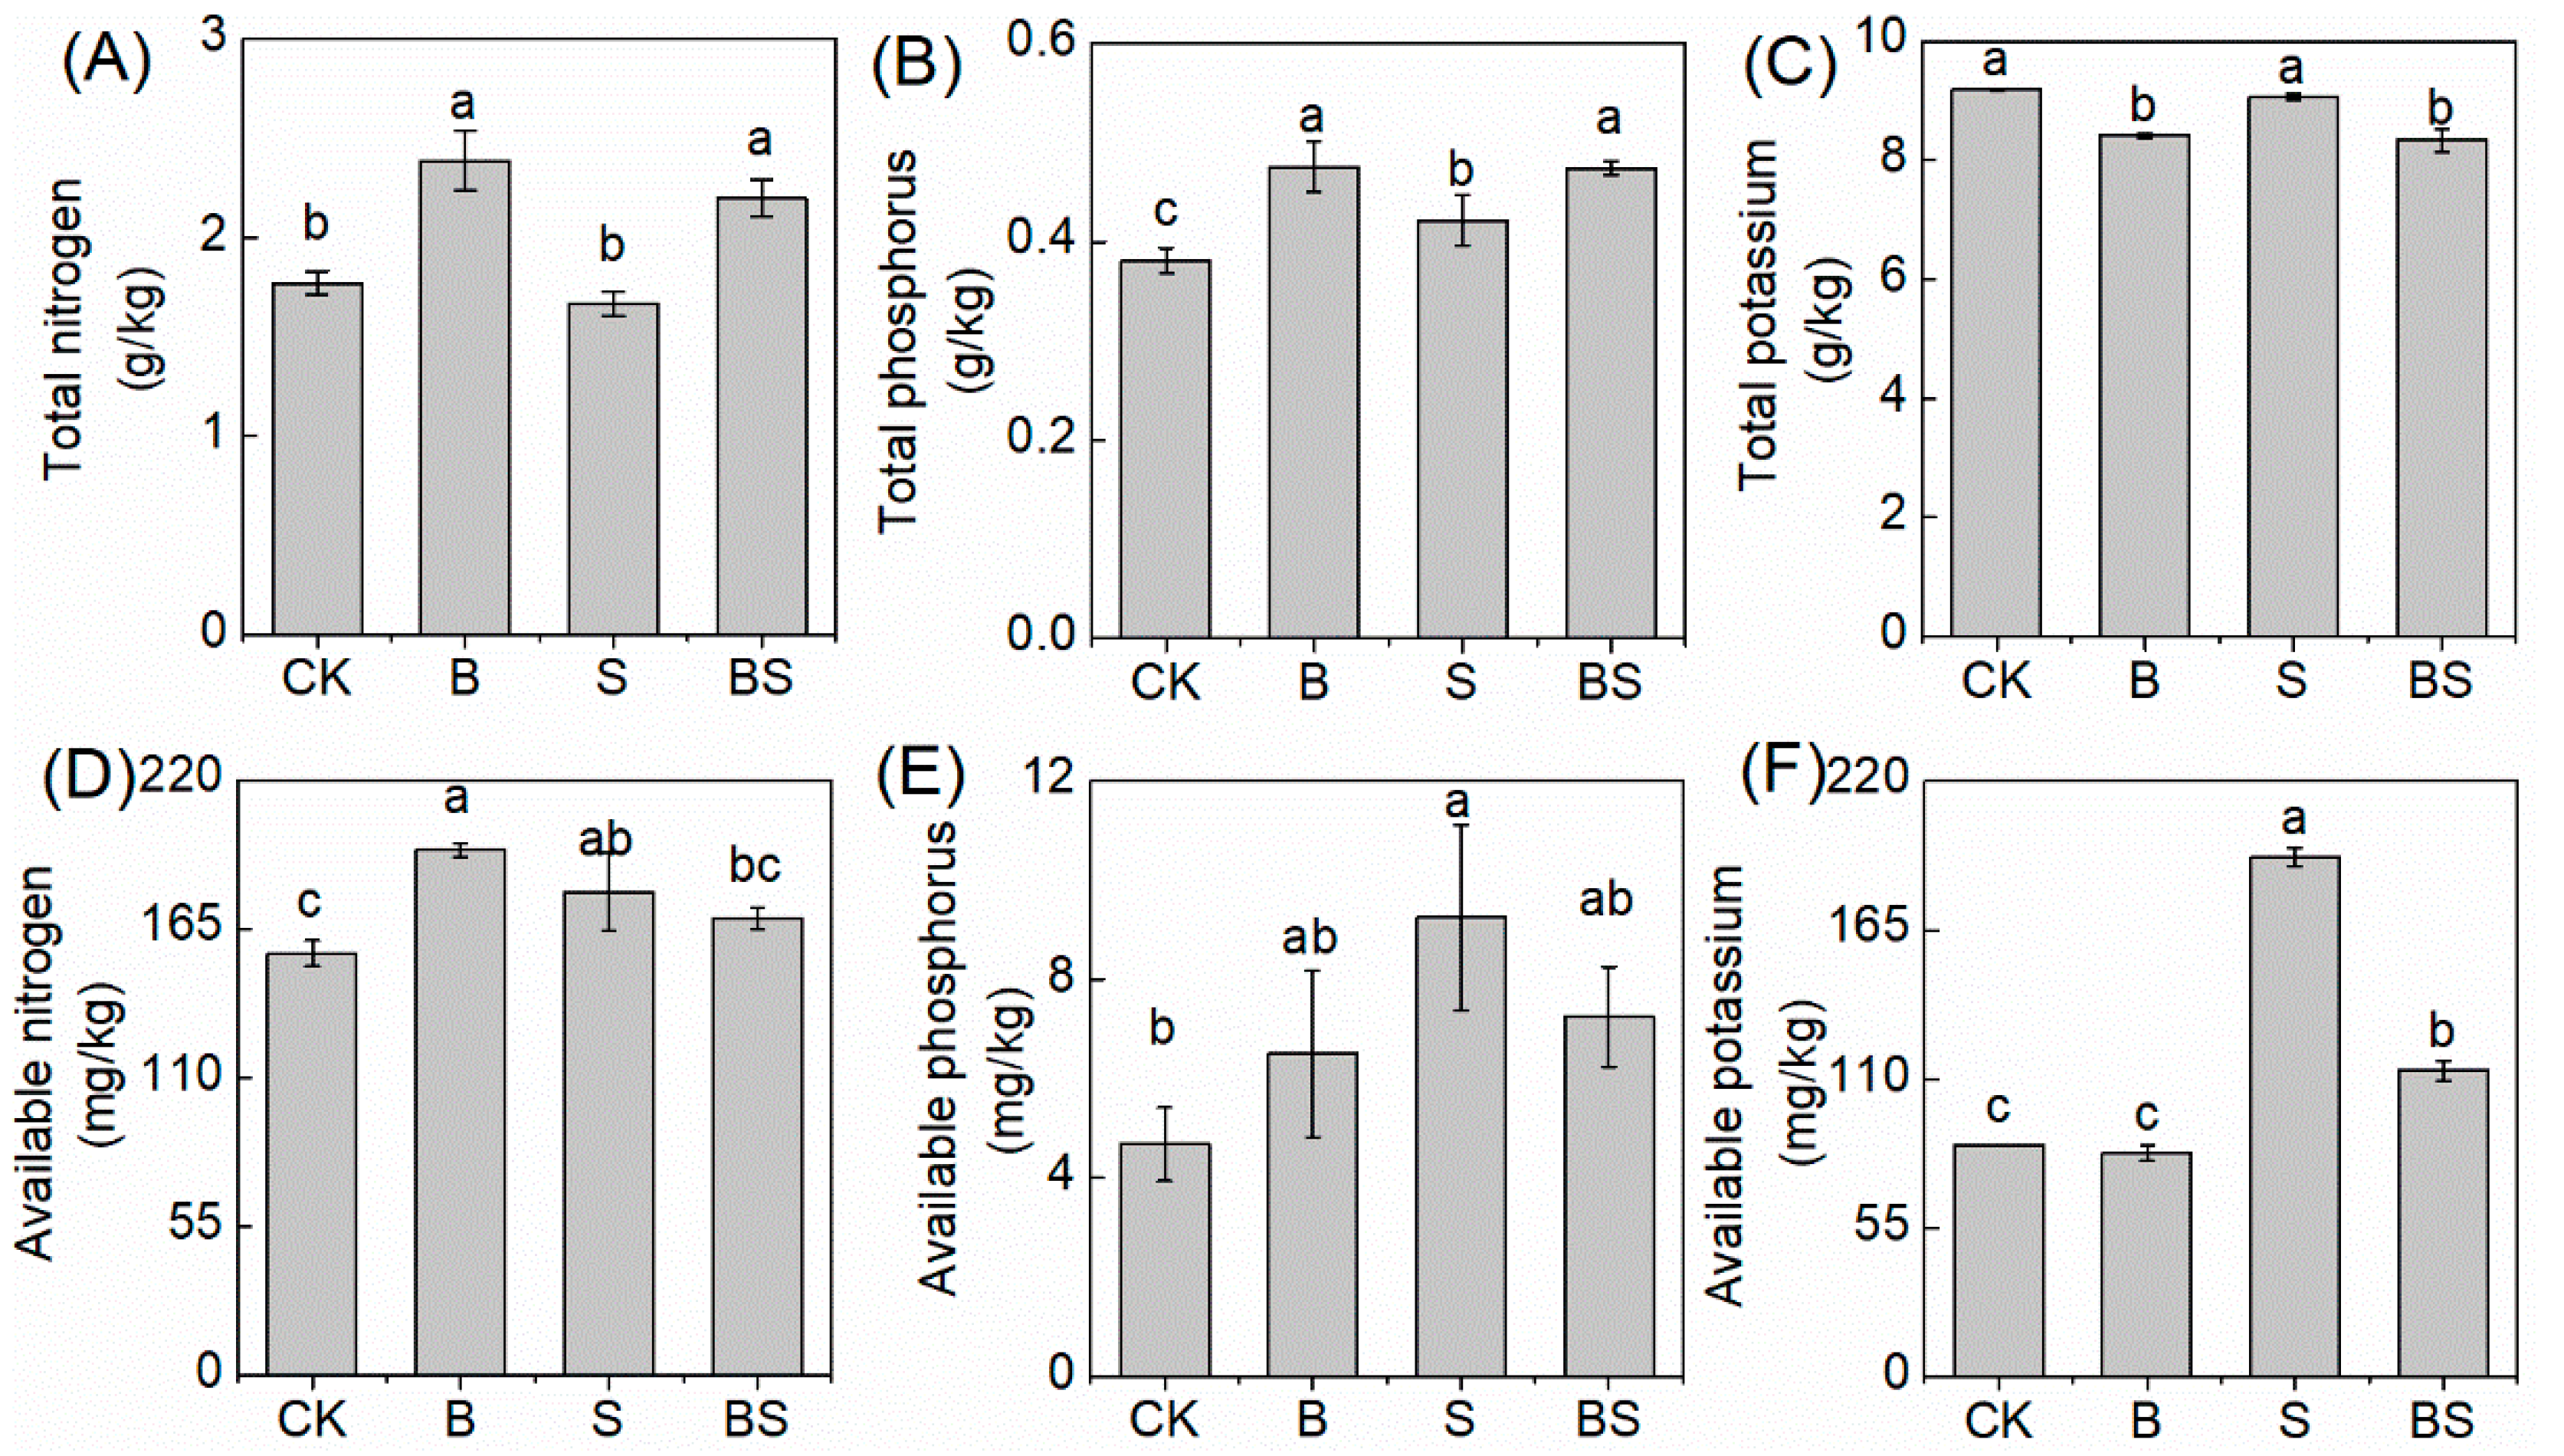
The application of biochar and NaCl both affected rice growth and resulted in differences in the nutrient content retained in the soil after harvest. In the simple biochar treatment, the soil TN and TP content were significantly higher than in CK; however, the TK content had the opposite tendency (Figure 2C). Once NaCl was applied to the soil, the soil TP content after the rice harvest was significantly higher than in the CK treatment. However, NaCl did not affect the soil TN and TK content (Figure 2A,C). After biochar was applied under saline conditions, the soil TN and TP significantly increased, and the TK content decreased, compared with the simple S treatment (Figure 2C).
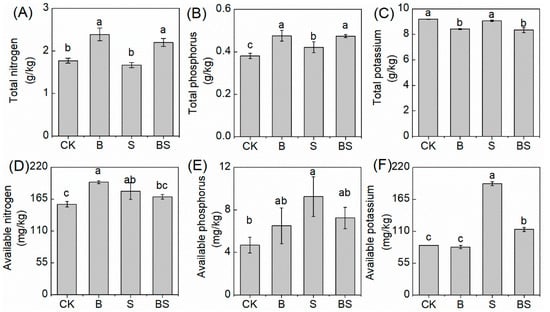
Figure 2.
The total nitrogen (A), total phosphorus (B), total potassium (C), available nitrogen (D), available phosphorus (E), and available potassium (F) content in the soil under treatments. Columns with different letters are significantly different at p < 0.05. CK: organic substitution; B: organic substitution + biochar; S: CK + NaCl; BS: B + NaCl.
The AN and AP content were both increased in the simple B and S treatment compared to CK, and the AK content showed no significant difference between the biochar treatment and CK. However, the AK content increased in the S (Figure 2F). Compared with the S treatment alone, the application of biochar under the S treatment decreased the AN and AP content without significant changes and dramatically decreased the AK content (Figure 2D–F).
3.2. Abundance and Diversity of Soil Bacteria
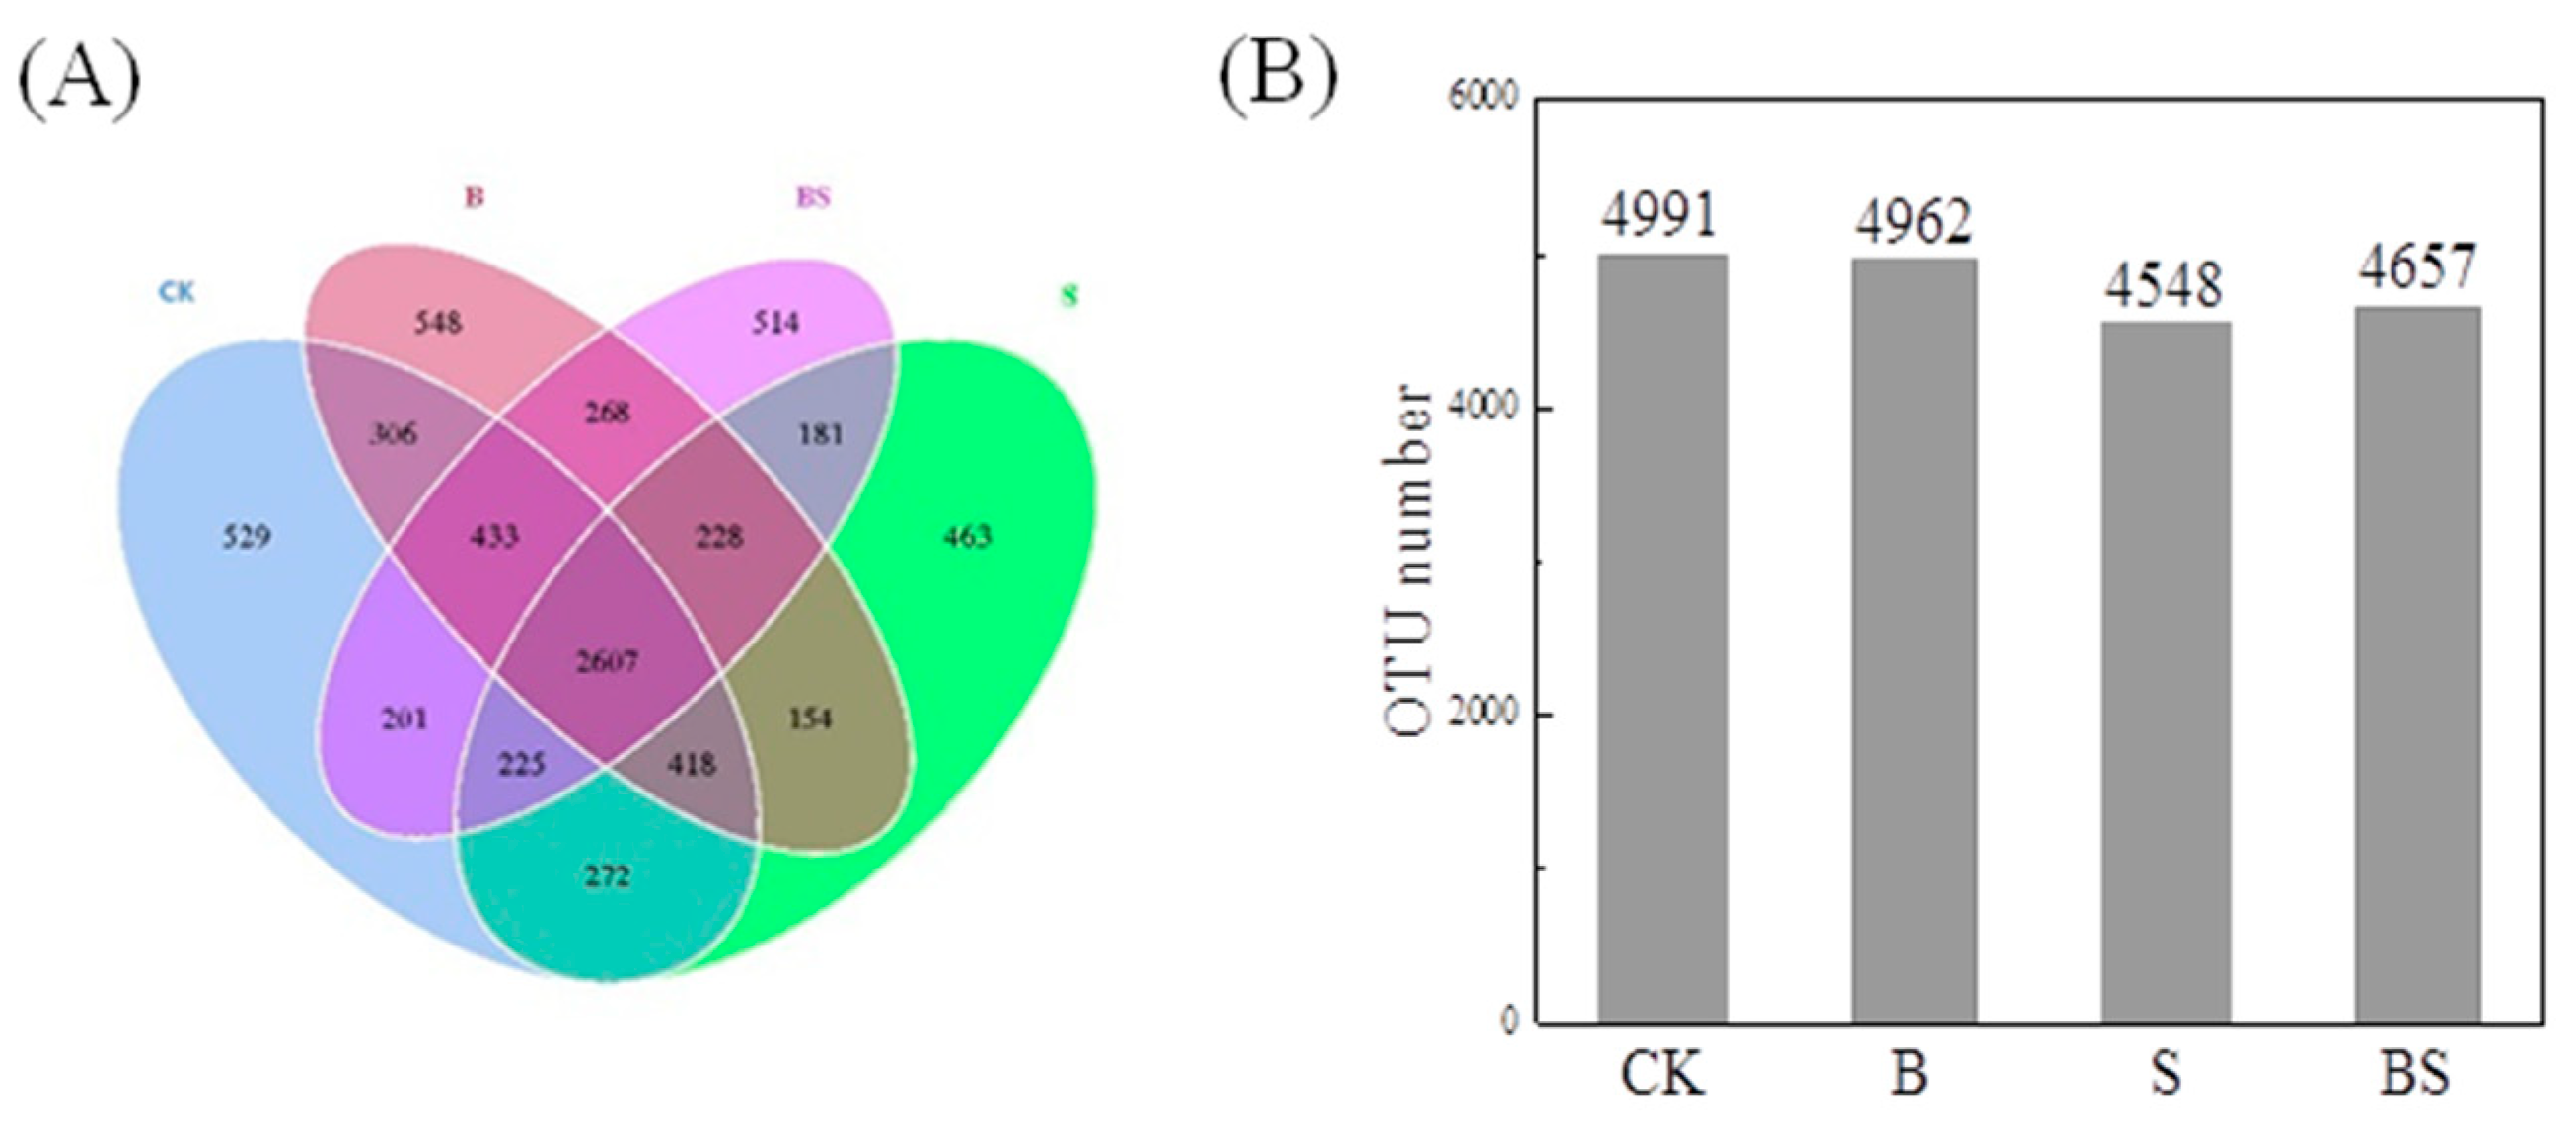
Through the splicing of reads, an average of 95,809 tags per sample were measured, and an average of 91,963 valid data points were obtained after quality control. The effective data amount of quality control reached 59,380 tags, and the effective rate of quality control reached 62.04%. The sequences were clustered into OTUs with 97% identity. A total of 9746 OTUs were obtained, and then, species annotations were carried out between the OTU sequences and the Silva132 database. In the present study, the treatment of NaCl decreased the OTU number from 4991 to 4548. However, the application of biochar reversed the decreased OTU number induced by NaCl treatment and increased it from 4548 to 4657 (Figure 3B). There was no significant difference in OTU number between CK and B, suggesting that simple biochar application did not affect soil bacterial abundance (Figure 3B). For the distribution of OTUs, a Venn diagram was drawn. The diagram showed that 2607 OTUs were found in all four treatments, while 529, 548, 514, and 463 OTUs were only present in the CK, B, BS, and S treatments, respectively (Figure 3A).
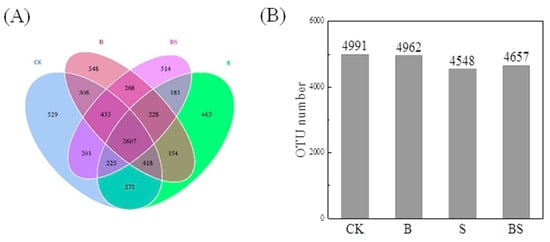
Figure 3.
Venn diagram (A) based on shared and unique operational taxonomic units (OTUs) between different treatments and OTU number (B) of different treatments. CK: organic substitution; B: organic substitution + biochar; S: CK + NaCl; BS: B + NaCl.
The indices of Chao1 and the ACE estimator indicated the community richness, and both indices displayed the same tendency in different treatments. The simple NaCl treatment significantly decreased the values of Chao1 and ACE estimator, compared with CK, and the application of biochar under NaCl treatment increased the Chao1 and ACE estimator values, although there was no significant difference between them. The community diversity was indicated by the Shannon diversity index, and the results showed that there were no significant differences among the CK, B, and S treatments. However, the Shannon diversity index in the BS treatment was significantly lower than in the other treatments, indicating that the BS treatment had the lowest community diversity. The Good’s coverage index and PD whole tree indicated the sequencing depth and phylogenetic diversity, respectively. However, there were no significant differences in these two indices among the four treatments.
3.3. Structure and Composition of the Soil Bacterial Community
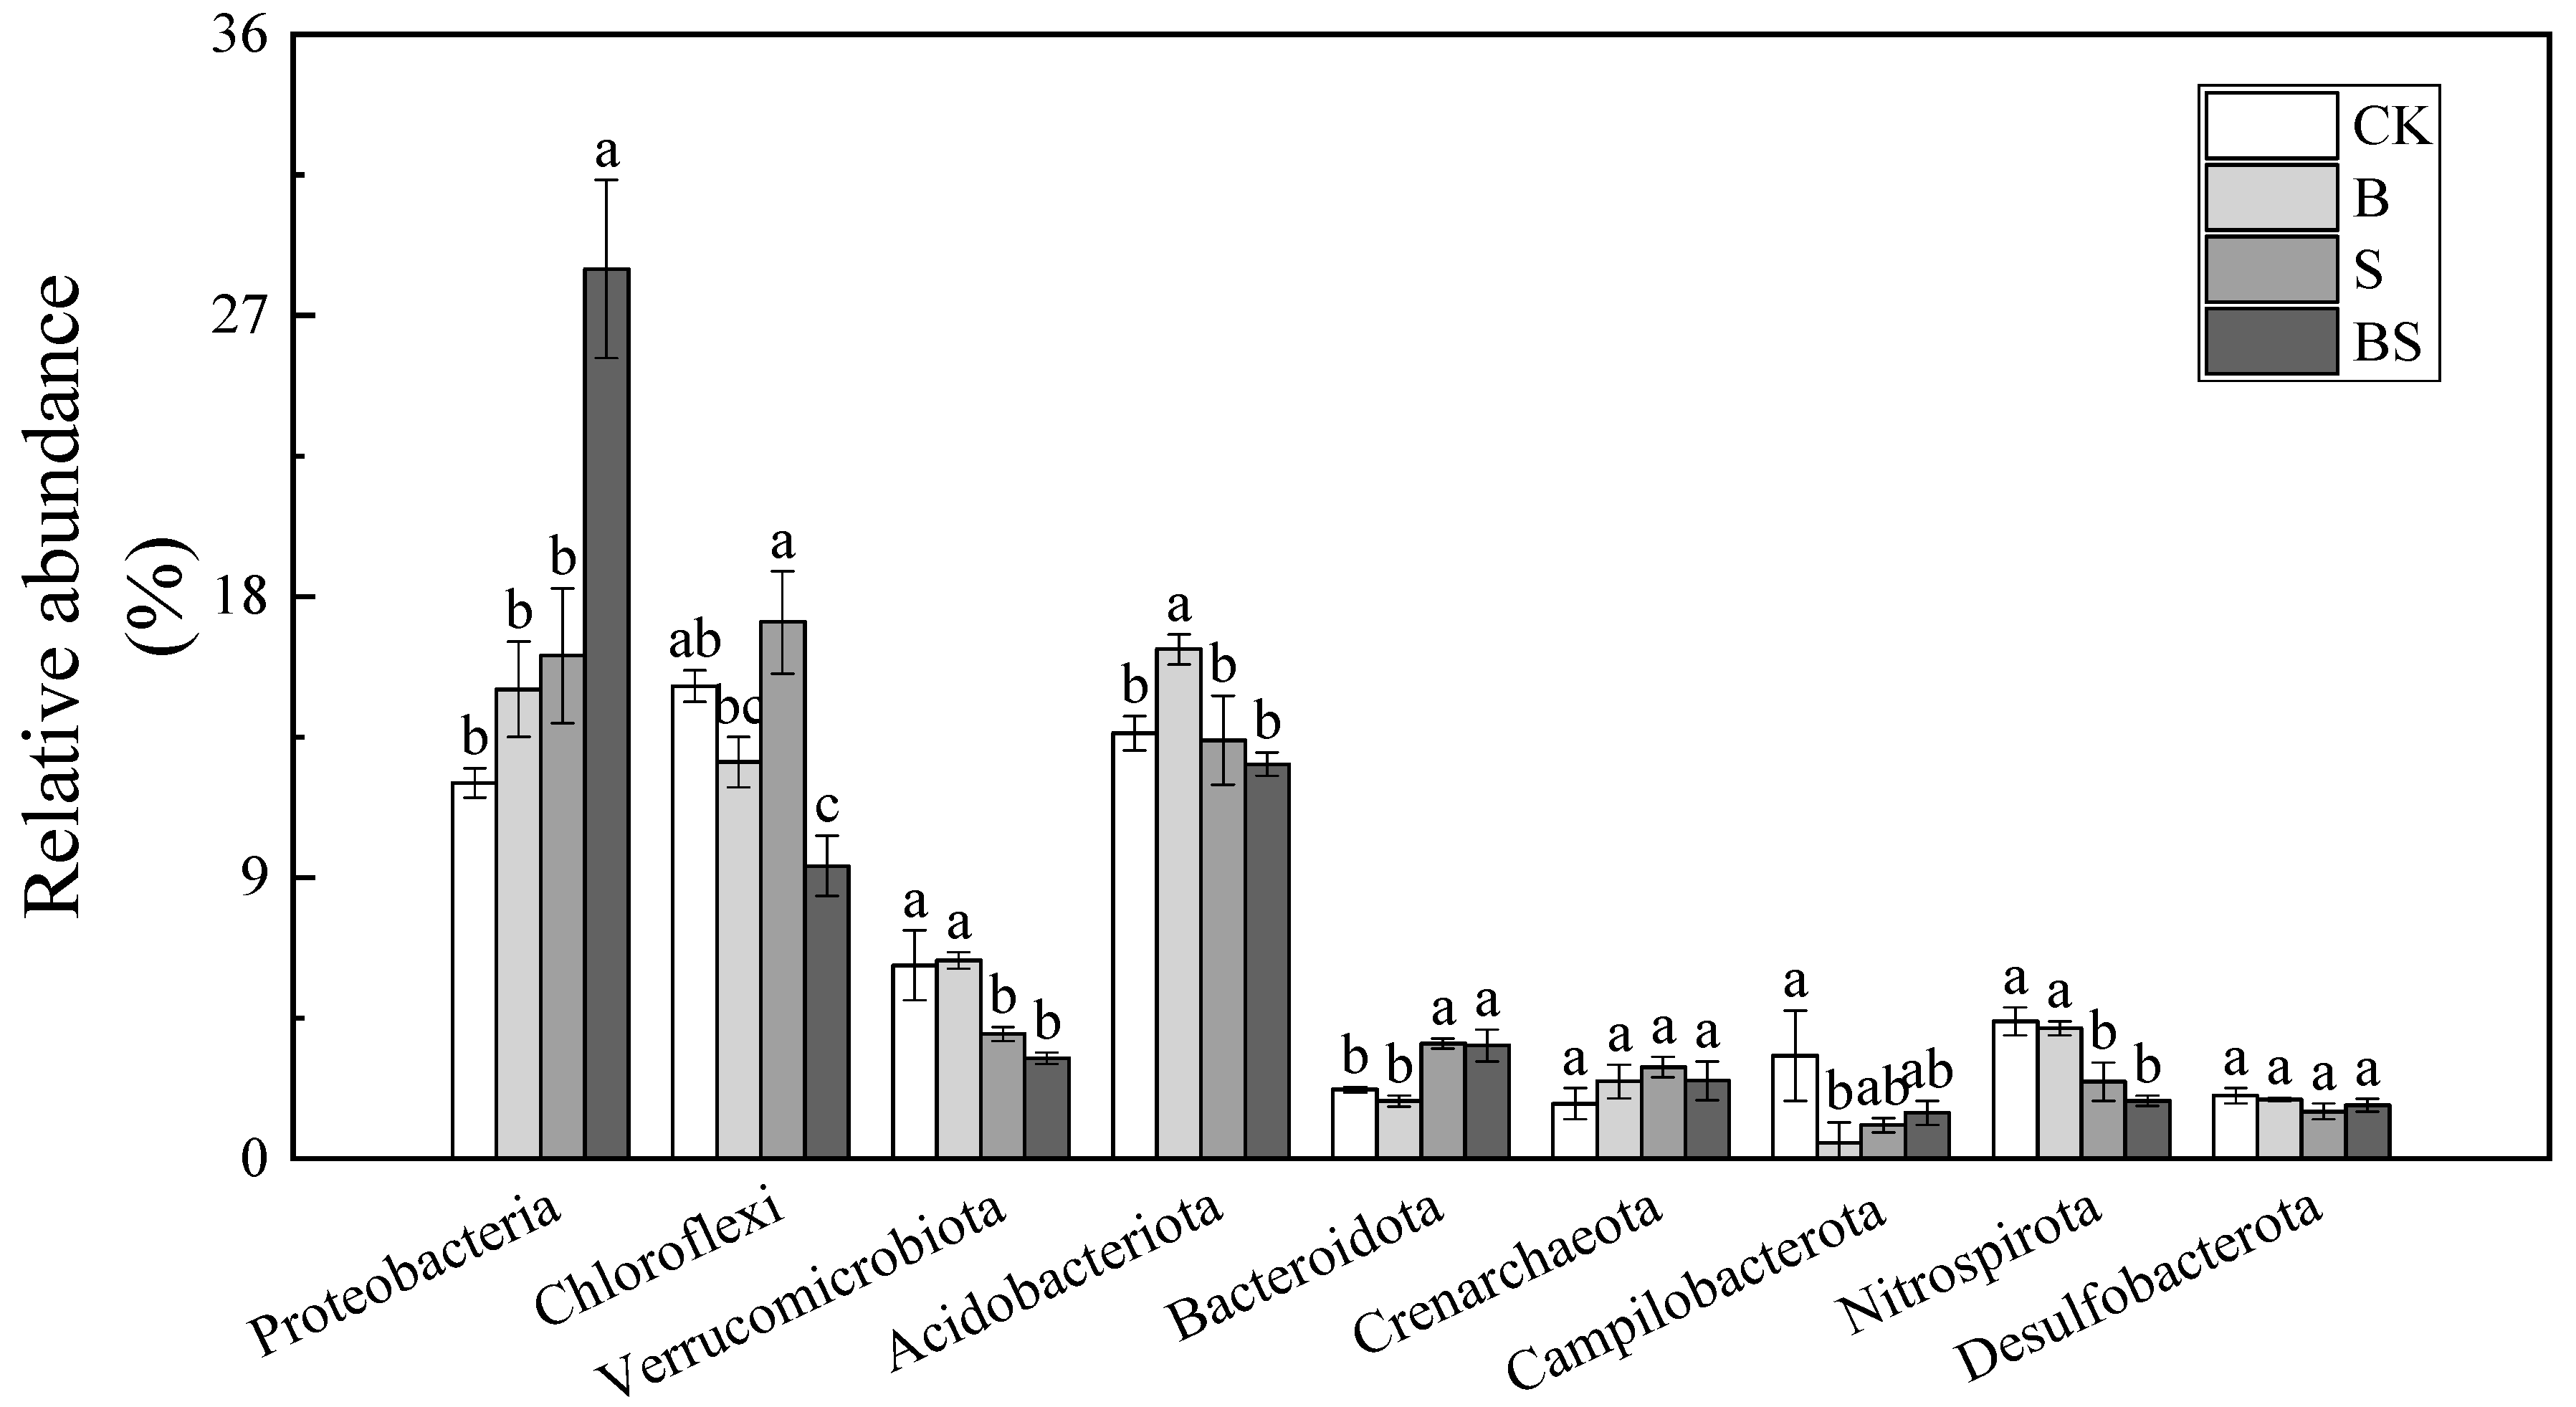
The OTUs were classified into different phyla across the four treatments following the use of the BLAST algorithm in NCBI, and the nine most abundant phyla accounted for 76.01–79.11% of the total community (Figure 4). The most abundant bacteria in the soil belonged to the Proteobacteria phylum. This finding demonstrated that Proteobacteria are the most common bacterial species in saline soil and possess high salt tolerance. Both biochar and NaCl treatment increased the relative abundance of Proteobacteria in the soil, and it reached the highest abundance in the BS treatment (Figure 4). The application of NaCl significantly increased the relative abundance of Chloroflexi. However, the application of biochar had the opposite effect on the relative abundance of Chloroflexi. The relative abundance of Chloroflexi decreased by 16.12% in the B treatment, compared with the CK treatment, and by 45.46% in the BS treatment, compared with the S treatment. At the family level, the common dominant bacterial groups (relative abundance top 10) in the soil under all the treatments are Gallionellaceae, Pedosphaeraceae, Prolixibacteraceae, Spirochaetaceae, Anaerolineaceae, Solibacteraceae, Sulfurimonadaceae, SC-I-84, Rhodocyclaceae, and Bryobacteraceae (Figure S1). The Gallionellaceae family are the most abundant microorganism that belongs to Proteobacteria phyla and displayed a higher abundance in BS treatment (15.79%) than other treatment (Figure S1). The change trends of Anaerolineaceae, which belong to Chloroflexi, were the same as those of phyla. The application of biochar significantly decreased the abundance of Anaerolineaceae with or without salt supplication.
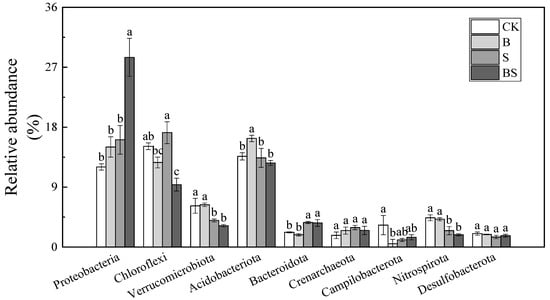
Figure 4.
Relative abundances (%) of the nine most abundant phyla across four treatments. Columns with different letters are significantly different at p < 0.05. CK: organic substitution; B: organic substitution + biochar; S: CK + NaCl; BS: B + NaCl.
The impact of soil properties on bacterial community structure was analyzed by redundancy analysis (Figure 5). The studied soil variables explained 53.55% of the total variation of which the first axis accounted for 36.11%, and the second axis accounted for 17.44% of the total variation. Soil bacterial communities were mainly affected by soil pH and EC (p < 0.05) (Table S1). According to the vectors, the soil bacterial community structures in the CK and B treatments were mainly associated with TK, TN, and pH; the S treatment was mainly affected by TK, AK, and EC; the BS treatment was mainly affected by SOM and EC.
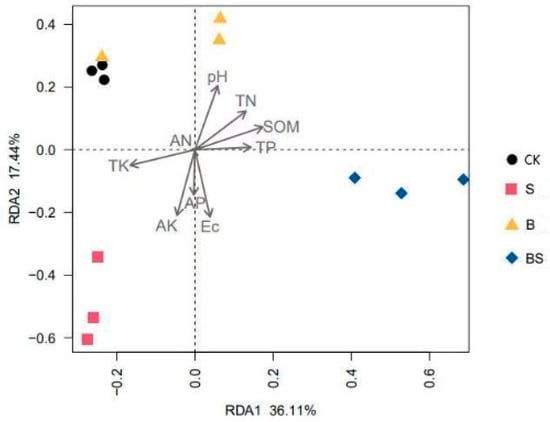
Figure 5.
Redundancy analysis of soil bacterial community structures across four treatments. CK: organic substitution; B: organic substitution + biochar; S: CK + NaCl; BS: B + NaCl.
4. Discussion
The positive role of biochar in the alleviation of salt stress in plants has been demonstrated by various studies. For example, biochar improved the survival percentages and growth rates of the broadleaved herbaceous plants—Abutilon theophrasti and Prunella vulgaris [10]—and improved the growth of bean seedlings via decreasing peroxidation damage under salt stress [11]. In our study, we tested soil amended with biochar to salt stress, and the biomasses of rice aboveground tissue and panicles were both significantly increased (Figure 1), indicating that biochar alleviated salt stress in rice. These improvements in rice growth could be attributed to the changes in soil properties after biochar amendment.
Importantly, ionic toxicity and the osmotic effects induced by salt directly inhibit plant growth [1], and the decreases in the soluble salt content and EC are helpful to alleviate salt stress in plants. In the present study, the content of soluble Na+ and soluble Cl- were significantly reduced in the BS treatment, compared with the S treatment, accompanied by a dramatic decrease in EC (Table 1), suggesting that biochar increased the leaching of soluble salts from soil or increased the binding of soluble salts in the biochar. Several studies have demonstrated that biochar causes the leaching of soluble salts. For example, biochar application decreased EC by 84%, compared with the control saline–sodic soil, by improving hydraulic conductivity, thereby facilitating the leaching of salts from soil [25]. The addition of biochar to saline soil significantly increased the leaching of Na+ and HCO3- from the soil column and reduced the EC values of the efflux to 5 mS/cm 56–62 days earlier than in the control [26]. In a field experiment, the biochar treatment significantly decreased the salt and Na+ contents from 9.21 to 5.63 g/kg and from 5.62 to 3.69 g/kg, respectively, in the first year, and increased the wheat grain yield from 570 kg/hm2 into 6610 kg/hm2 in saline–sodic soil [6]. In addition to increasing the leaching of salts from the soil, salt can also bind to the surface or fine pores of biochar to reduce EC due to the sorptive properties of biochar [10]. Biochar may also reduce the upward movement of saline water and, thus, reduce salt retention in the topsoil. The changes of pH in saline soil after the application of biochar are determined by the original biochar pH [27]. In the present study, biochar application significantly increased the soil pH (Table 2).
Table 2.
Effects of different treatments on the diversity indices of bacteria.
The changes in soil nutrient status after biochar amendment can also affect rice growth under salt stress. Soil nutrient status includes the concentrations change of SOM, CEC, N, P, K, etc. Due to the colloid-specific effect, soils that possess higher CEC values preferably attract polyvalent (Ca) over monovalent (Na) cations from the soil solution, which means that the application of biochar may lead to a lower soil exchangeable sodium percentage via increasing the CEC value [28]. SOM content in the soil represents the level of soil fertility [29], but it also means that the soil possesses higher resistance to Na adsorption and rarely displays sodic behavior due to hydrophobicity [30]. In addition, SOM contains HA, which is involved in improving salt tolerance in plants. A transcriptome study found that HA triggered an overall alteration of gene expression involved in plant development and stress responses to resist various injuries caused by salt stress in Arabidopsis [31]. In the present study, the CEC value and SOM and HA content in the BS treatment were significantly higher than in the S treatment, suggesting that biochar application increased these parameters to help rice resist salt stress.
The content of macronutrients in the soil also changed under different treatments in the present study. Salinity and sodicity induced nitrogen loss in soil by volatilizing NH3 and N2O [32]. However, the biochar bound ammonium in the biochar particles and inhibited nitrification and denitrification processes to decrease N losses [33,34]. In accordance with previous research, the application of biochar significantly increased the TN content whether with or without NaCl treatment in the present study (Figure 2A). In saline soil, the availability and uptake of P were dramatically increased after the application of biochar. Biochar directly acts as a P source or improves growth medium conditions for plants [6]. The total P content in the soil was significantly increased in the present study with or without NaCl treatment, further confirming previous research (Figure 2B). However, the TK content in the soil was significantly decreased with biochar application, compared with the treatments that had no biochar application in the present study (Figure 2C). Furthermore, the AN, AP, and AK contents in the BS treatment were all decreased, compared with the S treatment (Figure 2D–F). The results can be explained by the following factors. The application of biochar improved the rice growth under S treatment, thus improving the uptake of the above nutrient elements. As a result, the available nutrient content in the soil decreased. For example, improving K uptake to resist Na toxicity is a common strategy for plants under salt stress. The application of biochar enhanced the K concentration in salt-affected soils [35]. However, when the uptake of K was stimulated, once the uptake rate exceeded the K released from soil, the AK content could be decreased.
A previous study demonstrated that salt stress significantly decreased microbial activity and biomass and altered the microbial community structure in soil due to the inhibition of soil respiration [36,37]. Accordingly, the S treatment significantly decreased the OTU numbers from 4991 to 4548 in our study (Figure 3B), further confirming the results that salt stress inhibited microbial growth. However, biochar application dramatically reversed the decrease in OTU numbers induced by NaCl and increased the number of OTUs from 4548 to 4657 (Figure 3B), indicating that biochar increased the bacterial abundance under salt stress conditions. The application of biochar may also affect bacteria growth directly. Previous research found that the biochar that contained more carboxyls, lactones, and phenolic groups was the most suitable choice for the soil bacterial community. Additionally, biochar may increase the soil bacterial abundance indirectly. For example, the application of biochar significantly increased rice growth under salt stress conditions and resulted in the higher secretion of root exudates, which serve as a carbon source for rhizosphere bacteria. The increased bacteria might improve the salt tolerance of rice after the application of biochar. Soil microbes participated in SOM decomposition, humus formation, and soil nutrient transformation and recycling [38]. Higher bacterial abundance in soil provided more opportunities for plants to utilize soil nutrients.
The soil microbial community structure composition was another important index that can be used to evaluate soil quality and fertility, in addition to crop productivity [39]. The more complex the soil microbial community structure, the more stable the soil ecosystem. The Shannon diversity index decreased significantly with BS (Table 2), indicating that community diversity decreased significantly with BS. We speculated that the reason for this result was the emergence of relatively abundant dominant bacteria in BS treatment, such as Proteobacteria (Figure 4). The indices of Chao1 and ACE estimator indicate the community richness. Both of these indices were increased by the application of biochar under NaCl treatment, although there was no significant difference between them (Table 2). These results were consistent with a study reported by Wang et al. [40], which found that the application of biochar increased the relative abundances of Bacillus and Nitrospira. The identified increase in bacterial richness might be partly attributable to the biochar-induced modification of soil properties. For example, in the present study, the application of biochar increased the total P content in the soil. This might increase the relative abundance and distribution of phosphate-solubilizing bacteria such as Thiobacillus, Pseudomonas, and Flavobacterium in soils [41].
The Proteobacteria, Chloroflexi, and Acidobacteria in the soil were the top three phyla in terms of the richness of bacteria in the present study, and their richness changed with the different treatments (Figure 4). Interestingly, the application of biochar played an opposite role in the abundance of Chloroflexi and Proteobacteria. Chloroflexi is generally considered to be an oligotrophic bacterium that dominates in soil with low nutrients [42]. In contrast, Proteobacteria are generally considered to prefer nutrient-rich soil [43]. In the present study, the relative abundance of Chloroflexi was the highest (17.18%) under the S treatment and decreased to 9.37% in the BS treatment (Figure 4). The relative abundance of Proteobacteria was increased after the addition of biochar (Figure 4). These results were in accordance with the change tendency of soil CEC, SOM, HA, TN, and TP content, all of which increased after biochar was applied under salt stress. The above results suggested that the application of biochar under salt stress conditions improved rice growth by increasing the nutrient content in the soil and modifying the relevant bacterial community.
Studies have demonstrated that salinity has a strong influence on microbial community composition [44], and physicochemical parameters are involved in the changes in soil bacteria under salt stress. Moreover, the redundancy analysis showed that soil bacterial communities were mainly affected by soil pH and EC (p < 0.05) (Table S1). Within a certain salinity range, the EC value was closely related to salt content. Furthermore, biochar addition significantly reduced the EC value due to its high surface area (Table 2) [45], thus affecting the soil bacterial community.
5. Conclusions
The application of biochar alleviated salt stress in rice via modifying soil properties and regulating soil bacterial abundance and community structure in the present study. The application of biochar significantly decreased the value of EC, soluble Na+ and Cl− contents, and increased CEC, SOM, HA, total nitrogen, and total phosphorus contents in the soil. In addition, the application of biochar increased the richness of soil microbial community and modified the bacterial community structure, such as increased Proteobacteria abundance and decreased Chloroflexi abundance, which are considered to be eutrophic bacteria and oligotrophic bacteria, respectively. Soil bacterial communities were mainly affected by soil pH and EC (p < 0.05). This study provides a theoretical basis for alleviating saline–alkali paddy soil in the future.
Supplementary Materials
The following are available online at https://www.mdpi.com/article/10.3390/agronomy12020409/s1, Figure S1: Relative abundances (%) of the 10 most abundant families across four treatments. Columns with different letters are significantly different at p < 0.05. CK: organic substitution; B: organic substitution + biochar; S: CK + NaCl; BS: B + NaCl. Table S1: A one-way analysis of variance for the redundancy analysis.
Author Contributions
Conceptualization, J.H., C.Z. and J.Z.; methodology, H.Z.; software, Y.Y.; validation, Y.K., X.C. and Y.Z.; formal analysis, L.Z. and Y.N.; investigation, C.Z.; resources, J.Z.; data curation, W.T.; writing—original draft preparation, J.H.; writing—review and editing, C.Z.; visualization, J.Z.; supervision, H.Z.; project administration, Y.Y.; funding acquisition, C.Z. All authors have read and agreed to the published version of the manuscript.
Funding
This research was funded by the National Natural Science Foundation of China (Grant Nos. 31872857 and 31901452), the Open Project Program (20210104) of State Key Laboratory of Rice Biology.
Institutional Review Board Statement
Not applicable, as no new experiments/measurements were conducted.
Informed Consent Statement
Not applicable.
Data Availability Statement
The data can be obtained from the authors upon request.
Acknowledgments
This study was supported by the National Natural Science Foundation of China (Grant Nos. 31872857 and 31901452) and the Open Project Program (20210104) of State Key Laboratory of Rice Biology.
Conflicts of Interest
The authors declare no conflict of interest.
References
- Munns, R.; Tester, M. Mechanisms of salinity tolerance. Annu. Rev. Plant Biol. 2008, 59, 651–681. [Google Scholar] [CrossRef] [PubMed] [Green Version]
- Zhang, J.-L.; Liu, M.; Qian, H.; Zhang, Q.; Wang, Z.-Y. Spatial-temporal variation characteristics of water-salt movement in coastal saline soil improved by flooding and subsurface drainage. Trans. Chin. Soc. Agric. Eng. Trans. CSAE 2018, 34, 98–103. [Google Scholar]
- Cai, C.; Cheng, P.-Y. Comparison of the effects of different maize straw returning methods on saline soil improvement. E3S Web Conf. 2019, 131, 01089. [Google Scholar]
- Guo, X.-H.; Jiang, H.-F.; Lan, Y.-C.; Wang, H.-Y.; Xu, L.-Q.; Yin, D.-W.; Zheng, G.-P.; Lv, Y.-D. Optimization of nitrogen fertilizer management for improving rice grain yield and nutrient accumulation and mobilization in saline-alkaline soils. Crop Sci. 2020, 60, 2621–2632. [Google Scholar] [CrossRef]
- Fang, B.; Li, X.-Q.; Zhao, B.; Zhong, L. Influence of biochar on soil physical and chemical properties and crop yields in rainfed field. Ecol. Environ. Sci. 2014, 23, 1292–1297. [Google Scholar]
- Muhammad, S.L.; Liu, Y.-M.; Li, L.-Q.; Pan, W.-N.; Fu, J.-Y.; Pan, G.-X.; Zheng, J.-F.; Zheng, J.-W.; Zhang, X.-H.; Yu, X.-Y. Effects of amendment of biochar-manure compost in conjunction with pyroligneous solution on soil quality and wheat yield of a salt-stressed cropland from Central China Great Plain. Field Crops Res. 2013, 144, 113–118. [Google Scholar]
- Muhammad, S.L.; Ye, Y.-X.; Ji, H.-S.; Li, L.-Q.; Grace, W.K.; Lu, H.-F.; Zheng, J.-F.; Pan, G.-X. Biochar–manure compost in conjunction with pyroligneous solution alleviated salt stress and improved leaf bioactivity of maize in a saline soil from central China: A 2-year field experiment. J. Sci. Food Agric. 2015, 95, 1321–1327. [Google Scholar]
- Saqib, S.A.; Mathias, N.A.; Liu, F.-L. Biochar mitigates salinity stress in potato. J. Agron. Crop Sci. 2015, 201, 368–378. [Google Scholar]
- Kim, H.S.; Kim, K.R.; Yang, J.-E.; Ok, Y.S.; Owens, G.; Nehls, T.; Wessolek, G.; Kim, K.H. Effect of biochar on reclaimed tidal land soil properties and maize (Zea mays L.) response. Chemosphere 2015, 142, 153–159. [Google Scholar] [CrossRef]
- Thomas, S.C.; Frye, S.; Gale, N.; Garmon, M.; Launchbury, R.; Machado, N.; Melamed, S.; Murray, J.; Petroff, A.; Winsborough, C. Biochar mitigates negative effects of salt additions on two herbaceous plant species. J. Environ. Manag. 2013, 129, 62–68. [Google Scholar] [CrossRef]
- Salar, F.A.; Shahram, T. Antioxidant enzyme and osmotic adjustment changes in bean seedlings as affected by biochar under salt stress. Ecotoxicol. Environ. Saf. 2017, 137, 64–70. [Google Scholar]
- Sohi, S.P.; Krull, E.; Lopez-Capele, E.; Bol, R. A review of biochar and its use and function in soil. Adv. Agron. 2010, 105, 47–82. [Google Scholar]
- Tang, J.-Y. Effect of Biochar on Iron Reduction in Flooded Soils and Contribution of Biochar to Bate Soil Salinization; Northwest A & F University: Yangling, China, 2017. [Google Scholar]
- Siddikee, M.A.; Glick, B.R.; Chauhan, P.S.; Yim, W.; Sa, T. Enhancement of growth and salt tolerance of red pepper seedlings (Capsicum annuum L.) by regulating stress ethylene synthesis with halotolerant bacteria containing 1-aminocyclopropane-1-carboxylic acid deaminase activity. Plant Physiol Biochem. 2011, 49, 427–434. [Google Scholar] [CrossRef] [PubMed]
- Samaddar, S.; Chatterjee, P.; Choudhury, A.R.; Ahmed, S.; Sa, T. Interactions between Pseudomonas spp. and their role in improving the red pepper plant growth under salinity stress. Microbiol. Res. 2019, 219, 66–73. [Google Scholar] [CrossRef] [PubMed]
- Chatterjee, P.; Kanagendran, A.; Samaddar, S.; Pazouki, L.; Sa, T.M.; Niinemets, Ü. Methylobacterium oryzae CBMB20 influences photosynthetic traits, volatile emission and ethylene metabolism in Oryza sativa genotypes grown in salt stress conditions. Planta 2019, 249, 1903–1919. [Google Scholar] [CrossRef] [PubMed]
- Islam, M.R.; Sultana, T.; Joe, M.M.; Yim, W.; Cho, J.C.; Sa, T. Nitrogen-fixing bacteria with multiple plant growth-promoting activities enhance growth of tomato and red pepper. J. Basic Microbiol. 2013, 53, 1004–1015. [Google Scholar] [CrossRef]
- Poonguzhali, S.; Madhaiyan, M.; Yim, W.-J.; Kim, K.-A.; Sa, T.-M. Colonization pattern of plant root and leaf surfaces visualized by use of green-fluorescent-marked strain of Methylobacterium suomiense and its persistence in rhizosphere. Appl. Microbiol. Biotechnol. 2018, 78, 1033–1043. [Google Scholar] [CrossRef]
- Chatterjee, P.; Kanagendran, A.; Samaddar, S.; Pazouki, L.; Sa, T.M.; Niinemets, Ü. Inoculation of Brevibacterium linens RS16 in Oryza sativa genotypes enhanced salinity resistance: Impacts on photosynthetic traits and foliar volatile emissions. Sci. Total Environ. 2018, 645, 721–732. [Google Scholar] [CrossRef]
- ISO 23470-2007. Soil Quality-Determination of Effective Cation Exchange Capacity (CEC) and Exchangeable Cations Using a Hexamminecobalt Trichloride Solution; ISO: Geneva, Switzerland, 2007. [Google Scholar]
- Sink, T.D.; Neal, J.W. Stress response and posttransport survival of hybrid striped bass transported with or without clove oil. North Am. J. Aquac. 2009, 71, 267–275. [Google Scholar] [CrossRef]
- Magoč, T.; Salzberg, S.L. FLASH: Fast length adjustment of short reads to improve genome assemblies. Bioinformatics 2011, 27, 2957–2963. [Google Scholar] [CrossRef]
- Caporaso, J.G.; Kuczynski, J.; Stombaugh, J.; Bittinger, K.; Bushman, F.D.; Costello, E.K.; Fierer, N.; Peña, A.G.; Goodrich, J.K.; Gordon, J.I.; et al. QIIME allows analysis of high-throughput community sequencing data. Nat. Methods 2010, 7, 335–336. [Google Scholar] [CrossRef] [PubMed] [Green Version]
- Wang, Q.; Garrity, G.M.; Tiedje, J.M.; Cole, J.R. Naive Bayesian classifier for rapid assignment of rRNA sequences into the new bacterial taxonomy. Appl. Environ. Microbiol. 2007, 73, 5261–5267. [Google Scholar] [CrossRef] [PubMed] [Green Version]
- Chaganti, V.N.; Crohn, D.M.; Šimůnek, J. Leaching and reclamation of a biochar and compost amended saline–sodic soil with moderate SAR reclaimed water. Agric. Water Manag. 2015, 158, 255–265. [Google Scholar] [CrossRef] [Green Version]
- Yue, Y.; Guo, W.-N.; Lin, Q.-M.; Li, G.-T.; Zhao, X.-R. Improving salt leaching in a simulated saline soil column by three biochars derived from rice straw (Oryza sativa L.), sunfower straw (Helianthus annuus), and cow manure. J. Soil Water Conserv. 2016, 71, 467–475. [Google Scholar] [CrossRef]
- Sun, J.-N.; He, F.-H.; Shao, H.-B.; Zhang, Z.-H.; Xu, G. Effects of biochar application on Suaeda salsa growth and saline soil properties. Environ. Earth Sci. 2016, 75, 630. [Google Scholar] [CrossRef]
- Walker, D.J.; Bernal, M.P. The effects of olive mill waste compost and poultry manure on the availability and plant uptake of nutrients in a highly saline soil. Bioresour. Technol 2008, 99, 396–403. [Google Scholar] [CrossRef]
- Mavi, M.S.; Sanderman, J.; Chittleborough, D.J.; Cox, J.W.; Marschnera, P. Sorption of dissolved organic matter in salt-affected soils: Effect of salinity, sodicity and texture. Sci. Total Environ. 2012, 435, 337–344. [Google Scholar] [CrossRef]
- Rengasamy, P.; Olsson, K. Sodicity and soil structure. Aust. J. Soil Res. 1991, 29, 935–952. [Google Scholar] [CrossRef]
- Cha, J.Y.; Kang, S.H.; Ji, M.G.; Shin, G.I.; Jeong, S.Y.; Ahn, G.; Kim, M.G.; Jeon, J.R.; Kim, W.Y. Transcriptome changes reveal the molecular mechanisms of humic acid-induced salt stress tolerance in Arabidopsis. Molecules 2021, 26, 782. [Google Scholar] [CrossRef]
- Ghosh, U.; Thapa, R.; Desutter, T.; He, Y.-B.; Chatterjee, A. Saline-sodic soils: Potential sources of nitrous oxide and carbon dioxide emissions? Pedosphere 2017, 27, 65–75. [Google Scholar] [CrossRef]
- Mandal, S.; Thangarajan, R.; Bolan, N.S.; Sarkar, B.; Khan, N.; Ok, Y.S.; Naidu, R. Biochar-induced concomitant decrease in ammonia volatilization and increase in nitrogen use efficiency by wheat. Chemosphere 2016, 142, 120–127. [Google Scholar] [CrossRef] [PubMed]
- Sun, H.-J.; Lu, H.-Y.; Chu, L.; Shao, H.-B.; Shi, W.-M. Biochar applied with appropriate rates can reduce N leaching, keep N retention and not increase NH3 volatilization in a coastal saline soil. Sci. Total Environ. 2017, 575, 820–825. [Google Scholar] [CrossRef] [PubMed]
- Lin, X.-W.; Xie, Z.-B.; Zheng, J.-Y.; Liu, Q.; Bei, Q.-C.; Zhu, J.-G. Effects of biochar application on greenhouse gas emissions, carbon sequestration and crop growth in coastal saline soil. Eur. J. Soil Sci. 2015, 66, 329–338. [Google Scholar] [CrossRef]
- Rath, K.M.; Rousk, J. Salt effects on the soil microbial decomposer community and their role in organic carbon cycling: A review. Soil Biol. Biochem. 2015, 8, 108–123. [Google Scholar] [CrossRef]
- Yan, N.; Marschner, P.; Cao, W.; Zuo, C.; Qin, W. Influence of salinity and water content on soil microorganisms. Int. Soil Water Conserv. Res. 2015, 3, 316–323. [Google Scholar] [CrossRef] [Green Version]
- Sun, K.; Han, L.; Yang, Y.; Xia, X.; Yang, Z.; Wu, F.; Li, F.; Feng, Y.; Xing, B. Application of hydrochar altered soil micro-bial community composition and the molecular structure of native soil organic carbon in a paddy soil. Environ. Sci. Technol. 2020, 54, 2715–2725. [Google Scholar] [CrossRef]
- Zelles, L. Fatty acid patterns of phospholipids and lipopolysaccharides in the charact erization of microbial communities in soil: A review. Biol. Fertil. Soils 1999, 29, 111–129. [Google Scholar] [CrossRef]
- Wang, Y.; Sun, C.-C.; Zhou, J.-H.; Wang, T.-T.; Zheng, J.-Y. Effects of biochar addition on soil bacterial community in semi-arid region. China Environ. Sci. 2019, 39, 2170–2179. [Google Scholar]
- Liu, S.-N.; Meng, J.; Jiang, L.-L.; Yang, X.; Lan, Y.; Cheng, X.-Y.; Chen, W.-F. Rice husk biochar impacts soil phosphorous availability, phosphatase activities and bacterial community characteristics in three different soil types. Appl. Soil Ecol. 2017, 116, 12–22. [Google Scholar] [CrossRef]
- Wang, C.; Liu, S.Y.; Zhang, Y.; Liu, B.-Y.; He, F.; Xu, D.; Zhou, Q.-H.; Wu, Z.-B. Bacterial communities and their predicted functions explain the sediment nitrogen changes along with submerged macrophyte restoration. Microb. Ecol. 2018, 76, 625–636. [Google Scholar] [CrossRef]
- Jenkins, S.N.; Rushton, S.P.; Lanyon, C.V.; Whiteley, A.S.; Waite, I.S.; Brookes, P.C.; Kemmitt, S.; Evershed, R.P.; O’Donnell, A.G. Taxon-specific responses of soil bacteria to the addition of low level C inputs. Soil Biol. Biochem. 2010, 42, 1624–1631. [Google Scholar] [CrossRef]
- Wang, Y.; Gu, J. Effects of allylthiourea, salinity, and pH on ammonia/ammonium-oxidizing prokaryotes in mangrove sediment incubated in laboratory microcosms. Appl. Microbiol. Biotechnol. 2014, 98, 3257–3274. [Google Scholar] [CrossRef] [PubMed]
- Zhang, J.-H.; Bai, Z.-G.; Huang, J.; Hussain, S.; Zhao, F.-T.; Zhu, C.-Q.; Zhu, L.-F.; Cao, X.-C.; Jin, Q.-Y. Biochar alleviated the salt stress of induced saline paddy soil and improved the biochemical characteristics of rice seedlings differing in salt tolerance. Soil Tillage Res. 2019, 195, 104372. [Google Scholar] [CrossRef]

Publisher’s Note: MDPI stays neutral with regard to jurisdictional claims in published maps and institutional affiliations. |
© 2022 by the authors. Licensee MDPI, Basel, Switzerland. This article is an open access article distributed under the terms and conditions of the Creative Commons Attribution (CC BY) license (https://creativecommons.org/licenses/by/4.0/).