Article

The Combined Application of Mineral Fertilizer and Organic Amendments Improved the Stability of Soil Water-Stable Aggregates and C and N Accumulation

1
College of Environmental Science and Engineering, Yangzhou University, Yangzhou 225127, China
2
School of Mines, Inner Mongolia University of Technology, Hohhot 010051, China
3
Mountain Tai Forest Ecosystem Research Station of State Forestry Administration, College of Forestry, Shandong Agricultural University, Tai’an 271018, China
4
Ministry of Agriculture and Rural Affairs Key Laboratory of Cultivated Land Quality Monitoring and Evaluation, Institute of Agricultural Resources and Regional Planning, Chinese Academy of Agricultural Sciences, Beijing 100081, China
*
Authors to whom correspondence should be addressed.
Agronomy 2022, 12(2), 469; https://doi.org/10.3390/agronomy12020469
Submission received: 24 December 2021 / Revised: 7 February 2022 / Accepted: 7 February 2022 / Published: 14 February 2022
(This article belongs to the Special Issue Applied Research and Extension in Agronomic Soil Fertility)

Abstract

:
Soil aggregate stability is one of the important physical properties affecting rice (Oryza sativa L.) production and soil sustainability. This study was undertaken to evaluate the influence of different medium-term fertilization regimes on soil aggregate stability and aggregate-associated carbon (C) and nitrogen (N) in rhizosphere and bulk soil. This experiment consisted of three treatments, including mineral fertilizer alone (NPK), mineral fertilizer plus rice straw (NPK + RS), and controlled-release blended fertilizer plus cattle manure (CRF + CM). Although higher fertilizer costs were in the CRF + CM treatments, one-time application could save labor costs compared to the conventional split application of chemical fertilizers. The results showed that, compared to the NPK alone, the combined application of NPK with organic amendments improved the proportion of >0.25 mm macroaggregate, soil organic carbon (SOC), total nitrogen (TN) concentrations, and mean weight diameter (MWD) in both rhizosphere and bulk soil during the whole rice growing season. In rhizosphere, the proportion of macroaggregate was significantly positively (p < 0.01) correlated with root biomass while it had no significant correlation with SOC in the proportion of all sizes of aggregates. By contrast, bulk soil had a significantly (p < 0.01) positive relationship between the proportion of >2 mm class and organic C associated with smaller particle-sized aggregates (0.25–2 mm and <0.25 mm). In addition, the organic C associated with 0.25–2 mm showed the largest contribution of the total SOC content in all treatments during the rice growing stage. Overall, the results suggested that the medium-term application of mineral fertilizer with organic amendments was beneficial to improve soil aggregate stability and C and N accumulation.

1. Introduction

Soil aggregate stability is an important indicator of soil quality since it influences soil water-holding capacity, biological activity, root penetration, and plant growth [1,2]. Various mechanisms have been proposed to account for soil aggregation process. Tisdall et al. (1982) suggested that primary particles are bound into microaggregates (20–250 μm diameter), which, in turn, are bound to larger aggregates (>250 μm diameter). Organic matter is the major binding agent which affects aggregate stabilization at different levels. The organic binding agent can be classified into three main groups on the basis of age and degradation of the organic matter: (1) transient (mainly polysaccharides); (2) temporary (roots and hyphae); and (3) persistent (humic materials associated with aluminum and amorphous iron) [3,4]. The persistent organic binding agents play a key role in the forming of <0.25 mm microaggregate, while physical enmeshment by roots is regarded as a major mechanism involved in the binding of microaggregates into >0.25 mm macroaggregates [5]. Therefore, soil adjacent to roots might have different physical properties with those of bulk soil [6]. Whalley et al. (2005) used image analysis and found that bulk soil contained larger numbers of small- and medium-sized pores than the rhizosphere for wheat and maize [7].
Fertilization not only affects plant growth but also changes the soil organic matter (SOM) content, thereby influencing the formation and stability of soil aggregates. Tripathi et al. (2014) observed that farmyard manure application for 41 years had a higher mean weight diameter (MWD) than mineral fertilizer alone in tropical rice–rice systems [8]. However, Barbosa et al. (2015) showed that applying swine manure immediately increased the dispersible clay content and reduced soil aggregation for corn production due to the increased concentrations of carboxylic groups [9]. Soon et al. (2012) found that straw retained on the surface had no effect on soil aggregation in a cold semi-arid region in a barley (Hordeum vulgare L.), field pea (Pisum sativa L.), wheat (Triticum aestivum L.), and canola (Brassica napus L.) crop rotation [10]. The inconsistent research reports showed that the effects of organic manure application on soil aggregate stability are still inconclusive. Moreover, most researches only compared the aggregate stability under different fertilization managements at a certain time [11,12]. Few studies quantitatively considered the effects of different fertilization regimes and rice growth stages on soil aggregates and its carbon (C) dynamics in rhizosphere and bulk soil [13].
Therefore, the objectives of this study were to determine the influence of three different fertilization regimes on soil aggregate and soil organic C (SOC) and total nitrogen (TN) dynamics of rice rhizosphere and bulk soil within one rice-growing season. We hypothesized that the combined application of mineral fertilizer and organic amendments increased the MWD in both rhizosphere and bulk soil as well as the aggregate-associated C and TN content. The single basal application of controlled-release blended fertilizer plus cattle manure will be economically attractive as it can save labor costs.

2. Materials and Methods

2.1. Field Site Description

The medium-term experiment was located at the Xinzhu country (29 °C 01′10″ N, 119 °C 28′10″ E and 80 m above mean sea level), Jinhua city, Zhejiang province, China. The prevailing climate of the experimental location is a subtropical monsoon climate with four distinct seasons. The mean annual temperature is 17.5 °C and the mean annual rainfall is 1424 mm. The soil at the experimental site belongs to yellow clayey paddy soil. The mean aggregate size distribution (per 100 g) was 37 g of sand, 35 g of silt, and 28 g of clay.

2.2. Experimental Layout and Sampling

The selected experimental area is flat and uniform in soil fertility. The experiment was initiated in 2011 and conducted during eight consecutive double rice cropping cycles. It included three treatments with three replicates. Each plot size was 5 m wide and 6 m long. Treatments were: (1) inorganic N–P–K fertilizers application alone (NPK); (2) the NPK fertilizers plus rice straw at 3 Mg ha–1 per rice-growing season (NPK + RS); and (3) controlled-release blended fertilizer plus cattle manure at 4.7 Mg ha–1 per rice-growing season (CRF + CM). Before imposing experimental treatments, the soil contained 28.1 g kg–1 of soil organic matter, 1.75 g kg–1 of total N, 117 mg kg–1 of alkali-hydrolyzable N, 11.6 mg kg–1 of available P, 78 mg kg–1 of available K, and the pH was 5.24 (soil to water ratio, 1:2.5).
Common urea, superphosphate, and potassium chloride were the sources of N, P, and K, respectively. Controlled-release blended fertilizer (CRF, N–P–K, 24–12–12) was provided by Kingenta Ecological Engineering Group Co., Ltd., Shandong, China. All three treatments received the same rates of inorganic nutrients (180 kg of N, 90 kg of P2O5, and 120 kg of K2O per hectare) in each rice-growing season. For the NPK alone and NPK + RS treatments, the complete doses of P and K chemical fertilizers were applied as a basal dressing. Nitrogen fertilizer was applied as split applications at ratios of 40%:30%:30% (basal: tillering: booting) for the early rice, and at a ratio of 40%:60% (basal: tillering) for the late rice. The topdressing N fertilizers in the NPK and NPK + RS treatments were applied manually. For the CRF + CM treatment, CRF was applied as a single basal application. Rice straw and cattle manure were applied on the soil surface once before rice transplanting. On average, rice straw contained 44% C, 0.9% N, 0.1% P, and 2% K on a dry weight basis. Rice straw was applied as an uncrushed straw. Cattle manure contained 29% C, 2% N, 1% P, and 1.2% K on a dry weight basis.
Tillage operations for each plot include deep plough at the depth of 22–25 cm in April and shallow plough at the depth of 10–15 cm in late-July before transplanting every year. The double cropping rice cycle means that two crops of rice are grown each year. Early rice was transplanted in late-April and harvested in late-July. When the early rice is harvested, the late rice is transplanted. The growth period of late rice is from late-July to early-November. After the late rice harvest, no other crops are planted. The fallow season is from mid-November to the April of the following year.
Early rice variety was “Jinzao 09” and the late rice variety was “Yueyou 9113”. Rice seedlings were transplanted at four plants per hill in a planting pattern of 16.5 cm × 19.8 cm for early rice, and two plants per hill in a planting pattern of 19.8 cm × 19.8 cm for late rice each year. The different planting densities of both rice varieties are mainly based on the cultivation habits of local farmers.
Soil samples from each plot were taken at three stages: the tillering stage (19 May 2018), the jointing stage (10 June 2018), and after the rice harvest (25 July 2018). Specific soil sampling methods are as follows. Ten whole plants with their roots were randomly selected and extracted from soil in each plot. Then, after gentle shaking off the loosely adherent soil, the tightly adherent soil was carefully collected regarded here as rhizosphere soil. The unvegetated soil (0–20 cm) adjacent to the rice plants was sampled as bulk soil [14]. Ten soil cores (diameter 5 cm) from each plot were mixed to form a composite soil sample. Thus, in total, 54 composite soil samples were collected (3 treatments × 2 soil fractions × 3 replicates × 3 rice growth stages). The samples were placed in hard plastic boxes (180 mm × 120 mm × 70 mm) and immediately transported to the laboratory. After removing residual roots, soil samples were passed through the 8.0 mm sieve and stored at 4 °C before analysis.

2.3. Soil Aggregate Fractionation and Chemical Analysis

Soil samples were physically fractionated into different classes of aggregates by wet sieving [15] following the method described by Wang et al. (2015) [16]. In wet sieving, 100 g of <8 mm soil sample was immersed in water on top of a stack of sieves (5–, 2– and 0.25 mm). The stack was moved up and down by 3 cm, 30 times per minute for 30 min. Soil aggregate fractions remaining on the sieves were oven-dried at 50 °C, and were then weighed and stored at room temperature for C and N analyses. The ratio of aggregate mass on each sieve to the total soil mass was calculated.
The mean weight diameter (MWD) was calculated by the following equations [17]:
MWD = i = 1 n XiWi
where Xi is the mean diameter of each size fraction, Wi is the weight of aggregate in the size range as a fraction of the total analyzed sample weight, and n is the number of the sieves.
Total soil organic carbon (TOC) and total N concentrations were analyzed by the dry combustion method using a Vario MACRO C/N elemental analyzer (Elementar Co., Hanau, Germany) [18].

2.4. Cost Analysis

The cost of agricultural production mainly included seeds, pesticides, fertilizers, and labor forces. Labor cost depended on the working hours, including sowing, irrigation, fertilization, pesticide spraying, and harvesting. In this study, the main differences in the cost of agricultural production among three fertilization managements were the fertilizer inputs and the labor cost for topdressing the N fertilizer. The differences in agricultural inputs under three different fertilization managements are shown in Table S1.

2.5. Statistical Analysis

All data were assessed for normal distribution and homogeneity of variance before the analysis. One-way analysis of variance (ANOVA) was used in STATISTICA (Version 12.0, 2012, StaSoft Inc., Tulsa, OK, USA) to evaluate the differences in percentage of soil aggregate size as well as the C and N content in each size of soil aggregate. The significant differences were compared using the Duncan multiple range test at the 0.05 level of probability. Pearson’s correlations were used to evaluate the relationships between the soil aggregate composition and SOC concentration.

3. Results

3.1. Size Distribution of Soil Aggregates

The largest proportion of soil aggregates was the 0.25–2 mm class, followed by <0.25 mm and >2 mm classes for all fertilization treatments and rice growth stages in both rhizosphere and bulk soil (Table 1). Compared to the NPK alone, NPK + RS and CRF + CM treatments significantly increased the proportion of >2 mm class while they decreased the proportion of <0.25 mm aggregates during the whole rice growth season regardless of rhizosphere and bulk soil (p < 0.05, Table 1).

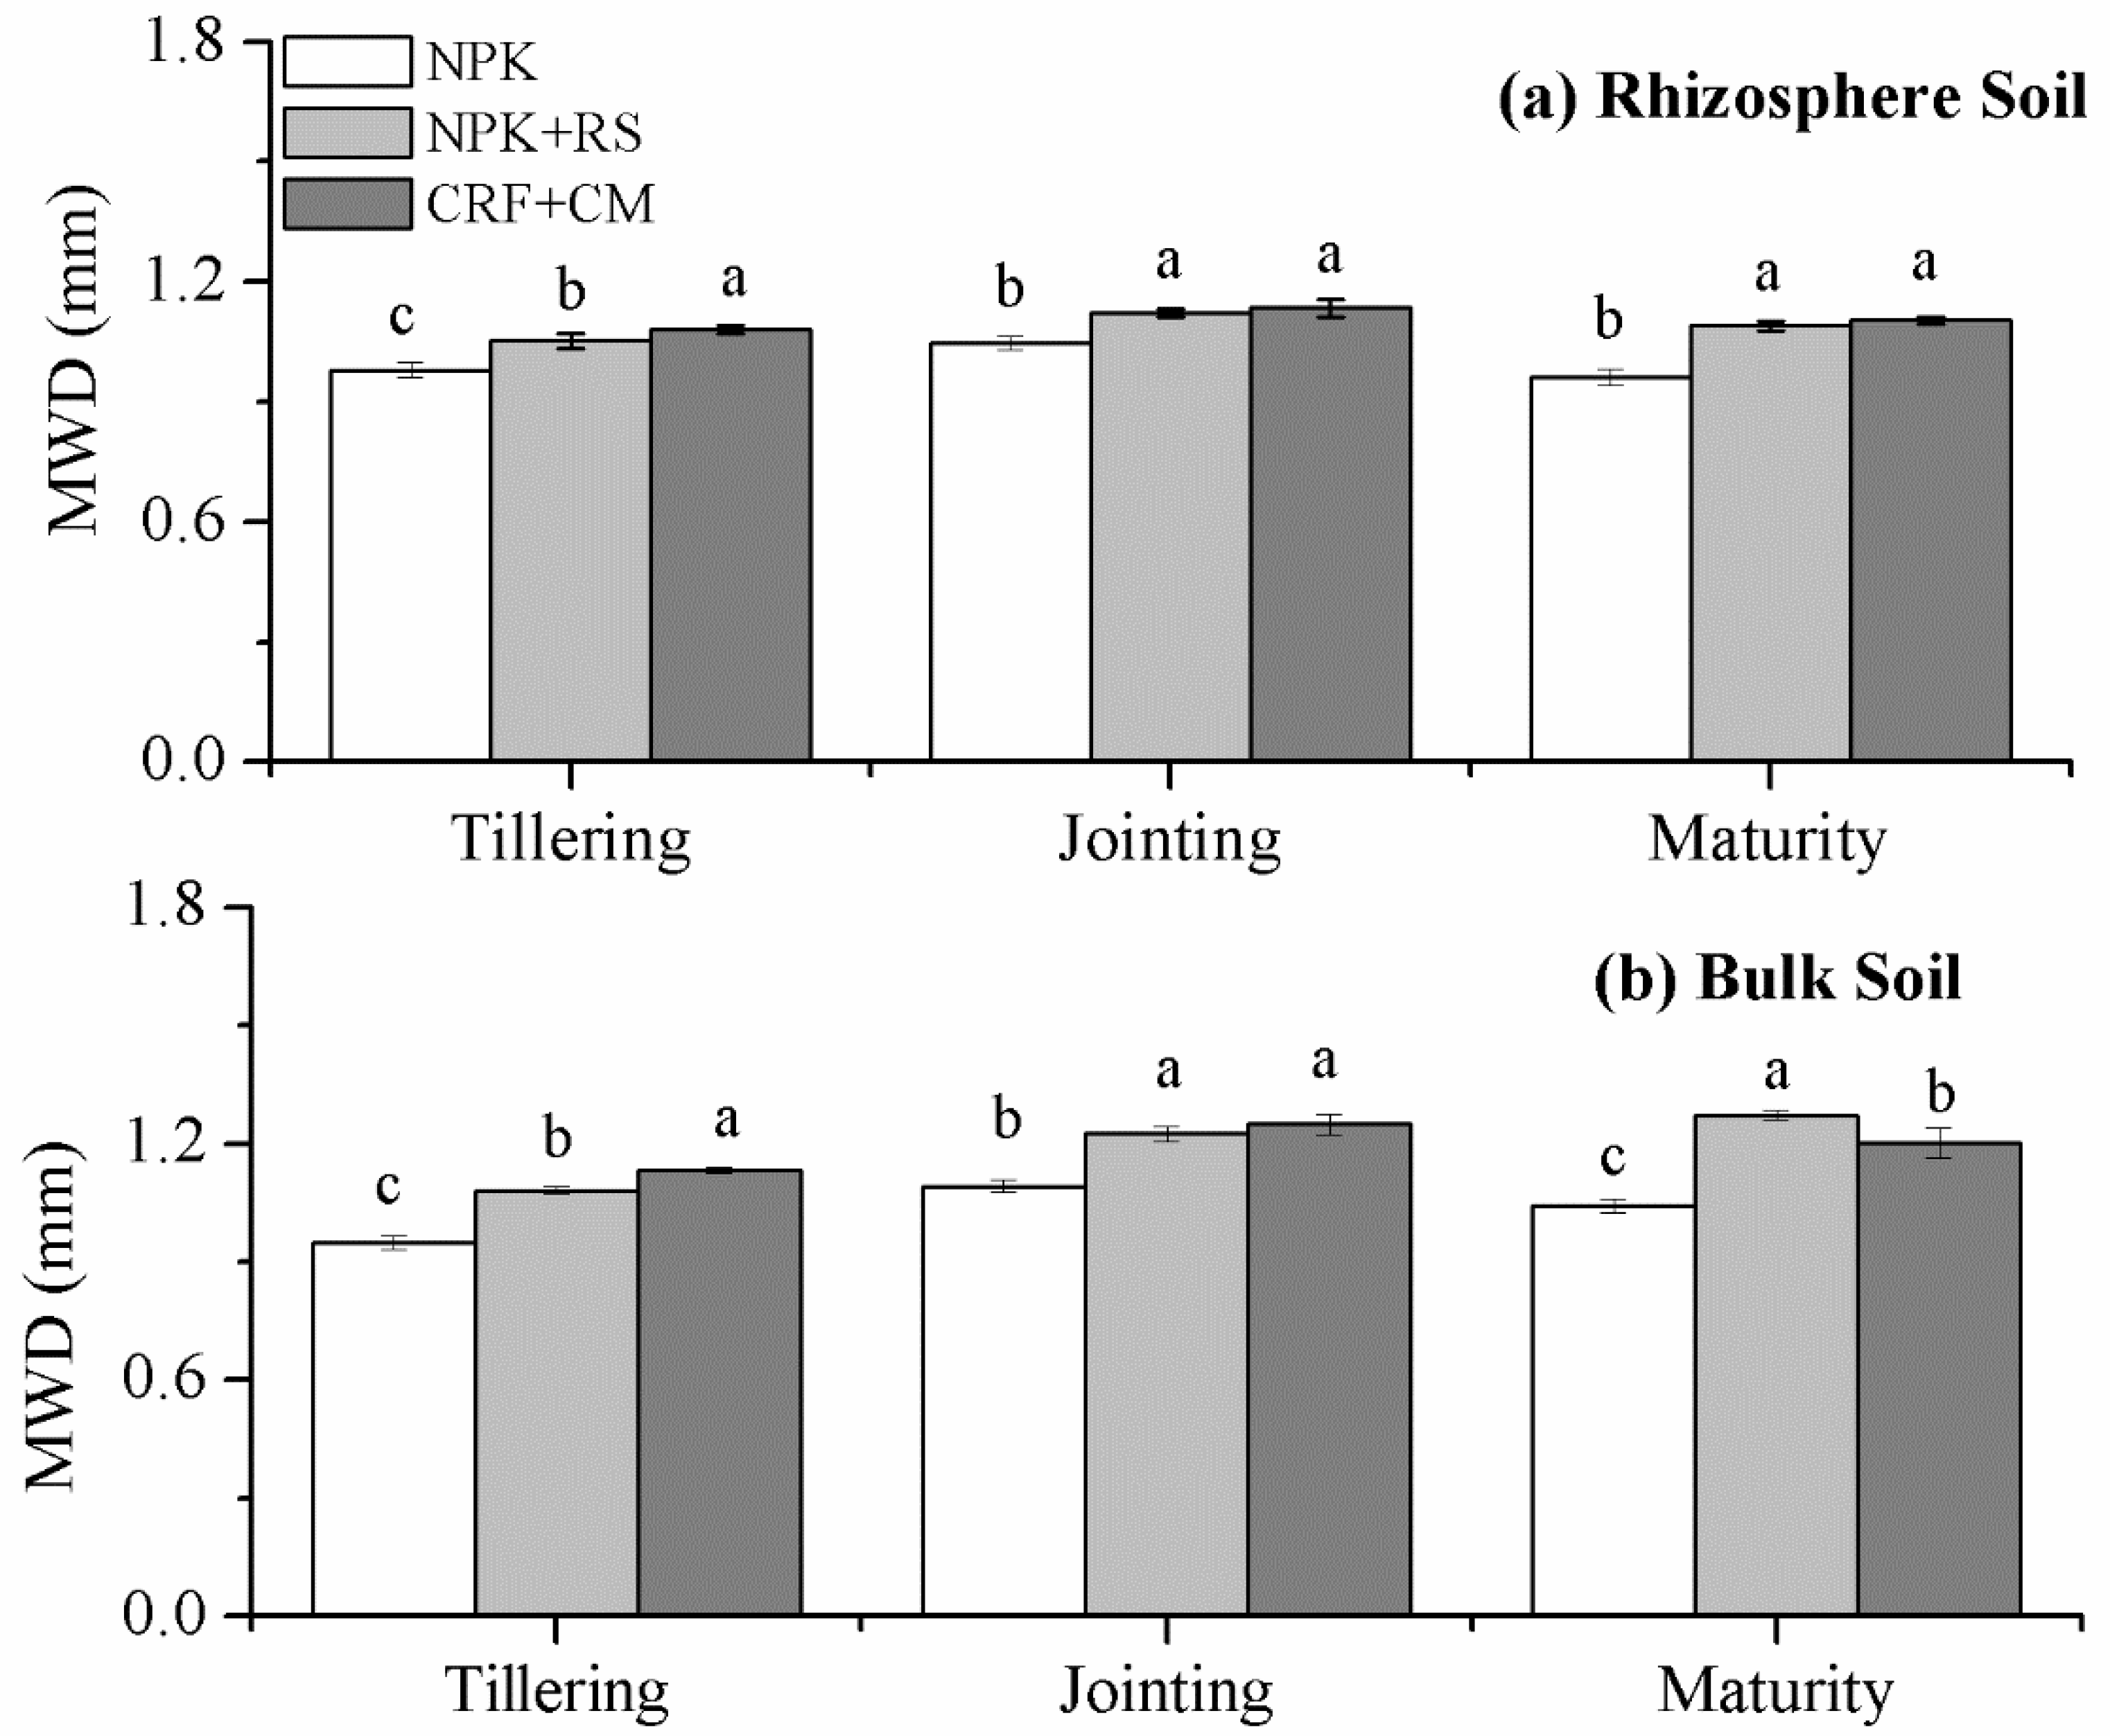
3.2. Mean Weight Diameter (MWD)

Among the three fertilization treatments, the NPK + RS and CRF + CM treatments showed significantly higher MWD values than in the NPK alone treatment during the whole rice growing season, regardless of the rhizosphere and bulk soil (p < 0.05, Figure 1). In addition, the CRF + CM treatment showed the most profound positive effect on the MWD value (1.08 mm in rhizosphere soil and 1.13 mm in bulk soil) at the rice tillering stage, indicating that the promotion effect of cattle manure on soil aggregation was greater than that of rice straw (Figure 1).

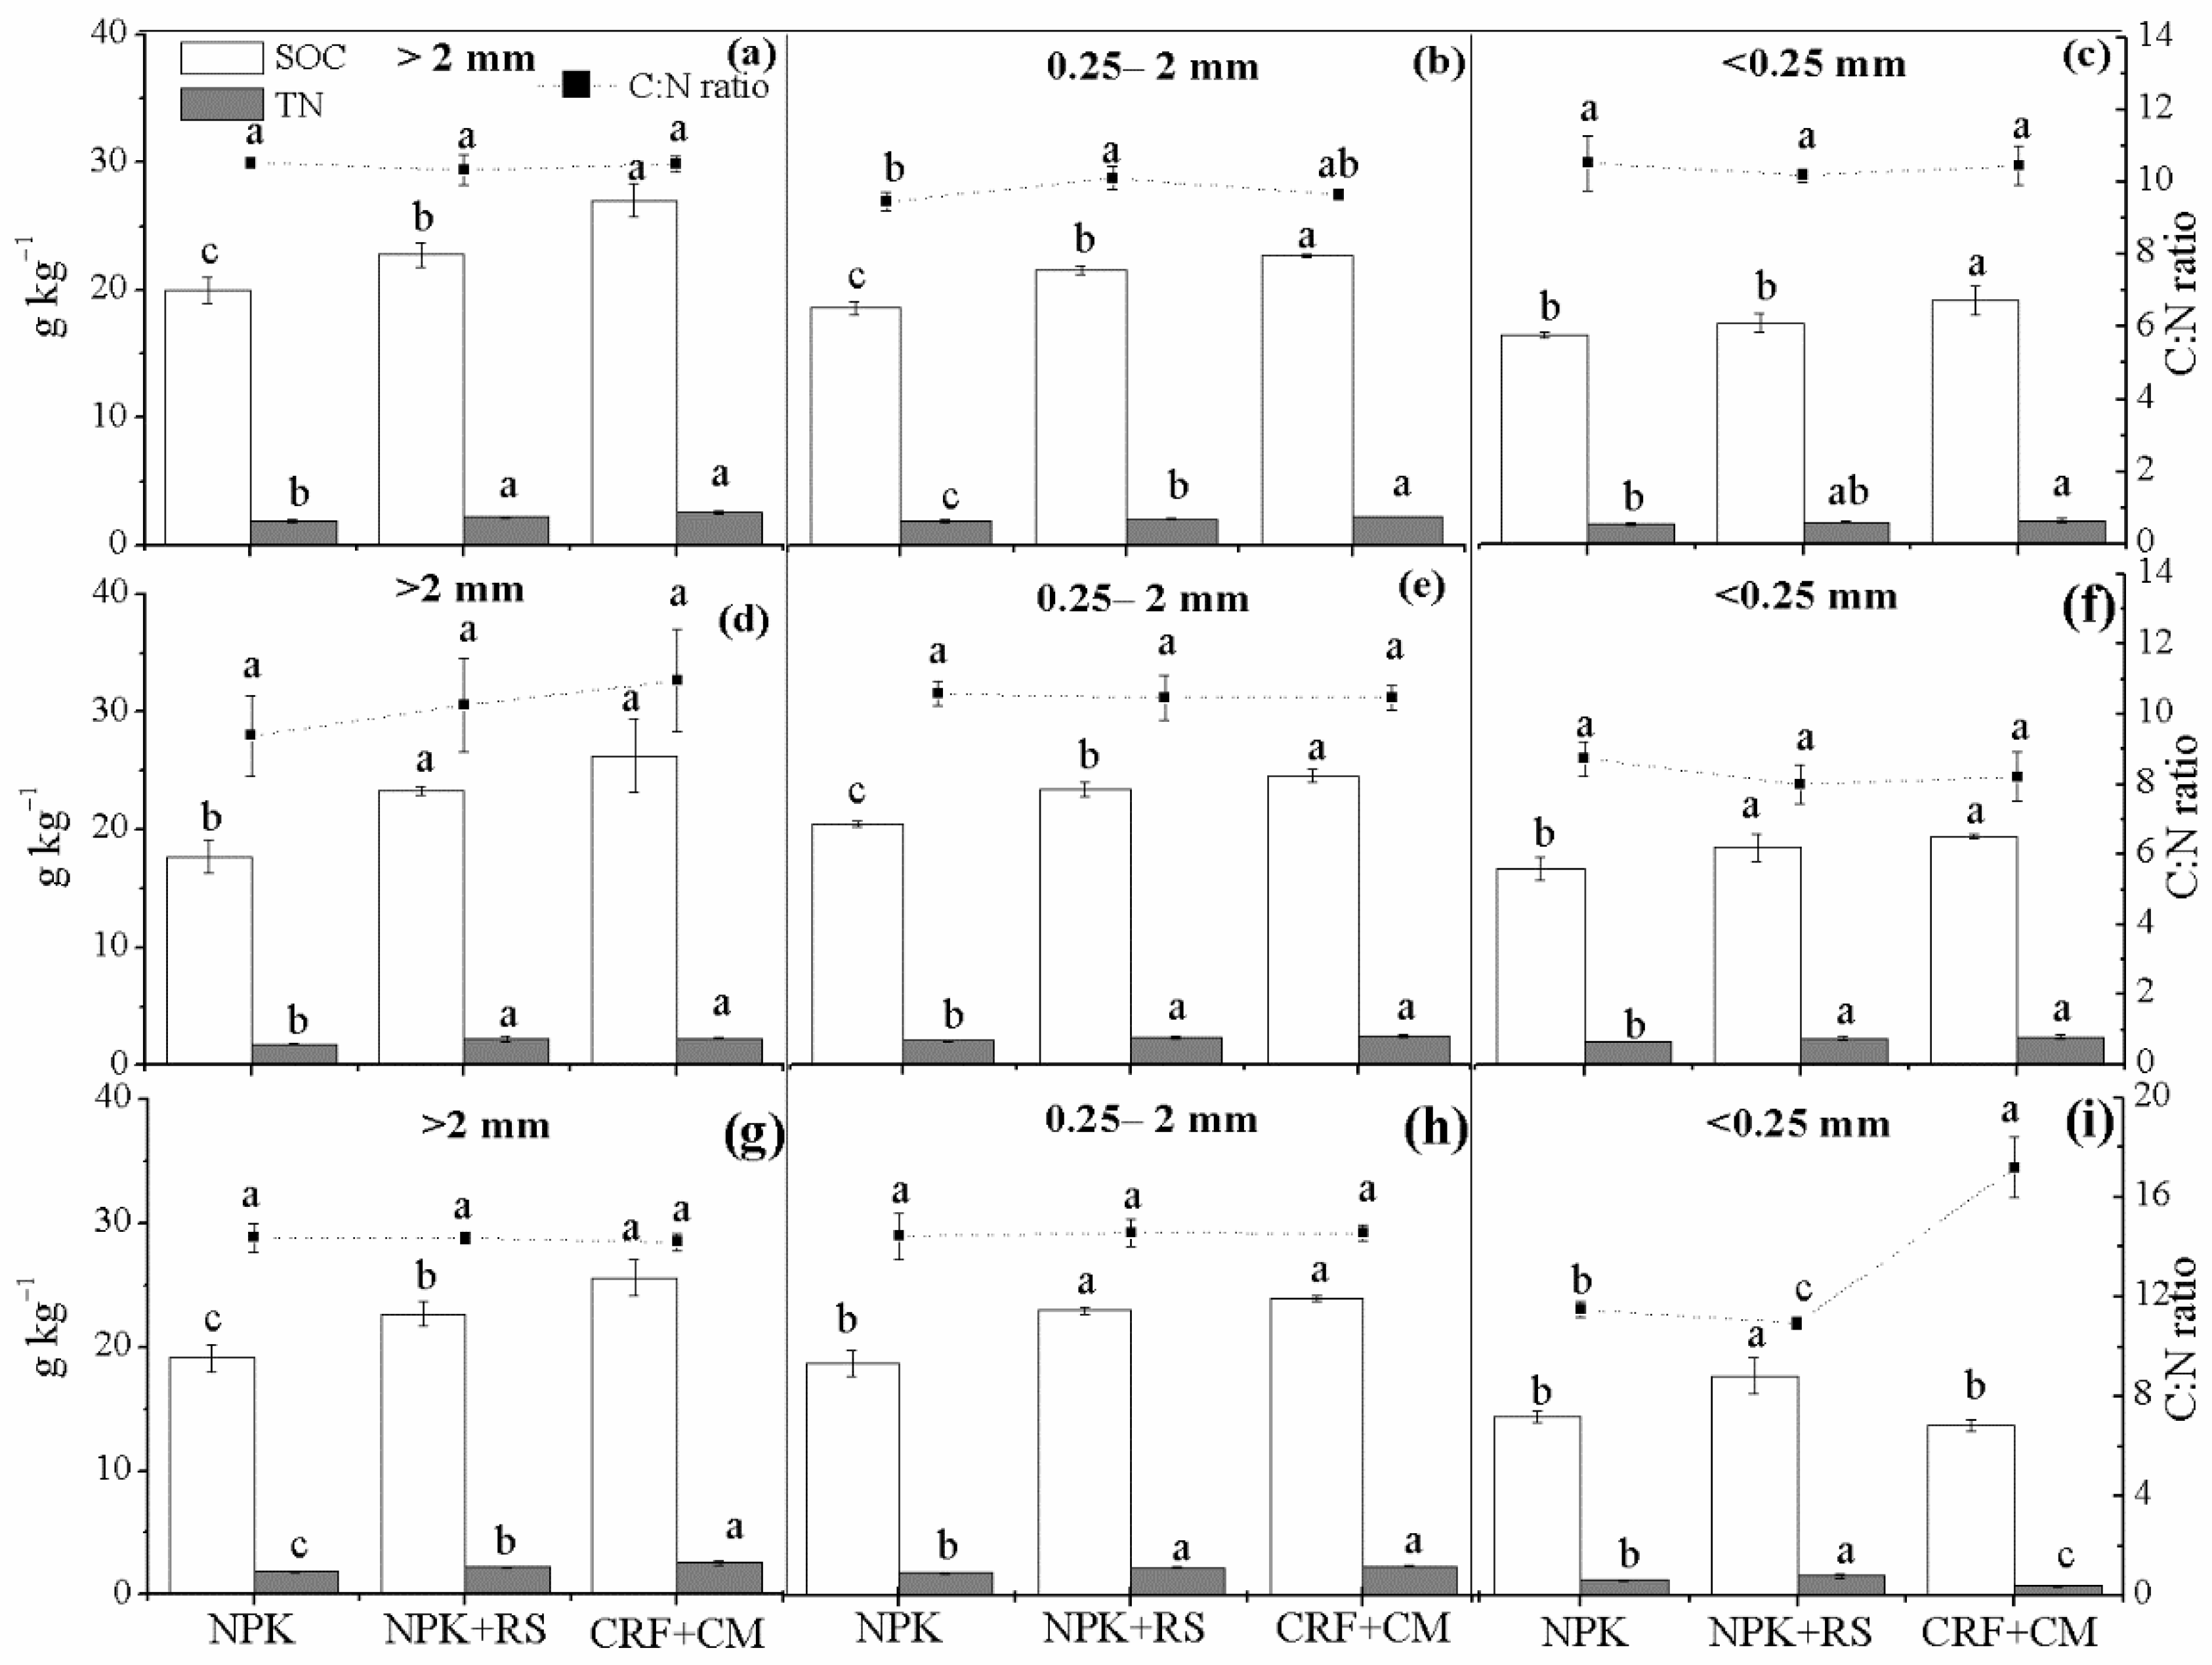
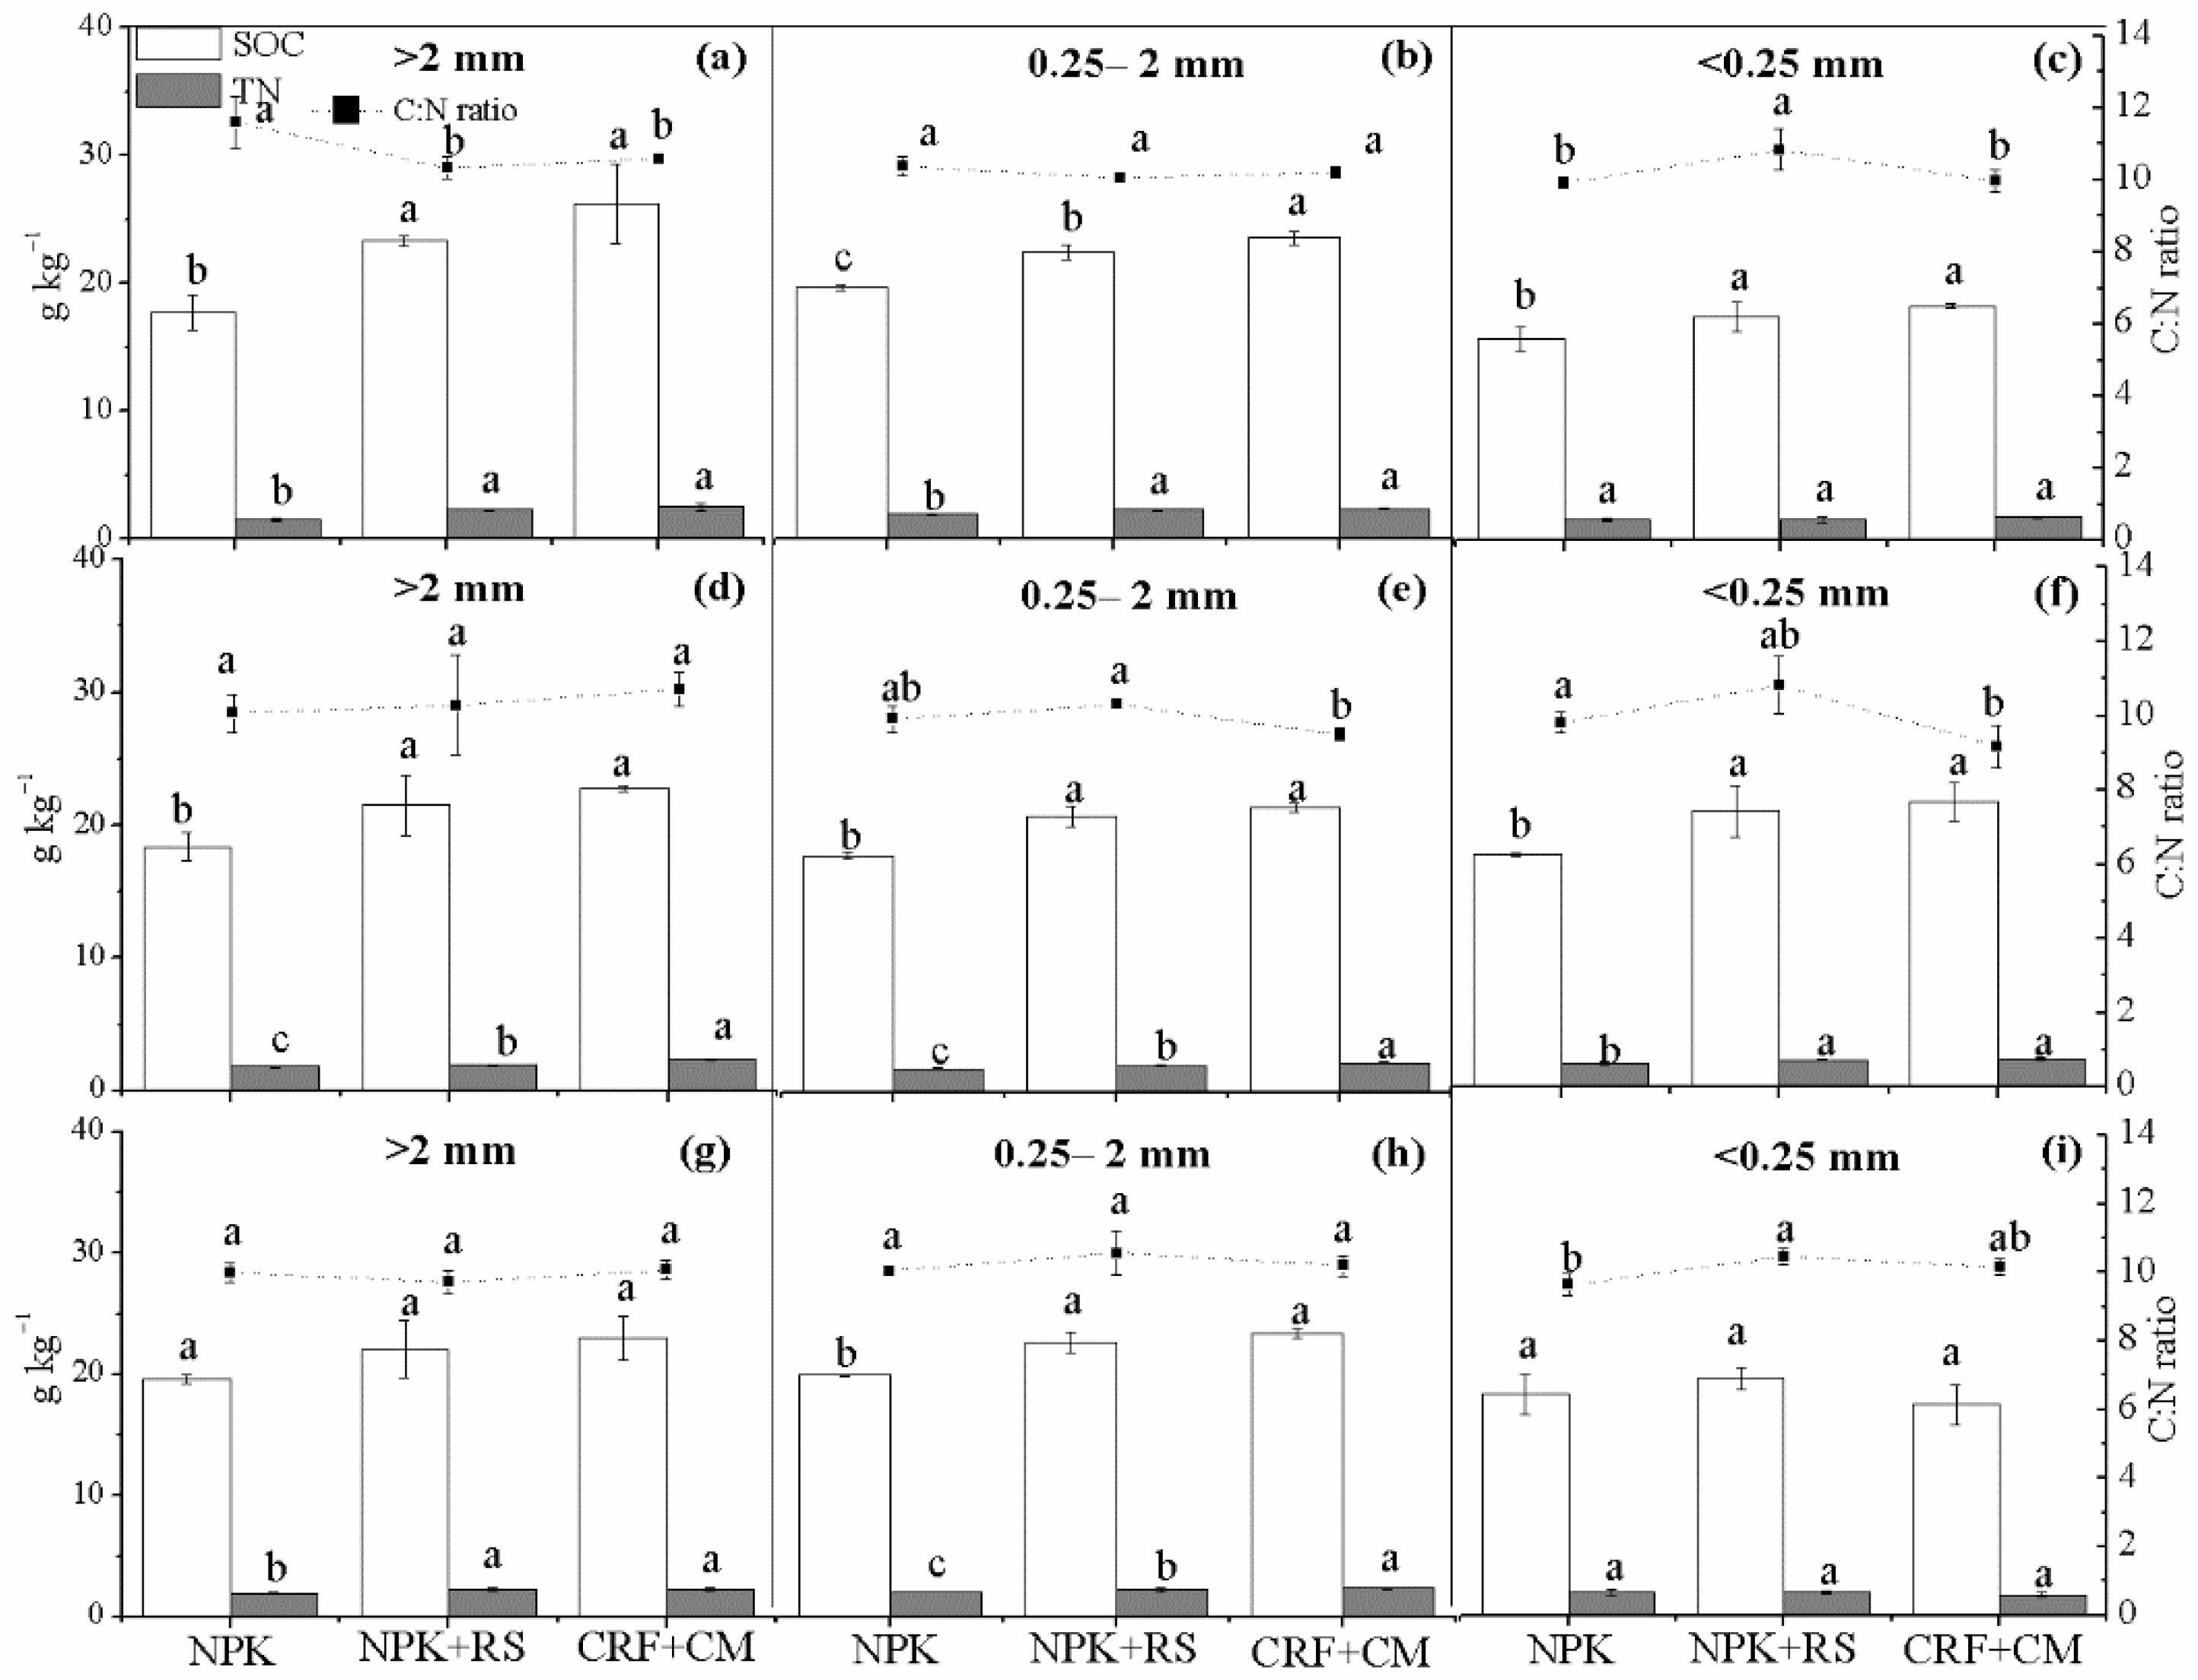
3.3. Soil Organic Carbon (SOC) and Total Nitrogen (TN) Concentrations in Aggregates

Compared to the NPK alone treatment, the CRF + CM treatment significantly increased the SOC concentrations, except for the <0.25 mm aggregate at maturity in both rhizosphere and bulk soil (Figure 2 and Figure 3). A similar result was also observed for TN. However, there were no obvious differences in the C:N value between CRF + CM and NPK alone treatments in most aggregate sizes at the three rice growth stages (Figure 2 and Figure 3).
The organic C associated with 0.25–2 mm showed the largest contribution of the total SOC content, indicating that the majority of SOC was present in the 0.25–2 mm class (Table 2). Furthermore, fertilization altered the aggregate-associated C mass distribution. The organic C associated with macroaggregate (>2 mm and 0.25–2 mm) ranged between 73.6% and 83.9% for NPK plus organic amendments, which was greater than in NPK alone treatment (67.8–71%). Correspondingly, the percentage of organic C associated with <0.25 mm was significantly higher in NPK alone than that in the other combinations of NPK and manure treatments (Table 2).

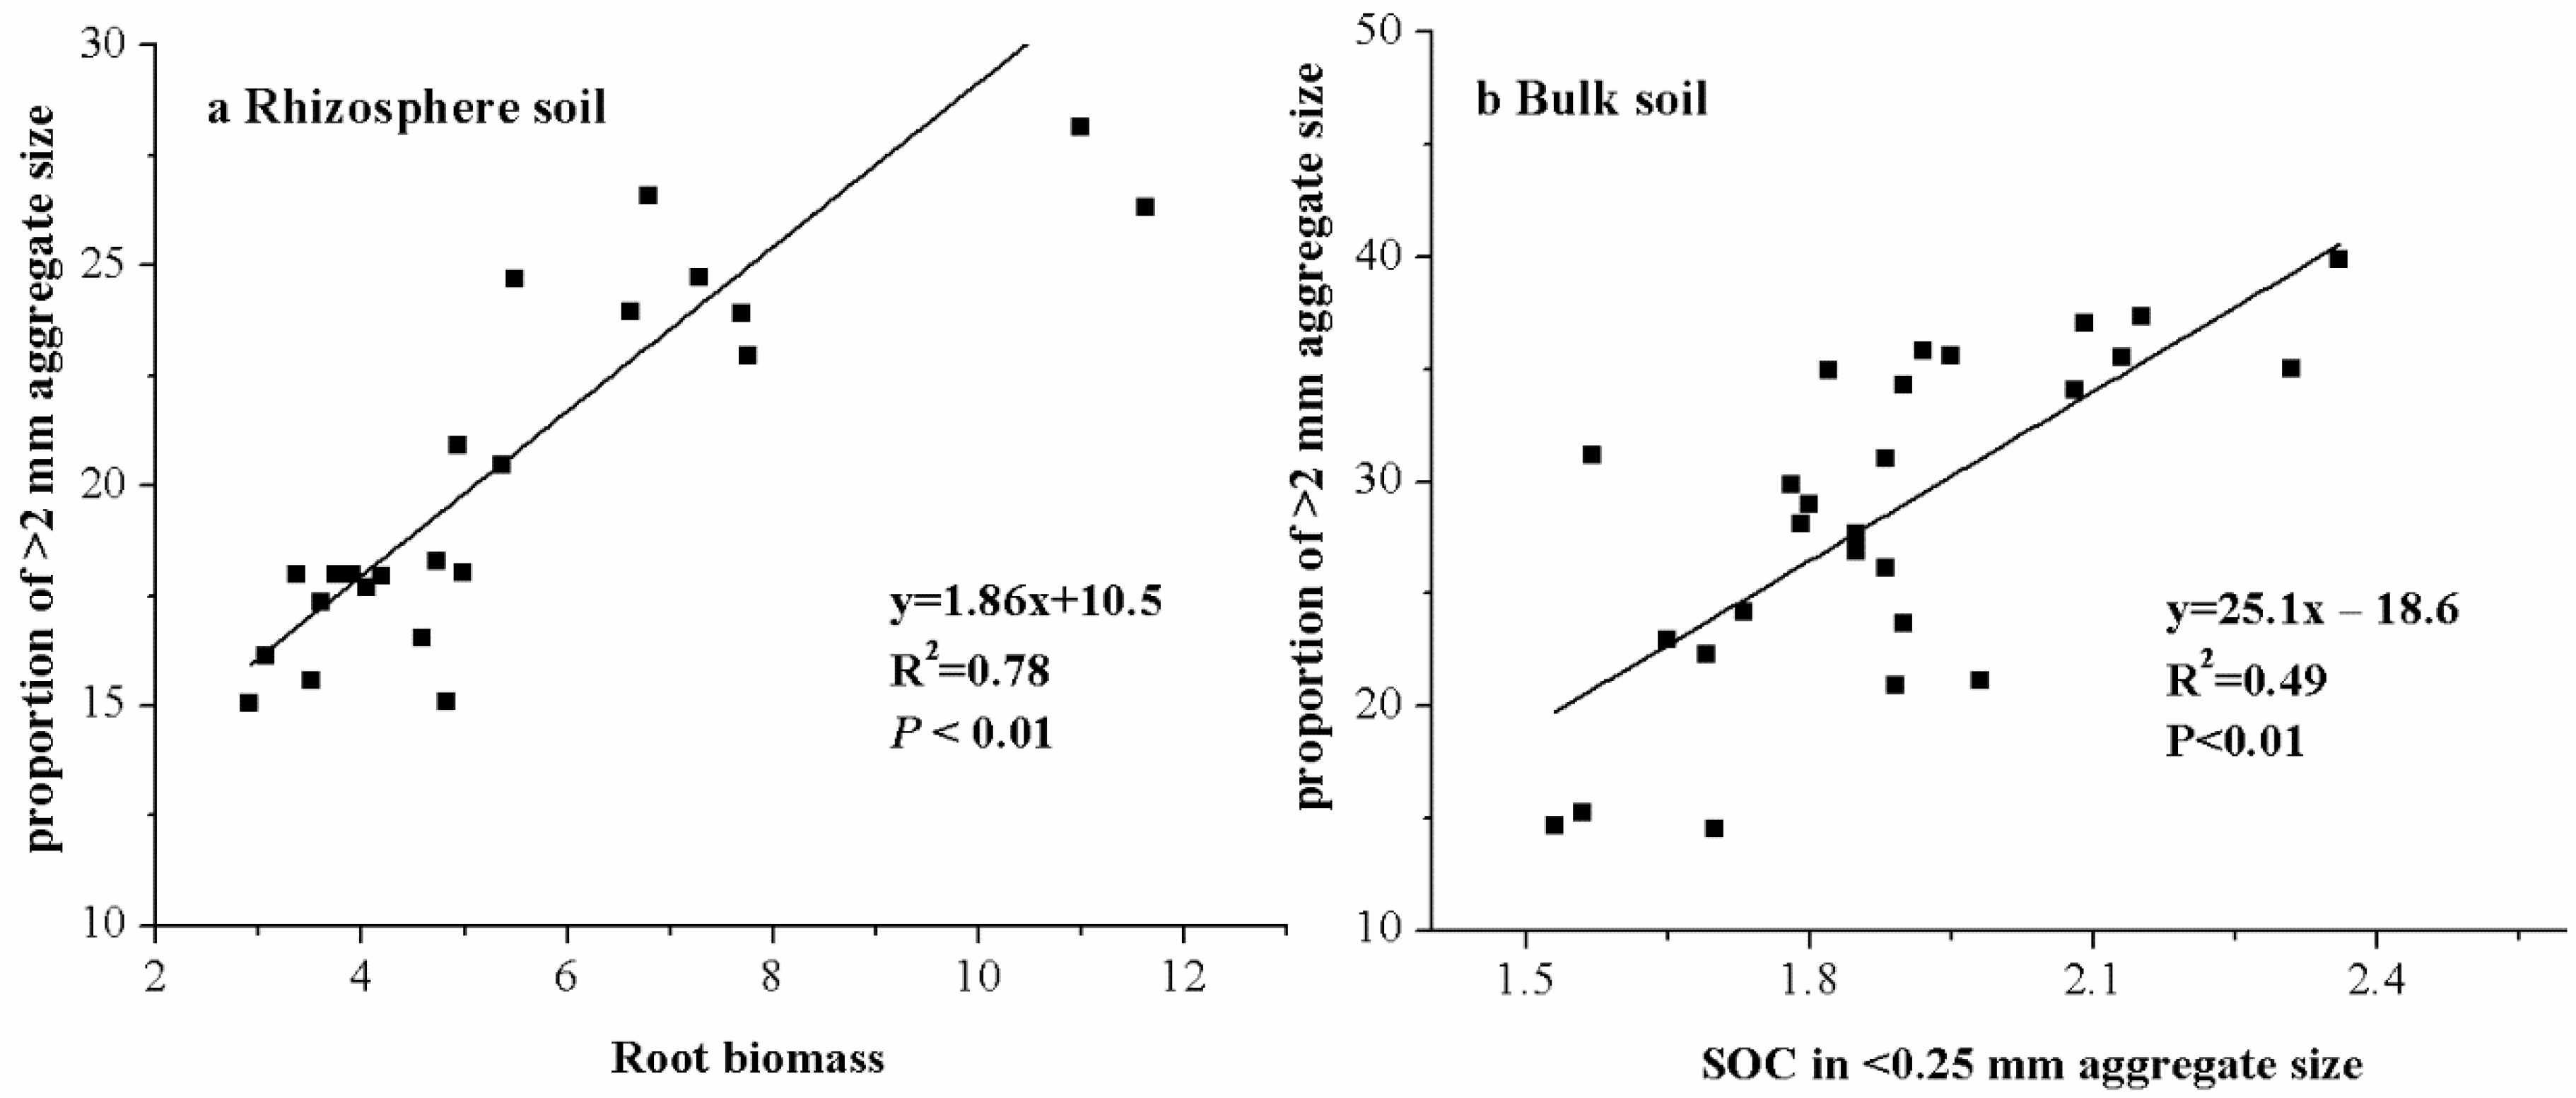
3.4. Relationship between Aggregate Size Fractions, Aggregate Stability, and Soil Properties

The relationships between aggregate size fractions and aggregate-associated C concentrations were the main differences in rhizosphere and bulk soil (Table 3). For instance, the bulk soil had a significantly (p < 0.01) positive relationship between the proportion of the >2 mm class and organic C associated with smaller particle-sized aggregates (0.25–2 mm and <0.25 mm) while the rhizosphere had not (Table 3). By contrast, there was a strong positive correlation between root biomass and the proportion of >2 mm aggregate size (y = 1.86x + 10.5, R2 = 0.78, p < 0.01), indicating that a large root system was an important factor contribution to macroaggregate formation (Table 3; Figure 4).

4. Discussion

Our studies also showed that medium-term application of mineral fertilizer combined with organic manures increased the proportion of macroaggregate (>0.25 mm) in both the rhizosphere and bulk soil (Table 1), which were similar to our previous results obtained on dry sieves [19]. However, the mechanism of macroaggregate forming in rhizosphere and bulk soil might be different. In bulk soil, the proportion of >2 mm aggregates had significantly positive correlations with SOC in smaller size aggregates (Table 3; Figure 4), which was similar with the result of Regelink et al. (2015), who reported that SOC content was correlated positively with water-stable aggregates (>0.25 mm) [20]. Calabi-Floody et al. (2011) suggested that organic matter is a complex mixture of many organic substances, including polysaccharides, lignin, proteins, humic substances, and poorly soluble aliphatic compounds [21]. Numerous properties of organic substances enabled organic matter to influence soil aggregation through different mechanisms. Hence, larger proportions of macroaggregate in a combined mineral fertilizer with organic amendment treatments were possibly attributed to the addition of organics promoted formation of macroaggregates through binding of smaller aggregates.
By contrast, there were no correlations between the proportion of >2 mm aggregate and organic C contents in all size aggregates in rhizosphere (Table 3). Our observation was similar with Haynes et al. (1991), who exhibited that changes in stability of soil aggregate occurred rapidly under different management practices before any changes in the total SOC content were detected [22]. Jastrow et al. (1996) also suggested that SOC seems to be more of a response rather than a mechanism that drives aggregation [23]. Hence, another possible explanation is that the rhizosphere soil aggregate size distribution is more influenced by the root system. Jastrow et al. (1998) suggested that roots served as a framework for the formation of macroaggregate. In this study, a higher root biomass was observed in the mineral fertilizer with organic amendment treatments (Figure S1), which may have a stronger physical entanglement of soil particles [4]. Moreover, larger rice root biomass produced more secretions that contribute to the soil aggregation process in rhizosphere soil. On the other hand, root exudates could be rapidly assimilated by root-associated microbes, and this process may improve soil quality [24,25,26]. For example, root polysaccharides induced Bacillus subtilis which produced biofilm matrix in the rhizosphere soil, promoting the formation of soil aggregates and retained soil moisture [27].
In general, 8 years of rice growth and tillage operation led to many factors of aggregation and disaggregation of the aggregates. Soil aggregate reactions to applied disruptive forces are very important in the making of effective soil management decisions. The aggregates’ strength was directly related to the aggregates’ size and shape. When the size of an individual aggregate increased, the applied stress that was required to crush the aggregate was higher [28].
Bulk soil and rhizosphere soil aggregates are being evaluated in a rice-growing season and are dynamic in aggregate formation caused by organic inputs and roots at that moment. Abiven et al. (2009) suggested that the short-term effects of organic inputs on aggregate stability were due to microbial activity and organic matter fractions, such as water-soluble carbohydrates, particulate organic matter, and polysaccharides [29]. Thus, future research should focus on the dynamic changes of soil microbial activity and labile soil organic matter during the whole rice growing season. Additionally, a multi-year positioning monitoring is also required.
Economic cost is an important factor in determining whether a technology is adopted by farmers [30,31]. After economic cost analysis, the one-time application of controlled-release blended fertilizer and cattle manure can be widely adopted by farmers in the future because it saves labor costs compared to conventional multiple top-dressing fertilizers (Table S1).

5. Conclusions

We hypothesized that the MWD value and C storage in rhizosphere soil and bulk soil increased when combined with the application of chemical fertilizer and organic amendments. Based on an 8-year field experiment, the results validated the hypothesis. Root biomass and soil organic C contents appear to be important factors affecting the formation of macroaggregates in rhizosphere soil and bulk soil, respectively. However, multi-year monitoring is required in future research.

Supplementary Materials

The following supporting information can be downloaded at: https://www.mdpi.com/article/10.3390/agronomy12020469/s1, Figure S1: Root biomass under three fertilization regimes at three rice growth stages; Table S1: Mean cost for early rice and late rice production under different fertilization managements.

Author Contributions

Conceptualization, Q.W. and H.Z.; methodology, W.M. and Q.G.; software, S.G.; validation, C.C.; formal analysis, Y.M. and S.G.; investigation, C.C.; resources, M.L.; data curation, Q.G.; writing—original draft preparation, W.M.; writing—review and editing, W.M., Q.W. and H.Z.; visualization, Q.G.; supervision, Q.W. and H.Z.; project administration, Q.W. and H.Z.; funding acquisition, Y.M. and Q.W. All authors have read and agreed to the published version of the manuscript.

Funding

This research was funded by the Scientific Study Project for Institutes of Higher Learning of Ministry of Education of Inner Mongolia (Grant No. NJZZ19067), Key Science–Technology Project of Inner Mongolia (2021GG0251), and the Natural Science Youth Foundation of Shandong Province (ZR2021QD018).

Institutional Review Board Statement

Not applicable.

Informed Consent Statement

Not applicable.

Data Availability Statement

Data is contained within the article or supplementary materials.

Conflicts of Interest

The authors declare no conflict of interest.

Abbreviations

NPK, nitrogen (N), inorganic phosphorus (P) fertilizer, and potash (K) fertilizer; NPK + RS, mineral fertilizer plus rice straw; CRF + CM, controlled-release blended fertilizer plus cattle manure; SOC, soil organic carbon; TN, total nitrogen; MWD, mean weight diameter.

References

  1. Six, J.; Elliott, E.T.; Paustian, K. Soil structure and soil organic matter. II. A normalized stability index and the effect of mineralogy. Soil Sci. Soc. Am. J. 2000, 64, 1042–1049. [Google Scholar] [CrossRef]
  2. Wu, Q.C.; Zhang, C.Z.; Yu, Z.H.; Zhang, J.B.; Zhu, C.W.; Zhao, Z.H.; Xiong, J.A.R.; Chen, J.L. Effects of elevated CO2 and nitrogen addition on organic carbon and aggregates in soil planted with different rice cultivars. Plant Soil 2018, 432, 245–258. [Google Scholar] [CrossRef]
  3. Tisdall, J.M.; Oades, J.M. Organic matter and water-stable aggregates in soils. J. Soil Sci. 1982, 33, 141–163. [Google Scholar] [CrossRef]
  4. Jastrow, J.D.; Miller, R.M.; Lussenhop, J. Contributions of interacting biological mechanisms to soil aggregate stabilization in restored prairie. Soil Biol. Biochem. 1998, 30, 905–916. [Google Scholar] [CrossRef]
  5. Miller, R.M.; Jastrow, J.D. Hierarchy of root and mycorrhizal fungal interactions with soil aggregation. Soil Biol. Biochem. 1990, 22, 579–584. [Google Scholar] [CrossRef]
  6. Chen, Y.M.; Wang, M.K.; Zhuang, S.Y.; Chiang, P.N. Chemical and physical properties of rhizosphere and bulk soils of three tea plants cultivated in Ultisols. Geoderma 2006, 136, 378–387. [Google Scholar] [CrossRef]
  7. Whalley, W.R.; Riseley, B.; Harrison, P.B.L.; Bird, N.R.A.; Leech, P.K.; Adderley, W.P. Structural differences between bulk and rhizosphere soil. Europ. J. Soil Sci. 2005, 56, 353–360. [Google Scholar] [CrossRef]
  8. Tripathi, R.; Nayak, A.K.; Bhattacharyya, P.; Shukla, A.K.; Shahid, M.; Raja, R.; Panda, B.B.; Mohanty, S.; Kumar, A.; Thilagam, V.K. Soil aggregation and distribution of carbon and nitrogen in different fractions after 41 years long-term fertilizer experiment in tropical rice-rice system. Geoderma 2014, 213, 280–286. [Google Scholar] [CrossRef]
  9. Barbosa, G.M.C.; Oliveira, J.F.; Miyazawa, M.; Ruiz, D.B.; Filho, J.T. Aggregation and clay dispersion of an oxisol treated with swine and poultry manures. Soil Till. Res. 2015, 146, 279–285. [Google Scholar] [CrossRef]
  10. Soon, Y.K.; Lupwayi, N.Z. Straw management in a cold semi-arid region: Impact on soil quality and crop productivity. Field Crops Res. 2012, 139, 39–46. [Google Scholar] [CrossRef]
  11. Zhang, P.; Wei, T.; Jia, Z.K.; Han, Q.F.; Ren, X.L. Soil aggregate and crop yield changes with different rates of straw incorporation in semiarid areas of northwest China. Geoderma 2014, 230–231, 41–49. [Google Scholar] [CrossRef]
  12. Xin, X.L.; Zhang, J.B.; Zhu, A.N.; Zhang, C.Z. Effects of long-term (23 years) mineral fertilizer and compost application on physical properties of fluvo-aquic soil in the North China Plain. Soil Till. Res. 2016, 156, 166–172. [Google Scholar] [CrossRef]
  13. Aramrak, S.; Chittamart, N.; Wisawapipat, W.; Rattanapichai, W.; Phun-lam, M.; Aramrak, A. Dynamics of soil aggregate stability as induced by potassium in a soil-plant system. Soil Sci. Plant Nutr. 2021, 67, 371–379. [Google Scholar] [CrossRef]
  14. Ai, C.; Liang, G.Q.; Sun, J.W.; Wang, X.B.; He, P.; Zhou, W. Different roles of rhizosphere effect and long-term fertilization in the activity and community structure of ammonia oxidizers in a calcareous fluvo-aquic soil. Soil Biol. Biochem. 2013, 57, 30–42. [Google Scholar] [CrossRef]
  15. Kemper, W.D.; Rosenau, R.C. Aggregate stability and size distribution. In Methods of Soil Analysis, Part1. Physical and Mineralogical Methods, 2nd ed.; American Society of Agronomy: Madison, WI, USA, 1986; pp. 425–442. [Google Scholar] [CrossRef]
  16. Wang, X.J.; Jia, Z.K.; Liang, L.Y.; Yang, B.P.; Ding, R.X.; Nie, J.F.; Wang, J.P. Maize straw effects on soil aggregation and other properties in arid land. Soil Till. Res. 2015, 153, 131–136. [Google Scholar] [CrossRef]
  17. Pinheiro, E.F.M.; Pereira, M.G.; Anjos, L.H.C. Aggregate distribution and soil organic matter under different tillage systems for vegetable crops in a Red Latosol from Brazil. Soil Till. Res. 2004, 77, 79–84. [Google Scholar] [CrossRef]
  18. Tian, J.; Fan, M.S.; Guo, J.H.; Marschner, P.; Li, X.L.; Kuzyakov, Y. Effects of land use intensity on dissolved organic carbon properties and microbial community structure. Eur. J. Soil Biol. 2012, 52, 67–72. [Google Scholar] [CrossRef]
  19. Gao, Q.; Mi, W.H.; Xia, S.Q.; Liu, M.Y.; Mao, W.; Ju, J.; Zhao, H.T. Aggregate composition, stability and nutrient distribution characteristics in yellow clayey paddy soil under long-term different fertilization measures. J. Henan Agric. Sci. 2021, 50, 70–81. [Google Scholar] [CrossRef]
  20. Regelink, I.C.; Stoof, C.R.; Rousseva, S.; Weng, L.P.; Lair, G.J.; Kram, P.; Nikoladidis, N.P.; Kercheva, M.; Banwart, S.; Comans, R.N.J. Linkages between aggregate formation, porosity and soil chemical properties. Geoderma 2015, 247–248, 24–37. [Google Scholar] [CrossRef]
  21. Calabi-Floody, M.; Bendall, J.S.; Jara, A.A.; Welland, M.E.; Theng, B.K.G.; Rumpel, C.; de la Luz Mora, M. Nanoclays from an Andisol: Extraction, properties and carbon stabilization. Geoderma 2011, 161, 159–167. [Google Scholar] [CrossRef]
  22. Haynes, R.J.; Swift, R.S.; Stephen, R.C. Influence of mixed cropping rotations (pasture-arable) on organic matter content, water stable aggregation and clod porosity in a group of soils. Soil Till. Res. 1991, 19, 77–87. [Google Scholar] [CrossRef]
  23. Jastrow, J.D. Soil aggregate formation and the accural of particulate and mineral-associated organic matter. Soil Biol. Biochem. 1996, 28, 665–676. [Google Scholar] [CrossRef]
  24. Zhang, R.F.; Vivanco, J.M.; Shen, Q.R. The unseen rhizosphere root-soil-microbe interactions for crop production. Cur. Opin. Microbio. 2017, 37, 8–14. [Google Scholar] [CrossRef]
  25. Xie, M.M.; Zou, Y.N.; Wu, Q.S.; Zhang, Z.Z.; Kuča, K. Single or dual inoculation of arbuscular mycorrhizal fungi and rhizobia regulates plant growth and nitrogen acquisition in white clover. Plant Soil Environ. 2020, 66, 287–294. [Google Scholar] [CrossRef]
  26. Akinola, S.A.; Babalola, O.O. The importance of adverse soil microbiomes in the light of omics: Implications for food safety. Plant Soil Environ. 2020, 66, 421–430. [Google Scholar] [CrossRef]
  27. Beauregrad, P.B.; Chai, Y.R.; Vlamakis, H.; Losick, R.; Kolter, R. Bacillus subtilis biofilm induction by plant polysaccharides. Proc. Natl. Acad. Sci. USA 2013, 110, E1621–E1630. [Google Scholar] [CrossRef] [Green Version]
  28. Öztaş, T.; Sönmez, K.; Canbolat, M.Y. Strength of individual soil aggregates against crushing forces I. Influence of aggregate characteristics. Turk. J. Agric. For. 1999, 23, 567–572. [Google Scholar]
  29. Abiven, S.; Menasseri, S.; Chenu, C. The effects of organic inputs over time on soil aggregate stability-A literature analysis. Soil Biol. Biochem. 2009, 41, 1–12. [Google Scholar] [CrossRef]
  30. Maroušek, J.; Maroušková, A. Economic considerations on nutrient utilization in wastewater management. Energies 2021, 14, 3468. [Google Scholar] [CrossRef]
  31. Maroušek, J.; Marouškov, A.; Zoubek, T.; Bartoš, P. Economic impacts of soil fertility degradation by traces of iron from drinking water treatment. Environ. Develop. Sustain. 2021, 1–10. [Google Scholar] [CrossRef]
Figure 1. Mean weight diameter (MWD) among different fertilization regimes at three rice growth stages in rhizosphere soil (a) and bulk soil (b). Values with same letters in the same rice growth stage are not significantly different at the 5% level of probability. Error bars represent standard deviations. All abbreviations are provided in Table 1.
Agronomy 12 00469 g001
Figure 2. Concentrations of SOC, TN, and C:N ratios in aggregate size fractions under different fertilization treatments at three rice growth stages in rhizosphere. Values with the same letters are not significantly different at the 5% level of probability within each fraction. Error bars represent standard deviations. All abbreviations are provided in Table 1. (a) indicated the concentrations of SOC, TN, and C:N ratios in >2 mm under three fertilization treatments at rice tillering stage in rhizosphere soil; (b) indicated the concentrations of SOC, TN, and C:N ratios in 0.25–2 mm under three fertilization treatments at rice tillering stage in rhizosphere soil; (c) indicated the concentrations of SOC, TN, and C:N ratios in <0.25 mm under three fertilization treatments at rice tillering stage in rhizosphere soil; (d) indicated the concentrations of SOC, TN, and C:N ratios in >2 mm under three fertilization treatments at rice jointing stage in rhizosphere soil; (e) indicated the concentrations of SOC, TN, and C:N ratios in 0.25–2 mm under three fertilization treatments at rice jointing stage in rhizosphere soil; (f) indicated the concentrations of SOC, TN, and C:N ratios in <0.25 mm under three fertilization treatments at rice jointing stage in rhizosphere soil; (g) indicated the concentrations of SOC, TN, and C:N ratios in >2 mm under three fertilization treatments at rice maturity stage in rhizosphere soil; (h) indicated the concentrations of SOC, TN, and C:N ratios in 0.25–2 mm under three fertilization treatments at rice maturity stage in rhizosphere soil; (i) indicated the concentrations of SOC, TN, and C:N ratios in <0.25 mm under three fertilization treatments at rice maturity stage in rhizosphere soil.
Agronomy 12 00469 g002
Figure 3. Concentrations of SOC, TN, and C:N ratios in aggregate size fractions under different fertilization treatments at three rice growth stages in bulk soil. Values with the same letters are not significantly different at the 5% level of probability within each fraction. Error bars represent standard deviations. All abbreviations are provided in Table 1. (a) indicated the concentrations of SOC, TN, and C:N ratios in >2 mm under three fertilization treatments at rice tillering stage in bulk soil; (b) indicated the concentrations of SOC, TN, and C:N ratios in 0.25–2 mm under three fertilization treatments at rice tillering stage in bulk soil; (c) indicated the concentrations of SOC, TN, and C:N ratios in <0.25 mm under three fertilization treatments at rice tillering stage in bulk soil; (d) indicated the concentrations of SOC, TN, and C:N ratios in >2 mm under three fertilization treatments at rice jointing stage in bulk soil; (e) indicated the concentrations of SOC, TN, and C:N ratios in 0.25–2 mm under three fertilization treatments at rice jointing stage in bulk soil; (f) indicated the concentrations of SOC, TN, and C:N ratios in <0.25 mm under three fertilization treatments at rice jointing stage in bulk soil; (g) indicated the concentrations of SOC, TN, and C:N ratios in >2 mm under three fertilization treatments at rice maturity stage in bulk soil; (h) indicated the concentrations of SOC, TN, and C:N ratios in 0.25–2 mm under three fertilization treatments at rice maturity stage in bulk soil; (i) indicated the concentrations of SOC, TN, and C:N ratios in <0.25 mm under three fertilization treatments at rice maturity stage in bulk soil.
Agronomy 12 00469 g003
Figure 4. Relationship between root biomass (a) or soil organic carbon content in <0.25 mm aggregate size (b) and proportion of >2 mm aggregate.
Agronomy 12 00469 g004
Table 1. Soil aggregate size distribution among different fertilization regimes at three rice growth stages.
Sampling TimeTreatmentRhizosphere SoilBulk Soil
>2 mm0.25–2 mm<0.25 mm>2 mm0.25–2 mm<0.25 mm
TilleringNPK15.6 ± 0.5 b52.2 ± 1.3 c32.2 ± 1.7 a14.8 ± 0.4 c50.3 ± 2.0 a34.9 ± 2.0 a
NPK + RS17.8 ± 0.4 a56.3 ± 1.4 b26.0 ± 1.7 b23.4 ± 1.0 b48.3 ± 1.7 a28.3 ± 1.0 b
CRF + CM17.9 ± 0.2 a59.3 ± 0.9 a22.8 ± 1.1 c26.9 ± 0.8 a47.0 ± 2.1 a26.0 ± 1.4 b
JointingNPK25.1 ± 1.4 b41.1 ± 0.9 b33.8 ± 0.5 a29.0 ± 0.9 b38.2 ± 1.1 a32.8 ± 1.1 a
NPK + RS31.1 ± 0.4 a37.6 ± 0.4 c31.3 ± 0.7 b36.1 ± 1.2 a39.3 ± 0.5 a24.6 ± 1.1 b
CRF + CM28.3 ± 2.1 a44.5 ± 2.1 a27.2 ± 1.1 c37.5 ± 2.2 a39.2 ± 1.4 a23.3 ± 0.8 b
MaturityNPK16.6 ± 1.6 c47.8 ± 1.1 b36.2 ± 0.6 a21.7 ± 1.1 b47.3 ± 1.4 a31.0 ± 1.3 a
NPK + RS19.8 ± 1.6 b56.4 ± 2.0 a23.8 ± 0.8 c34.6 ± 0.8 a47.7 ± 0.5 a17.6 ± 0.5 c
CRF + CM23.9 ± 0.9 a49.9 ± 1.9 b26.2 ± 1.2 b32.4 ± 2.2 a44.1 ± 2.0 b23.5 ± 2.5 b
Note: NPK = mineral fertilizers alone; NPK + RS = mineral fertilizers plus rice straw; CRF + CM = controlled-release blended fertilizer plus cattle manure. Values in a column at the same rice growth stage followed by the same small letter are not significantly different at the 5% level of probability. Data are presented in the mean ± standard deviation.
Table 2. Contribution (%) of C of each aggregate size fraction under different fertilization managements at three rice growth stages in the rhizosphere and bulk soil.
Sampling
Time
TreatmentRhizosphere SoilBulk Soil
>2 mm0.25–2 mm<0.25 mm>2 mm0.25–2 mm<0.25 mm
TilleringNPK16.9 ± 0.8 c54.1 ± 1.4 b29.0 ± 2.0 a14.7 ± 1.2 c54.0 ± 0.4 a31.3 ± 1.3 a
NPK + RS19.3 ± 0.5 b59.2 ± 0.9 a21.5 ± 0.5 b25.9 ± 0.9 b50.3 ± 2.1 b23.8 ± 1.2 b
CRF + CM20.9 ± 0.5 a60.1 ± 1.6 a19.0 ± 1.4 b31.1 ± 1.8 a47.6 ± 1.5 b21.4 ± 1.9 b
JointingNPK25.0 ± 0.3 b44.5 ± 0.9 a30.5 ± 1.2 a29.2 ± 0.3 b38.6 ± 1.4 a32.2 ± 1.2 a
NPK + RS34.4 ± 0.1 a39.2 ± 1.1 b26.4 ± 1.3 b36.2 ± 2.5 a39.4 ± 2.5 a24.4 ± 1.6 b
CRF + CM32.7 ± 4.6 a45.0 ± 3.6 a22.3 ± 1.7 c38.2 ± 1.7 a38.9 ± 2.1 a22.9 ± 0.9 b
MaturityNPK18.5 ± 1.4 b51.1 ± 2.1 b30.3 ± 0.7 a22.2 ± 1.7 b48.0 ± 0.7 a29.8 ± 2.3 a
NPK + RS21.0 ± 0.8 b59.4 ± 2.2 a19.7 ± 2.0 b35.2 ± 2.6 a48.7 ± 1.5 a16.1 ± 1.1 b
CRF + CM28.5 ± 1.6 a54.7 ± 2.1 b16.8 ± 0.6 c34.4 ± 3.7 a46.5 ± 2.3 a19.0 ± 1.5 b
Note: Values in a column at the same rice growth stage followed by the same letter are not significantly different at the 5% level of probability. All abbreviations are provided in Table 1. Data are presented in the mean ± standard deviation.
Table 3. Correlations between soil aggregate size fractions, MWD, and soil properties in rhizosphere (n = 27).
Aggregate SizeMWD
>2 mm0.25–2 mm<0.25 mm
Rhizosphere soil
SOC>2 mm0.2380.274−0.731 ***0.662 ***
0.25–2 mm0.3200.290−0.865 ***0.808 ***
<0.25 mm0.1350.189−0.478 *0.409 *
Root biomass 0.889 ***−0.7 ***0.0430.668 ***
Bulk soil
SOC>2 mm0.3680.084−0.576 **0.482 *
0.25–2 mm0.499 **0.071−0.746 ***0.638 ***
<0.25 mm0.720 ***−0.473 *−0.582 **0.700 ***
* means p < 0.05, ** means p < 0.01, *** means p < 0.001.
Publisher’s Note: MDPI stays neutral with regard to jurisdictional claims in published maps and institutional affiliations.

