Abstract
We aimed to optimize field border length in the Huang-Huai-Hai Plain of China (HPC) to reduce soil inorganic nitrogen residues and increase nitrogen absorption and utilization by wheat plants using a traditional border irrigation system. In a two-year experiment (2017–2019) conducted in the HPC, four border lengths were tested: 20 m (L20), 30 m (L30), 40 m (L40), and 50 m (L50). Supplementary irrigation was implemented during jointing and anthesis stages, and control fields received treatment without irrigation. The results showed that, compared with irrigation of other border lengths, L40 irrigation significantly increased nitrogen transport in stems and leaves. In addition, L40 irrigation had the highest rate of grain nitrogen accumulation after anthesis. The risk of nitrate leaching to deep layers increased with increasing border length; however, L40 irrigation improved the plants’ capacity to absorb soil nitrogen, and the soil inorganic nitrogen residue was significantly lower than that with irrigation of other border lengths. Therefore, the grain yield and nitrogen fertilizer utilization under L40 irrigation were significantly higher than those under irrigation of other border lengths, and L40 was considered as the best border irrigation length.
1. Introduction
Wheat is one of the most important cereal crops in the world. Approximately 21% of the world’s food depends on wheat, and ensuring wheat production is critical to food security given rapid population growth [1]. The Huang-Huai-Hai Plain of China (HPC) is the main grain production area in China, producing more than 60% of domestic wheat [2]. Affected by climatic factors, the rainfall in the wheat growing season accounts for only one-third of the annual rainfall, and the area is prone to drought stress [3]. Especially in the critical period of water demand during the jointing and anthesis stages, water stress will significantly reduce wheat yield [4]. Therefore, groundwater supplementary irrigation is the main measure to ensure wheat yield. At present, border irrigation is still the main irrigation method in the HPC, but excessive border length leads to high irrigation volume without increasing grain yield [5,6]. For instance, when the border length is between 80 m and 100 m, a single irrigation amount was approximately 100–150 mm, which far exceeds the water availability required for wheat growth. However, Cui et al. [7] surveyed approximately 300 plots in Huimin County, Shandong Province, and revealed that the border lengths of 87% of the irrigation fields were longer than 100 m. Moreover, our investigation of the trial sites found that more than 97% of the plots have a border length of over 60 m, with some even being more than 200 m. Therefore, under the conditions of traditional border irrigation, optimizing border irrigation and reducing irrigation water usage is essential to the sustainable development of wheat agriculture.
Nitrogen is one of the main nutrients for the growth and development of wheat plants [8]. Soil moisture is an important factor that affects the absorption and utilization of soil nitrogen by wheat, and increasing the availability of soil moisture in the root zone can significantly increase plant nitrogen accumulation [9]. In one study, under condition of 195 kg·ha−1 nitrogen application, treatment with a soil water content of 70% had the highest plant nitrogen accumulation at anthesis, and the grain nitrogen accumulation at maturity was 4.09 kg·ha−1 higher than that under the treatment with 60% soil water content [10]. However, water stress significantly reduces the absorption of nitrogen by plants, and insufficient nitrogen reduces the chlorophyll content in leaves and the accumulation of photosynthetic products [11]. In another study, the plant nitrogen accumulation at anthesis, net photosynthetic rate in flag leaves after anthesis, and grain yield under supplemental irrigation at jointing and anthesis were 45.8%, 24%, and 8.86% higher, respectively, than those under supplemental irrigation at anthesis only [12]. Many studies of the effect of soil moisture and irrigation period on plant nitrogen accumulation have been conducted; however, information on the characteristics of grain nitrogen accumulation and the activity of nitrogen metabolic enzymes in flag leaves, especially under irrigation with different border lengths, is limited.
During crop growth, nitrate leached from root soil is rarely absorbed by crops, which may lead to fertilizer waste and even groundwater pollution [13]. The leaching loss of soil nitrate nitrogen is closely related to irrigation [14]. Increasing 60 mm irrigation water leads to nitrate nitrogen moving downward by 30 cm [15]. Studies have shown that, although irrigation increases the risk of nitrate leaching, proper irrigation can increase soil nitrogen uptake by plants, thereby preventing increases in nitrate nitrogen residue [16]. One study showed that, compared with that under 60 mm irrigation, nitrogen accumulation in wheat plants under 120 mm irrigation increased by 21.88%, and soil nitrate nitrogen residue showed no significant difference. However, when the irrigation amount was increased to 150 mm, soil nitrate nitrogen residue increased significantly, but plant nitrogen accumulation did not [17]. This is similar to the results obtained by Li et al. [18]. The HPC is the primary planting area of winter wheat–summer maize rotation system in China. Due to the shallow root layer of summer maize and heavy rainfall in summer, residual nitrate nitrogen after wheat harvesting cannot be absorbed and utilized, resulting in resource waste and environmental pollution [19]. Ju et al. [20] found that the residual nitrate nitrogen in the 90–180 cm soil layer after maize harvest reached 213–242 kg·ha−1. Therefore, optimizing irrigation and reducing nitrogen leaching in the wheat growing season is of great significance for high-yield and efficient cultivation of crops in this region.
In this study, irrigation of different border lengths was set under field conditions, and plant nitrogen accumulation, flag leaf nitrogen metabolizing enzyme activities, grain nitrogen accumulation, and soil inorganic nitrogen residues were measured. The purpose of this study was to (1) evaluate the effects of different border irrigation on plant nitrogen accumulation and transport and grain nitrogen accumulation characteristics, (2) compare the differences in soil nitrate nitrogen residue under different border irrigation, and (3) determine the best border irrigation length with high yield and high water and nitrogen utilization.
2. Materials and Methods
2.1. Experimental Site
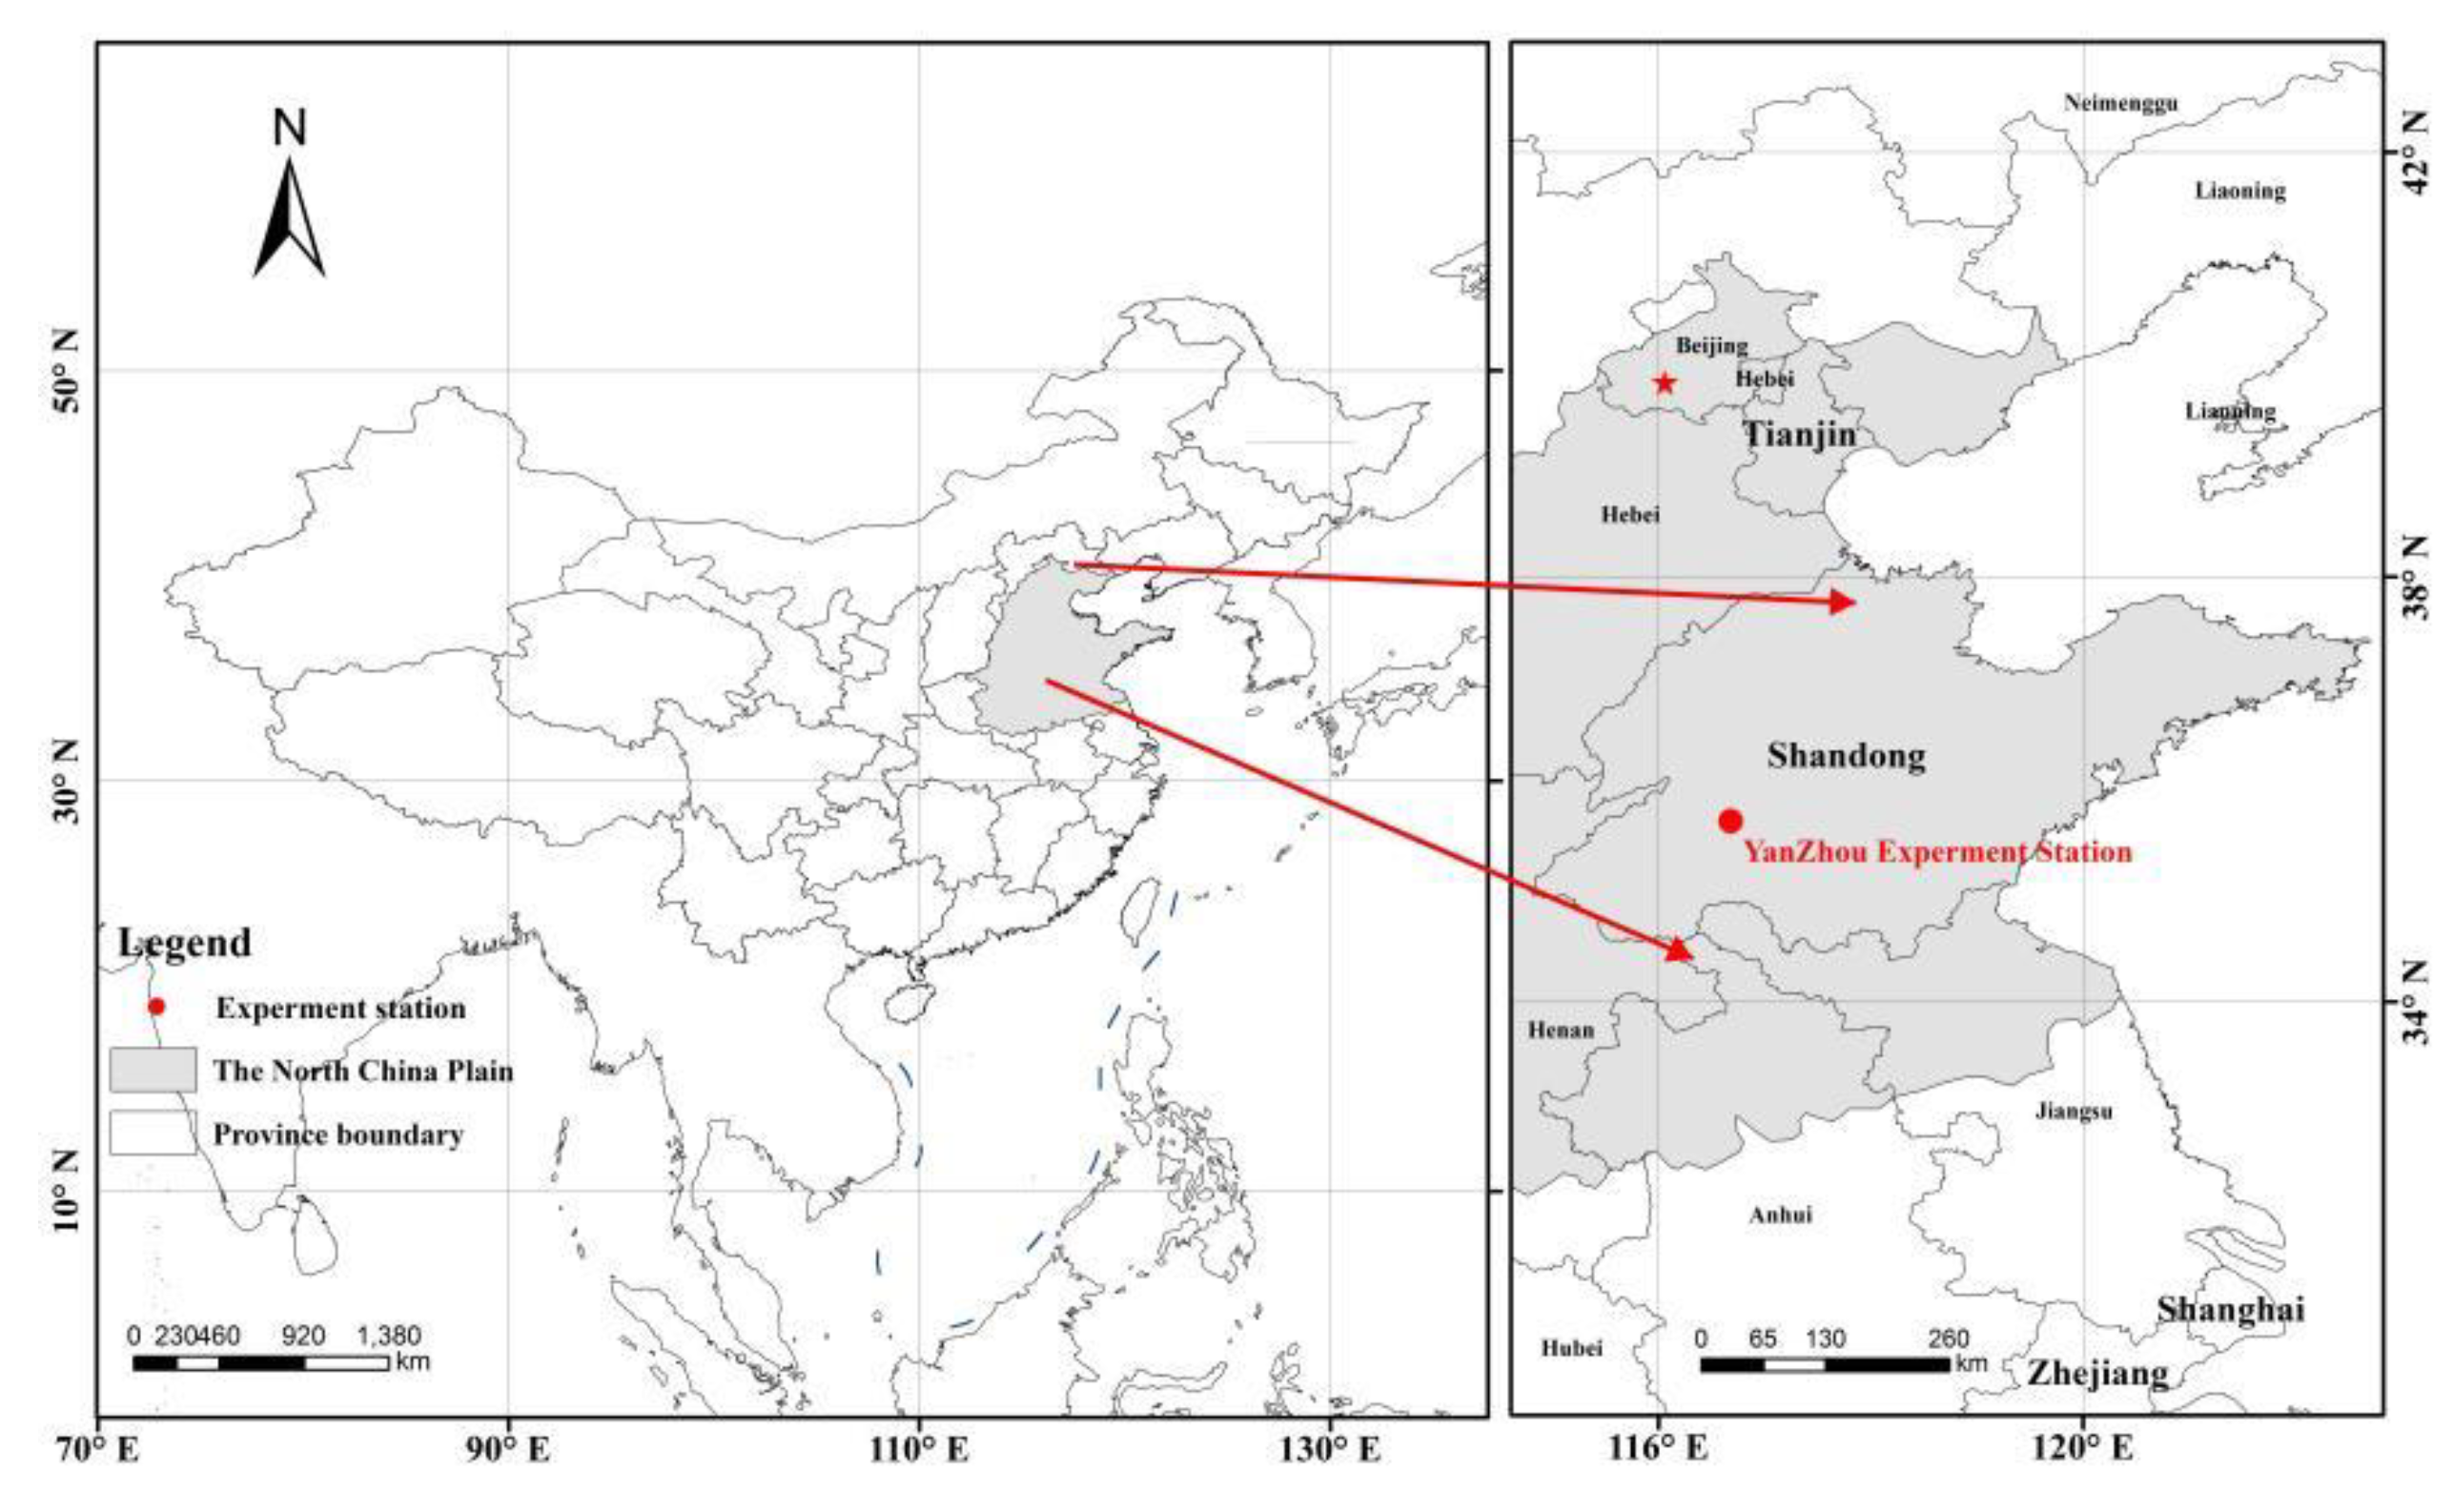
The field experiment was carried out at the experimental station of Shijiawangzi Village, Yanzhou, Shandong Province, China (Figure 1), which experiences a warm temperature continental climate. The soil in the region is classified as loam and composed of 29.6% clay, 37.3% silt, and 33.1% sand. The altitude of the experimental site is 49 m, the slope is 1%, and the slope is southeast. Table 1 shows the nutrient content in the 0–20 cm soil layer, and Figure 2 shows the precipitation and temperature at different months of wheat growth during this experiment.
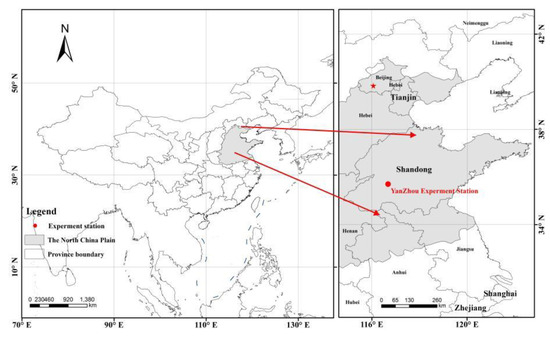
Figure 1.
The experimental site location map.

Table 1.
The nutrient content in the 0–20 cm soil layer before sowing.
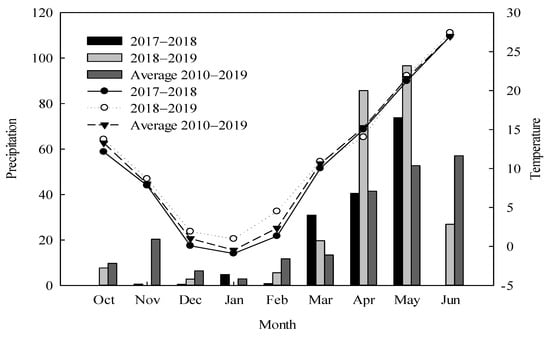
Figure 2.
Precipitation and temperature during wheat growth period in 2017–2019 and the average value during 2010–2019.
2.2. Experimental Design and Crop Management
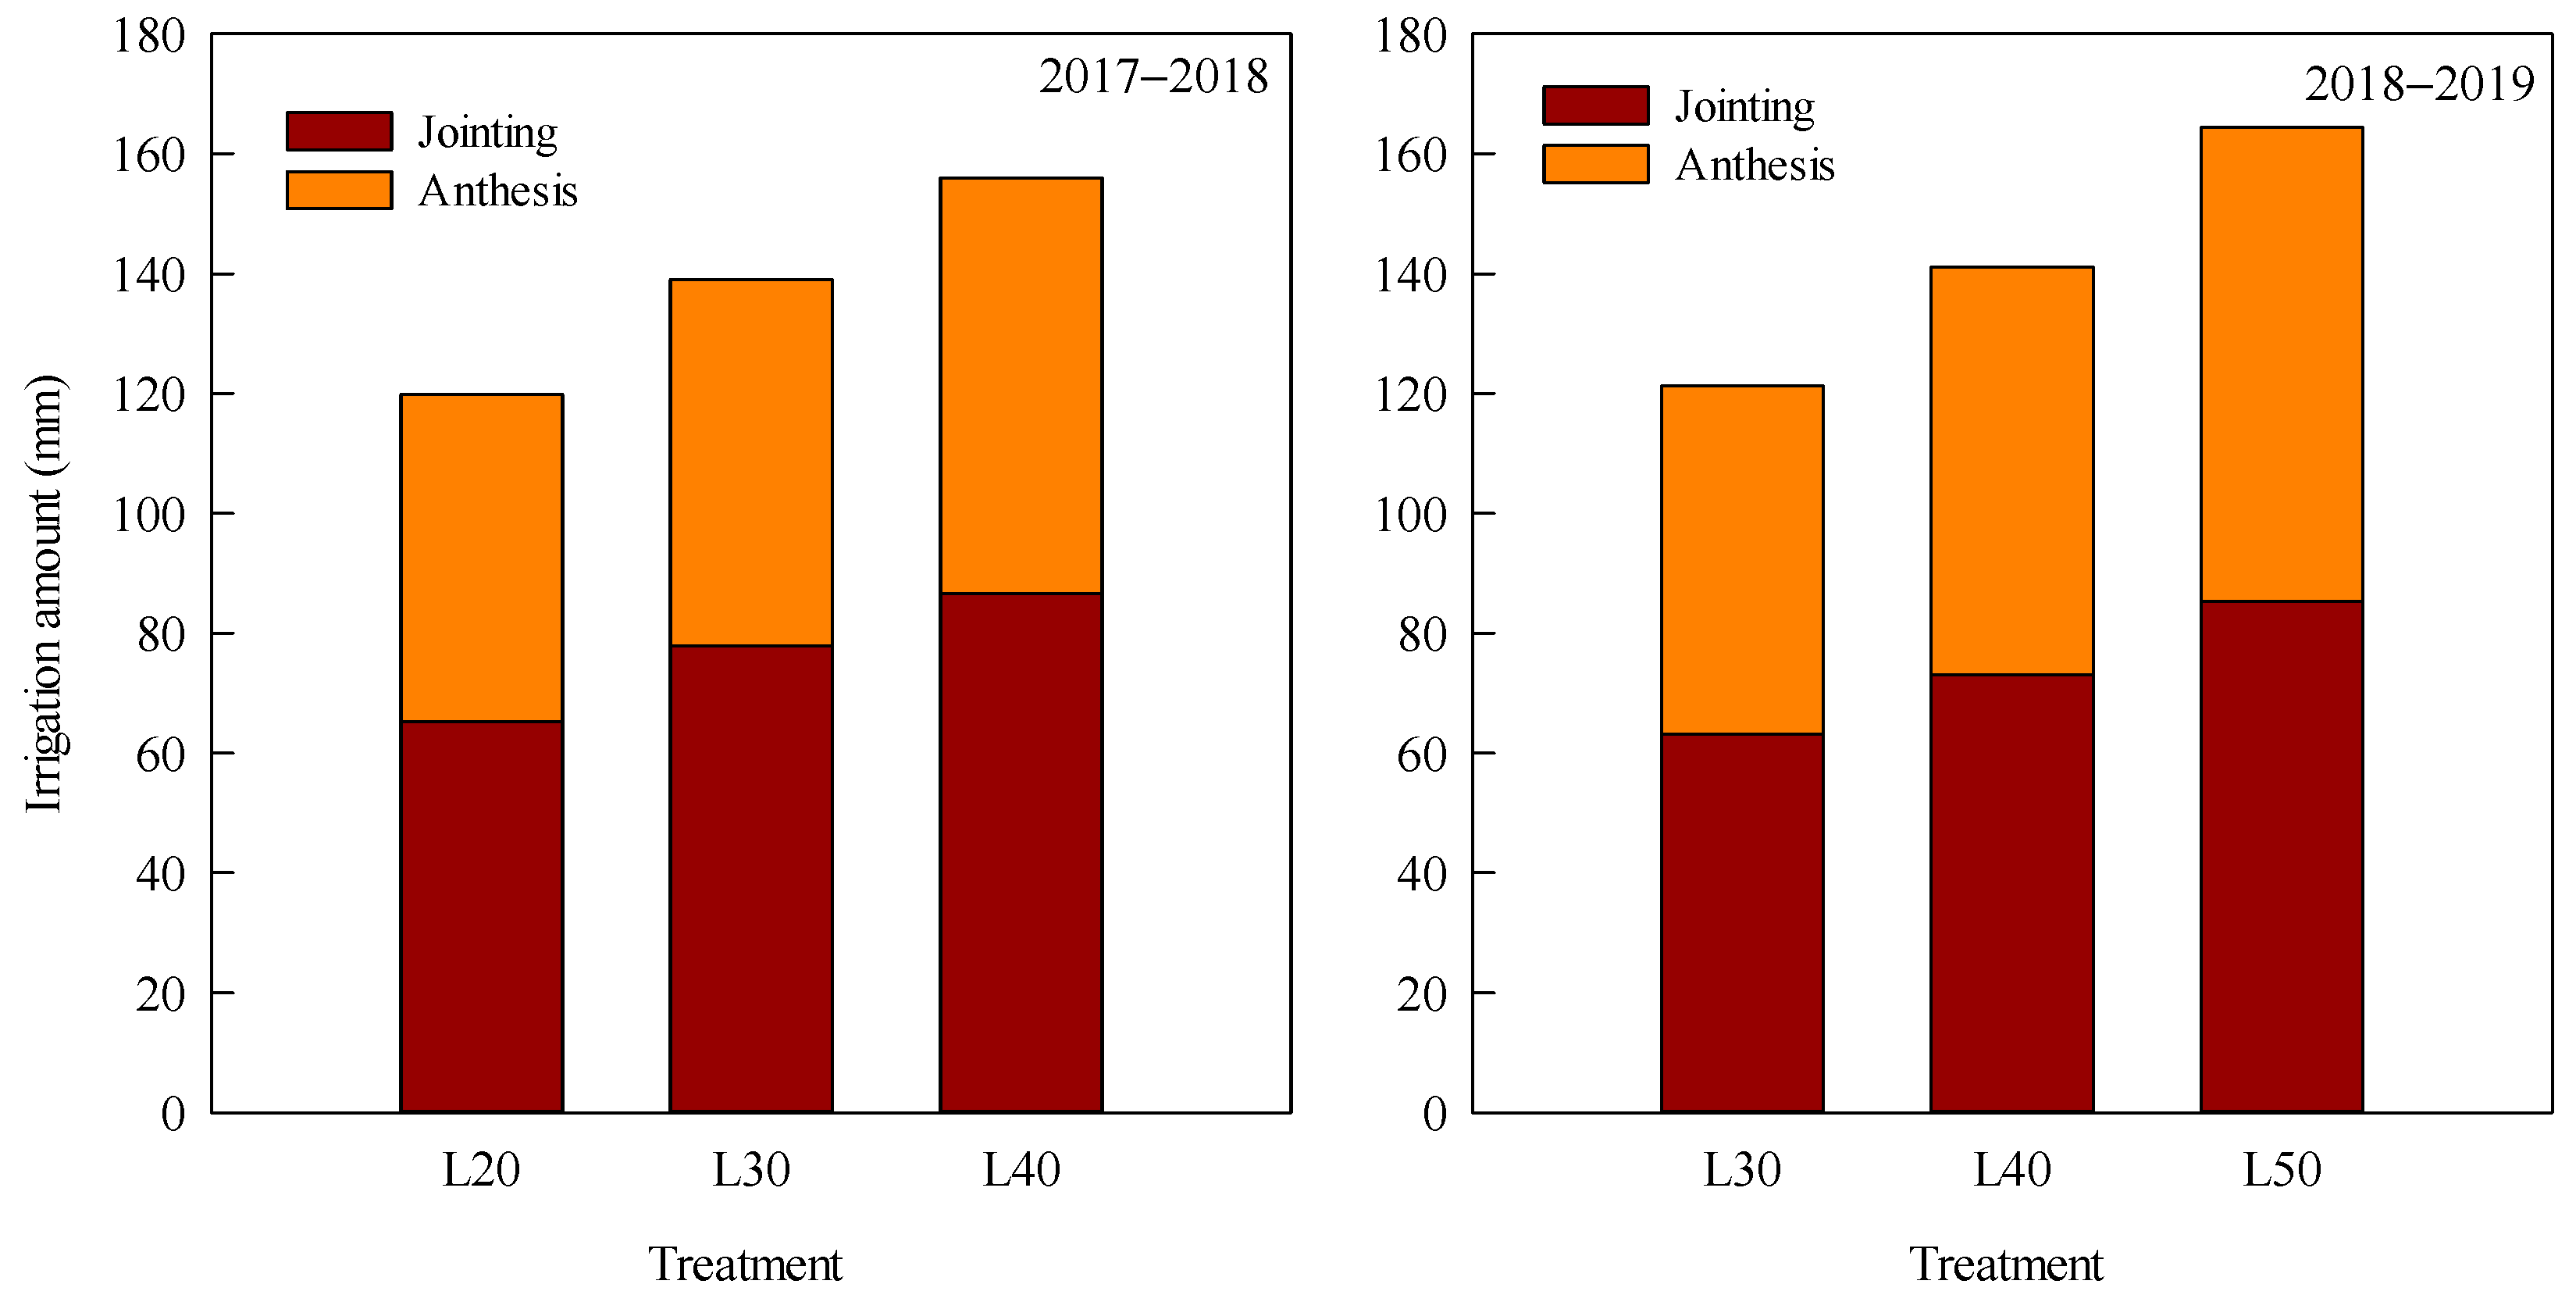
During the wheat growing seasons from 2017 to 2019, irrigation fields with different border lengths were set up (border width, 2 m): 20 m (L20), 30 m (L30), and 40 m (L40) in 2017–2018 and 30 m (L30), 40 m (L40), and 50 m (L50) in 2018–2019. A control field that received no irrigation (RF) was set up in each growing season. The treatments were randomly grouped, and each treatment had three replicates. A 2 m wide guard row was used to minimize the effects of water permeating between two adjacent irrigation plots. Except for the RF treatment, other treatments were supplemented at the jointing and anthesis stages according to the inflow cut-off of 90% (i.e., irrigation was stopped when the water reached 90% of the border length) [21], and the actual irrigation amount was recorded by water meter. The water output of the well at the experiment site was 30 m3 h−1, and the amounts of irrigation in the two growing seasons are shown in Figure 3.
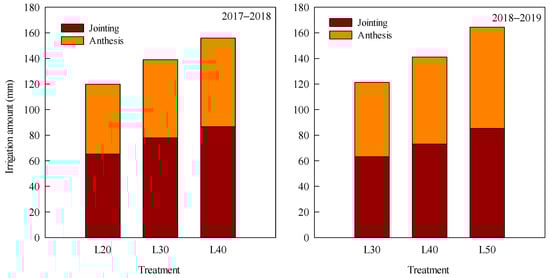
Figure 3.
The irrigation amount at jointing and anthesis stages in 2017–2018 and 2018–2019. L20, L30, L40, and L50: irrigation with border length of 20, 30, 40, and 50 m, respectively.
The high-yield wheat variety ‘Jimai 22’, which is the most widely cultivated commercial variety in the HPC, was used in this experiment. At the sowing stage, 105 kg·ha−1 N (urea, 46% N), 150 kg·ha−1 P (superphosphate, 17% P2O5), and 150 kg·ha−1 K (potassium chloride, 60% K2O) were applied as basal fertilizers, and topdressing of 135 kg·ha−1 N (urea, 46% N) was applied at the jointing stage. The wheat was sown on 20 October 2017, and 8 October 2018, with planting densities of 270 plants m−2 and 180 plants m−2, respectively, and harvested on 7 June 2018, and 12 June 2019, respectively. No pests or diseases occurred during the test period.
2.3. Sampling Point
Each border length was divided into intervals of 10 m, and samples taken from the centre of each interval. The test results are the measured values of the mixed samples at each sampling point under each treatment.
2.4. Nitrogen Accumulation and Transport
Thirty samples were randomly collected at each sampling point at anthesis and maturity. Samples were separated into stem, leaf, and spike at anthesis, and stem, leaf, spike (spike axis and kernel husks), and grain at maturity. All plant samples were dried at 75 °C to a constant weight to determine their biomass [22]. After crushing, the nitrogen content of the plants was determined by the micro-Kjeldahl method. Nitrogen accumulation amount was calculated as the product of dry matter accumulation and nitrogen concentration. Nitrogen translocation amount (NTA), nitrogen accumulation amount after anthesis (NAFA), and contribution proportion (CP) were calculated as described by Liu et al. [23].
2.5. Nitrogen Metabolizing Enzymes of Flag Leaf
After anthesis, 30 flag leaves were collected every 7 days, and the flag leaves were frozen with liquid nitrogen and stored at −80 °C. The nitrate reductase (NR) activity and glutamine synthetase (GS) activity were measured as previously described by Rehman et al. [24].
2.6. Grain Nitrogen Accumulation Characteristics
Wheat spikes that flowered on the same day were tagged and 20 marked spikes per point were harvested at 7-day intervals after anthesis. The samples were dried at 105 °C for 10 min and then at 70 °C to constant weight, and then the kernels were carefully peeled off the ears. Randomly counted 1000-grains (three times) with a counting board, and then weighed. After crushing, the nitrogen content of the grains was determined by the micro Kjeldahl method. In addition, the thousand-grain weight and the grain nitrogen content were used to calculate the grain nitrogen accumulation. The grain nitrogen accumulation process was assessed using the logistic growth equation [25]. In analysis, we adopted the following secondary parameters to describe the grain nitrogen accumulation characteristics: Vmax (the maximum accumulation rate), Vmean (the average accumulation rate), and D (the active accumulation period).
2.7. Soil Inorganic Nitrogen
Soil samples were collected using a soil auger with 20 cm increments up to a depth of 200 cm before sowing and at maturity stage in all points. The nitrate nitrogen content and ammonium nitrogen content were examined using an automated continuous flow analyzer (AA3, Seal, Norderstedt, Germany). The residual and loss of soil inorganic nitrogen were calculated according to the method described by Graham et al. [26].
where NOR is nitrate nitrogen residue (kg·ha−1); H is soil depth (cm); D is soil bulk density (g·cm−3); NOC is nitrate nitrogen content (mg·kg−1); NHR is ammonium nitrogen residue (kg·ha−1); NOC is ammonium nitrogen content (mg·kg−1); INR is inorganic nitrogen residue (kg·ha−1); INL is inorganic nitrogen loss (kg·ha−1); INRS is inorganic nitrogen residue before sowing(kg·ha−1); NF is nitrogen fertilizer (kg·ha−1); INRM is inorganic nitrogen residue at maturity (kg·ha−1); and NAM is nitrogen accumulation of plant at maturity (kg·ha−1).
NOR = H × D × NOC/10
NHR = H × D × NHC/10
INR = NOR + NHR
INL = INRS + NF − INRM − NAM
2.8. Grain Yield and Nitrogen Utilization
Grain yield was determined from a 3 m2 area from each field at maturity and reported at a 12.5% wet basis through natural air-drying. The nitrogen utilization was calculated according to the method described by Wu et al. [27].
where NUPE is nitrogen uptake efficiency (kg·kg−1); NAM is nitrogen accumulation of plant at maturity (kg·ha−1); NF is nitrogen fertilizer (kg·ha−1); NHI is nitrogen harvest index (%); GNA is grain nitrogen accumulation (kg·ha−1); NFP is nitrogen fertilizer productivity (kg·kg−1); and GY is grain yield (kg·ha−1).
NUPE = NAM/NF
NHI = GNA/NAM
NFP = GY/NF
2.9. Statistical Analysis
SPSS Statistics 22.0 software (IBM, Armonk, NY, USA) was used to analyze the data and the least significant difference test (α = 0.05) was used to compare differences between different treatments. All charts were generated using SigmaPlot 12.0 (Systat Software Inc., San Jose, CA, USA).
3. Results
3.1. Nitrogen Accumulation of Vegetative Organs
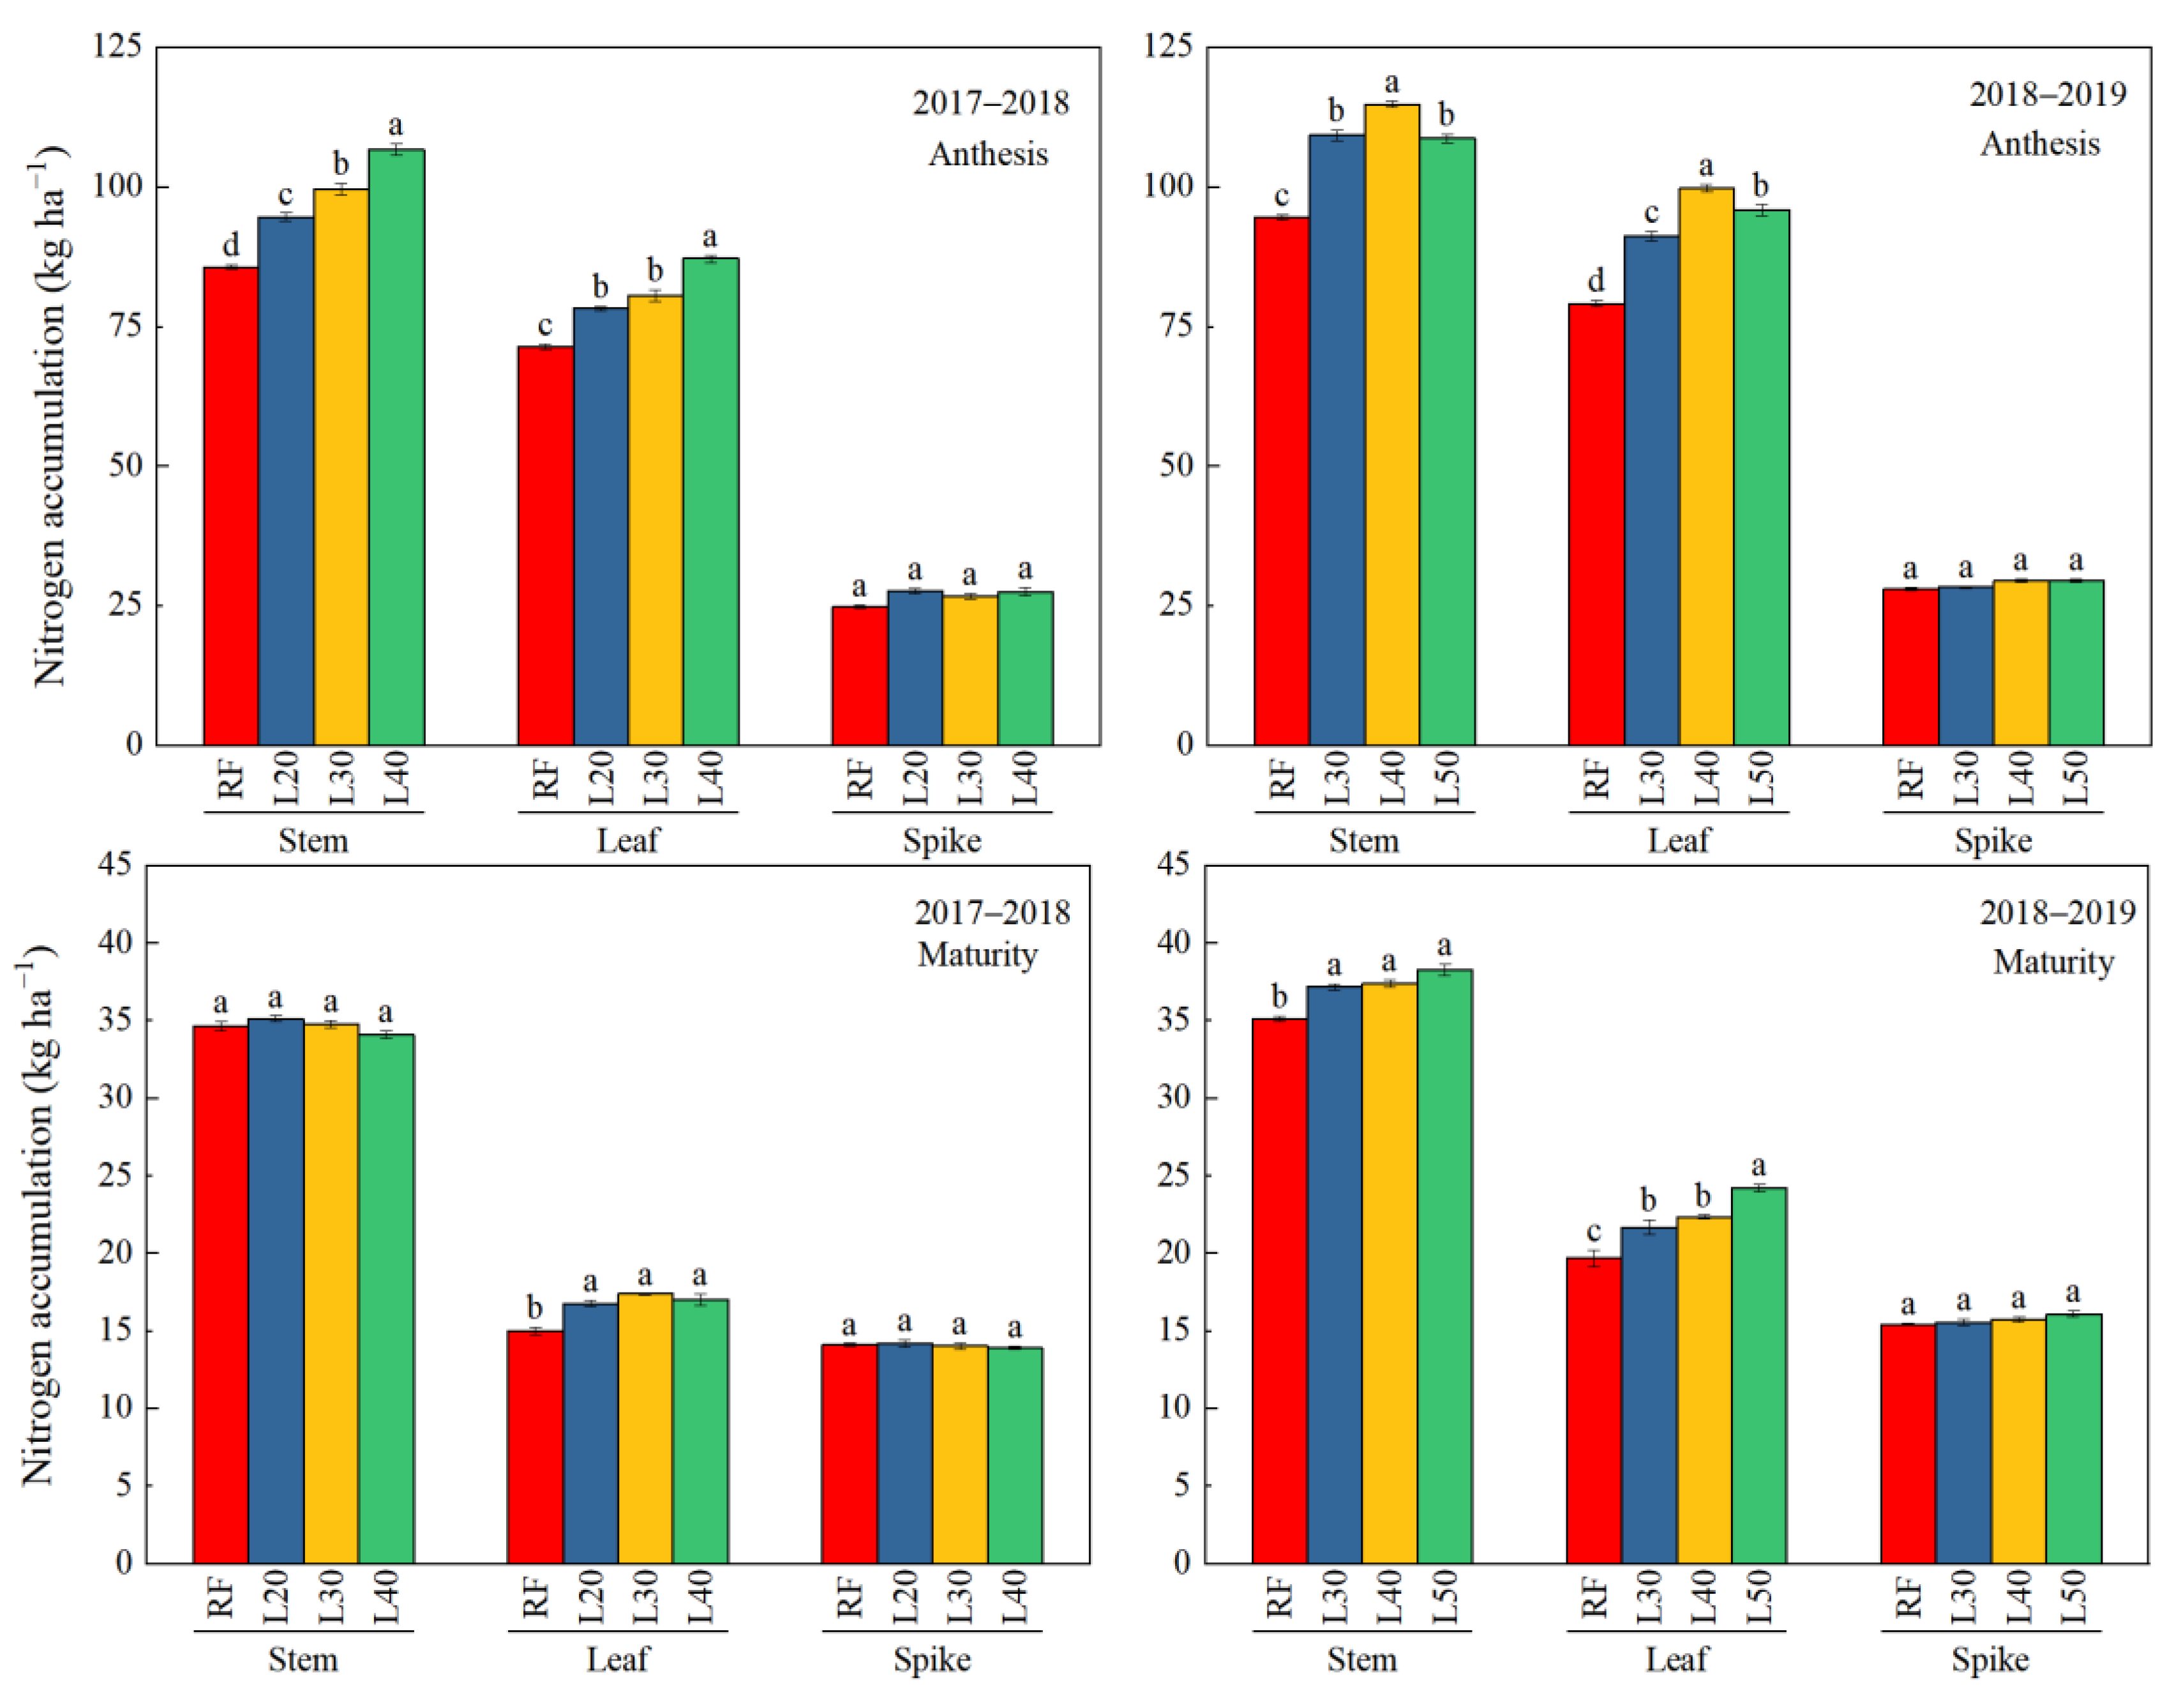
Different border irrigation had a significant effect on the nitrogen accumulation of vegetative organs during the anthesis, but had a small effect on the nitrogen accumulation of vegetative organs during the maturity (Figure 4). Compared with the RF treatment, the nitrogen accumulation in the stem and leaf of the irrigation treatment increased significantly at anthesis, and first increased and then decreased with the increase in the border length, both of which were the highest in the L40 treatment. In addition, there was no difference in nitrogen accumulation in spike at anthesis. Except for the higher nitrogen accumulation in leaf of the L50 treatment in 2018–2019, there was no significant difference in the nitrogen accumulation of the vegetative organs under the irrigation treatment at maturity of the two growing seasons.
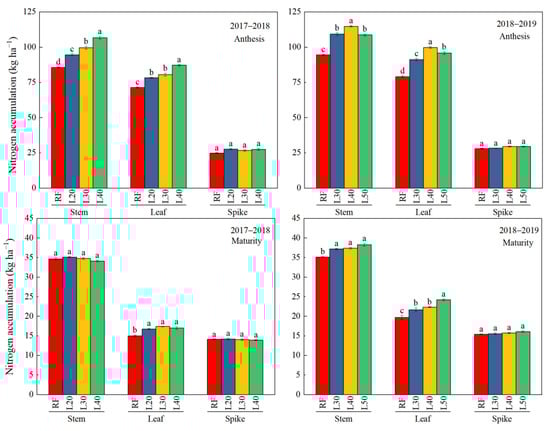
Figure 4.
Nitrogen accumulation of vegetative organs in different treatments at anthesis and maturity. RF: no irrigation. L20, L30, L40, and L50: irrigation with border length of 20, 30, 40, and 50 m, respectively. Different letters on the bar indicate significant difference at 0.05 level.
3.2. Nitrogen Translocation and Accumulation after Anthesis
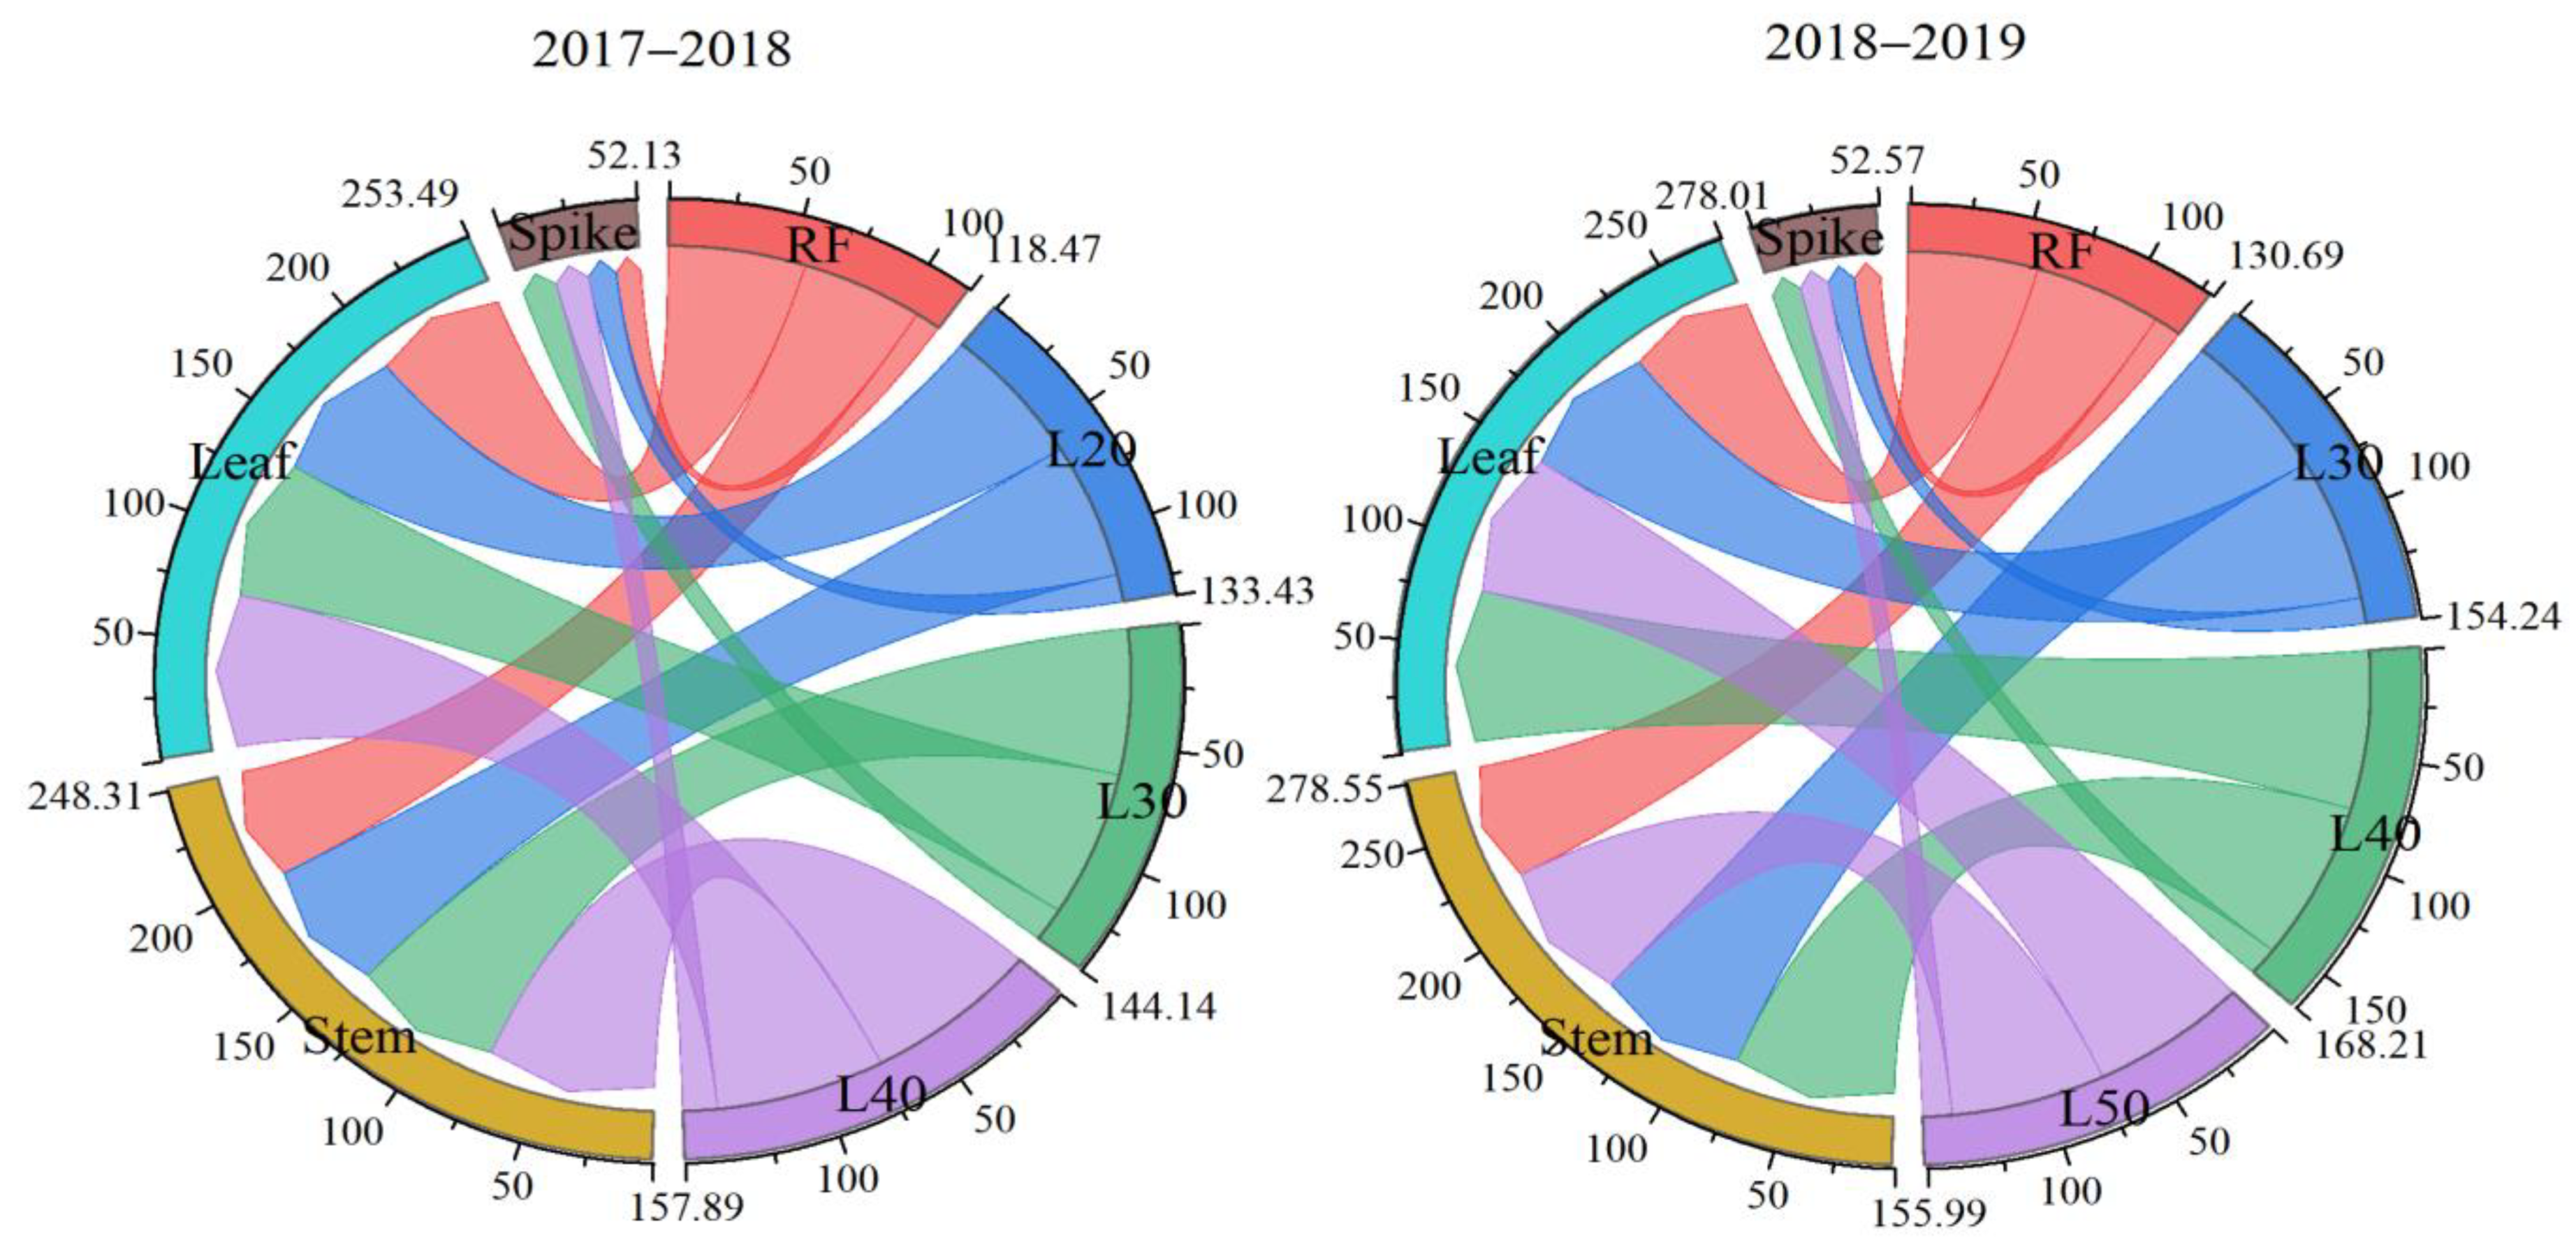
Compared with the irrigation treatment, the NAT, NAFA, and GNA of the RF treatment were significantly reduced (Table 2). Border irrigation had significant effects on NTA, NAFA, and GNA, which were significantly higher in L40 than in other treatments, but the CP of NTA and NAFA to grains were not significant different among L40, L50, and L30 treatments. Moreover, stem and leaf are the main organs for nitrogen transport (Figure 5). The NTA in stem and leaf were both highest in L40, followed by L50 and L30, and lowest in L20, while the NTA in spike was no different among treatments. The higher NTA was the main reason the GNA of L40 treatment was seen to be significantly higher than other treatments.
Table 2.
Nitrogen accumulation and transportation after anthesis under different treatments.

Figure 5.
The nitrogen translocation (kg·ha−1) after anthesis from vegetative organs to grain under different treatments in 2017–2018 and 2018–2019. In the figure, four treatments correspond to four colors, and the width of each color represents the nitrogen translocation amount. RF: no irrigation. L20, L30, L40, and L50: irrigation with border length of 20, 30, 40, 50 m.
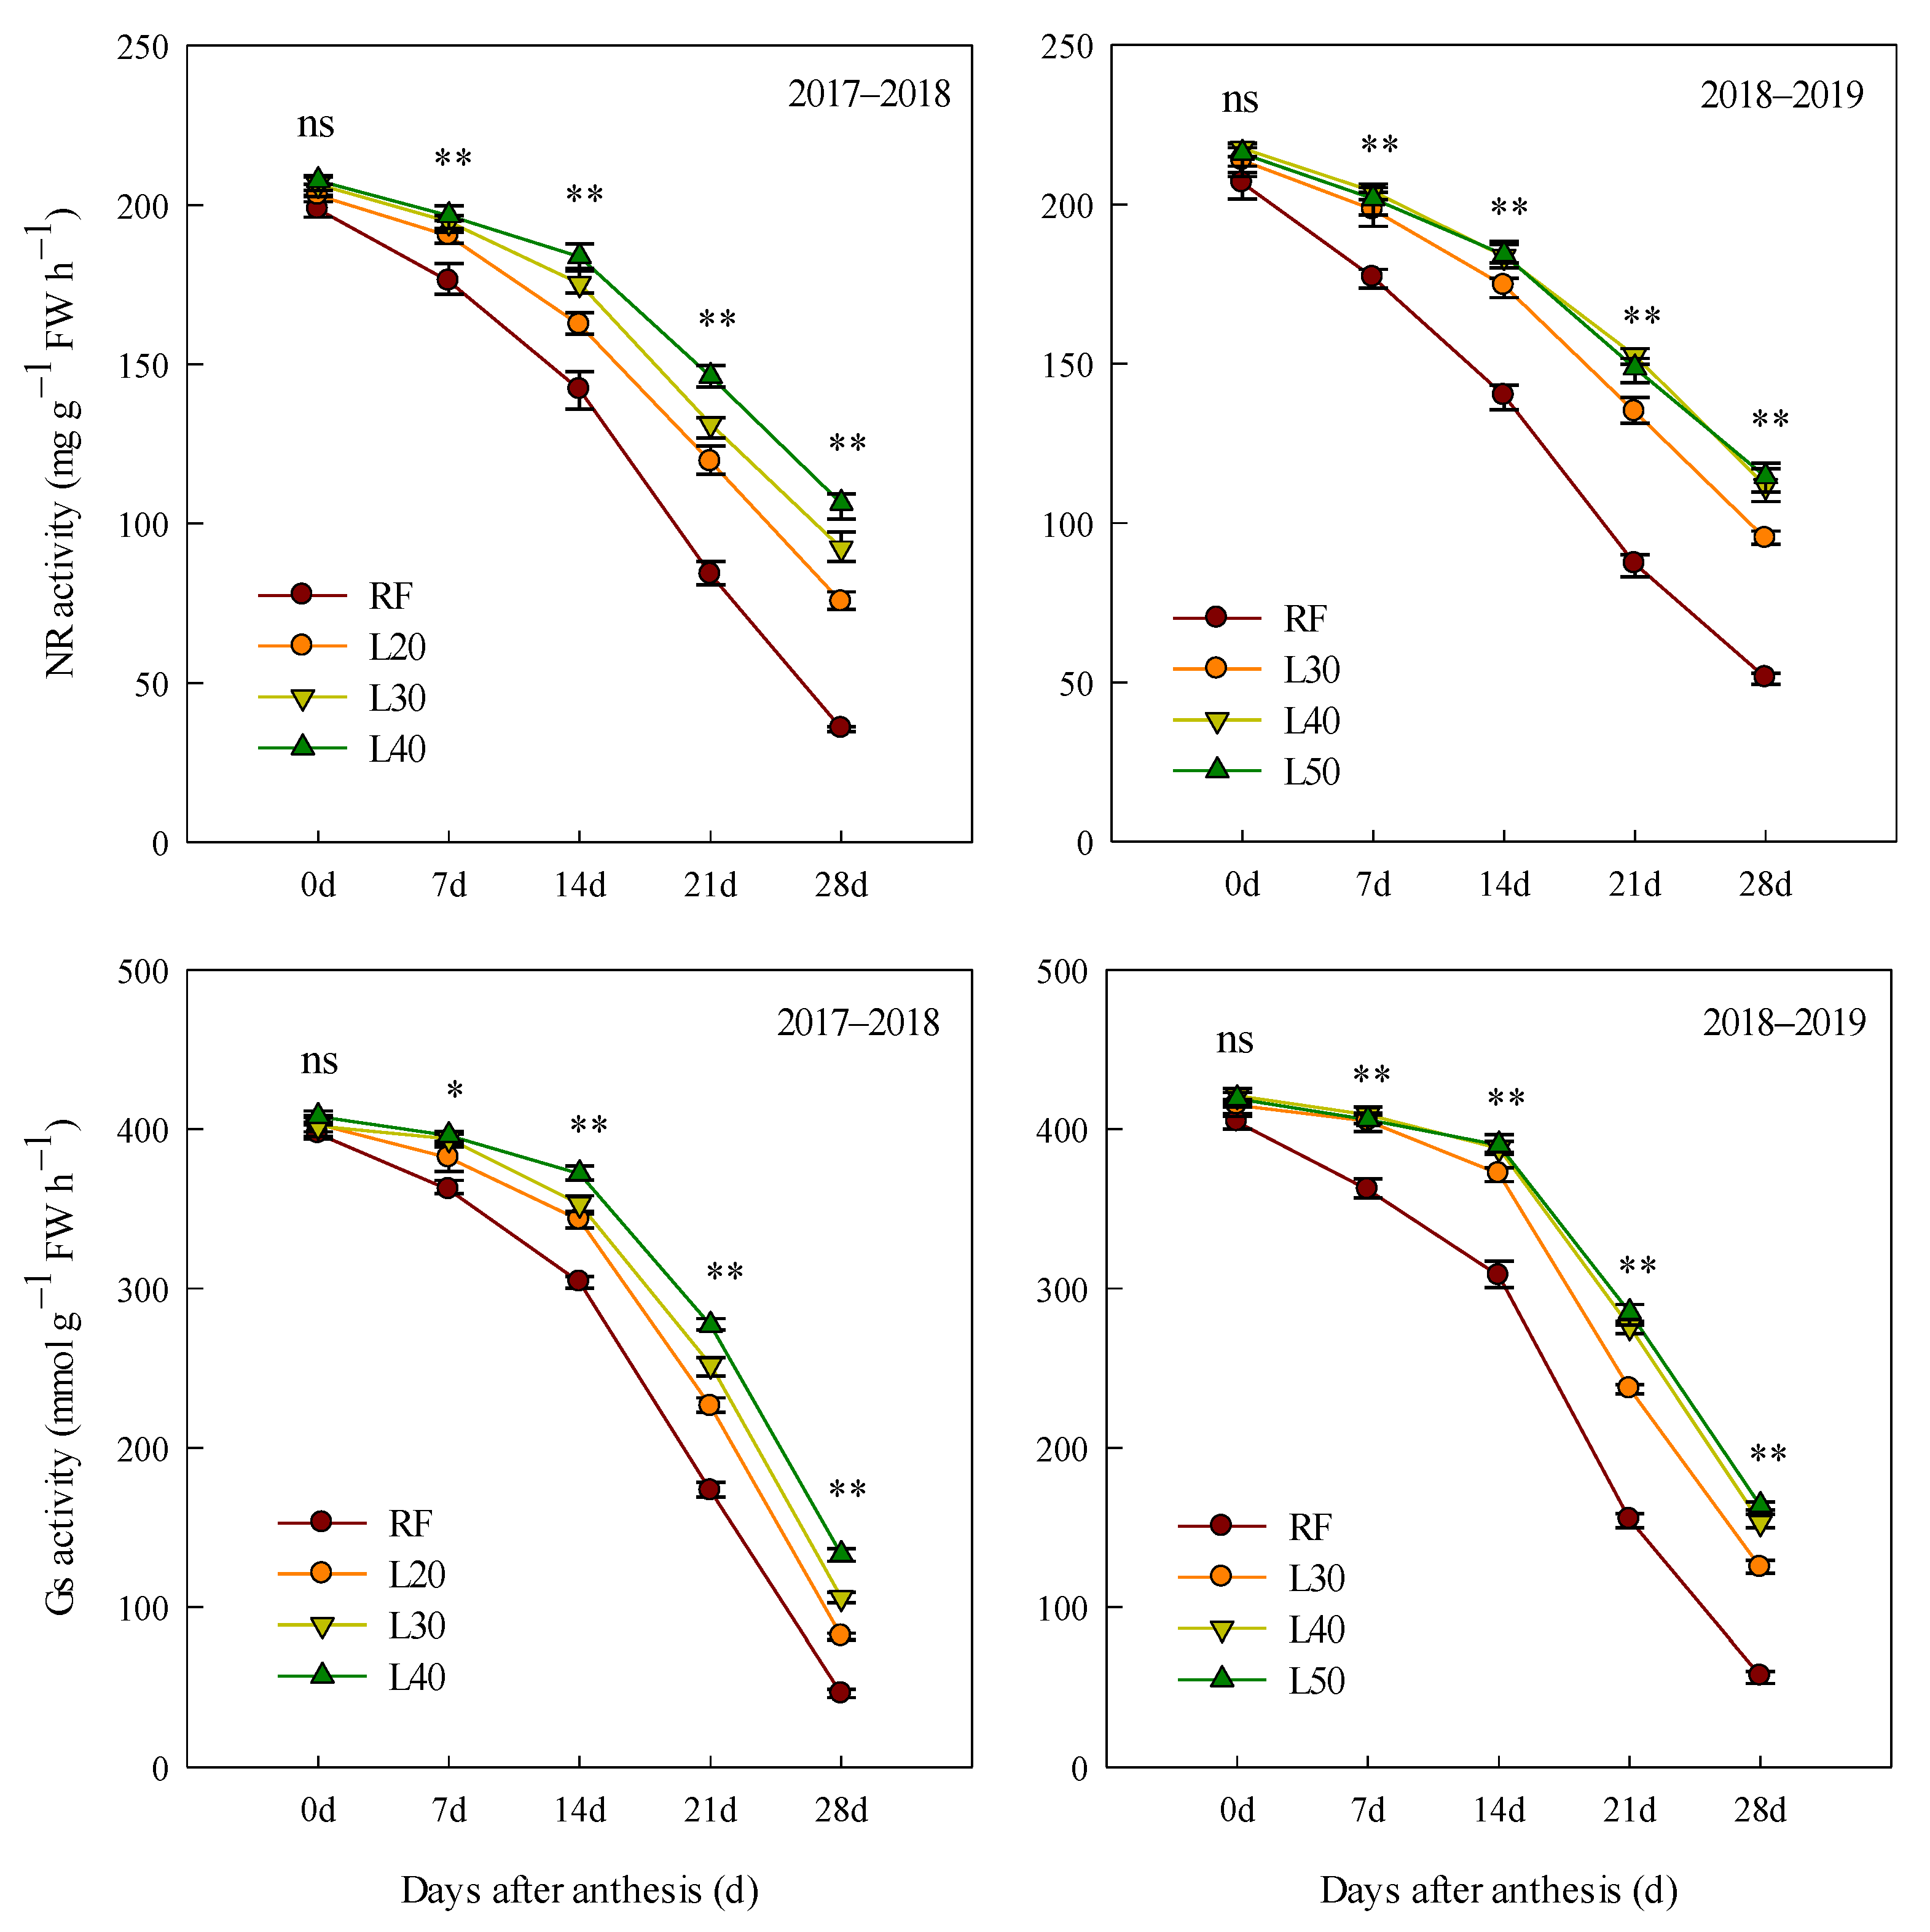
3.3. Nitrogen Metabolizing Enzymes
The NR and GS activities of flag leaves of each treatment gradually decreased after anthesis, and the RF treatment was significantly lower than other treatments (Figure 6). Compared with L40 and L50 treatments, L20 and L30 treatments significantly reduced NR and GS activities in flag leaves from 14 to 28 DAA, while there was no significant difference between L40 and L50 treatments.
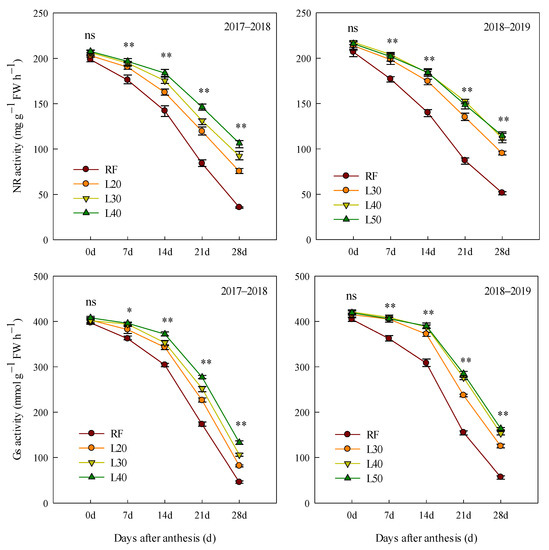
Figure 6.
The NR activity and GS activity after anthesis under different treatments. ns, no significant. *, ** significant at the 0.05 and 0.01 probability levels, respectively. RF: no irrigation. L20, L30, L40, and L50: irrigation with border length of 20, 30, 40, and 50 m, respectively.
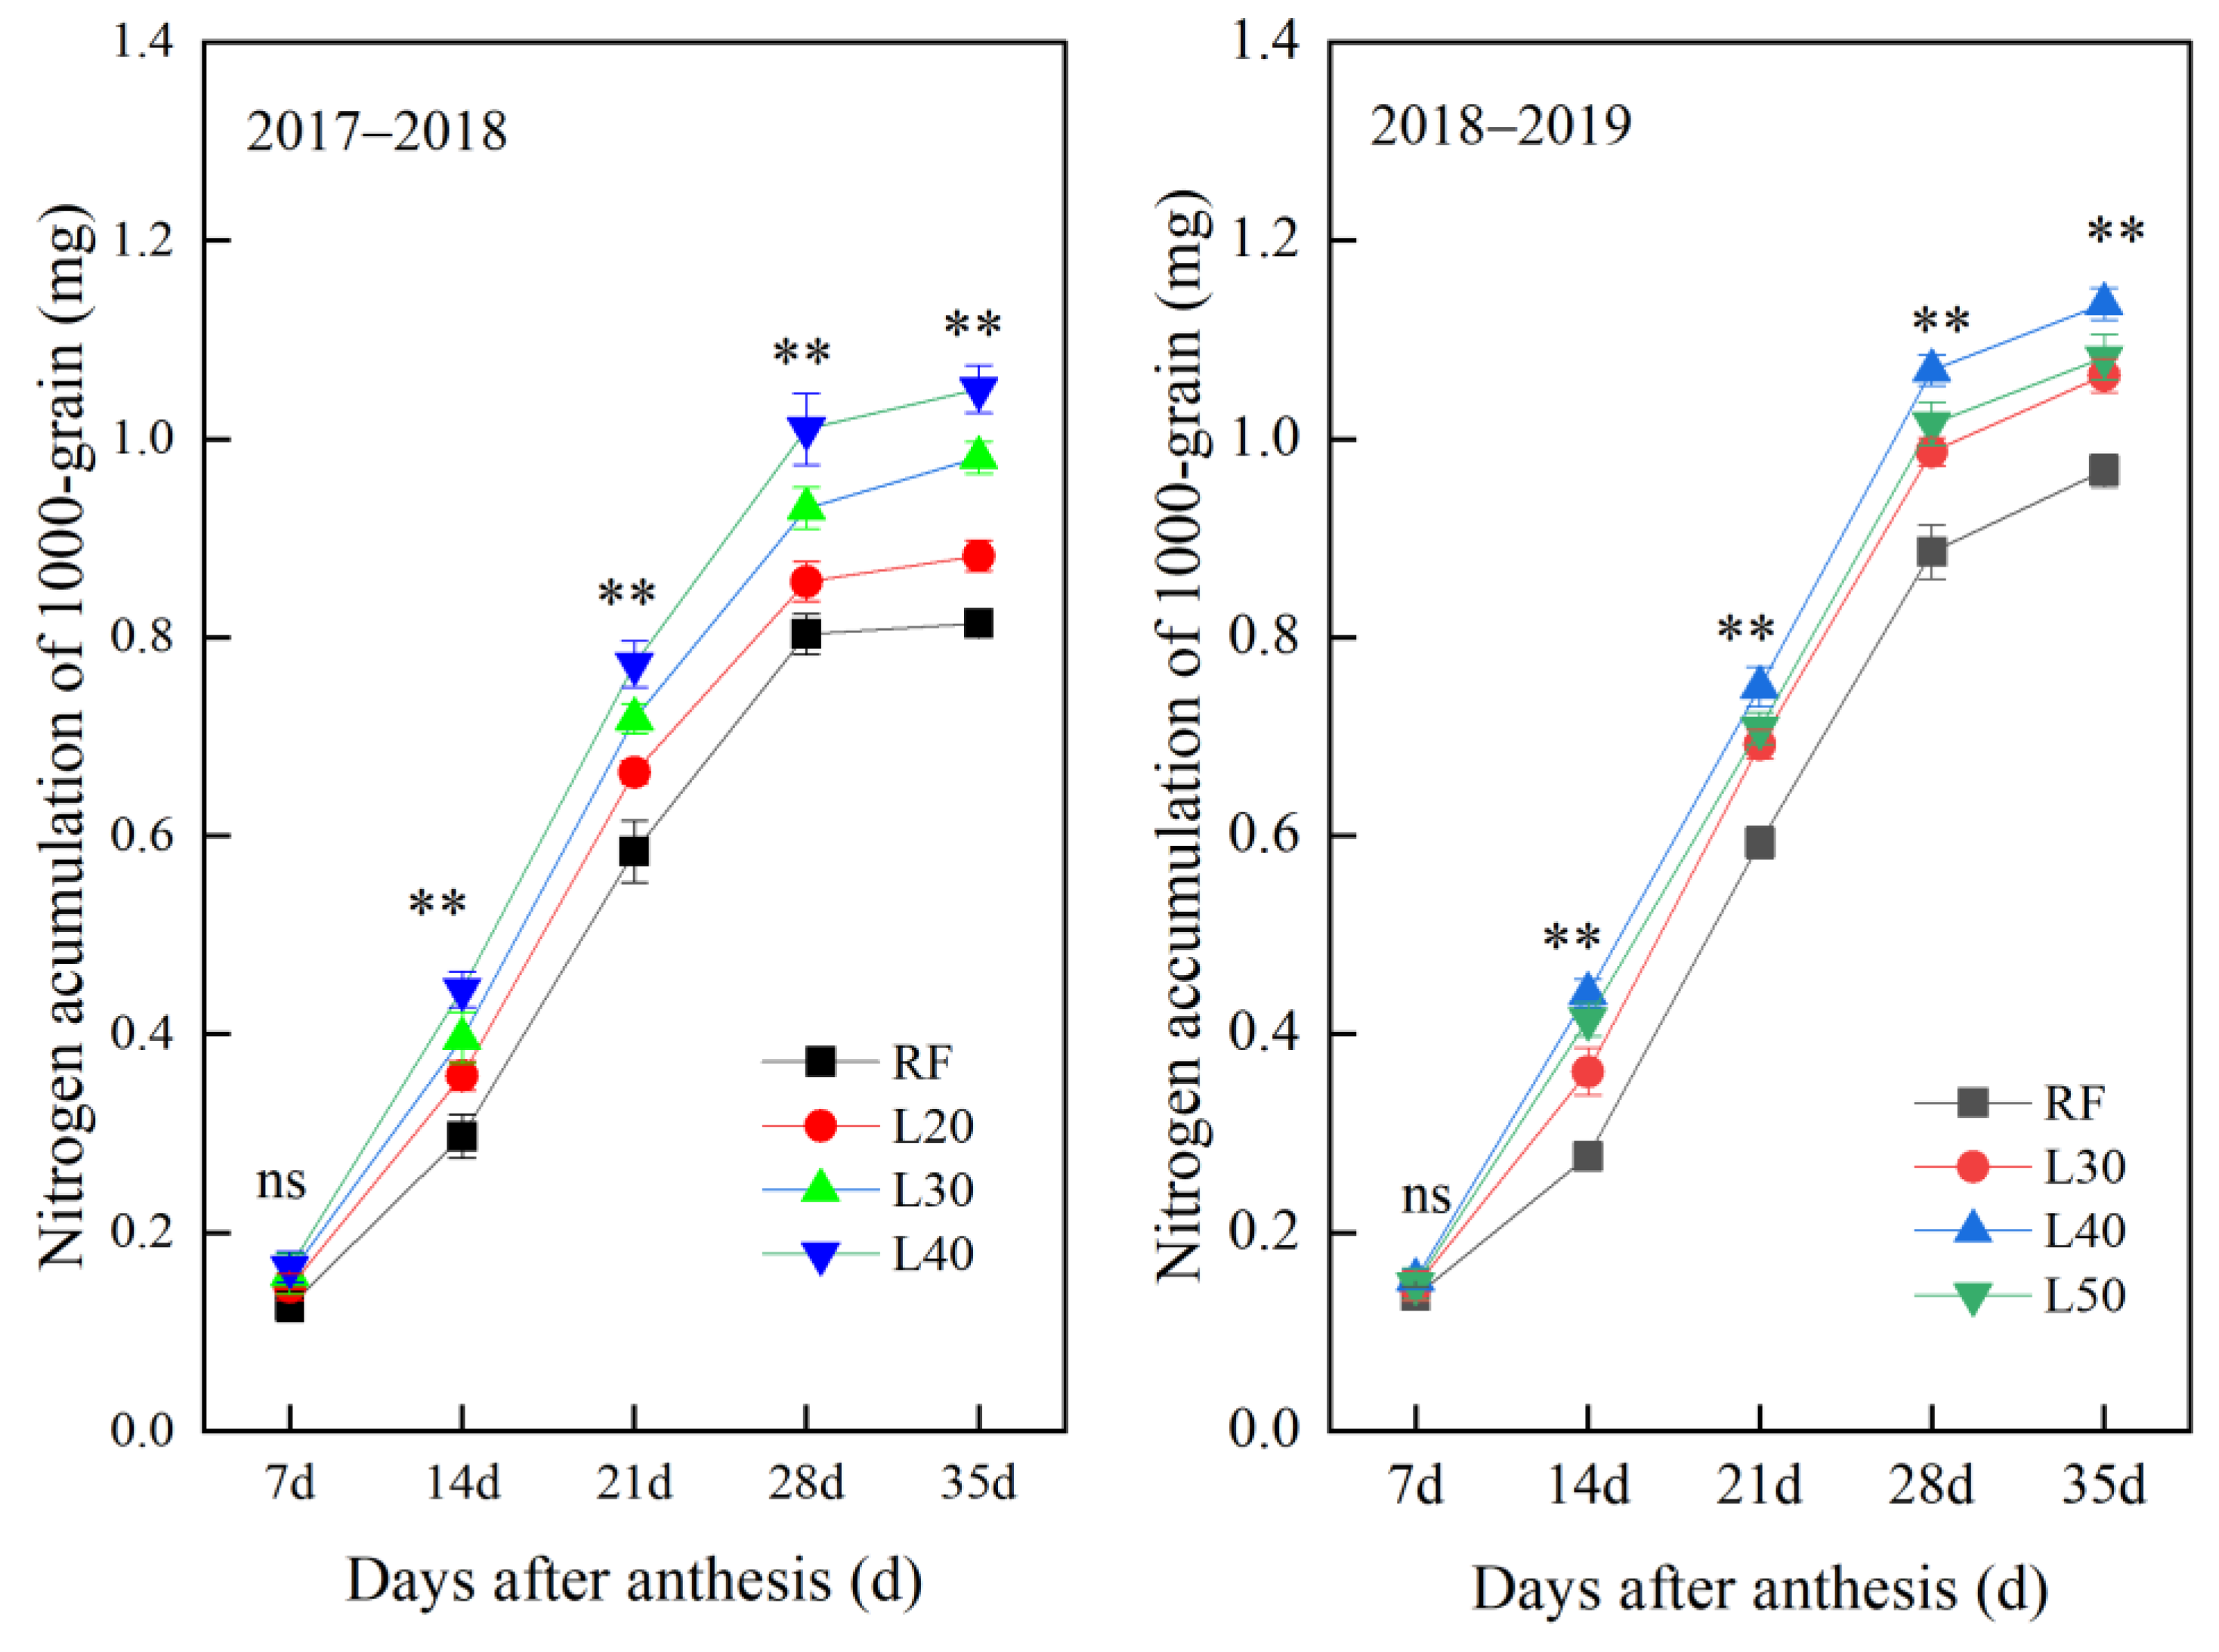
3.4. Grain Nitrogen Accumulation Characteristics
After anthesis, the nitrogen accumulation of 1000-grain gradually increased with the filling process, and reached the highest value at 35 DAA (Figure 7). Border irrigation had a significant effect on grain nitrogen accumulation, L40 treatment was significantly higher than other treatments from 21 to 35 DAA, followed by L50 and L30 treatments, and L20 treatment was the lowest. The grain nitrogen filling fitting equations and parameters of each treatment are shown in Table 3. Irrigation treatment significantly increased the nitrogen accumulation rate in grains. Both Vmax and Vmean were highest in L40 treatment, followed by L50 and L30, and L20 treatment was lower. There was no significant difference between D for each treatments. Therefore, the higher nitrogen accumulation rate after anthesis in L40 treatment was another factor for the higher nitrogen accumulation of grain at maturity.
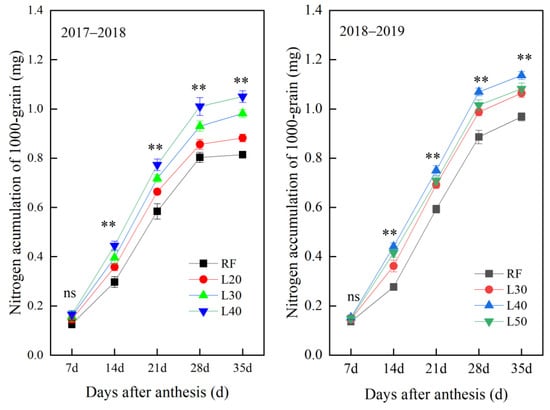
Figure 7.
The nitrogen accumulation of 1000-grain after anthesis under different treatments. ns, no significant. ** significant at the 0.01 probability levels, respectively. RF: no irrigation. L20, L30, L40, and L50: irrigation with border length of 20, 30, 40, and 50 m.
Table 3.
Nitrogen accumulation characteristics of grains after anthesis under different treatments.
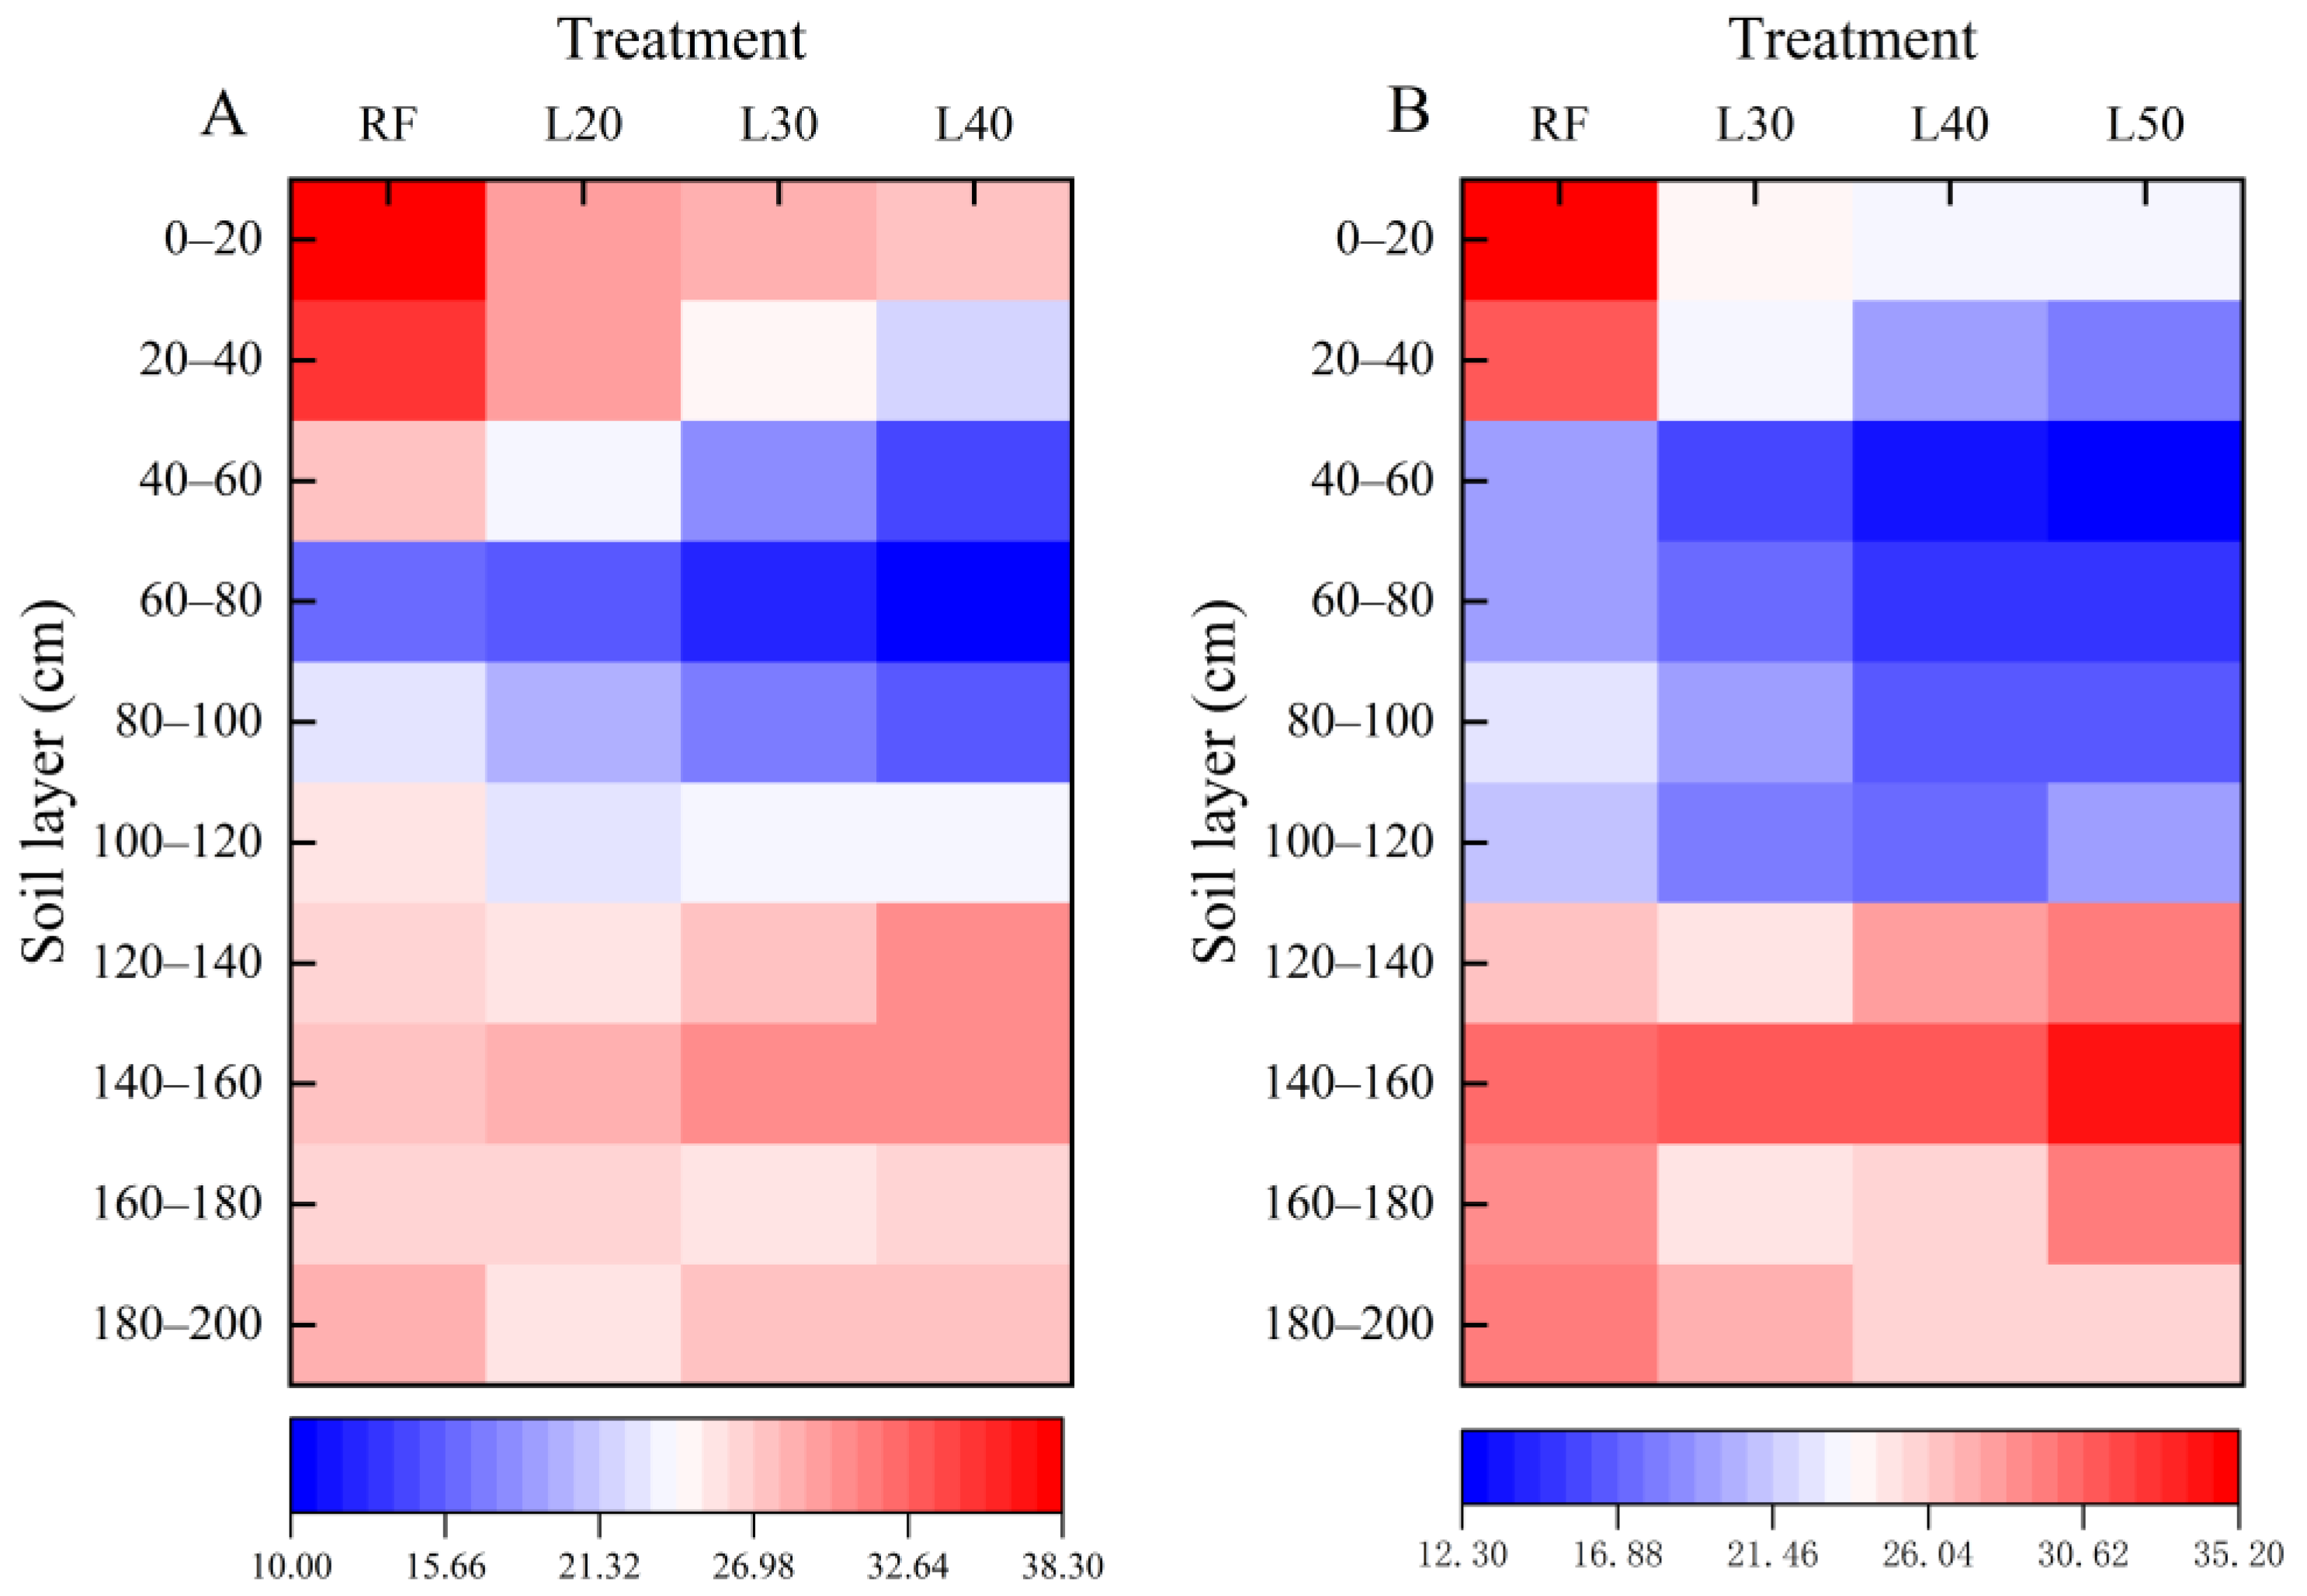
3.5. Soil Nitrate Nitrogen
The residue of soil nitrate nitrogen in 0–200 cm soil layer at maturity of all treatments were first decreased and then increased in the increase in soil layer, and border irrigation had a significant effect on the soil nitrate nitrogen residue (Figure 8). The soil nitrate nitrogen residue in 0–60 cm soil layer of RF was significantly higher than other treatments, and the nitrate nitrogen residue was significantly reduced with the increase in border length. Compared with other treatments, L40 and L50 treatments significantly reduced the residual nitrate nitrogen in the 60–120 cm soil layer. However, due to more irrigation, the nitrate nitrogen residue in deep soil (120–180 cm) of L50 treatment was higher, and the difference between L40 and L30 was not significant, but slightly increased compared with L20.

Figure 8.
The accumulation of nitrate nitrogen (kg·ha−1) in the 0–200 cm soil layer at maturity under different treatments in 2017–2018 (A) and 2018–2019 (B). RF: no irrigation. L20, L30, L40, and L50: irrigation with border length of 20, 30, 40, and 50 m, respectively.
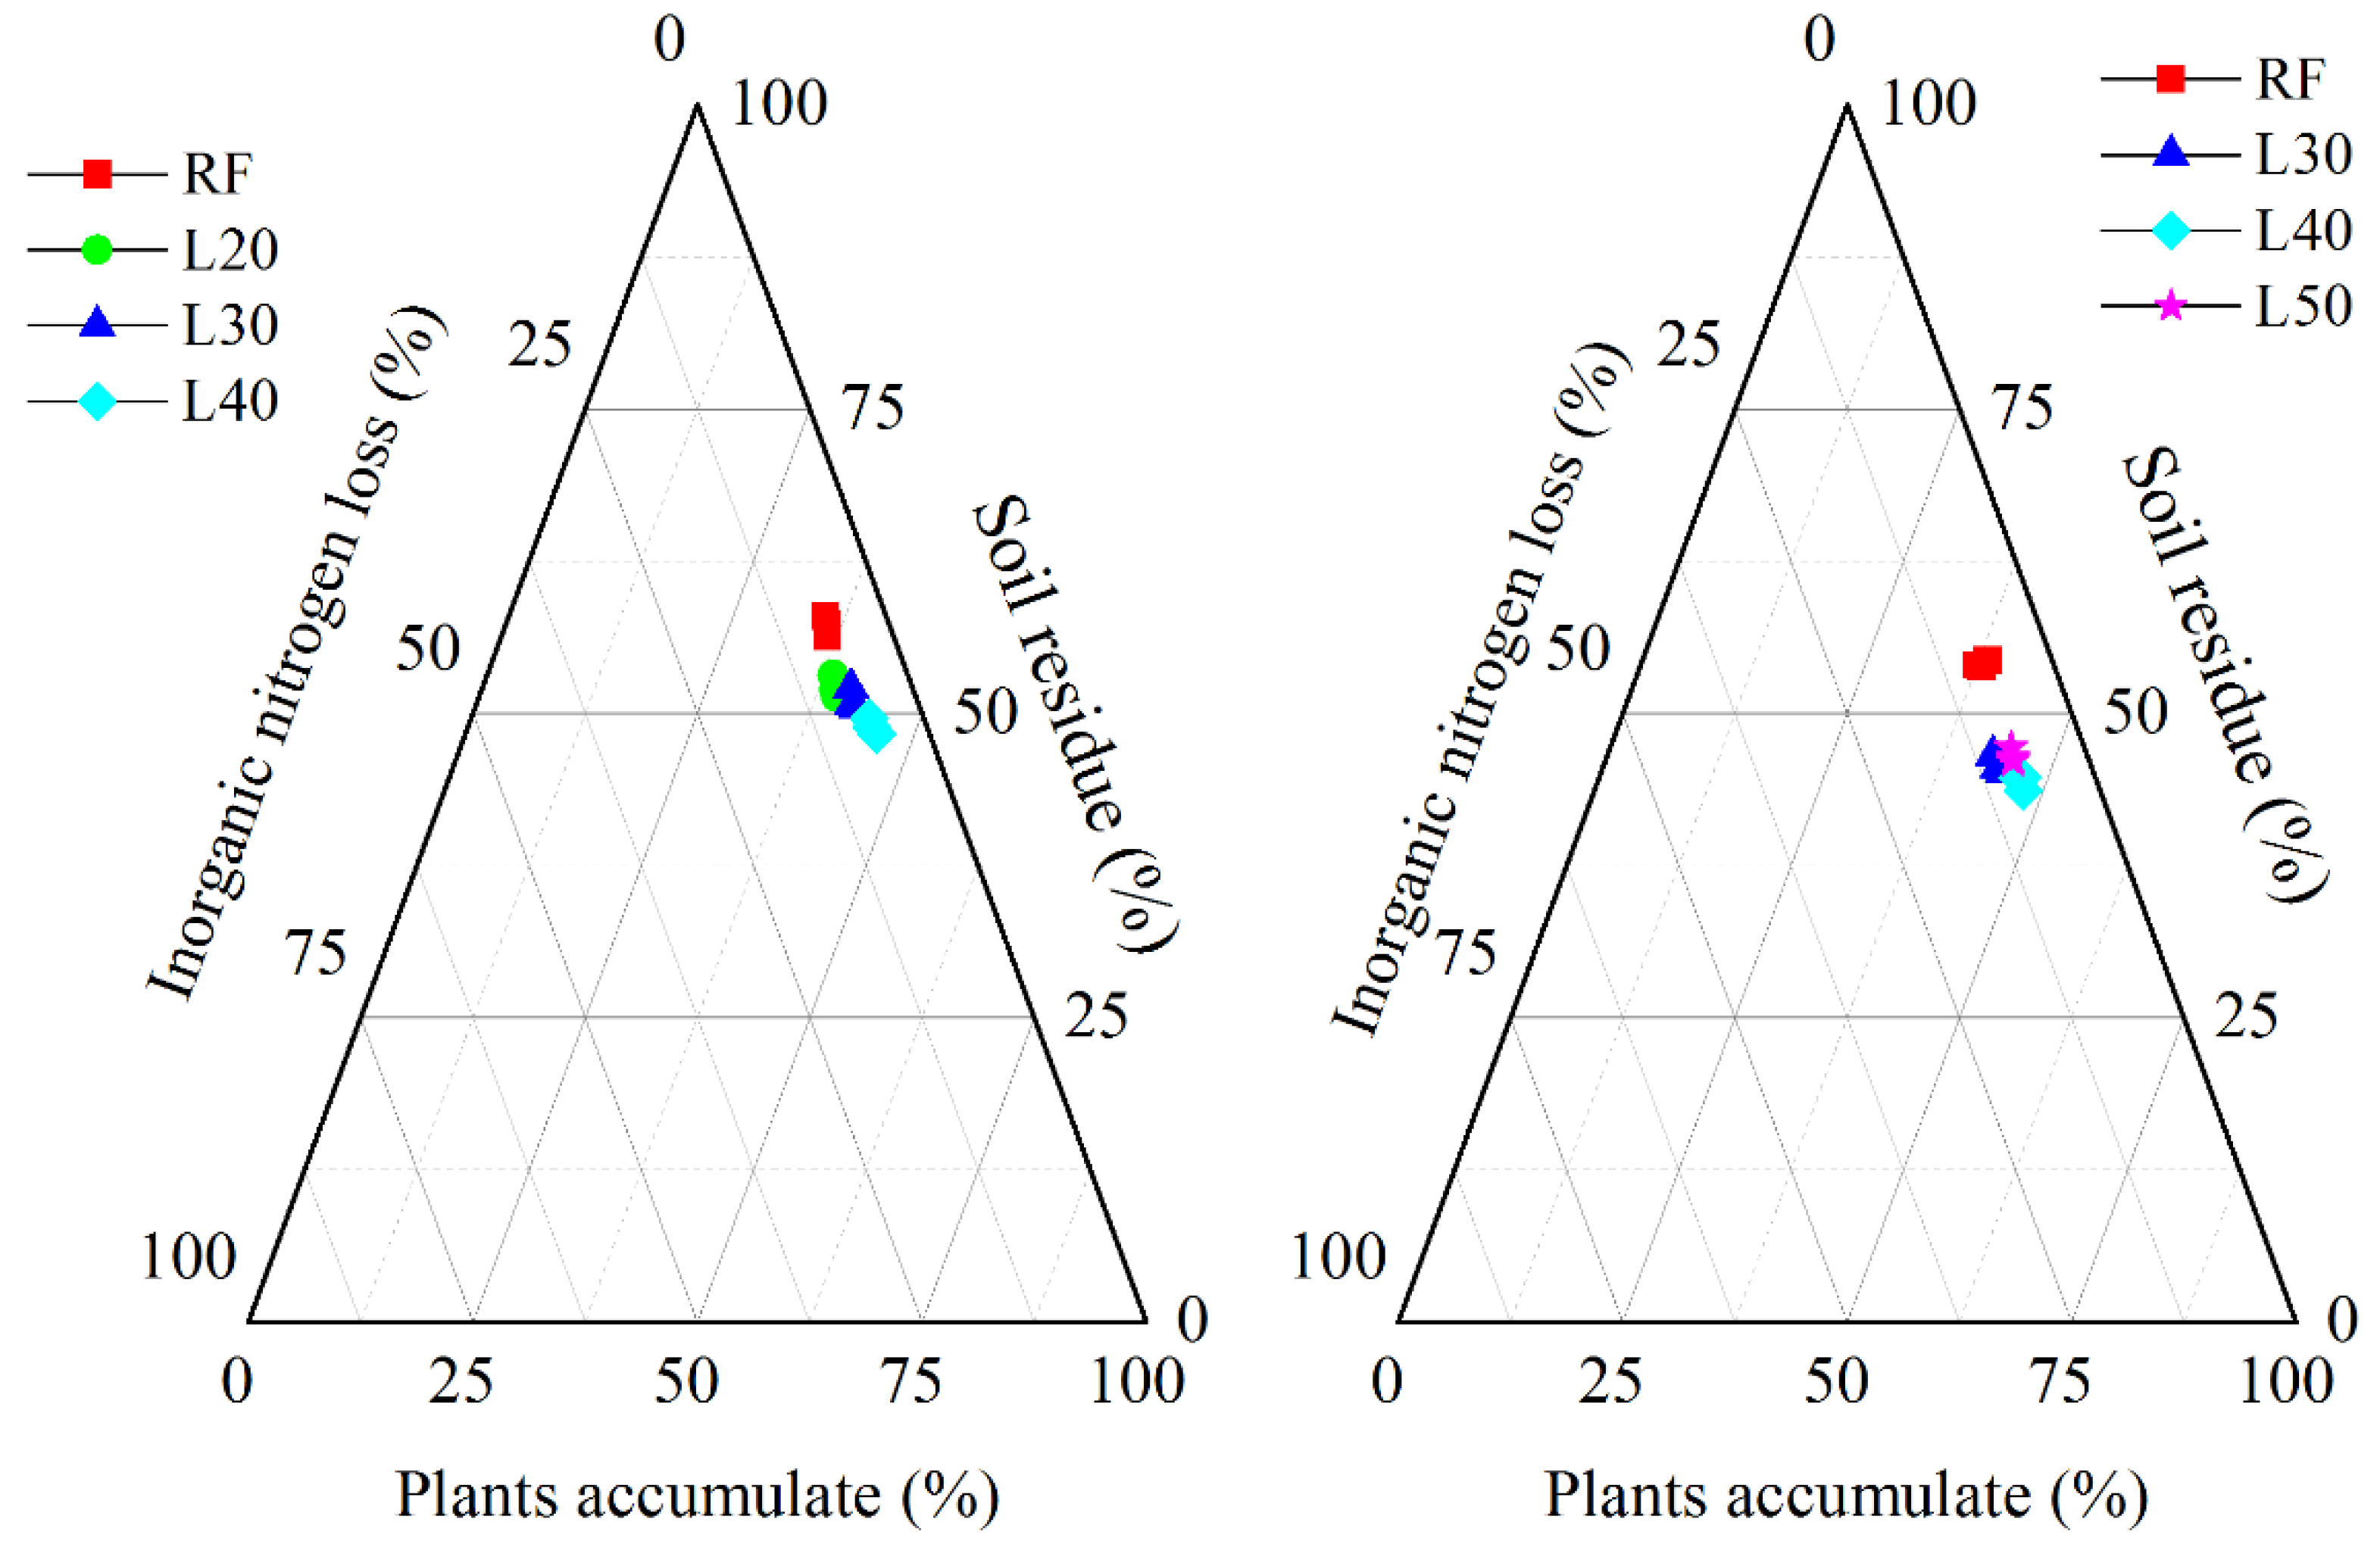
3.6. Direction and Proportion of Soil Inorganic Nitrogen
The direction of soil inorganic nitrogen can be divided into three parts: plant absorption, soil residue, and loss (Figure 9). Border irrigation had a significant impact on plant absorption and soil residue, but has a small effect on soil inorganic nitrogen loss. Therefore, there was no significant difference in the proportion of soil inorganic nitrogen loss in each treatment. With the increase in border length, the proportion of plant uptake increased first and then decreased, with L40 treatment being the highest, followed by L30 and L50, and L20 treatment being lower. However, soil residue was opposite to the law of plant absorption. With the increase in furrow length, soil residue first decreased and then increased, and L40 treatment was the lowest.
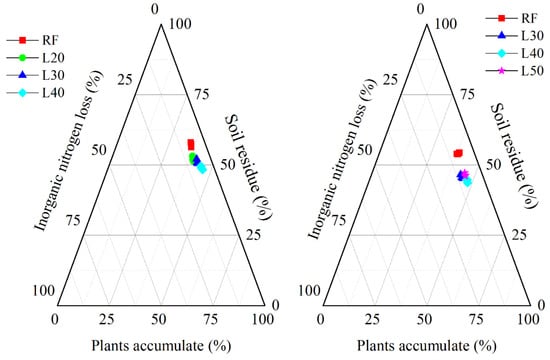
Figure 9.
The fate and proportion of soil inorganic nitrogen under different treatments in 2017–2018 (left) and 2018–2019 (right). RF: no irrigation. L20, L30, L40, and L50: irrigation with border length of 20, 30, 40, and 50 m.
3.7. Grain Yield, Nitrogen Utilization, and Water Productivity
Compared with irrigation treatment, RF significantly reduced grain yield, nitrogen utilization, and water productivity (Table 4). There was no significant difference in grain yield and NFP between L40 and L50, and both were significantly higher than L30 and L20 treatments. Both NUPE, NHI, and WP were significantly higher than other treatments in L40 treatment, followed by L30 and L50, and L20 was lower.
Table 4.
Grain yield, nitrogen utilization, and water productivity under different treatments.
3.8. The Correlation Analysis
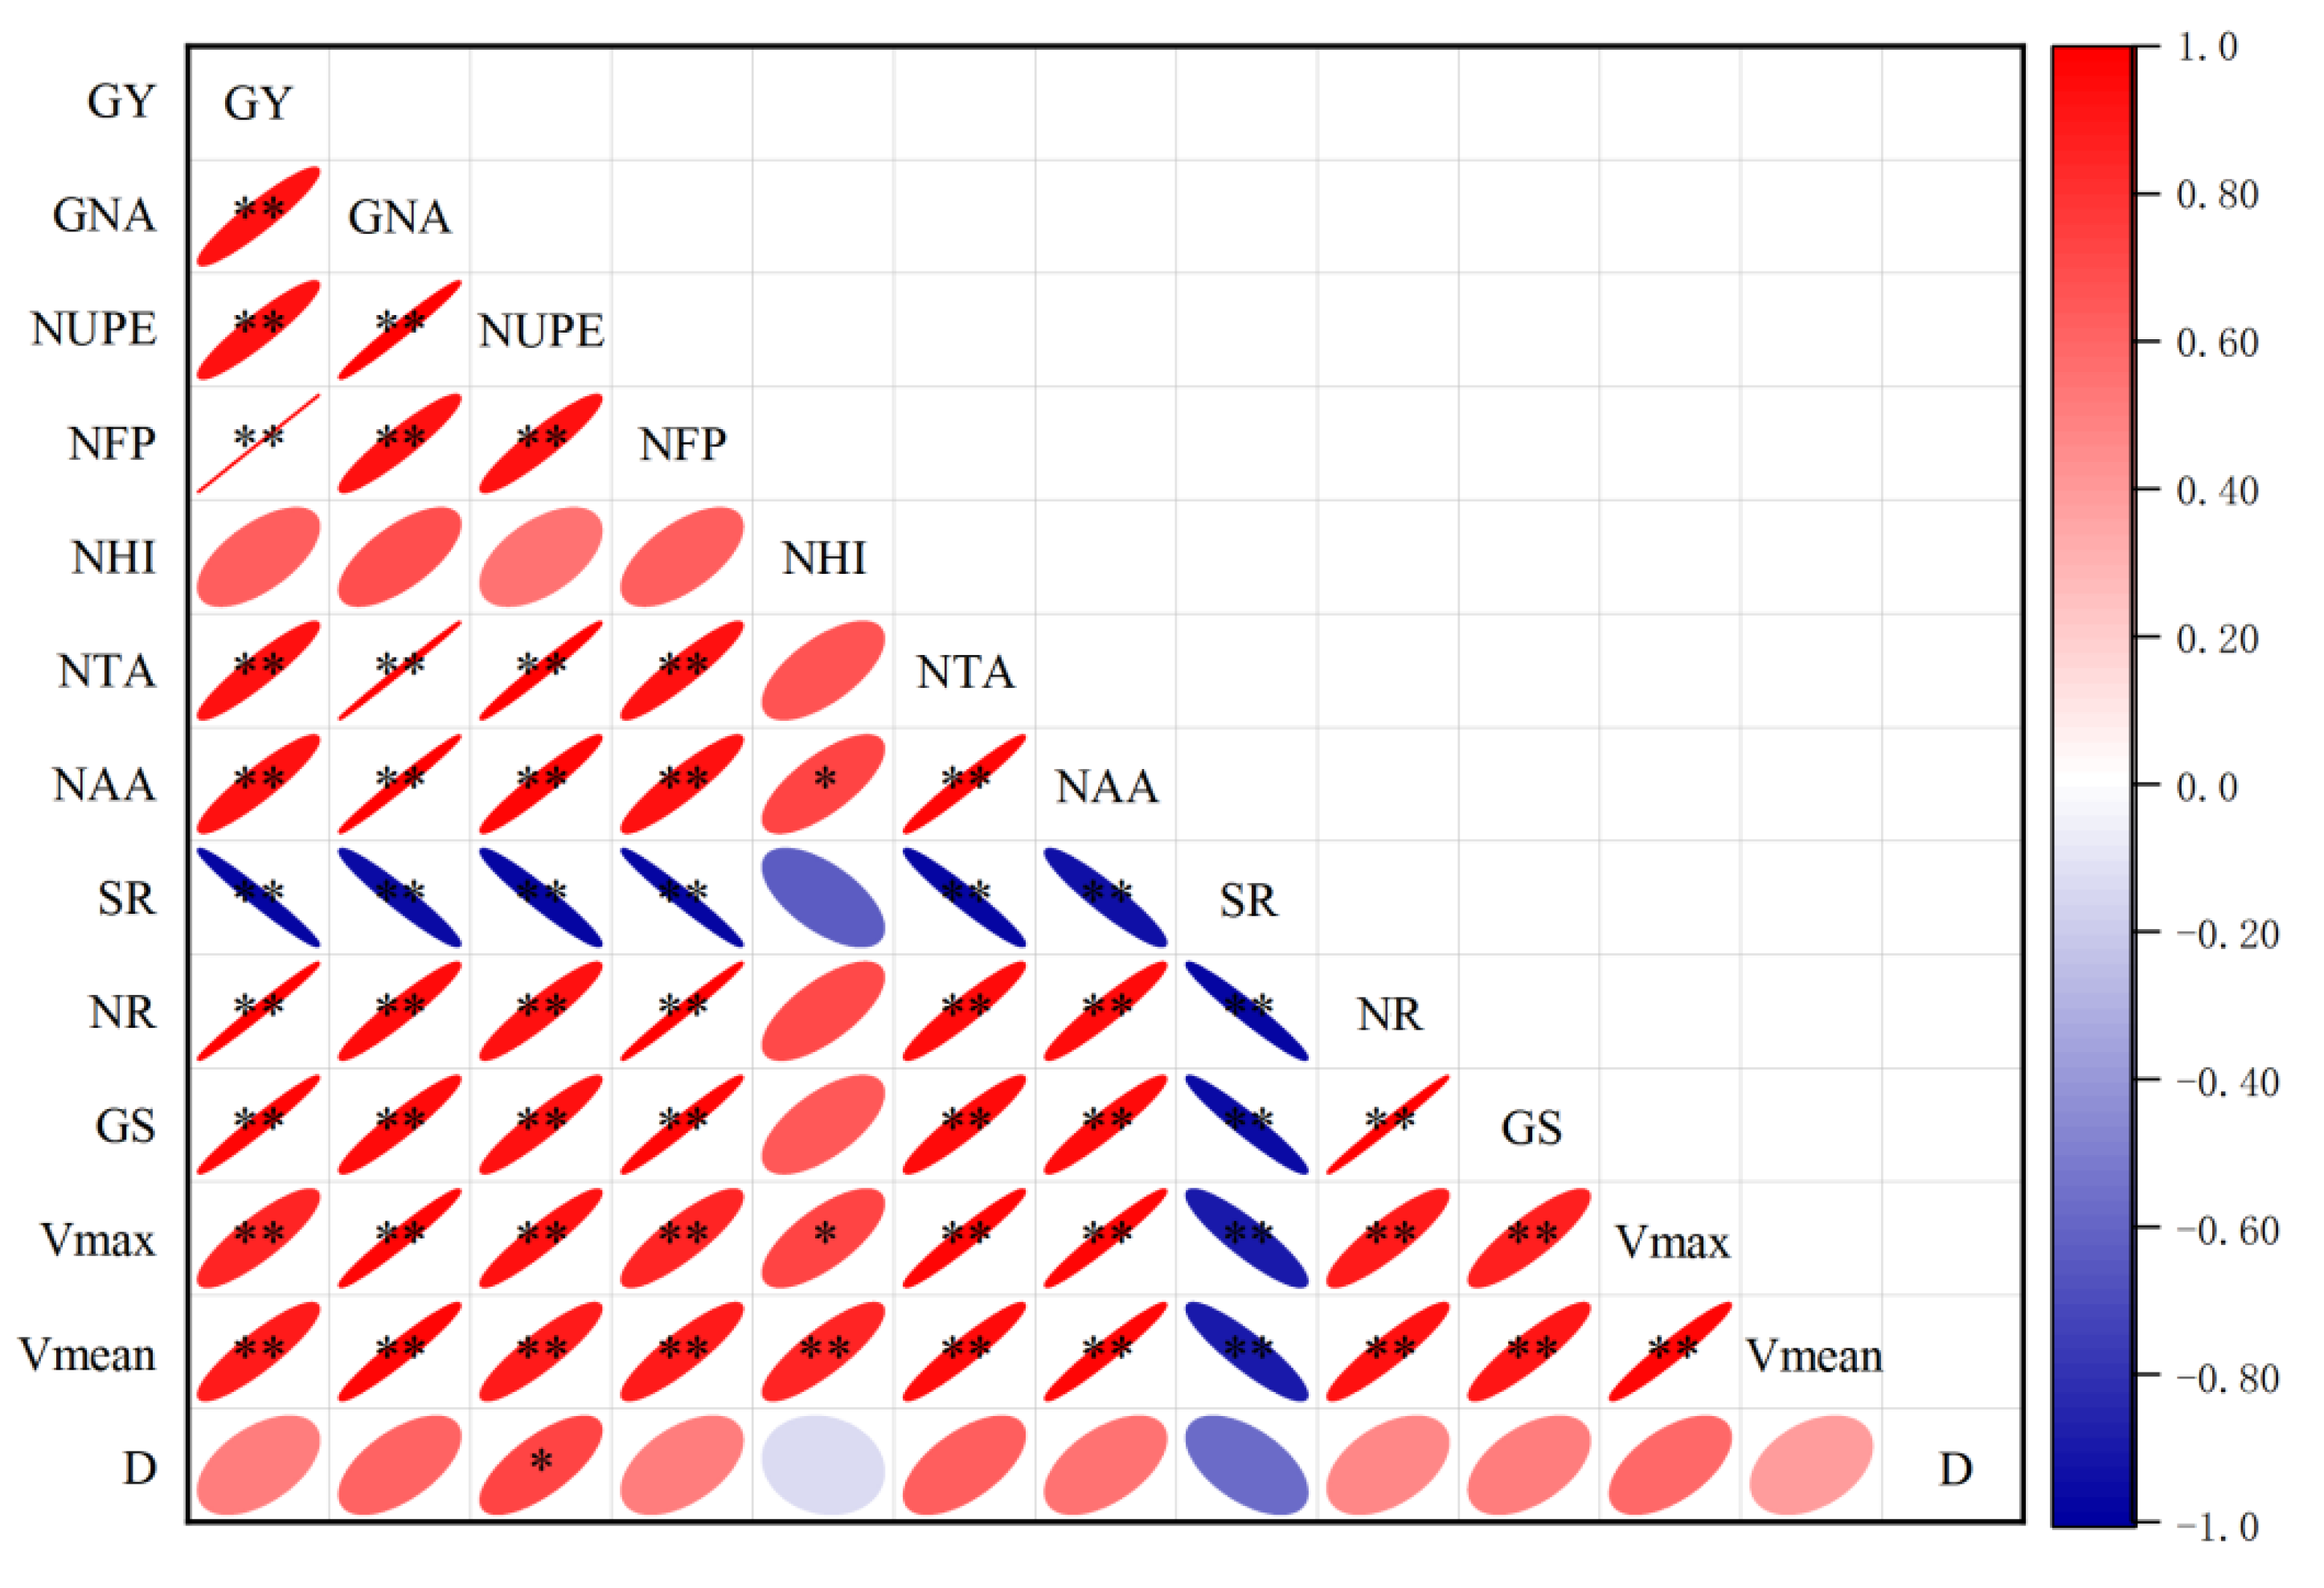
Figure 10 shows the correlation analysis of grain yield, plant nitrogen uptake, utilization indexes, and soil nitrate nitrogen residue. The grain yield, GNA, NUPE, and NFP were significantly positively correlated with NTA, NAA, and nitrogen metabolism enzyme (NR, GS) activity, as well as grain nitrogen filling rate (Vmax, Vmean), while significantly negatively correlated with soil nitrate nitrogen residue. These results indicated that suitable border irrigation can increase the uptake and utilization of soil nitrogen by plants, reduce soil inorganic nitrogen residues, and increase nitrogen utilization efficiency.
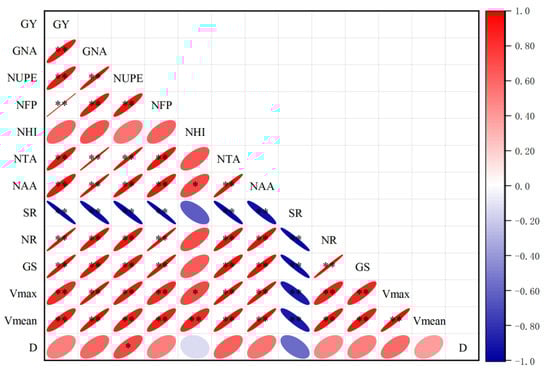
Figure 10.
Correlation analysis of grain yield and related indexes of plant absorption and utilization. GY, grain yield; GNA, grain nitrogen accumulation; NUPE, nitrogen uptake efficiency; NFP, nitrogen fertilizer productivity; NHI, nitrogen harvest index; NTA, nitrogen translocation amount; NAFA, nitrogen accumulation amount after anthesis; SR, soil nitrate nitrogen residue; NR, nitrate reductase; GS, glutamine synthetase; Vmax, the maximum accumulation rate; Vmean, the average accumulation rate; D, the active accumulation period. *, ** significant at the 0.05 and 0.01 probability levels, respectively.
4. Discussion
The availability of nitrogen largely depends on the soil moisture: insufficient or excessive moisture will reduce plant nitrogen accumulation [28]. In the present study, at the anthesis stage, nitrogen accumulation under L40 irrigation was significantly higher than that under irrigation of other border lengths (Figure 4). Compared with the L40 treatment, the L20 and L30 treatments had lower irrigation water volume, and the water stress before anthesis may have reduced the plant’s absorption of soil nitrogen. These findings are consistent with the conclusions of Ashraf et al. [29] that water stress limits the growth and development of crops and significantly reduces the accumulation of carbon and nitrogen in plants. The reason why the plant nitrogen accumulation under L50 with more irrigation was significantly lower than that under L40 treatment may be that higher irrigation water volume retards the death of unproductive tillers after jointing, resulting in the waste of water and nitrogen [30]. The nitrogen in the grain mainly comes from the transportation of nitrogen in the vegetative organs before anthesis [31]. Research by Mon et al. [32] found that increasing irrigation would reduce the transportation in vegetative organs and increases the accumulation of nitrogen in plants after anthesis. Similarly, we found that the L30, L40, and L50 treatments with higher irrigation than the RF and L20 treatments reduced the contribution of the NTA to the grains, while the contribution of NAFA to grains increased (Table 2). However, due to the high nitrogen accumulation under L40 treatment at anthesis, although the proportion of transport contribution decreased, the transport amount was significantly higher than that under irrigation of other treatments, which resulted in a significant increase in nitrogen accumulation in the grain at maturity.
NR and GS are the key enzymes of plant nitrogen metabolism [33]. NR can reduce nitrate to nitrite, which is the rate-limiting enzyme in the process of nitrate assimilation; GS is an enzyme necessary for plant ammonia assimilation, and its activity is an important physiological index for measuring the level of plant nitrogen assimilation [34]. Studies have shown that drought after anthesis will reduce the activities of NR and GS and inhibit nitrogen assimilation in plants [35]. In this study, the activities of NR and Gs in flag leaves under L40 and L50 treatments were significantly higher than those under L20 and L30 treatments in the middle and late anthesis periods (Figure 6), which was caused by their sufficient water supply [36]. However, the activities of NR and GS under L50 treatment did not increase relative to that under L40 treatment, which may be due to increased intra-population competition and decreased nitrogen assimilation in single stems [37].
Grain nitrogen content is one of the important indicators for evaluating wheat grain quality [38], but there is limited information on the characteristics of nitrogen accumulation in wheat grains. In the present study, we measured the accumulation of the 1000-grain nitrogen after anthesis, and fitted the grain nitrogen filling parameters to the logistic growth equation. We found that, compared with irrigation of other border lengths, L40 treatment promoted significantly higher grain nitrogen accumulation by increasing the grain nitrogen accumulation rates (Vmax and Vmean; Figure 7, Table 3). The low rate of nitrogen accumulation in grains under L20 and L30 treatments may be due to low nitrogen transport in vegetative organs, and to water stress, resulting in premature leaf senescence and reduced nitrogen accumulation in plants after anthesis [12]. Compared with that under L40 treatment, the decrease in the grain nitrogen accumulation under L50 treatment was mainly due to excessive irrigation, which caused the plants to retain nitrogen in stems and leaves and mature late; high temperatures in the later growth stage led to their rapid maturity, and the nitrogen accumulation in the stems and leaves was not transferred to the grains [39]. This finding indicates that optimal irrigation might coordinate the source–sink relationship and increase grain nitrogen accumulation.
The large amount of residual nitrate nitrogen in farmland is related to the long-term large-scale fertilization and the pursuit of high yield [40]. Nonetheless, over-irrigation is also an important factor that causes high nitrate nitrogen residue [41]. Studies have shown that proper irrigation can stimulate the root system to grow deep into the soil, maintain root vitality, and increase the plant’s absorption of soil nitrogen after anthesis [42]. In this study, compared with the L40 treatment, the water-stressed L20 and L30 treatments reduced plant nitrogen uptake, and the nitrate nitrogen residue in the 20–100 cm soil layer was higher. In contrast, L50 irrigation resulted in more nitrate nitrogen leaching into deep soil (120–180 cm) and significantly increased nitrate nitrogen residue (Figure 8). This result agrees with those of earlier studies by Liu et al. [43], who found that high irrigation not only leads to the leaching of soil nitrogen, but also results in shallow root distribution, thereby reducing the uptake and utilization of deep soil nitrogen. These results show that proper border irrigation can increase nitrogen absorption by plants and reduce residual nitrate nitrogen.
Research conducted by Wang et al. [44] in the HPC showed that in different wheat growing seasons, the irrigation amount is 50–172 mm, and the average irrigation amount is 101.8 mm, enough to ensure high wheat yield. However, many farmers in this area irrigate three to six times during the wheat growth period, which greatly increases the risk of nitrogen leaching, and over-irrigation leads to a decrease in water and nitrogen use efficiency [45]. Wang et al. [46] found that increasing irrigation to 70 mm increases ammonia volatilization and nitrogen denitrification loss and reduces nitrogen use efficiency by 2.0 kg·kg−1. Moderate irrigation promotes both high yield and water and nitrogen utilization. Compared with 60 mm irrigation, 120 mm irrigation treatment increases grain yield, water productivity, and nitrogen fertilizer productivity by 1408 kg·ha−1, 2.8 kg·ha−1·mm−1, and 7.6 kg·kg−1, respectively [17]. In this study, compared with the parameter values under L20 and L30 treatments, grain yield, nitrogen uptake efficiency, nitrogen harvest index, nitrogen fertilizer productivity, and water productivity were significantly increased under L40 irrigation (Table 4). No significant difference in grain yield between L40 and L50 treatments was observed, but the high irrigation volume of L50 treatment resulted in an increase in total water consumption and residual nitrate nitrogen, and water and nitrogen utilization was significantly lower than that under L40 treatment. In summary, irrigation with a border length of 40 m can effectively increase the utilization of water and nitrogen and maintain high grain yield. This study provides farmers with a low-cost, easy-to-operate irrigation method to improve water and nitrogen utilization, which is significant for the alleviation of decline and pollution of groundwater in HPC.
5. Conclusions
Compared with other treatments, irrigation with 40 m border length significantly improves the absorption and transport of nitrogen by wheat, and optimizes grain yield and water and nitrogen use efficiency were both the highest. The GNA, NUPE, and NFT were significantly positively correlated with NTA and NAA, while significantly negatively correlated with soil nitrate nitrogen residue. It shown that optimized border irrigation mainly improves nitrogen utilization by improving plant nitrogen absorption and transportation and reducing soil residues. Optimized border irrigation can reduce water input and increase nitrogen utilization, which is of great significance to the sustainable development of wheat agriculture.
Author Contributions
Conceptualization, F.Y. and Y.S.; Investigation, F.Y.; Data analysis, F.Y.; Writing—original draft preparation, F.Y.; Writing—review and editing, Y.S. and Z.Y.; Funding acquisition, Y.S. All authors have read and agreed to the published version of the manuscript.
Funding
This study was supported by the National Natural Science Foundation of China (32172114, 31771715); China Agriculture Research System of MOF and MARA (CARS-03).
Data Availability Statement
The data used to support the findings of this study are available from the corresponding author upon request.
Conflicts of Interest
The authors declare no conflict of interest.
References
- Fu, W.; Fan, J.; Hao, M.D.; Hu, J.S.; Wang, H. Evaluating the effects of plastic film mulching patterns on cultivation of winter wheat in a dryland cropping system on the Loess Plateau, China. Agric Water Manag. 2021, 244, 106550. [Google Scholar] [CrossRef]
- National Bureau of Statistic of China. China Statistical Year Book; China Statistics Press: Beijing, China, 2020. [Google Scholar]
- Yuan, Z.; Yan, D.H.; Yang, Z.Y.; Yin, J.; Yuan, Y. Temporal and spatial variability of drought in Huang-Huai-Hai River Basin, China. Appl. Climato. 2015, 122, 755–769. [Google Scholar] [CrossRef]
- Feng, S.W.; Gu, S.B.; Zhang, H.B.; Wang, D. Root vertical distribution is important to improve water use efficiency and grain yield of wheat. Field Crops Res. 2017, 214, 131–141. [Google Scholar] [CrossRef]
- Li, M.; Zhang, K.P.; Eldoma, I.M.; Fang, Y.J.; Zhang, F. Plastic film mulching sustains high maize (Zea mays L.) grain yield and maintains soil water balance in semiarid environment. Agronomy 2020, 10, 600. [Google Scholar] [CrossRef] [Green Version]
- Xu, J.T.; Cai, H.J.; Wang, X.Y.; Li, L.; Ma, C.G.; Lu, Y.J. Evaluation and optimization of border irrigation in different irrigation seasons based on temporal variation of infiltration and roughness. Agric. Water Manag. 2019, 214, 64–77. [Google Scholar] [CrossRef]
- Cui, Z.L.; Chen, X.P.; Zhang, F.S.; Shi, L.W.; Li, J.L. Effect of different border lengths on the irrigation homogeneity and soil nitrate-N distribution on wheat field. Chin. J. Eco-Agric. 2006, 14, 82–85. [Google Scholar]
- Zhou, B.W.; Serret, M.D.; Pie, J.B.; Shah, S.S.; Li, Z.J. Relative contribution of nitrogen absorption, remobilization, and partitioning to the ear during grain filling in Chinese winter wheat. Front. Plant Sci. 2018, 10, 3389. [Google Scholar] [CrossRef]
- Du, Y.D.; Niu, W.Q.; Zhang, Q.; Cui, B.J.; Zhang, Z.H.; Wang, Z.; Sun, J. A synthetic analysis of the effect of water and nitrogen inputs on wheat yield and water- and nitrogen-use efficiencies in China. Field Crops Res. 2021, 265, 108105. [Google Scholar] [CrossRef]
- Jin, X.K.; Ma, M.T.; Zhao, T.K. Effect of nitrogen application on yield, water and nitrogen use efficiency of winter wheat under irrigation based on measured soil moisture content. Sci. Agric. Sin. 2018, 51, 1334–1344. [Google Scholar]
- Gu, X.B.; Cai, H.J.; Chen, P.P.; Li, Y.P.; Fang, H.; Li, Y.N. Ridge-furrow film mulching improves water and nitrogen use efficiencies under reduced irrigation and nitrogen applications in wheat field. Field Crops Res. 2021, 270, 108214. [Google Scholar] [CrossRef]
- Wu, B.J.; Shang, Y.Q.; Wang, S.; Hu, X.H.; Zhang, R.; Wang, D. Response of nitrogen redistribution to irrigation at jointing in winter wheat. Agron. J. 2021, 113, 381–396. [Google Scholar] [CrossRef]
- Puntel, L.A.; Sawyer, J.E.; Barker, D.W.; Dietzel, R.; Poffenbarger, H.; Castellano, M.J.; Moore, K.J.; Thorburn, P.; Archontoulis, S.V. Modeling long-term corn yield response to nitrogen rate and crop rotation. Front Plant Sci. 2016, 7, 1630. [Google Scholar] [CrossRef] [PubMed]
- Rathore, V.S.; Nathawat, N.S.; Bhardwaj, S.; Sasidharan, R.P.; Yadav, B.M.; Kumar, M.; Yadav, O.P. Yield, water and nitrogen use efficiencies of sprinkler irrigated wheat grown under different irrigation and nitrogen levels in an arid region. Agric. Water Manag. 2017, 87, 232–245. [Google Scholar] [CrossRef]
- Sui, J.; Wang, J.D.; Gong, S.H.; Xu, D.; Zhang, Y.Q. Effect of nitrogen and irrigation application on water movement and nitrogen transport for a wheat crop under drip irrigation in the North China Plain. Water 2015, 7, 6651–6672. [Google Scholar] [CrossRef]
- Kaiser, D.E.; Mallarino, A.P.; Sawyer, J.E. Utilization of poultry manure phosphorus for corn production. Soil Sci. Soc. Am. J. 2010, 74, 2211–2222. [Google Scholar] [CrossRef]
- Li, J.P.; Zhang, Z.; Yao, C.S.; Liu, Y.; Wang, Z.M.; Fang, B.T.; Zhang, Y.H. Improving winter wheat grain yield and water-/nitrogen-use efficiency by optimizing the micro-sprinkling irrigation amount and nitrogen application rate. J. Integr. Agric. 2021, 20, 606–621. [Google Scholar] [CrossRef]
- Li, Y.; Huang, G.H.; Chen, Z.J.; Xiong, Y.W.; Huang, Q.Z.; Xu, X.; Huo, Z.L. Effects of irrigation and fertilization on grain yield, water and nitrogen dynamics and their use efficiency of spring wheat farmland in an arid agricultural watershed of Northwest China. Agric. Water Manag. 2022, 260, 107277. [Google Scholar] [CrossRef]
- Lu, J.S.; Xiang, Y.Z.; Fan, J.L.; Zhang, F.C.; Hu, T.T. Sustainable high grain yield, nitrogen use efficiency and water productivity can be achieved in wheat-maize rotation system by changing irrigation and fertilization strategy. Agric. Water Manag. 2021, 258, 107177. [Google Scholar] [CrossRef]
- Ju, X.T.; Kou, C.L.; Zhang, F.S.; Christie, P. Nitrogen balance and groundwater nitrate contamination: Comparison among three intensive cropping systems on the North China Plain. Environ. Pollut. 2006, 143, 117–125. [Google Scholar] [CrossRef] [Green Version]
- Ji, C.Y.; Shi, Y.; Zhang, Y.L.; Yu, Z.W. Effect of inflow cutoff for border irrigation on water distribution in the boeder, water consumption characteristics and grain yield of wheat. J. Soil Water Conserv. 2014, 28, 95–99. [Google Scholar]
- Yin, L.J.; Dai, X.L.; He, M.R. Delayed sowing improves nitrogen utilization efficiency in winter wheat without impacting yield. Field Crops Res. 2018, 221, 90–97. [Google Scholar] [CrossRef]
- Liu, Z.X.; Gao, F.; Yang, J.Q.; Zhen, X.Y.; Li, Y.; Zhao, J.H.; Li, J.R.; Qian, B.C.; Yang, D.Q.; Li, X.D. Photosynthetic characteristics and uptake and translocation of nitrogen in peanut in a wheat-peanut rotation system under different fertilizer management regimes. Front. Plant Sci. 2019, 10, 86. [Google Scholar] [CrossRef] [PubMed]
- Rehman, M.; Yang, M.; Fahad, S.; Saleem, M.H.; Liu, L.; Liu, F.; Deng, G. Morphophysiological traits, antioxidant capacity, and N metabolism in ramie under N fertilizer. Agron. J. 2020, 112, 2988–2997. [Google Scholar] [CrossRef]
- Zhang, H.; Huang, Z.; Wang, J.; Wang, Z.; Yang, J. Changes in morphological and physiological traits of roots and their relationships with grain yield during the evolution of mid-season indica rice cultivars in Jiangsu province. Acta Agron. Sin. 2011, 37, 1020–1030. [Google Scholar] [CrossRef]
- Graham, S.L.; Laubach, J.; Hunt, J.E.; Graeme, N.D.; Carrick, S.; Whitehead, D. Irrigation and grazing management affect leaching losses and soil nitrogen balance of lucerne. Agric. Water Manag. 2022, 259, 107233. [Google Scholar] [CrossRef]
- Wu, B.J.; Zhang, H.B.; Wang, D. Timely supplemental irrigation changed nitrogen use of wheat by regulating root vertical distribution. J. Plant Nutr. Soil Sci. 2018, 181, 396–408. [Google Scholar] [CrossRef]
- Zhang, J.; Chen, Y.Y.; Liu, W.H.; Guo, Z.G. Effect of alternate partial root-zone drying (PRD) on soil nitrogen availability to alfalfa. Agric. Water Manag. 2021, 258, 107167. [Google Scholar] [CrossRef]
- Ashraf, U.; Salim, M.N.; Sabir, S.R.; Khan, A.; Pan, S.G.; Tang, X.R. Maize growth, Yield formation and water-nitrogen usage in response to varied irrigation and nitrogen supply under semi-arid climate. Turk. J. Field Crops 2016, 21, 88–96. [Google Scholar] [CrossRef]
- Shang, Y.Q.; Lin, X.; Li, P.; Gu, S.B.; Lei, K.Y.; Wang, S.; Wang, D. Effects of supplemental irrigation at the jointing stage on population dynamics, grain yield, and water-use efficiency of two different spike-type wheat cultivars. PLoS ONE 2020, 15, e023048. [Google Scholar] [CrossRef] [Green Version]
- Annunziata, M.G.; Ciamiello, L.F.; Woodrow, P.; Maximova, E.; Fuggi, A.; Carillo, P. Durum wheat roots adapt to salinity remodeling the cellular content of nitrogen metabolites and sucrose. Front. Plant Sci. 2017, 7, 2035. [Google Scholar] [CrossRef] [Green Version]
- Mon, J.; Bronson, K.F.; Hunsaker, D.J.; Thorp, K.R.; White, J.W.; French, A.N. Interactive effects of nitrogen fertilization and irrigation on grain yield, canopy temperature, and nitrogen use efficiency in overhead sprinkler-irrigated durum wheat. Field Crops Res. 2016, 191, 54–65. [Google Scholar] [CrossRef]
- Ali, S.; Hafeez, A.; Ma, X.L.; Tung, S.A.; Chattha, M.S.; Shah, A.N.; Luo, D.; Ahmad, S.; Liu, J.H.; Yang, G.Z. Equal potassium-nitrogen ratio regulated the nitrogen metabolism and yield of high-density late-planted cotton (Gossypium hirsutum L.) in Yangtze River valley of China. Ind. Crops Prod. 2019, 129, 231–241. [Google Scholar] [CrossRef]
- Fatholahi, S.; Ehsanzadeh, P.; Karimmojeni, H. Ancient and improved wheats are discrepant in nitrogen uptake, remobilization, and use efficiency yet comparable in nitrogen assimilating enzymes capabilities. Field Crops Res. 2020, 249, 107761. [Google Scholar] [CrossRef]
- Sun, Y.J.; Sun, Y.Y.; Guo, X.; Jun, M.A. Relationship of nitrogen utilization and activities of key enzymes involved in nitrogen metabolism in rice under water–nitrogen interaction. Acta. Agron. Sin. 2009, 35, 2055–2063. [Google Scholar] [CrossRef]
- Du, Y.L.; Zhao, Q.; Chen, L.R.; Yao, X.D.; Xie, F.T. Effect of drought stress at reproductive stages on growth and nitrogen metabolism in soybean. Agronomy 2020, 10, 302. [Google Scholar] [CrossRef] [Green Version]
- Zhang, X.; Meng, F.; Li, H.; Wang, L.; Wu, W. Optimized fertigation maintains high yield and mitigates N2O and NO emissions in an intensified wheat-maize cropping system. Agric. Water Manag. 2019, 211, 26–36. [Google Scholar] [CrossRef]
- Yu, Z.T.; She, M.Y.; Diepeveen, D.; Zhang, Y.J.; Tang, G.X.; Zhang, J.J.; Ma, W.J. Wheat grain protein accumulation and polymerization mechanisms driven by nitrogen fertilization. Plant J. 2018, 96, 1160–1177. [Google Scholar] [CrossRef]
- Guo, Z.J.; Zhang, Y.L.; Zhao, J.Y.; Yu, Z.W.; Shi, Y. Nitrogen use by winter wheat and changes in soil nitrate nitrogen levels with supplemental irrigation based on measurement of moisture content in various soil layers. Field Crops Res. 2014, 164, 117–125. [Google Scholar] [CrossRef]
- Li, C.; Wang, X.S.; Guo, Z.K.; Huang, N.; Hou, S.B.; He, G.; Wang, Z.H.; Zhang, D. Optimizing nitrogen fertilizer inputs and plant populations for greener wheat production with high yields and high efficiency in dryland areas. Field Crops Res. 2022, 276, 108374. [Google Scholar] [CrossRef]
- Kang, S.; Hao, X.; Du, T.; Tong, L.; Su, X.; Lu, H.; Li, X.; Huo, Z.; Li, S.; Ding, R. Improving agricultural water productivity to ensure food security in china under changing environment: From research to practice. Agric. Water Manag. 2017, 179, 5–17. [Google Scholar] [CrossRef]
- Man, J.G.; Yu, Z.W.; Zhang, Y.L.; Shi, Y.; Wang, L.Q. Water and nitrogen use of winter wheat under different supplemental irrigation regimes. Crop Sci. 2016, 56, 3237–3249. [Google Scholar] [CrossRef]
- Liu, W.X.; Wang, J.R.; Wang, C.Y.; Ma, G.; Lu, H.F.; Xie, Y.X.; Ma, D.Y.; Kang, G.Z. Root growth, water and nitrogen use efficiencies in winter wheat under different irrigation and nitrogen regimes in North China Plain. Front. Plant Sci. 2018, 9, 1798. [Google Scholar] [CrossRef] [PubMed] [Green Version]
- Wang, D. Water use efficiency and optimal supplemental irrigation in a high yield wheat field. Field Crops Res. 2017, 213, 213–220. [Google Scholar] [CrossRef]
- Zhang, H.L.; Zhao, X.; Yin, X.G.; Liu, S.L.; Xue, J.F.; Wang, M.; Pu, C.; Chen, F. Challenges and adaptations of farming to climate change in the North China Plain. Clim. Chang. 2015, 129, 213–224. [Google Scholar] [CrossRef]
- Wang, H.Y.; Hu, K.L.; Li, B.G.; Jin, L. Analysis of water and nitrogen use efficiencies and their environment impact under different water and nitrogen management practices. Sci. Agric. Sin. 2011, 44, 2701–2710. [Google Scholar]

Publisher’s Note: MDPI stays neutral with regard to jurisdictional claims in published maps and institutional affiliations. |
© 2022 by the authors. Licensee MDPI, Basel, Switzerland. This article is an open access article distributed under the terms and conditions of the Creative Commons Attribution (CC BY) license (https://creativecommons.org/licenses/by/4.0/).