Article

Effects of CO2 Enrichment on Yield, Photosynthetic Rate, Translocation and Distribution of Photoassimilates in Strawberry ‘Sagahonoka’

1
Saga Prefecture Agriculture Research Center, Nanri, Kawasoe, Saga 840-2205, Japan
2
Graduate School of Bioresource and Bioenvironmental Sciences, Kyushu University, Motooka, Nishi-ku, Fukuoka 819-0395, Japan
3
Graduate School of Agriculture, Ehime University, Tarumi, Matsuyama, Matsuyama 790-8566, Japan
4
Faculty of Agriculture, Kyushu University, Motooka Nishi-ku, Fukuoka 819-0395, Japan
5
NARO Institute of Vegetable and Tea Science, Kannondai, Tsukuba, Ibaraki 305-0852, Japan
*
Author to whom correspondence should be addressed.
Saga Prefecture Agriculture Technology Center, Nanri, Kawasoe, Saga 840-2205, Japan.
Agronomy 2022, 12(2), 473; https://doi.org/10.3390/agronomy12020473
Submission received: 12 December 2021 / Revised: 7 February 2022 / Accepted: 8 February 2022 / Published: 14 February 2022
(This article belongs to the Special Issue Plant Ecophysiology and Phenomics for Next Smart Agriculture)

Abstract

:
The method of automatically controlling the CO2 concentration in a greenhouse depending on ventilation was examined in order to efficiently improve the productivity of strawberries under the weather conditions in the northern part of Kyushu in Japan. The effects of CO2 enrichment on the yields, fruit Brix, and economic value of the strawberry ‘Sagahonoka’ were investigated. In addition, in order to clarify the physiological response of ‘Sagahonoka’ to the CO2 concentration, the photosynthetic rate, translocation, and photoassimilate distribution rate were measured. It was found that maintaining the CO2 concentrations above 800 μmol mol−1 and 400 μmol mol−1 during no ventilation and ventilation, respectively, resulted in 25% increases in marketable fruit yields and a 0.2–1.2% higher fruit Brix compared to control, which was kept in 400 μmol mol−1 CO2 or above all day regardless of ventilation. Additionally, the economic value of ‘Sagahonoka’ was increased. The photosynthetic rate of ‘Sagahonoka’ increased linearly up to 800 μmol mol−1 CO2, and high CO2 concentrations affected the distribution for the primary fruit, the most significant sink. It was clarified that CO2 enrichment at 800 μmol mol−1 for ‘Sagahonoka’ was effective in increasing the photosynthetic rate and distribution of photoassimilates to fruits, and the yields of strawberries could be increased efficiently by automatically controlling the CO2 concentration depending on ventilation in a southern region of Japan.

1. Introduction

Kyushu is a warm climate region located in the southern part of Japan where forcing the cultivation of strawberries is popular. The growing area for strawberries in Kyushu is 1400 ha, and the shipping amount is 48,410 tons [1], accounting for about 30% of the total of both in Japan. However, the amount of sunshine in winter is low in northern Kyushu [2], i.e., the total solar radiation is below 5.0 MJ m−2, and this may last for many days during the severe cold season from December to February. Low temperatures in the greenhouse caused by such low solar radiation prevent fruits from ripening, resulting in reduced fruit quality and yield [3]. On the other hand, even in the severe cold season, there are often days when the solar radiation exceeds 10.0 MJ m−2 under sunny conditions. Therefore, it is necessary to develop efficient cultivation techniques for increasing fruit quality and yields, responding to various weather conditions. The effects of CO2 enrichment on plants have been studied in several countries including Japan, and their effectiveness has been shown [4,5,6,7,8]. It has been reported that the fruit yields under 750–1000 μmol mol−1 CO2 treatments were higher than those without treatment for the strawberries ‘Nyohou’ and ‘Toyonoka’ [9]. However, ventilation is often used to control rises in temperature, and CO2 flows out from the enriched CO2 greenhouse to outside by ventilation, resulting in higher costs and impact on the environment. For these reasons, CO2 application at a concentration higher than that outside is not widespread in northern Kyushu. The fact that greenhouses have to be ventilated during the daytime makes it uneconomical to maintain a high CO2 concentration [10]. Therefore, in this study, we examined the methods for CO2 enrichment in consideration of the cost and impact on the environment while achieving the aim of improving the productivity of strawberries under the weather conditions in northern Kyushu. Under the condition of the CO2 concentration was controlled automatically and maintained to be higher than that outside, depending on ventilation, the yield, fruit quality, and profitability of the strawberry ‘Sagahonoka’ were investigated. Furthermore, in order to clarify the physiological response of the strawberry ‘Sagahonoka’ to the CO2 concentration, the photosynthetic rate and translocation, and distribution of photoassimilates were investigated.

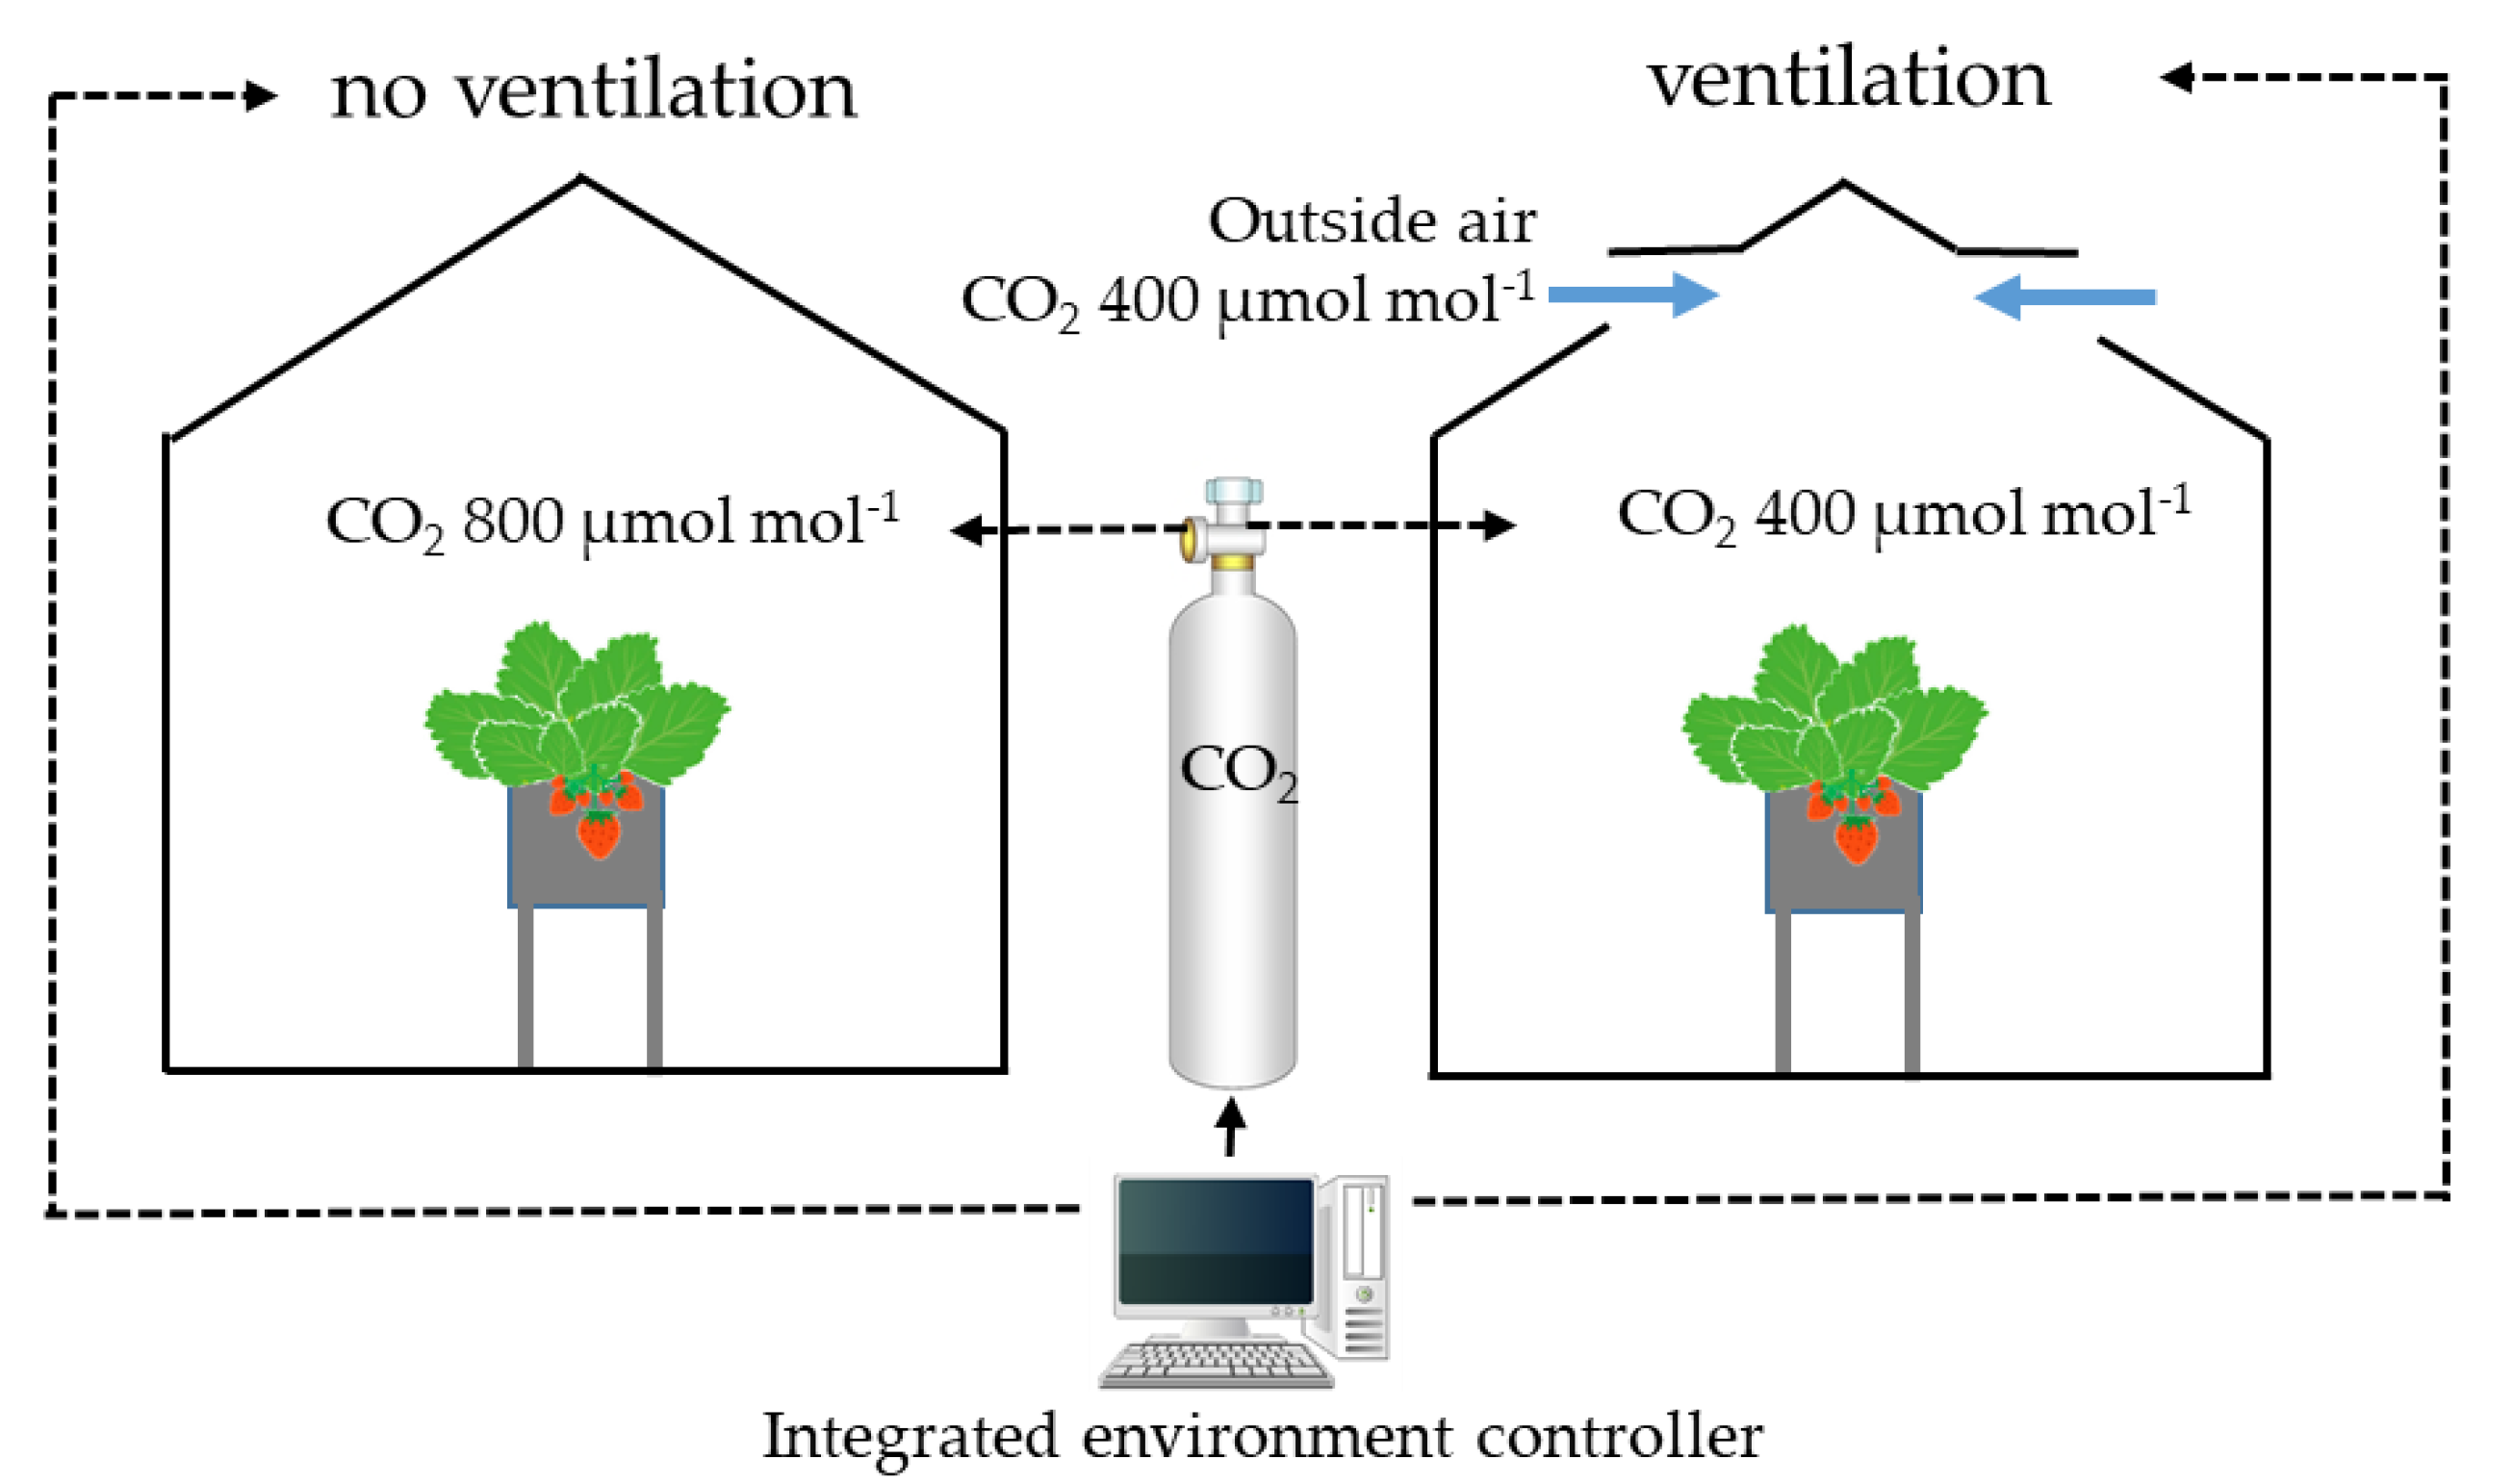
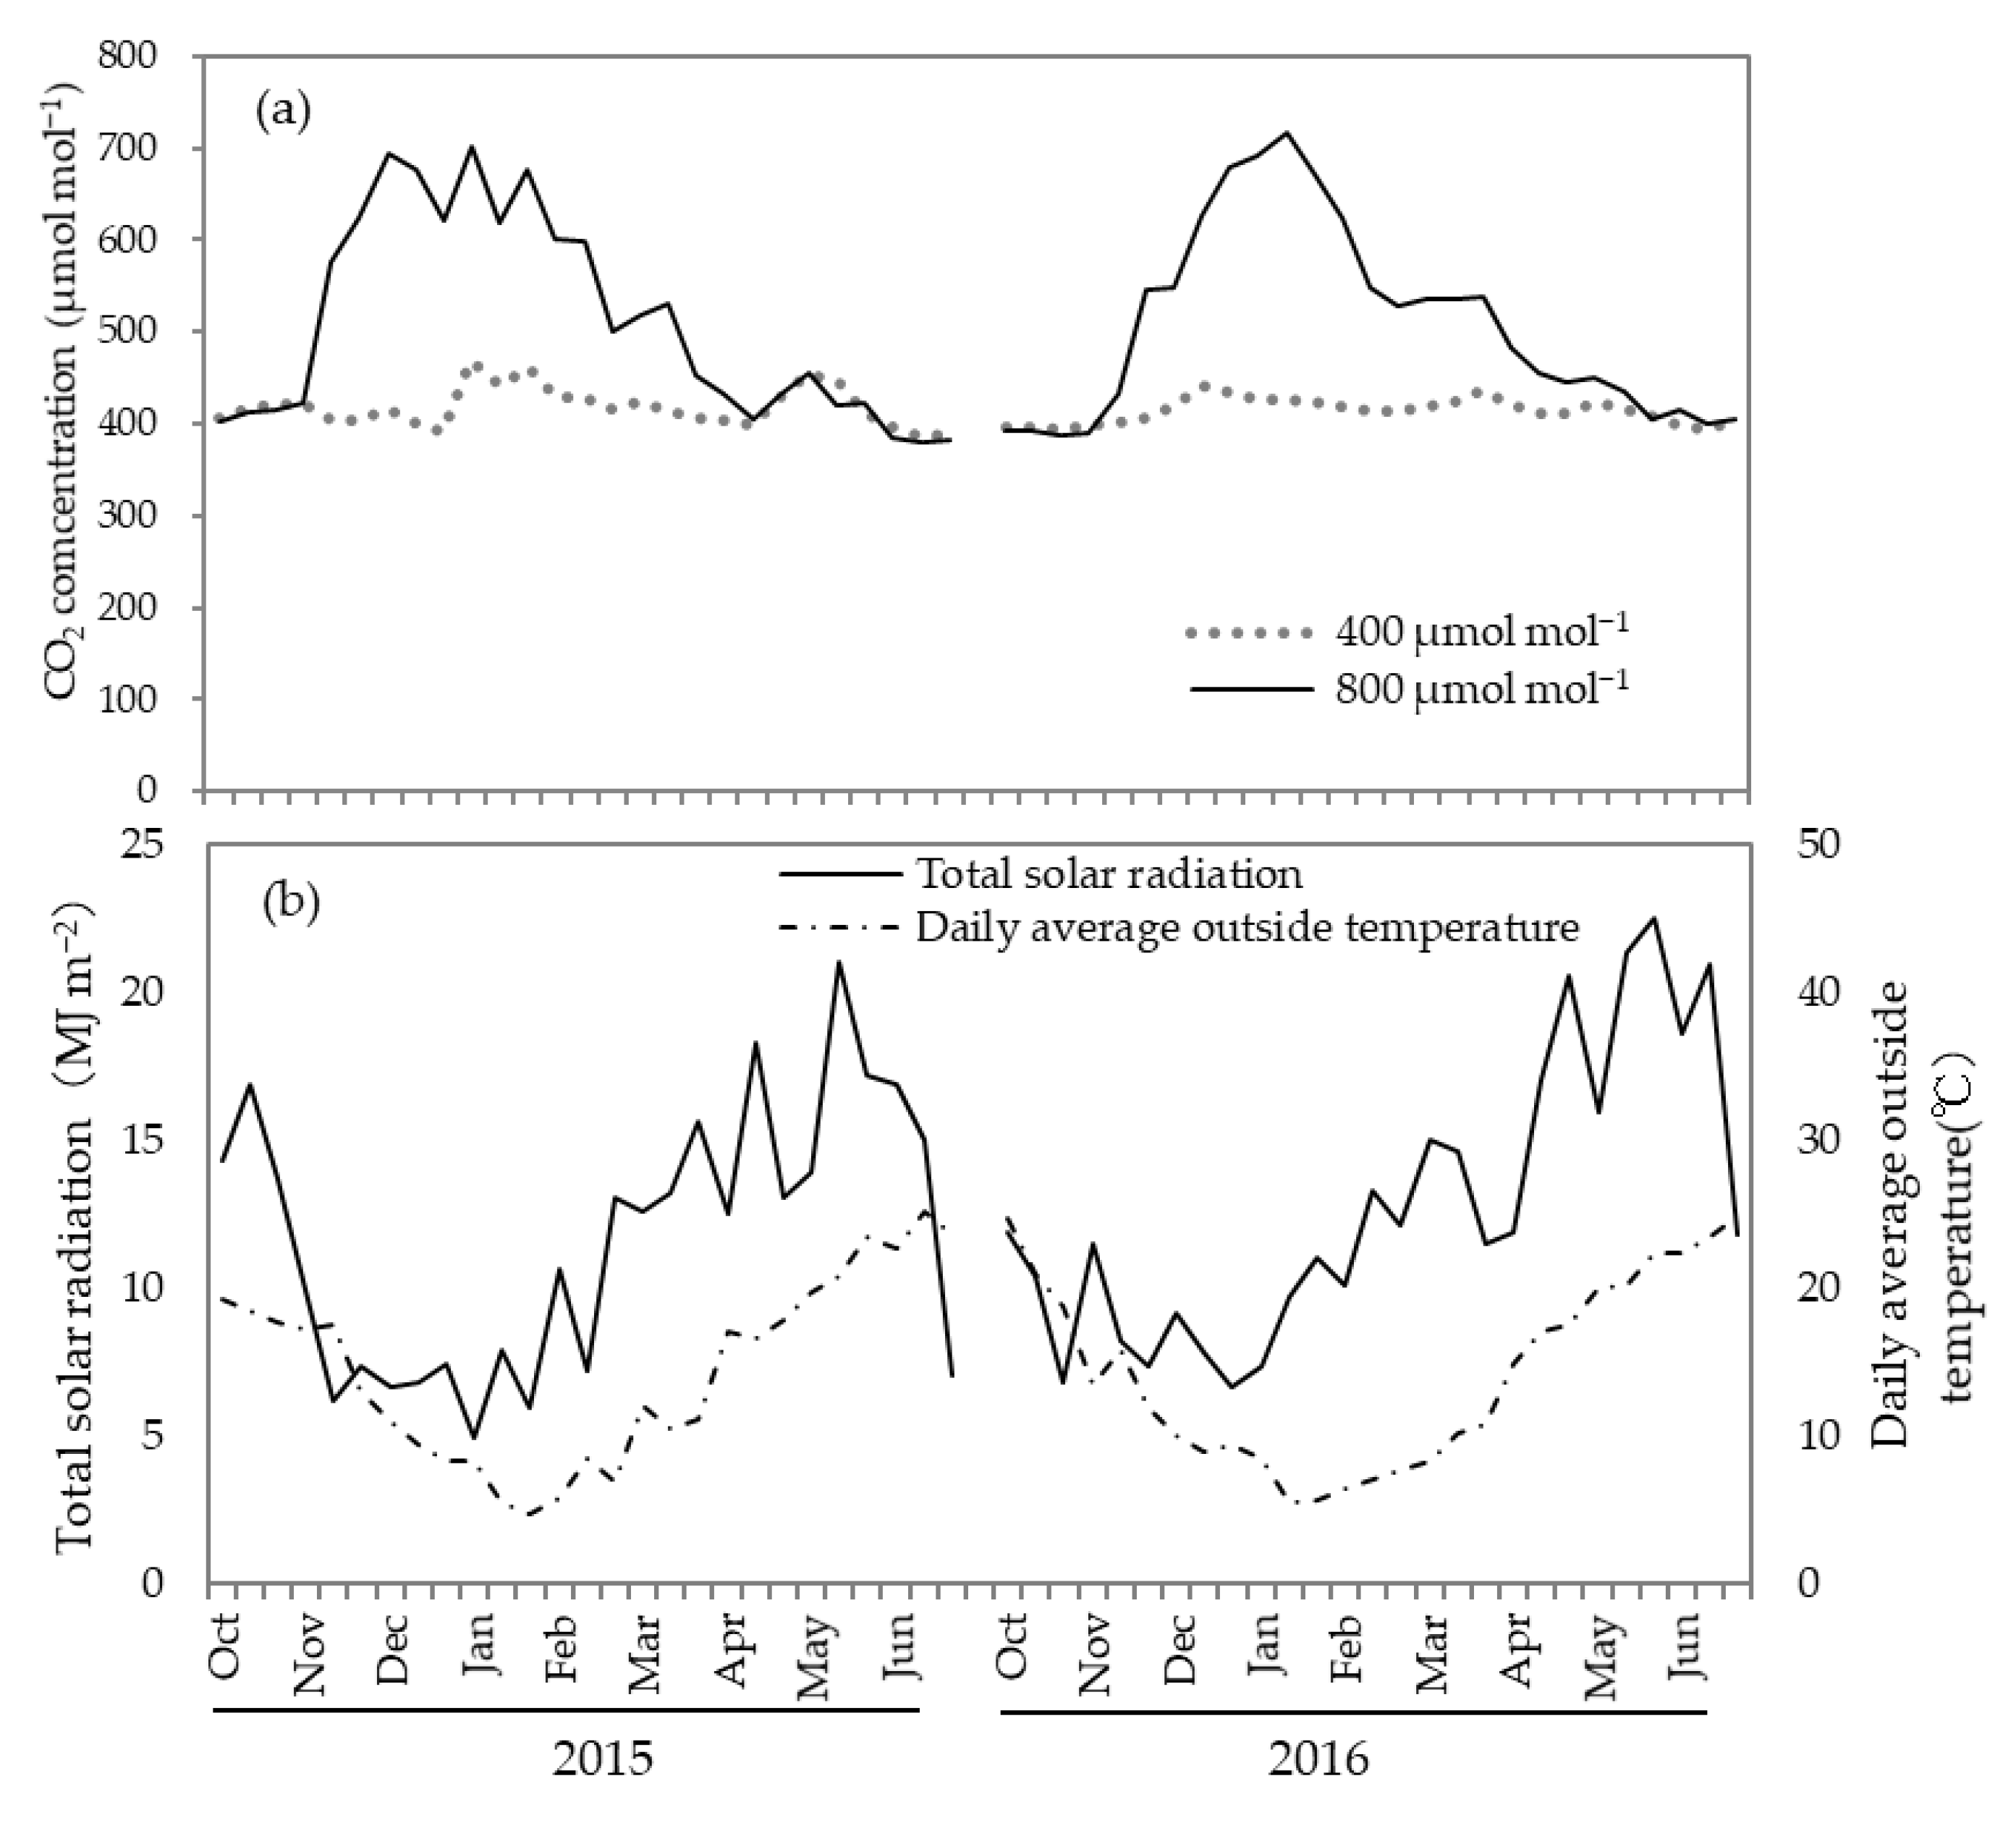
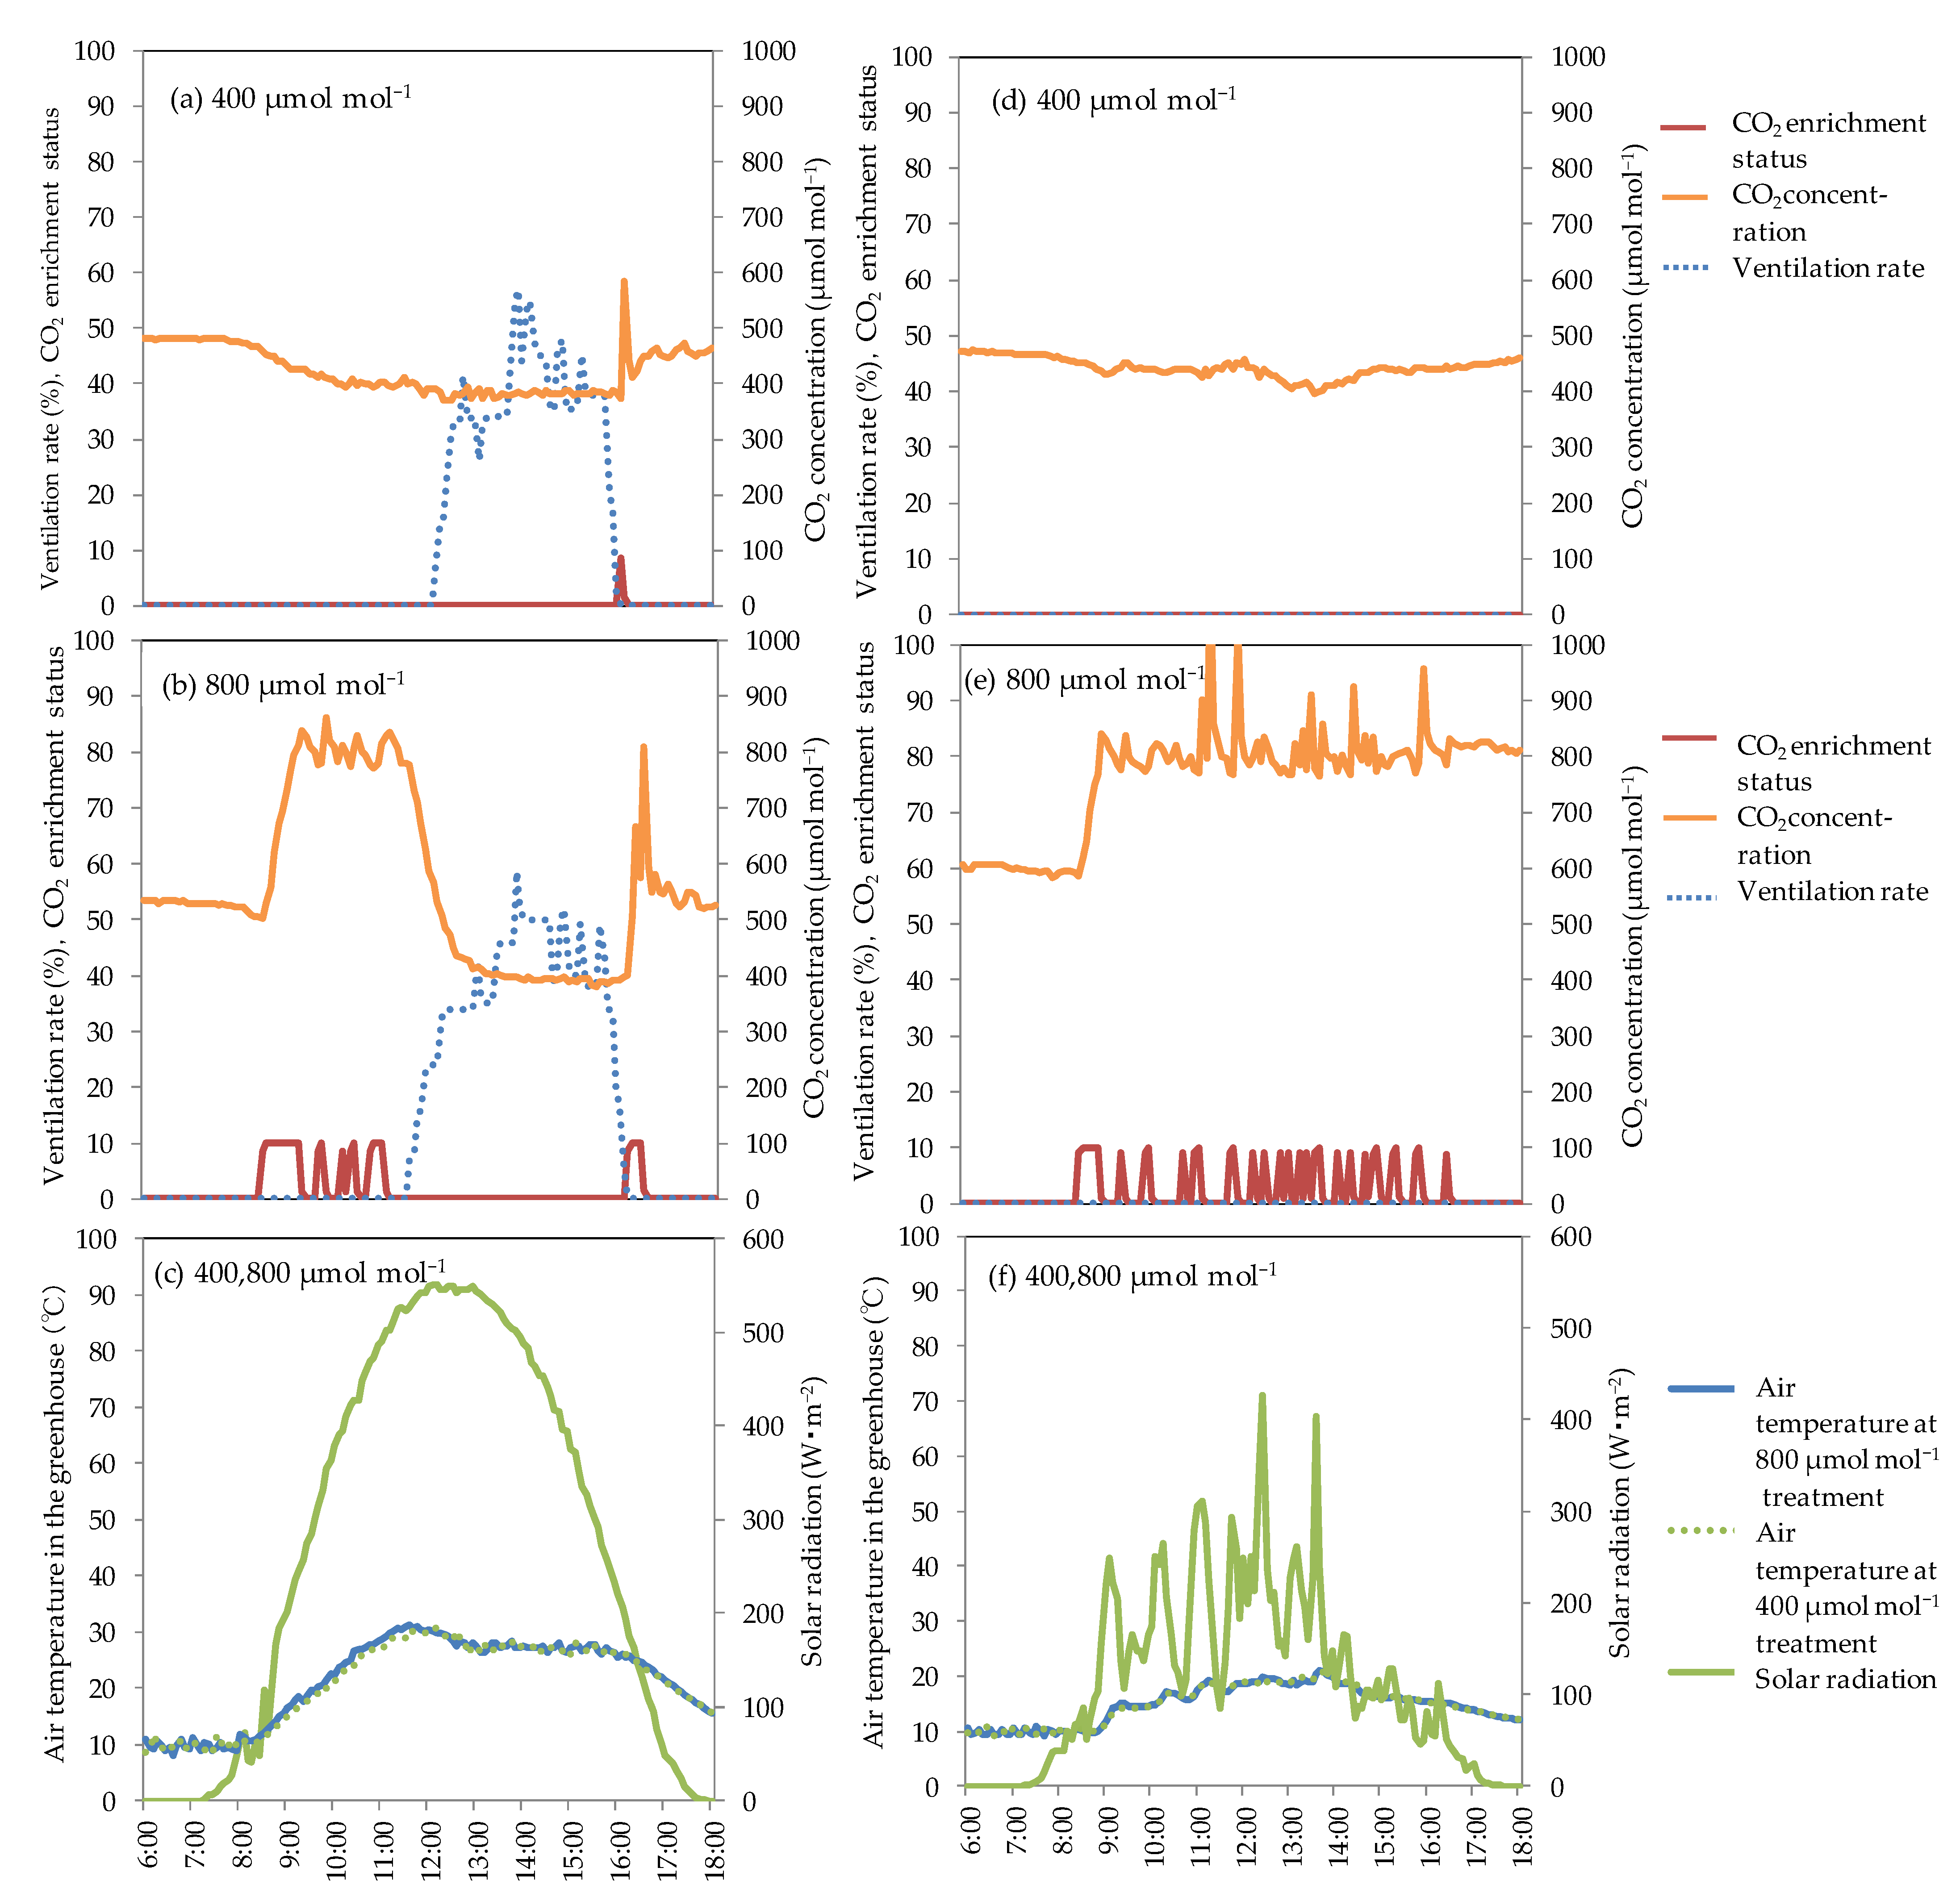
2. Materials and Methods

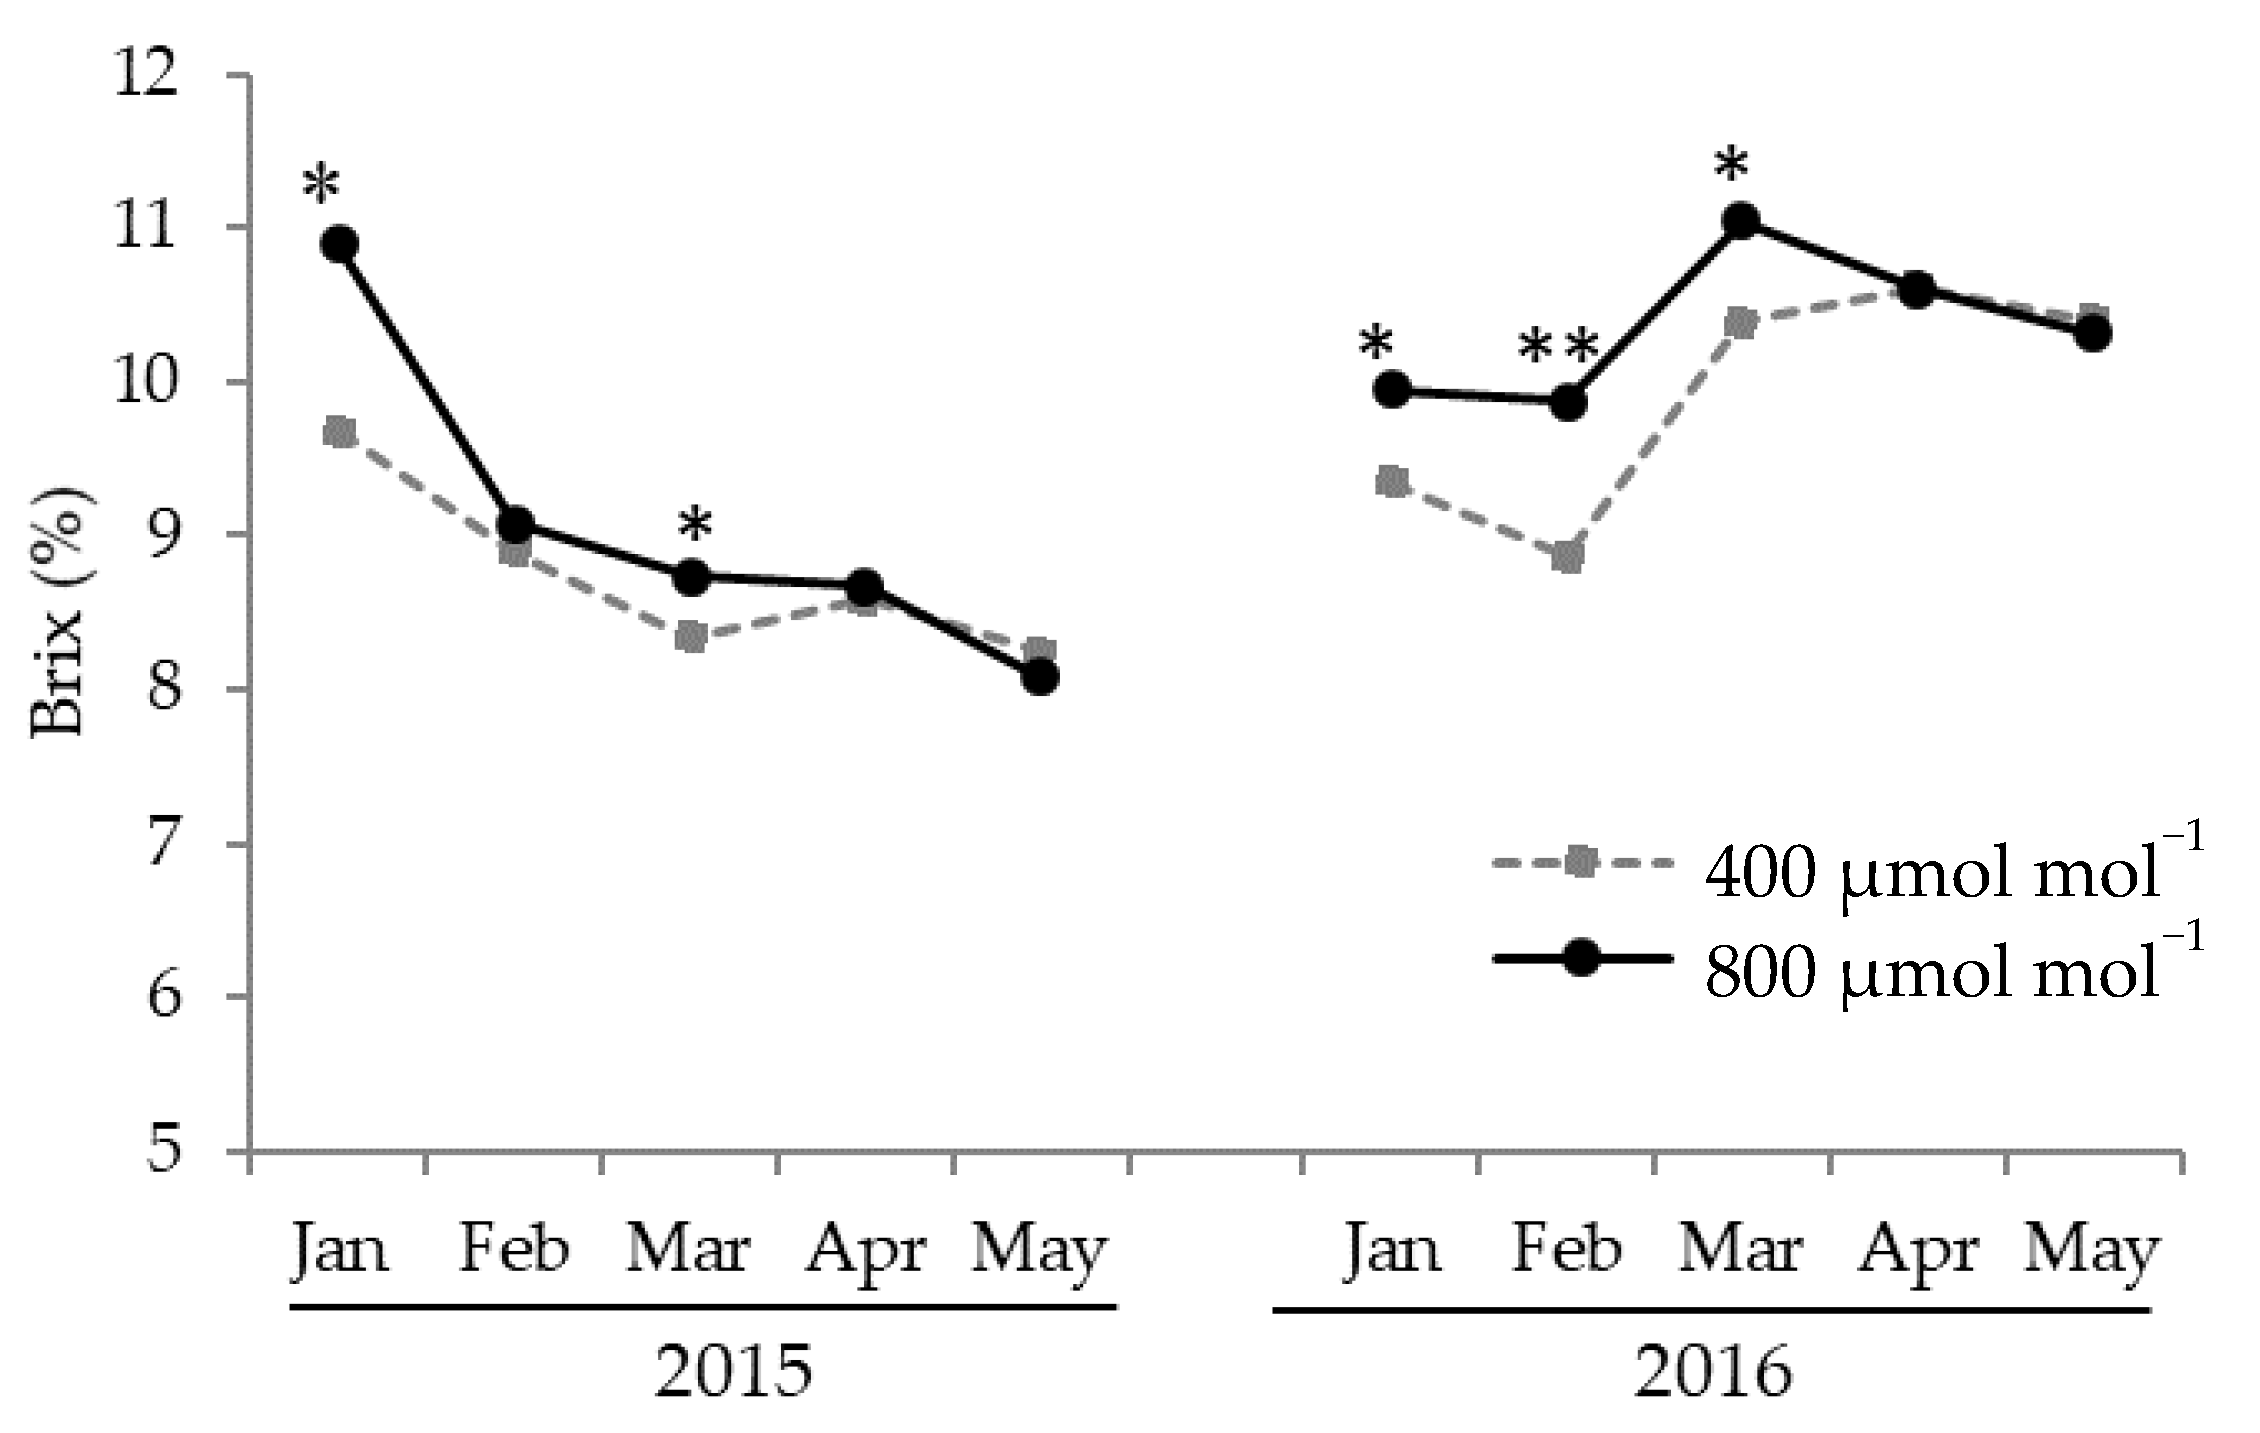
2.1. Effects of CO2 Concentration on Yield, Fruit Brix, and Economic Value

The experiments were conducted in 2 compartments of a plastic greenhouse in the Saga Prefecture Agricultural Research Center in Japan from 15 September 2015 to 30 June 2016 (planting in 2015), and from 16 September 2016 to 30 June 2017 (planting in 2016). Strawberries (Fragaria × ananassa Duch. cv Sagahonoka) were cultivated using a bench-culture system (Yazaki Kako Corp., Shizuoka, Japan) with 20 cm spacing between plants and two rows. Coir was filled in cultivation beds, and OAT-A solution (OAT Agrio Co., Ltd., Tokyo, Japan) with an electrical conductivity of 0.6–1.05 mS cm−1 was supplied at 50 to 420 mL plant−1 day−1. The solution was controlled in response to solar radiation by an integrated environment controller (Maximizer; PRIVA., De Lier, Holland, The Netherlands), and supplied every 1.5 to 2.0 MJ m−2 during 8:00–14:00 in both years. The ventilation starting temperature was set at 27 °C during 7:00–12:00 and 24 °C during 12:00–17:00. The relative humidity was maintained above 50% by spraying mist (KYZ75A-4IK; H.IKEUCHI & Co., Ltd., Osaka, Japan) after March. The air temperature was kept above 5 °C using a heat pump (NGP1010T-N; Nepon Inc., Tokyo, Japan). After 15:00, when the outside temperature was less than 7 °C, a vinyl curtain was closed. The dark period was interrupted with lighting time at 22:00–2:00 from December to February.
The CO2 concentration in the greenhouse was controlled and measured by the integrated environment controller. A CO2 sensor was placed 20 cm above the base of the plants, and CO2 was applied as liquefied gas using a porous tube (WTR100; Yamato Jitsugyou Corp, Tokyo, Japan) placed at the base of the plants. Two treatments of CO2 enrichment were carried out: 800 μmol mol−1 treatment where the CO2 concentration was kept above 800 μmol mol−1 during no ventilation and 400 μmol mol−1 during ventilation (Figure 1), and as 400 μmol mol−1 treatment where the CO2 concentration was kept above 400 μmol mol−1 all day, as a control. The CO2 enrichment for the 800 μmol mol−1 treatment was maintained during no ventilation; therefore, the duration of the 800 μmol mol−1 treatment changed according to the ventilation time depending on the outside weather.
In both 2015 and 2016, CO2 was applied from 8:00 to 17:00 from 20 November to 10 May. The CO2 concentration, CO2 enrichment status, ventilation rate, total solar radiation, and air temperature in the greenhouse were measured at 5-min intervals using the integrated environment controller. The plant height, leaf length, and width in the fully expanded third leaves of 5 plants, with 2 repetitions, were measured every two weeks. The fruits of 10 plants, with 4 repetitions, were harvested three times a week, and marketable fruits (fruit fresh weight >8.0 g and no malformations) were weighted. The fruit Brix of 10 fruits, with 2 repetitions, was measured using a sugar acidity meter (PAL-BXIACID4; ATAGO Co., Ltd., Tokyo, Japan) every two weeks from January to May. The economic value of applying CO2 was calculated from the amount of CO2 used in this study. That was calculated in the case of using the liquefied petroleum gas (LPG)-burning CO2 generator that is widely used in Saga Prefecture and spreading with a circulation fan. The amount of CO2 used by a circulation fan was estimated to be about 146% of the local enrichment from the tube placed at the base of the plants [11]. In addition, the gross profit and shipping cost were calculated from the product fruit yield and the average annual unit price in 2015 and 2016. The equipment cost for CO2 enrichment was calculated as the rental fee for the LPG-burning CO2 generator; in addition, the cost of the 800 μmol mol−1 treatment was estimated using the CO2 controller depending on the air temperature in the greenhouse (the depreciation period is 7 years). The fuel cost was calculated assuming that LPG was JPY 350 m−3. Finally, the net profit for CO2 treatment was calculated by subtracting the shipping cost and CO2 enrichment cost from the gross profit.

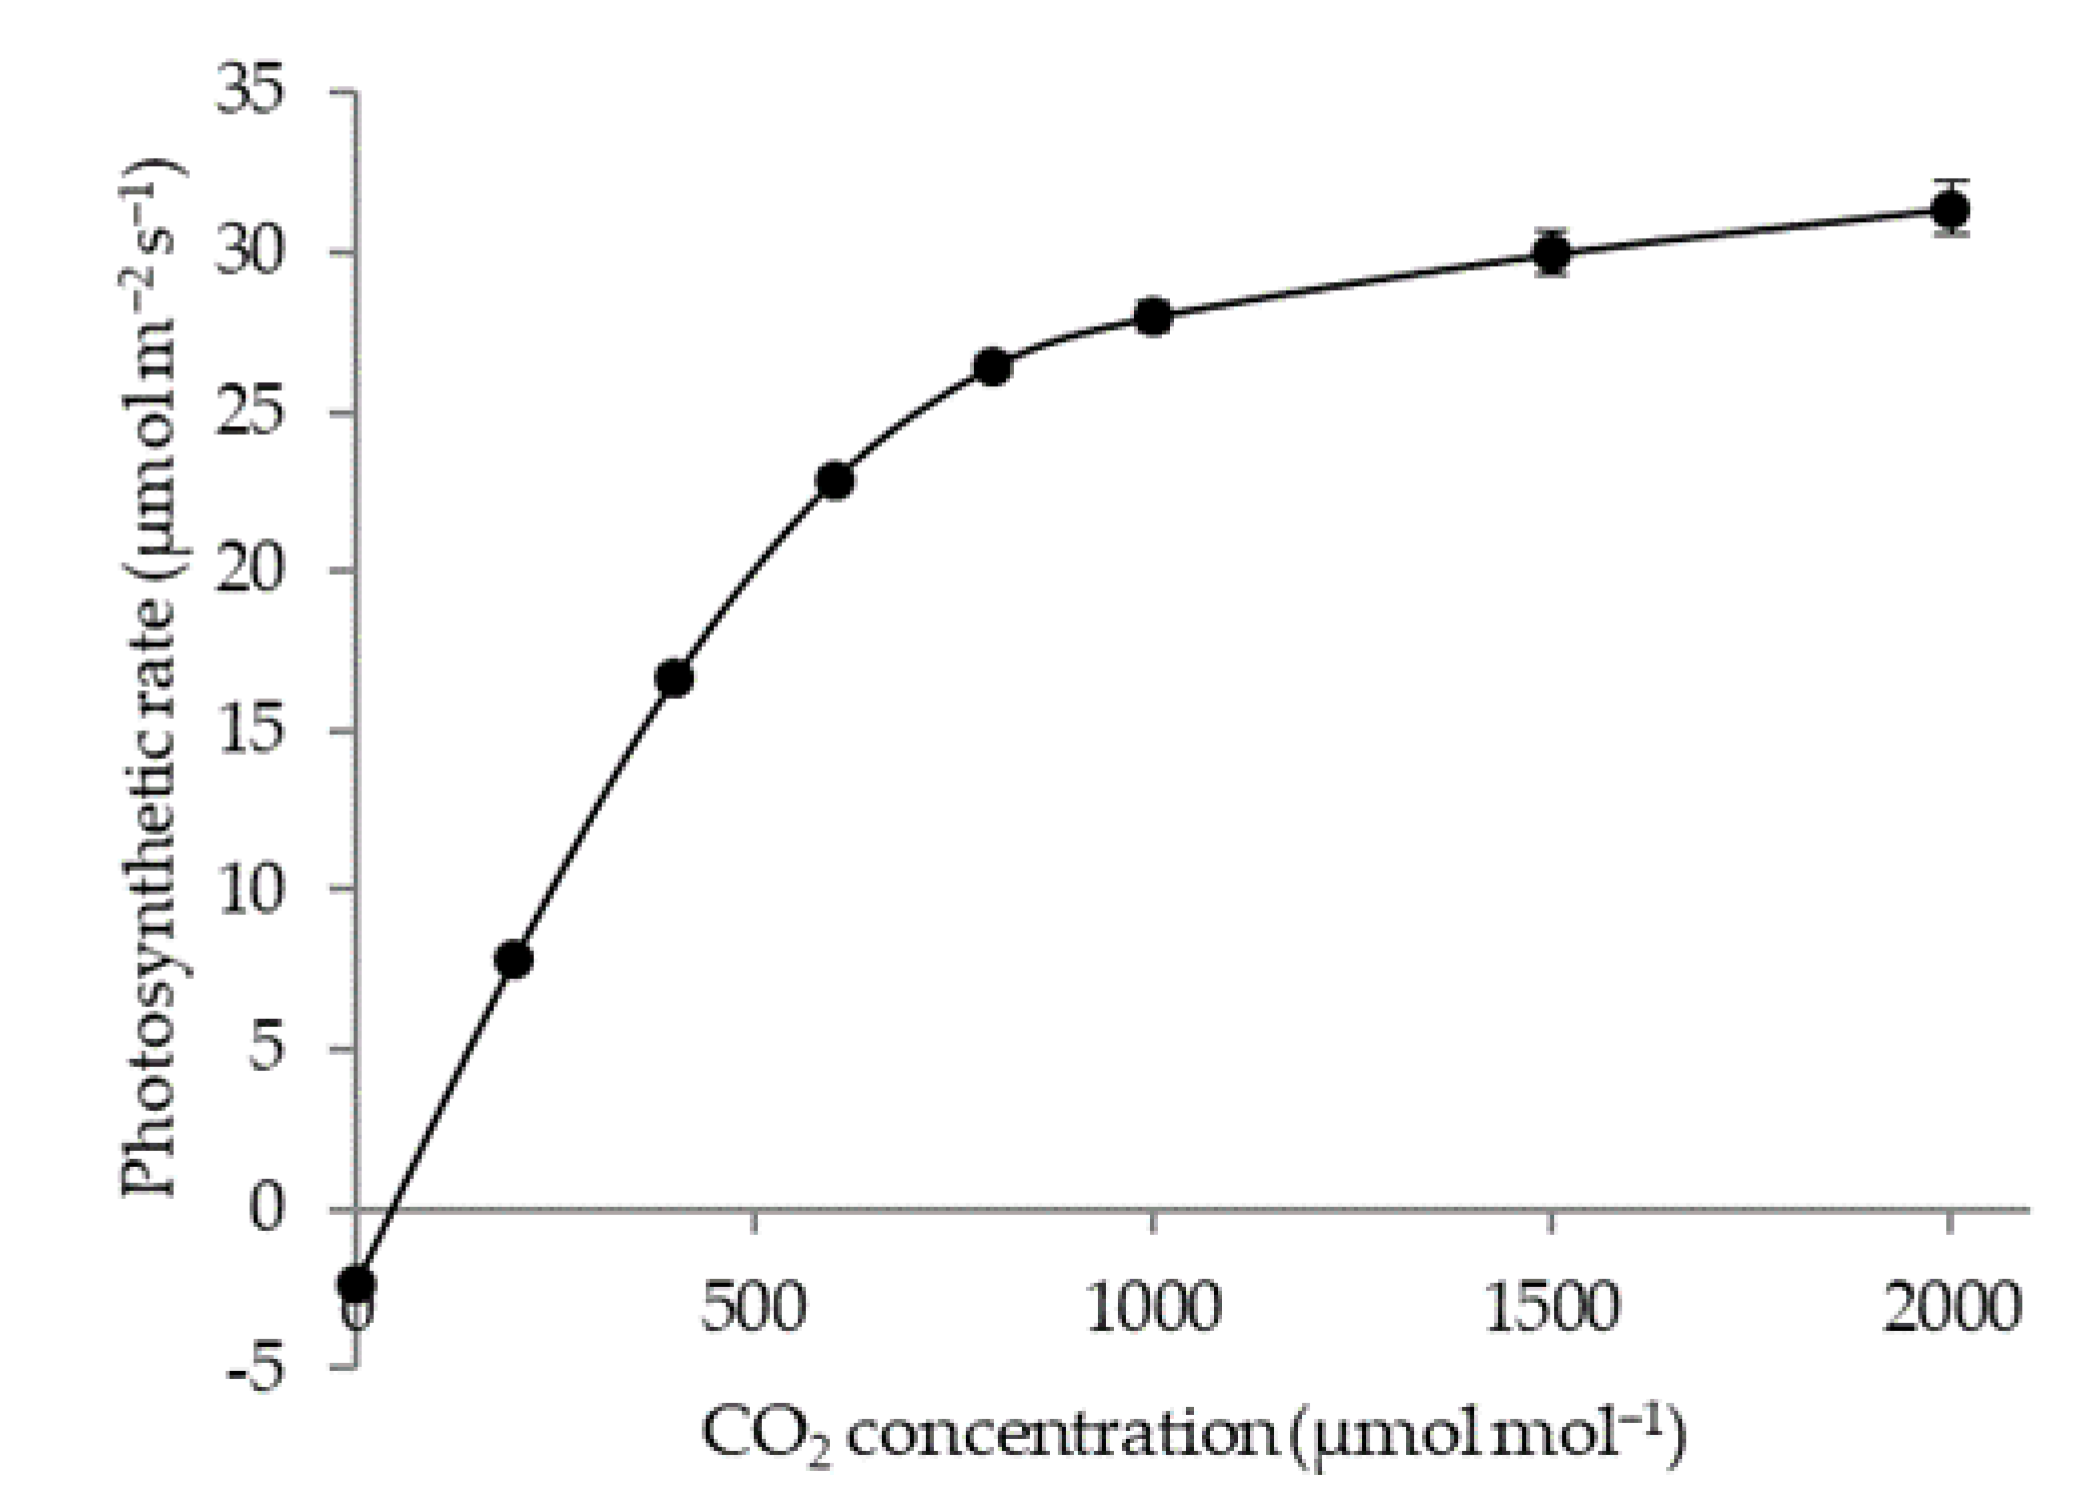
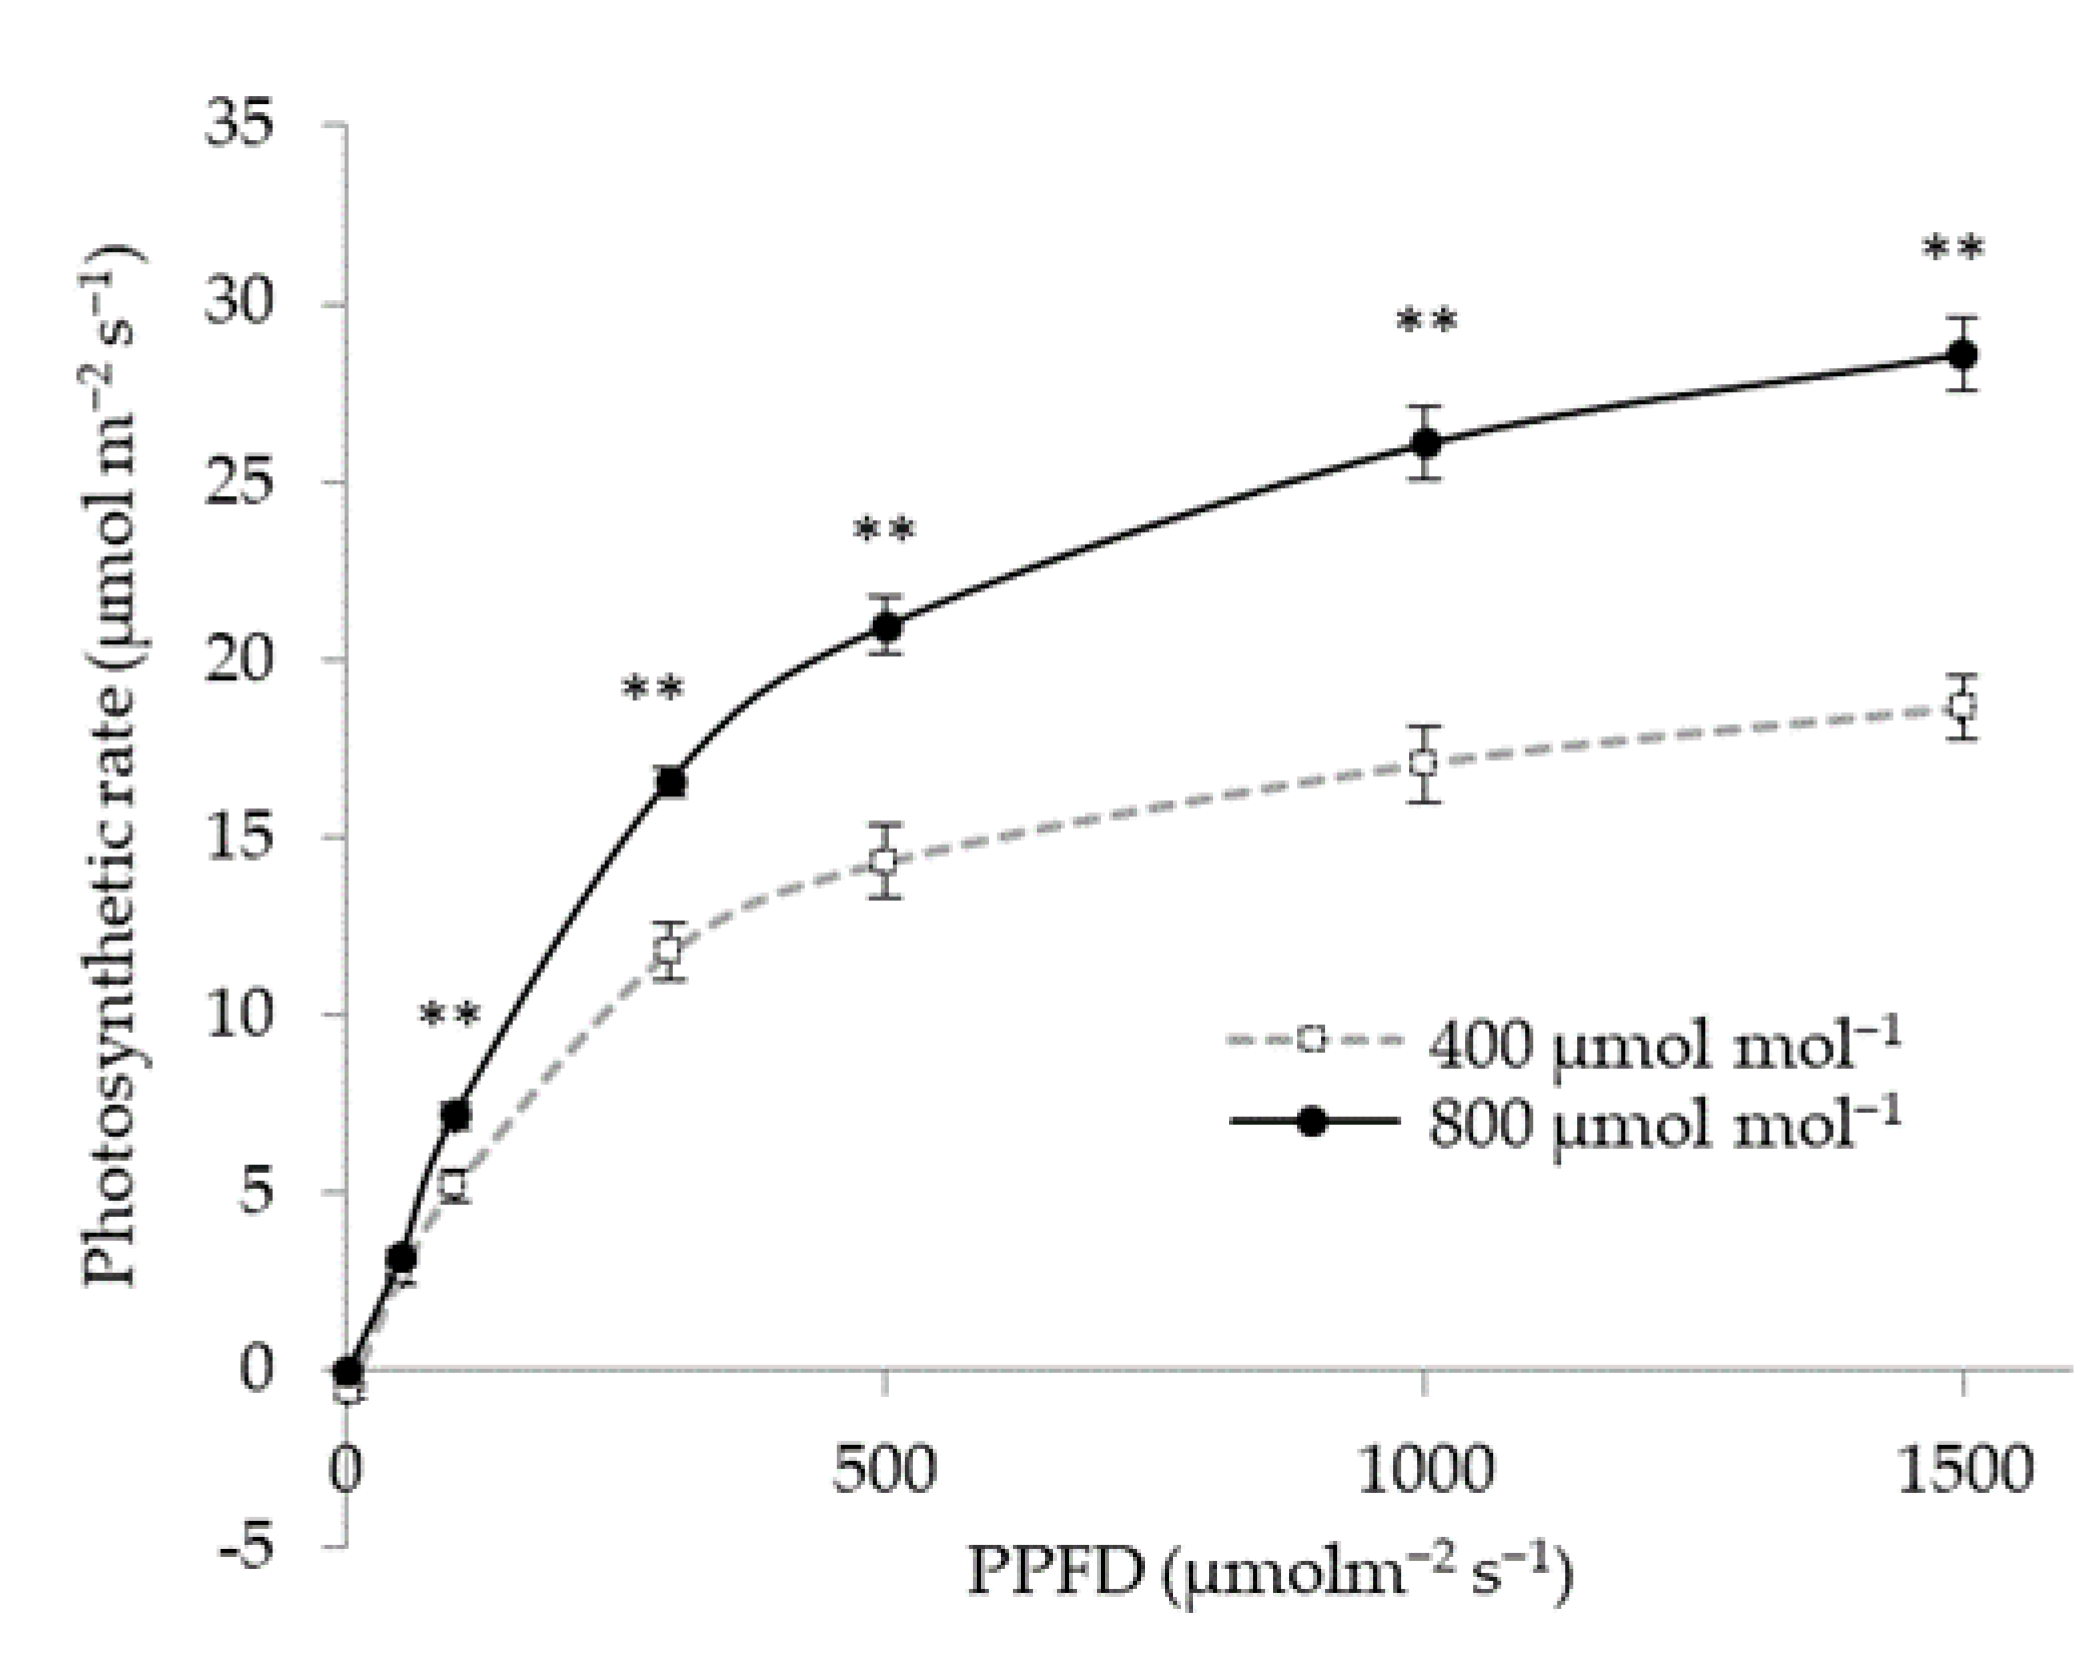
2.2. Effect of CO2 Concentration on Photosynthetic Rate

The photosynthetic rate was measured in 2017 and 2018 under the same cultivation conditions in 2015 and 2016. The relationship between CO2 and photosynthetic rate was measured on 13 February 2017 and the relationship between light and photosynthetic rate was measured on 25, 26, and 29 January 2018. That was measured from 9:00 and 14:00, using a portable photosynthetic transpiration-measuring device (LI-6400, LI-COR Corp., Nebraska, NE, USA) under the condition of 400 μmol mol−1 CO2 in the greenhouse. The rate was measured in the fully expanded third leaves of 4 plants. The relationship between the CO2 concentration and photosynthetic rate was measured under the conditions of a photosynthetic photon flux density (PPFD) of 1000 μmol m−2 s−1, relative humidity of 70%, leaf temperature of 20 °C, and CO2 concentration of 0 to 2000 μmol mol−1. The relationship between the PPFD and photosynthetic rate was investigated under the conditions of a PPFD of 0 to 1500 μmol m−2 s−1, relative humidity of 70%, leaf temperature of 20 °C, and CO2 concentrations of 400 and 800 μmol mol−1.

2.3. Effect of CO2 Concentration on Translocation and Distribution Rate of 13CO2-Photoassimilates

In order to investigate the translocation and distribution of photosynthetic assimilates, we used ‘Sagahonoka’ cultivated in 18 cm polyethylene pots. On 25 September 2020, the pots were filled with Saga Strawberry Soil (red clay ball soil: palm peat: peat moss: pumice: bark compost: charcoal 10:10:25:35:15:5, boron manganese (BM) heavy-burning phosphorus 2 g/L 10:10:25:35:15:5, BM heavy-burning phosphorus 2 g/L) (JA Saga, Saga, Japan) for bench cultivation and ‘Sagahonoka’ was planted, and 3 pieces of IB Kasei (N:P:K = 10:10:10, N-75 per piece) (JCAM AGRI. Co., Ltd., Tokyo, Japan) were applied. After planting, the same amount of IB Kasei was applied every month. These plants were cultivated in the greenhouse before the flowering stage of the primary fruit in secondary inflorescence and moved to the growth chamber (LPH-Osaka, Japan) on 11 December 2020. The treatments of CO2 enrichment were 400 μmol mol−1 and 800 μmol mol−1 in the light period. The settings in the growth chamber other than the CO2 concentration were the same for both treatments as follows. The light period was 6:00–18:00, and the dark periods were 18:00–22:00 and 2:00–6:00. At 22:00–2:00, the dark period was interrupted with the lighting time according to normal cultivation. The PPFD of the leaf surface in the light period was about 250 μmol m−2 s−1, assuming the value in the greenhouse of winter, and it was 160 μmol m−2 s−1 during the dark-period interruption. The temperature was set at 15 °C at 6:00–7:00, 20 °C at 7:00–8:00, 25 °C at 8:00–16:00, 20 °C at 16:00–17:00, 15 °C 17:00–18:00, and 10 °C at 18:00–6:00. The relative humidity was set at 70% all day. These settings were based on the environment inside greenhouses in northern Kyusyu.
13CO2 was fed to the plants at 9:00–10:00 when primary fruits in secondary inflorescence were in anthesis, 12 days after flowering (green ripening stage), and 24 days after flowering (white ripening stage). The plant was arranged in a source–sink unit with 7 leaves and 7 fruits, respectively. 13CO2 was supplied to the 3rd to 7th leaves in the polyethylene bag with a zipper. A centrifuge tube containing 0.5 g of stable-isotope-labeled barium carbonate (13C barium) was in a polyethylene bag. Ten milliliters of 10% lactic acid was added to the 13C barium, 13CO2 was supplied to the 3rd to 7th leaves, and the polyethylene bag was opened 1 h after the start of 13CO2 feeding. Twenty-four hours after the start of 13CO2 feeding, 4 plants for each treatment were separated. The plant parts, i.e., the source leaves (third to seventh leaf), new leaves (first to second leaves), fruits (primary fruit: top fruit; secondary fruits: second and third fruits; tertiary fruit: fourth to seventh fruits), peduncle, crown, and roots, were separated. The plant parts were analyzed using a stable-isotope analyzer (Integra2 CN, Sercon, Cheshire, UK) after being dried and ground. From the 13C amount of each part according to the analysis, the translocation and distribution rate were calculated using the following formulas (1) and (2) [12] (pp. 3–4):
Translocation rate = (13C amount recovered from all plant parts excluding feed leaves/13C amountrecovered from all plant) × 100
Distribution rate = (13C amount recovered from each part/13C amount recovered from all plant exclude ing feed leaves) × 100

3. Results

3.1. Effect of CO2 Concentration on Yield, Fruit Brix, and Economic Value the Average Daytime

CO2 concentration over the two years was stably approximately 400 μmol mol−1 in the 400 μmol mol−1 treatment (Figure 2a). On the other hand, in the 800 μmol mol−1 treatment, the average daytime CO2 concentration was about 400 μmol mol−1 from October to the middle of November, and gradually rose from the end of November, when the ventilation parts began to remain closed during the day, with a decrease in the total solar radiation and outside temperature (Figure 2a,b). Additionally, the average daytime CO2 concentration remained high from December to February, when the ventilation parts remain closed for longer times during the day. In 2015, the average total solar radiation for every 10 days from December to January was 4.9 to 7.9 MJ m−2, and the outside temperature remained low. Therefore, the ventilation was closed for a long time, and the CO2 concentration remained high. In 2016, the average total solar radiation for every 10 days from December to January was 6.6 to 11.0 MJ m−2, which was higher than that in 2015, and the CO2 concentration remained slightly lower than in 2016 because of the longer ventilation.
Figure 3 shows the change in the ventilation rate, CO2 enrichment status, CO2 concentration, and air temperature in the greenhouse, and the solar radiation on a typical sunny day and cloudy day in January. In the 400 μmol mol−1 treatment, the CO2 concentration did not fall below 400 μmol mol−1 and the CO2 generator hardly operated on both sunny and cloudy days (Figure 3a,d). On the other hand, in the 800 μmol mol−1 treatment, CO2 was applied only in the morning and evening when the ventilation parts were closed on a sunny day (Figure 3b), so the average daytime CO2 concentration on this day was 563.9 μmol mol−1. In the cloudy day in the 800 μmol mol−1 treatment, the ventilation part remained closed throughout the day because the air temperature in the greenhouse did not reach the ventilation temperature, and CO2 was applied at more than 800 μmol mol−1 during the day (Figure 3e,f), so the average daytime CO2 concentration on this day was 780.0 μmol mol−1. The air temperature in the greenhouse showed similar changes in both the 400 μmol mol−1 and 800 μmol mol−1 treatments on sunny and cloudy days (Figure 3c,f). No significant differences in plant height and leaf length x leaf width were found between the 400 μmol mol−1 and 800 μmol mol−1 treatments at most of the times (Figure 4). Additionally, there was no significant difference in the marketable fruit rate between the 400 μmol mol−1 and 800 μmol mol−1 treatments. On the other hand, the marketable fruit yield throughout the period and number of marketable fruits and average fruit weight in the 800 μmol mol−1 treatment were larger than those in the 400 μmol mol−1 treatment. The total marketable fruit yields in the 800 μmol mol−1 treatment were 20–31% higher than those in the 400 μmol mol−1 treatment in both years (Table 1). Furthermore, the fruit Brix of the 800 μmol mol−1 treatment was higher than that of the 400 μmol mol−1 treatment from January to March (Figure 5). The amount of CO2 used was 57.1 kg a−1 in the 400 μmol mol−1 treatment and 288.1 kg a−1 in the 800 μmol mol−1 treatment. The gross profit was JPY 484,783 a−1 in the 400 μmol mol−1 treatment and JPY 610,693 a−1 in the 800 μmol mol−1 treatment, and the difference was JPY 125,910 a−1. On the other hand, the CO2 enrichment cost was calculated assuming that LPG was used in both treatments and the CO2 controller depending on the temperature was used in the 800 μmol mol−1 treatment. The difference between the two treatments was JPY 2900 a−1 for the equipment cost and JPY 12,126 a−1 for the fuel cost. It was estimated that the difference between the gross profit and shipping plus CO2 enrichment costs was about JPY 83,400 a−1 (Table 2). The exchange rate in November 2021 was USD 1 = JPY 115.

3.2. Effect of CO2 Concentration on Photosynthetic Rate

The photosynthetic rate of ‘Sagahonoka’ rapidly increased as the CO2 concentration increased up to 800 μmol mol−1 and gradually increased thereafter (Figure 6). The photosynthesis rate at 800 μmol mol−1 CO2 was 1.6 times higher than that at 400 μmol mol−1 CO2 (Figure 6). The photosynthetic rate rapidly increased as the PPFD increased up to 300 μmol m−2 s−1 and gradually increased thereafter under both CO2 concentrations (Figure 7). The photosynthetic rates at 800 μmol mol−1 CO2 were significantly higher than the values at 400 μmol mol−1 CO2 under 100–1500 μmol m−2 s−1 PPFD. The rates at 800 μmol mol−1 CO2 were 1.37- and 1.53-times higher than those at 400 μmol mol−1 CO2 under 100 and 1500 μmol m−2 s−1 PPFD, respectively. A PPFD of 300 μmol m−2 s−1 is almost equal to the light intensity in the greenhouse on a cloudy day, and a PPFD of 1000 μmol m−2 s−1 is almost equal to that on a sunny day. The photosynthetic rate at a PPFD of 300 μmol m−2 s−1 and 800 μmol mol−1 CO2 was similar to that at a PPFD of 1000 μmol m−2 s−1 and 400 μmol mol−1 CO2.

3.3. Effect of CO2 Concentration on Translocation and Distribution Rate of 13CO2-Photoassimilates

The dry matter weight of each part was compared under the conditions of 400 and 800 μmol mol−1 CO2 in the growth chamber (Table 3). The dry matter weight of the primary fruit at 800 μmol mol−1 CO2 was significantly higher than that at 400 μmol mol−1 CO2 24 days after the flowering of secondary inflorescence. In addition, the dry matter weight of the aerial part at 24 days after flowering was higher than that at the flowering time and 12 days after flowering, and the 800 μmol mol−1 CO2 treatment resulted in a higher dry weight of the aerial part compared to 400 μmol mol−1 CO2 at 24 days after flowering. The translocation rates for 13CO2-photoassimilates at 24 days after flowering were 20% higher than those at the flowering time and 12 days after flowering, but they were not affected by the CO2 concentration. The rate of distribution to fruits increased as the number of days after flowering increased, and it was about 30% at 12 days after flowering, becoming 90% or more at 24 days after flowering (Figure 8). The rate of the distribution of the primary fruit was higher under 800 μmol mol−1 CO2 than 400 μmol mol−1 CO2 at 12 and 24 days after flowering.

4. Discussion

CO2 enrichment in the greenhouse is generally conducted by supplying CO2 to a closed space, and the applied CO2 only dissipates to the outside during ventilation. The air temperature rises in the greenhouse even in winter in Tokai and the Southwestern warm regions of Japan. Ventilation is required during the daytime there, which limits the times suitable for CO2 application and often prevents the full effect of CO2 application. This is one of the reasons that CO2 enrichment is not widely used in Japan compared to other countries [13]. Although Saga Prefecture is located in the southwestern warm regions of Japan, the solar radiation is often low in winter, and ventilation is required for a long time when the weather is clear (Figure 2). Therefore, in order to make the CO2 concentration higher than that of the outside air without waste, the method of automatically controlling the CO2 concentration depending on ventilation, that is, a method of increasing the CO2 concentration in the greenhouse only when the ventilation is closed, was examined. In the 2016 planting, the average total solar radiation for every 10 days from December to January was higher than that in 2015, and the CO2 concentration remained slightly lower than that in 2016 because of the longer ventilation (Figure 2).
The CO2 concentration in the greenhouse of the 800 μmol mol−1 treatment fluctuated between sunny days (Figure 3b) and cloudy rainy days (Figure 3e), especially in the severe cold season from December to February; the average daytime CO2 concentration for the 800 μmol mol−1 treatment remained higher than that for the 400 μmol mol−1 treatment (Figure 2). On the other hand, the marketable fruit yield for the 800 μmol mol−1 CO2 treatment was 130% higher than that for the 400 μmol mol−1 treatment in 2015, but 120% in 2016. As the average CO2 concentration was kept higher in 2015 than in 2016, it was considered that the rate of increase in yield was high in 2015. According to Kawashima [14], high-concentration CO2 enrichment requires the ventilation in the greenhouse to be closed, so it is considered to be suitable for low-temperature and low-solar-radiation areas. Low-solar-radiation areas in winter, such as Saga Prefecture, have been considered to exhibit weather conditions unfavorable for horticulture in the greenhouse, but a short ventilation time and ability to apply high concentrations of CO2 may be advantageous for horticulture in the greenhouse. Therefore, it is inferred that the results of this study may be effectively utilized in areas of low solar radiation in winter.
It was reported that increasing the CO2 concentration from 300 μmol mol−1 to 900 μmol mol−1 during the vegetative growth period of strawberries resulted in a significant increase in the dry matter weight of the leaves and roots [15]. However, in this study, there were no effects of the CO2 concentration on the plant height or leaf length x leaf width in the third fully expanded leaf (Figure 4). It is reported that about 90% of the photoassimilates were distributed in the berries at the fruit coloring stage [16]. In this study, it was inferred that the application of CO2 during fruit growth accelerated the distribution of photoassimilates induced by CO2 enrichment to the fruits and did not affect the plant height or leaf size. On the other hand, the number and average fruit weight and total yield of marketable fruits were increased significantly by 800 μmol mol−1 CO2 enrichment (Table 1). It has been reported that CO2 enrichment for strawberries resulted in an increase in yield depending on increases in the number of fruits and weight of fruit [9,17,18]. The results of the current study are similar to those reports. The CO2 amount used in the 800 μmol mol−1 treatment decreased after the April ventilation time increased, but the marketable fruit yield was significantly higher in the 800 μmol mol−1 treatment than in the 400 μmol mol−1 treatment throughout the cultivation period. It is said that the role of the increase in the yield of strawberries induced by CO2 enrichment is the maintenance of root activity by maintaining the amount of assimilation and preventing the fatigue of plants [9]. It was considered that the effect of CO2 enrichment in the winter continued even after April, when the period and the amount of CO2 used decreased, in this study, too. In the January–March period, the fruit Brix with the 800 μmol mol−1 CO2 treatment tended to be higher than that with the 400 μmol mol−1 CO2 treatment (Figure 5). It was previously reported that the sugar content of strawberry fruits is increased by CO2 enrichment [17,19], and the results of this study correspond to these reports. It was surmised that high-concentration CO2 enrichment increased the photosynthetic rate and more photoassimilates were produced, so the sugar content of the fruit increased.
The amount of CO2 used in this study was 57.1 kg in the 400 μmol mol−1 CO2 treatment, whereas it was 288.1 kg in the 800 μmol mol−1 CO2 treatment (Table 2). According to Kawashima [9], 260 to 400 kg 10a−1 of CO2 was required when CO2 was applied at 750 μmol mol−1 in a small greenhouse with a ridge height of 2.8 m. In this study, the CO2 concentration in the greenhouse was less frequently below 400 μmol mol−1 in the 400 μmol mol−1 CO2 treatment, and the amount of CO2 used was low because the greenhouse had a ridge height of 6.0 m. In this greenhouse, the ridge is high and the inside space is large, so it is thought that CO2 easily diffuses and a large amount of CO2 was required for the 800 μmol mol−1 CO2 treatment, but this was a small value in Kawashima’s report. The reason was thought to be the method of CO2 enrichment depending on the ventilation. A high concentration of CO2 in the greenhouse flows out when the ventilation opens [20,21], so it is considered that CO2 enrichment depending on ventilation is very efficient. In recent years, a device that can control the CO2 concentration according to ventilation or temperature in the greenhouse has actually started to be introduced [22]. It will be easy to maintain a high concentration of CO2 using such a device. In this study, strawberries were planted in two rows, and CO2 was applied from a tube placed at the base of the plant in the center of the row. The economic value was calculated based on applying CO2 for the whole greenhouse with a circulation fan, which is easy to introduce, but the CO2 consumption is smaller for local enrichment from the base of the plant. Since the plant height of strawberries is short, it is considered that the CO2 concentration near plants can be increased by applying CO2 locally, and CO2 can thus be applied more efficiently.
Next, in order to verify the physiological response of ‘Sagahonoka’ to changes in CO2 concentration, the effect of the CO2 concentration on the photosynthetic rate was measured. The photosynthetic rate increased sharply as the CO2 concentration was increased up to about 800 μmol mol−1; the photosynthetic rate at 800 μmol mol−1 was 1.6 times that at 400 μmol mol−1 (Figure 6). Among Japanese strawberry varieties, ‘Tochiotome’’s photosynthetic rate is reported in detail [23]. In this study, the photosynthetic rate of ‘Sagahonoka’ tended to saturate at 800–1000 μmol mol−1 CO2; similar results have been reported for ‘Tochiotome’. From these results, it was considered that the setting of high CO2 concentration treatment to 800 μmol mol−1 is adequate for the purpose of this study. The photosynthetic rate at 800 μmol mol−1 CO2 was significantly higher than that at 400 μmol mol−1 CO2 when the PPFD was 100 μmol m−2 s−1 or higher (Figure 7), so it was considered that the photosynthetic rate could be increased by increasing the CO2 concentration even at the light intensity equivalent to dark cloudy weather in the winter greenhouse. Based on this, it was considered that 800 μmol mol−1 CO2 treatments enhanced yield production because of the increase in the photosynthetic rate.
Furthermore, the effect of the CO2 concentration on the translocation of photosynthetic assimilates was examined. The growth chamber was set at 400 μmol mol−1 CO2 and 800 μmol mol−1 CO2, in the light period for 24 days from the flowering stage to the white ripening stage for primary fruit in secondary inflorescence. The dry weight of the aerial part and primary fruit were larger 24 days after flowering than 12 days after flowering and significantly larger with 800 μmol mol−1 CO2 than 400 μmol mol−1 CO2 24 days later (Table 3). It has been reported that the sink ability of strawberry fruits is maximized around the fruit coloring stage and then decreases toward the fruit ripening stage [24]. In the authors’ previous study using 13CO2, the distribution rate for primary fruit at the white ripening stage was the highest among the organs, and it was the largest sink [3,25]. The results of this study are similar to these, and the distribution rate for primary fruit was around 10% 12 days after flowering, but it was the largest, accounting for 50% or more, at 24 days after flowering (Figure 8). However, the distribution rate for primary fruit at 800 μmol mol−1 was 121% and 115% of that at 400 μmol mol−1 when 12 days and 24th after flowering, respectively. From this, it was clarified that the distribution to the largest fruit had started at 12 days after flowering (green ripening stage), which was considered to contribute to later increasing the dry weight of primary fruit. On the other hand, the photosynthetic rate was higher at 800 μmol mol−1 CO2 than 400 μmol mol−1 CO2 (Figure 6). Miyoshi et al. [26] reported that the day after CO2 enrichment was started, the strawberry crop photosynthesis and photosynthetic-assimilate translocation from source leaves were promoted; the results in this study indicate the same. Based on this, it was thought that more photosynthetic products were produced at 800 μmol mol−1 CO2 than 400 μmol mol−1 CO2, and as a result of the large amount of photosynthetic assimilates being translocated to primary fruit, which is the largest sink, primary fruit 24 days after flowering was significantly larger at 800 μmol mol−1 CO2 than 400 μmol mol−1 CO2. Experiments using 11CO2 with a plant positron imaging device (PETIS) revealed that it took about 60 min for the first 11C-photoassimilates to reach the fruit in eggplant [27] and in strawberries [28]. Miyoshi et al. [29] reported that the distribution pattern of 11C-photoassimilates translocated to fruits did not change during the light period, nor did the order of the sink activity change. In this study, it was clarified, similarly, that the translocation rate when the same amount of 13CO2 was taken in was not affected by the CO2 concentration. On the other hand, it is considered that a high CO2 concentration increased the photosynthetic rate, and many photoassimilates were translocated to the maximum sink; as a result, the size of the sink changed, which affected the distribution rate. In the future, it is expected that the translocation and distribution, in consideration of the sink–source balance at various growth stages, will be further analyzed; this will help in better clarifying the method of obtaining the maximum yield efficiently.

5. Conclusions

It was found that 800 μmol mol−1 treatment that maintained 800 μmol mol−1 CO2 and 400 μmol mol−1 CO2 or above during no ventilation and ventilation, respectively, resulted in the marketable fruit yield being increased by 25% and the fruit Brix being 0.2–1.2% higher, compared to 400 μmol mol−1 treatment that maintained 400 μmol mol−1 CO2 or above all day. Additionally, the economic value of the strawberries increased. Furthermore, the photosynthetic rate of ‘Sagahonoka’ increased linearly up to 800 μmol mol−1 CO2, and a high CO2 concentration did not affect the translocation rate but affected the distribution of the primary fruit, which was the greatest sink. It was clarified that CO2 enrichment at 800 μmol mol−1 for ‘Sagahonoka’ was effective in increasing the photosynthetic rate and the distribution of photoassimilates to fruits, and the yields of strawberries could be increased efficiently by the method of automatically controlling the CO2 concentration depending on the ventilation in the southern region of Japan.

Author Contributions

Conceptualization, A.T.; methodology, Y.O. and Y.S.; validation, A.T., M.E. and Y.I.; formal analysis, A.T., M.E., Y.I. and T.A.; investigation, A.T., M.E. and Y.I.; resources, A.T.; data curation, A.T.; writing—original draft preparation, A.T.; writing—review and editing, Y.O. and Y.S.; supervision, Y.O.; project administration, A.T.; funding acquisition, A.T. All authors have read and agreed to the published version of the manuscript.

Funding

This research received no external funding.

Institutional Review Board Statement

Not applicable.

Acknowledgments

We would like to express our sincere thanks to all members of the vegetable cultivation laboratory in the Saga Prefecture Agriculture Research Center.

Conflicts of Interest

The authors declare no conflict of interest.

References

  1. Ministry of Agriculture. Forestry and Fisheries in Japan. e-Stat. Portal Site of Official Statistics of Japan. 2019. Available online: http://www.maff.go.jp/j/tokei/kouhyou/sakumotu/index.html (accessed on 7 December 2021).
  2. Tanaka, M.; Tanaka, M. Research on high level carnation production technique in northern Kyushu. Bull. Saga. Agri. Expt. Sta. 1987, 24, 1–82. [Google Scholar]
  3. Tagawa, A.; Ito, Y.; Ehara, M.; Araki, T.; Ozaki, Y.; Shishido, Y. Effect of daytime heating on fruit yield, photosynthesis, translocation and distribution of 13C-photoassimilates of strawberry ‘Sagahonoka’ during winter season. J. Jpn. Soc. Hort. Sci. 2022, in press. [Google Scholar]
  4. Mortensen, L.M. Review: CO2 enrichment in greenhouses. Crop response. Sci. Hortic. 1987, 33, 1–25. [Google Scholar] [CrossRef]
  5. Poorter, H. Interspecific variation in the growth response of plants to an elevated ambient CO2 concentration. Vegetatio 1993, 104/105, 77–97. [Google Scholar] [CrossRef]
  6. Kawashiro, H.; Tsuchiya, K.; Sakiyama, H.; Udagawa, Y. Effects of low-concentration carbon dioxide supplementation on fruit yield and economic value of cucumber on forced culture. J. Jpn. Soc. Hort. Sci. 2009, 8, 445–449. [Google Scholar] [CrossRef]
  7. Kawashima, N.; Yamamoto, H.; Kurozumi, T.; Tanigawa, K.; Tanaka, Y. Studies on the CO2 enrichment in a greenhouse (4) Effect on the growth of some fruit vegetables. Bull. Nara. Agri. Expt. Sta. 1993, 24, 25–30. [Google Scholar]
  8. Balasooriya, H.N.; Dassanayake, K.B.; Seneweera, S.; Ajlouni, S. Interaction of elevated carbon dioxide and temperature on strawberry (Fragaria × ananassa) growth and fruit yield. Int. J. Agric. Biosyst. Eng. 2018, 12, 279–287. [Google Scholar]
  9. Kawashima, N. Studies on the CO2 enrichment in a greenhouse (3) Effect on the growth of strawberry. Bull. Nara. Agri. Expt. Sta. 1991, 22, 65–72. [Google Scholar]
  10. Sánchez-Guerrero, M.C.; Lorenzo, P.; Medrano, E.; Castilla, N.; Soriano, T.; Baille, A. Effect of variable CO2 enrichment on greenhouse production in mild winter climates. Agric. Meteorol. 2005, 132, 244–252. [Google Scholar] [CrossRef]
  11. Tagawa, A.; Mizoguchi, C.; Ehara, M.; Nakashima, T. The method of spread and partitioning of CO2 in the strawberry cultivation greenhouse. Environ. Cont. Biol. Abst. 2015, 164–165. [Google Scholar]
  12. Shishido, Y. Translocation and Distribution of Photoassimilates: Consider Vegetable Productivity; Yokendo: Tokyo, Japan, 2016; pp. 3–4. [Google Scholar]
  13. Kuroyanagi, T. History of carbon dioxide application in greenhouses and engineering approach to efficient application. Agric. Hortic. 2014, 89, 143–148. [Google Scholar]
  14. Kawashima, N. Present situation and problems of CO2 enrichment in a greenhouse. J. Agr. Met. 1991, 47, 177–182. [Google Scholar] [CrossRef]
  15. Chen, K.; Hu, G.Q.; Lenz, F. Effects of CO2 concentration on strawberry. I. Plant growth analysis. Angew. Bot. 1997, 71, 168–172. [Google Scholar]
  16. Nishizawa, T.; Hori, Y. Translocation and distribution of 14C-photoassimilates in strawberry plants varying in developmental stages of the inflorescence. J. Jpn. Soc. Hort. Sci. 1988, 57, 433–439. [Google Scholar] [CrossRef] [Green Version]
  17. Chen, K.; Hu, G.Q.; Lenz, F. Effects of CO2 concentration on strawberry. VI. Fruits yield and quality. Angew. Bot. 1997, 71, 195–200. [Google Scholar]
  18. Deng, X.; Woodward, F.I. The growth and yield responses of Fragaria ananassa to elevated CO2 and N supply. Ann. Bot. 1998, 81, 67–71. [Google Scholar] [CrossRef] [Green Version]
  19. Peng, S.; Mantri, N.; Lou, H.; Hu, Y.; Sun, D.; Zhu, Y.; Dongand, T.; Lu, H. Effects of elevated CO2 and temperature on yield and fruit quality of strawberry (Fragaria 6ananassa Duch.) at two levels of nitrogen application. PLoS ONE 2012, 7, e41000. [Google Scholar] [CrossRef]
  20. Kuroyanagi, T.; Yasuba, K.; Higashide, T.; Iwasaki, Y.; Takaichi, M. Efficiency of carbon dioxide enrichment in an unventilated greenhouse. Biosyst. Eng. 2014, 119, 58–68. [Google Scholar] [CrossRef]
  21. Yasutake, D.; Tanioka, H.; Ino, A.; Takahashi, A.; Yokoyama, T.; Mori, M.; Kitano, M.; Miyauchi, K. Dynamic evaluation of natural ventilation characteristics of a greenhouse with CO2 enrichment. Acad. J. Agric. Res. 2017, 5, 312–319. [Google Scholar] [CrossRef]
  22. Iwasaki, Y. Chapter 5. Carbon Dioxide control. In Greenhouse Horticulture Plant Factory Handbook; Japan Greenhouse Horticulture Association, Ed.; Rural Culture Association: Tokyo, Japan, 2015; p. 186. [Google Scholar]
  23. Wada, Y.; Soeno, T.; Inaba, Y. Effects of light and temperature on photosynthetic enhancement by high CO2 concentration of strawberry cultivar ‘Tochiotome’ leaves under forcing or half-forcing culture. Jpn. J. Crop. Sci. 2010, 79, 192–197. [Google Scholar] [CrossRef] [Green Version]
  24. Forney, C.F.; Breen, P.J. Growth of strawberry fruit and sugar uptake of fruit discs at different inflorescence positions. Sci. Hortic. 1985, 27, 55–62. [Google Scholar] [CrossRef]
  25. Tagawa, A.; Ito, Y.; Ehara, M.; Araki, T.; Ozaki, Y.; Shishido, Y. Effect of Day and Night Temperature on Translocation and Distribution of 13C- Photosynthetic Assimilates in Strawberry ‘Sagahonoka’. J. Japan. Soc. Hort. Sci. 2021, 20, 95–100. [Google Scholar] [CrossRef]
  26. Miyoshi, Y.; Hidaka, K.; Okayasu, T.; Yasutake, D.; Kitano, M. Effects of local CO2 enrichment on strawberry cultivation during the winter season. Environ. Control. Biol. 2017, 55, 165–170. [Google Scholar] [CrossRef] [Green Version]
  27. Kikuchi, K.; Ishii, S.; Fujimaki, S.; Suzui, N.; Matsuhashi, S.; Honda, I.; Shishido, Y.; Kawachi, N. Real-time analysis of photoassimilate translocation in intact eggplant fruit using 11CO2 and a positron-emitting tracer imaging system. J. Jpn. Soc. Hort. Sci. 2008, 77, 199–205. [Google Scholar] [CrossRef] [Green Version]
  28. Hidaka, K.; Miyoshi, Y.; Ishii, S.; Suzui, N.; Yin, Y.; Kurita, K.; Nagao, K.; Araki, T.; Yasutake, D.; Kitano, M.; et al. Dynamic analysis of photosynthate translocation into strawberry fruits using non-invasive 11C-labeling supported with conventional destructive measurements using 13C-labeling. Front. Plant Sci. 2019, 9, 1–12. [Google Scholar] [CrossRef]
  29. Miyoshi, Y.; Hidaka, K.; Yin, Y.; Suzui, N.; Kurita, K.; Kawachi, N. Non-invasive 11C-imaging revealed the spatiotemporal variability in the translocation of photosynthates into strawberry fruits in response to increasing daylight integrals at leaf surface. Front. Plant Sci. 2021, 12, 1–14. [Google Scholar] [CrossRef]
Figure 1. A schematic illustration of 800 μmol mol−1 treatment where the CO2 concentration was kept above 800 μmol mol−1 during no ventilation and 400 μmol mol−1 during ventilation.
Agronomy 12 00473 g001
Figure 2. The change in average daytime CO2 concentration (a), total solar radiation, and daily average outside temperature (b). Daytime means sunrise to sunset; 400 μmol mol−1 treatment where minimum CO2 concentration is kept more than 400 μmol mol−1 in all day and 800 μmol mol−1 treatment where minimum CO2 concentration is kept more than 800 μmol mol−1 during no ventilation and 400 μmol mol−1 during ventilation.
Agronomy 12 00473 g002
Figure 3. The change in ventilation rate, CO2 enrichment status, CO2 concentration, and air temperature in the greenhouse, solar radiation in the sunny day (ac) and cloudy day (df). The sunny day (ac) is 28 January 2017, total solar radiation was 14.79 MJ m−2. The cloudy day (df) is 12 January 2017, total solar radiation was 5.40 MJ m−2. CO2 enrichment status means ON: 10, OFF: 0. CO2 concentration was controlled that 400 µmol mol−1 treatment was kept more than 400 µmol mol−1 in all day and 800 µmol mol−1 treatment was kept more than 800 µmol mol−1 and 400 µmol mol−1 during no ventilation and ventilation, respectively.
Agronomy 12 00473 g003
Figure 4. Effect of different concentrations of CO2 enrichment on the growth of strawberry ‘Sagahonoka’ ((a): Plant height, (b): Leaf length × Leaf width). CO2 concentration was controlled that 400 µmol mol−1 treatment was kept more than 400 µmol mol−1 in all day and 800 µmol mol−1 treatment was kept more than 800 µmol mol−1 and 400 µmol mol−1 during no ventilation and ventilation, respectively. * Is significantly different at 5% levels, respectively, by t-test.
Agronomy 12 00473 g004
Figure 5. Effects of different concentrations of CO2 enrichment on the fruit Brix of strawberry ‘Sagahonoka’. CO2 concentration was controlled that 400 µmol mol−1 treatment was kept more than 400 µmol mol−1 in all day and 800 µmol mol−1 treatment was kept more than 800 µmol mol−1 and 400 µmol mol−1 during no ventilation and ventilation, respectively. * and ** are significantly different at 5% and 1% levels, respectively, by t-test.
Agronomy 12 00473 g005
Figure 6. The relation of CO2 concentration and photosynthetic rate of strawberry ‘Sagahonoka’. The measurement conditions are PPFD 1000 μmol m−2 s−1, leaf temperature 20 °C, relative humidity 70%.
Agronomy 12 00473 g006
Figure 7. The relationship PPFD and photosynthetic rate of strawberry ‘Sagahonoka’. ** is significantly different at 1% level by t-test. Error bar means standard error (n = 4). The measurement conditions are leaf temperature 20 °C, relative humidity 70%.
Agronomy 12 00473 g007
Figure 8. Effects of CO2 concentration on translocation and distribution rates of 13C-photoassimilates. CO2 enrichment were 400 μmol mol−1 and 800 μmol mol−1 during the light period in the growth chamber.
Agronomy 12 00473 g008
Table 1. Effect of different concentrations of CO2 enrichment on number of marketable fruits, average fruit weight, marketable fruits rate, and marketable fruits yield of strawberry ‘Sagahonoka’.
YearCO2
Treatment
(µmol mol−1)
Number of Marketable Fruits per PlantAverage Fruit Weight (g)Marketable Fruit Rate
(%)
Marketable Fruits Yield per Plant
(g)
MonthTotal
11–121–23–45–6
201540038.613.481.474.6126.2179.0135.6515.4
80048.014.487.696.5171.4215.3193.4676.6
201640035.413.578.850.3124.6158.1143.5476.4
80041.413.980.867.1129.0186.7193.0575.8
Year*nsns****ns*
CO2 treatment***ns********
Interactionnsnsnsns*nsnsns
CO2 concentration was controlled that 400 µmol mol−1 treatment was kept more than 400 µmol mol−1 in all day and 800 µmol mol−1 treatment was kept more than 800 µmol mol−1 and 400 µmol mol−1 during no ventilation and ventilation, respectively. **and * are significantly different at 1% and 5% levels, respectively, by two-way ANOVA, and ns is not significantly different.
Table 2. Economic value of strawberry ‘Sagahonoka’ cultivated at different CO2 concentrations.
CO2 TreatmentCO2 Amount Used 1Returns 2Shipping Cost 4CO2 Application Cost (Yen a−1)Difference of Returns 7
(µmol mol−1)(kg a−1)(Yen a−1) 3(Yen a−1)Equipment Cost 5LPG Fuel Cost 6(Yen a−1)
40057.1484,783105,68315002997-
800288.1610,693133,131440015,123-
Difference231.0125,91027,448290012,12683,436
Rate of 800/400(%)505126126293505-
CO2 concentration was controlled that 400 µmol mol−1 treatment was kept more than 400 µmol mol−1 in all day and 800 µmol mol−1.treatment was kept more than 800 µmol mol−1 and 400 µmol mol−1 during no ventilation and ventilation, respectively. 1 Estimated as CO2 enrichment by circulation fan it used 146% CO2 by local enrichment. 2 Estimated yields of marketable fruits and annual average price in 2015 and 2016 of JA Saga. 3 USD 1 = 115 Yen (November 2021). 4 Shipping cost is calculated as 253.7 Yen/kg−1. 5 Rental fee of LPG burning CO2 generator. 800 µmol mol−1 treatment is estimated adding CO2 controller depending on air temperature (depreciation period is 7 years).6 Estimated using LPG as 350 Yen/m−3. 7 Difference of Returns = Returns − Shipping Cost − Equipment Cost − LPG fuel Cost.
Table 3. Effects of different concentration of CO2 enrichment on dry matter weight of each part of strawberry ‘Sagahonoka’.
Experimental PlotLeaves (3rd–7th Leaf)New Leaves (First–Second Leaf)Total Leaves 2CrownAerial Part 3Roots
PeriodCO2 Concentration 1 (μmol mol−1)
Flowering time-6.90 ± 0.25 a3.36 ± 0.24 a10.26 ± 0.19 ab2.42 ± 0.1213.48 ± 0.24 c6.86 ± 0.41 cd
12days After flowering4007.52 ± 0.25 a2.21 ± 0.23 c9.73 ± 0.46 ab2.79 ± 0.1714.50 ± 0.31 c8.62 ± 0.53 bc
8007.53 ± 0.17 a1.96 ± 0.05 c9.49 ± 0.19 ab2.63 ± 0.1614.38 ± 0.20 c9.74 ± 0.88 ab
24days After flowering4006.60 ± 0.20 a2.23 ± 0.15 bc8.83 ± 0.35 b2.75 ± 0.0617.47 ± 0.75 b10.77 ± 0.26 ab
8007.66 ± 0.39 a2.99 ± 0.15 ab10.66 ± 0.47 a2.88 ± 0.1320.18 ± 0.66 a11.07 ± 0.64 a
Experimental PlotPrimary FruitSecondary FruitsTertiary FruitsPeduncleFruit Bunch 4Total 5
PeriodCO2 Concentration (μmol mol−1)
Flowering time-----0.81 ± 0.03 c20.34 ± 0.62 cd
12days After flowering4000.56 ± 0.06 c0.39 ± 0.05 b0.27 ± 0.04 b0.75 ± 0.08 b1.97 ± 0.20 bc23.12 ± 0.36 bc
8000.63 ± 0.04 c0.47 ± 0.04 b0.34 ± 0.02 b0.82 ± 0.05 b2.27 ± 0.15 b24.12 ± 0.90 b
24days After flowering4002.35 ± 0.14 b1.44 ± 0.19 a0.93 ± 0.14 a1.18 ± 0.13 a5.90 ± 0.46 a28.69 ± 0.82 a
8002.87 ± 0.12 a1.56 ± 0.18 a1.06 ± 0.10 a1.16 ± 0.03 a6.65 ± 0.36 a31.25 ± 0.95 a
1 CO2 enrichment was 400 μmol mol−1 and 800 μmol mol−1 during the light period in the growth chamber. 2 Total leaves = Leaves + New leaves. 3 Aerial part = Total leaves + Fruit bunch + Crown. 4 Fruit bunch = Fruits (Primary-Tertiary) + Peduncle. 5 Total = Aerial part + Roots. Number means the average ± standard error of 5 plants. There is a significant difference at the 5% level by the Tukey test between different alphabet in the same column.
Publisher’s Note: MDPI stays neutral with regard to jurisdictional claims in published maps and institutional affiliations.

