3.2. Influence of the Insect-Proof Screen on the Turbulence of the Airflow
The passage of air through porous media, such as IPSs, causes the laminarization of the airflow [
53,
54]. From the analysis of the turbulence intensity
i inside and outside the greenhouse, it has been observed that for the air velocity,
i is lower inside the greenhouse only in one out of four of the tests. The same situation also occurs in the transversal
iy and vertical
iz components (shown in
Table 4). The laminarization effect of the IPS is observed when analyzing the longitudinal component
ux perpendicular to the window and the pore section of the IPS. The turbulence intensity
ix is reduced when passing through the IPS, except in Test 2, carried out at very low wind speed. This may be due to several reasons. First, in this situation, the thermal effect plays an important role in greenhouse ventilation, and its contribution is greater to the airflow on the inner side of the window. Second, as aforesaid when describing velocity, the variations in velocity when passing through the IPS are mostly noticed in a region close to the pore, and the length of this region depends on the wind velocity [
49]. Thus, if the anemometers are placed at the same distance in all tests, there may be some differences in the behavior of a parameter. Furthermore, in Tests 3 and 4, the vertical component
iz has a significant increase inside the greenhouse. This is due to the buoyancy forces acting in the z-direction, which appears due to the great difference in humidity inside and outside and temperature effect, as also observed in Teitel et al. [
16] in measurements inside and outside greenhouses. In addition, it must be noted that the tests have been carried out in an open system: if the airflow would be isolated, for example, in a wind tunnel, results may vary slightly, as, for instance, buoyancy effects would not take place.
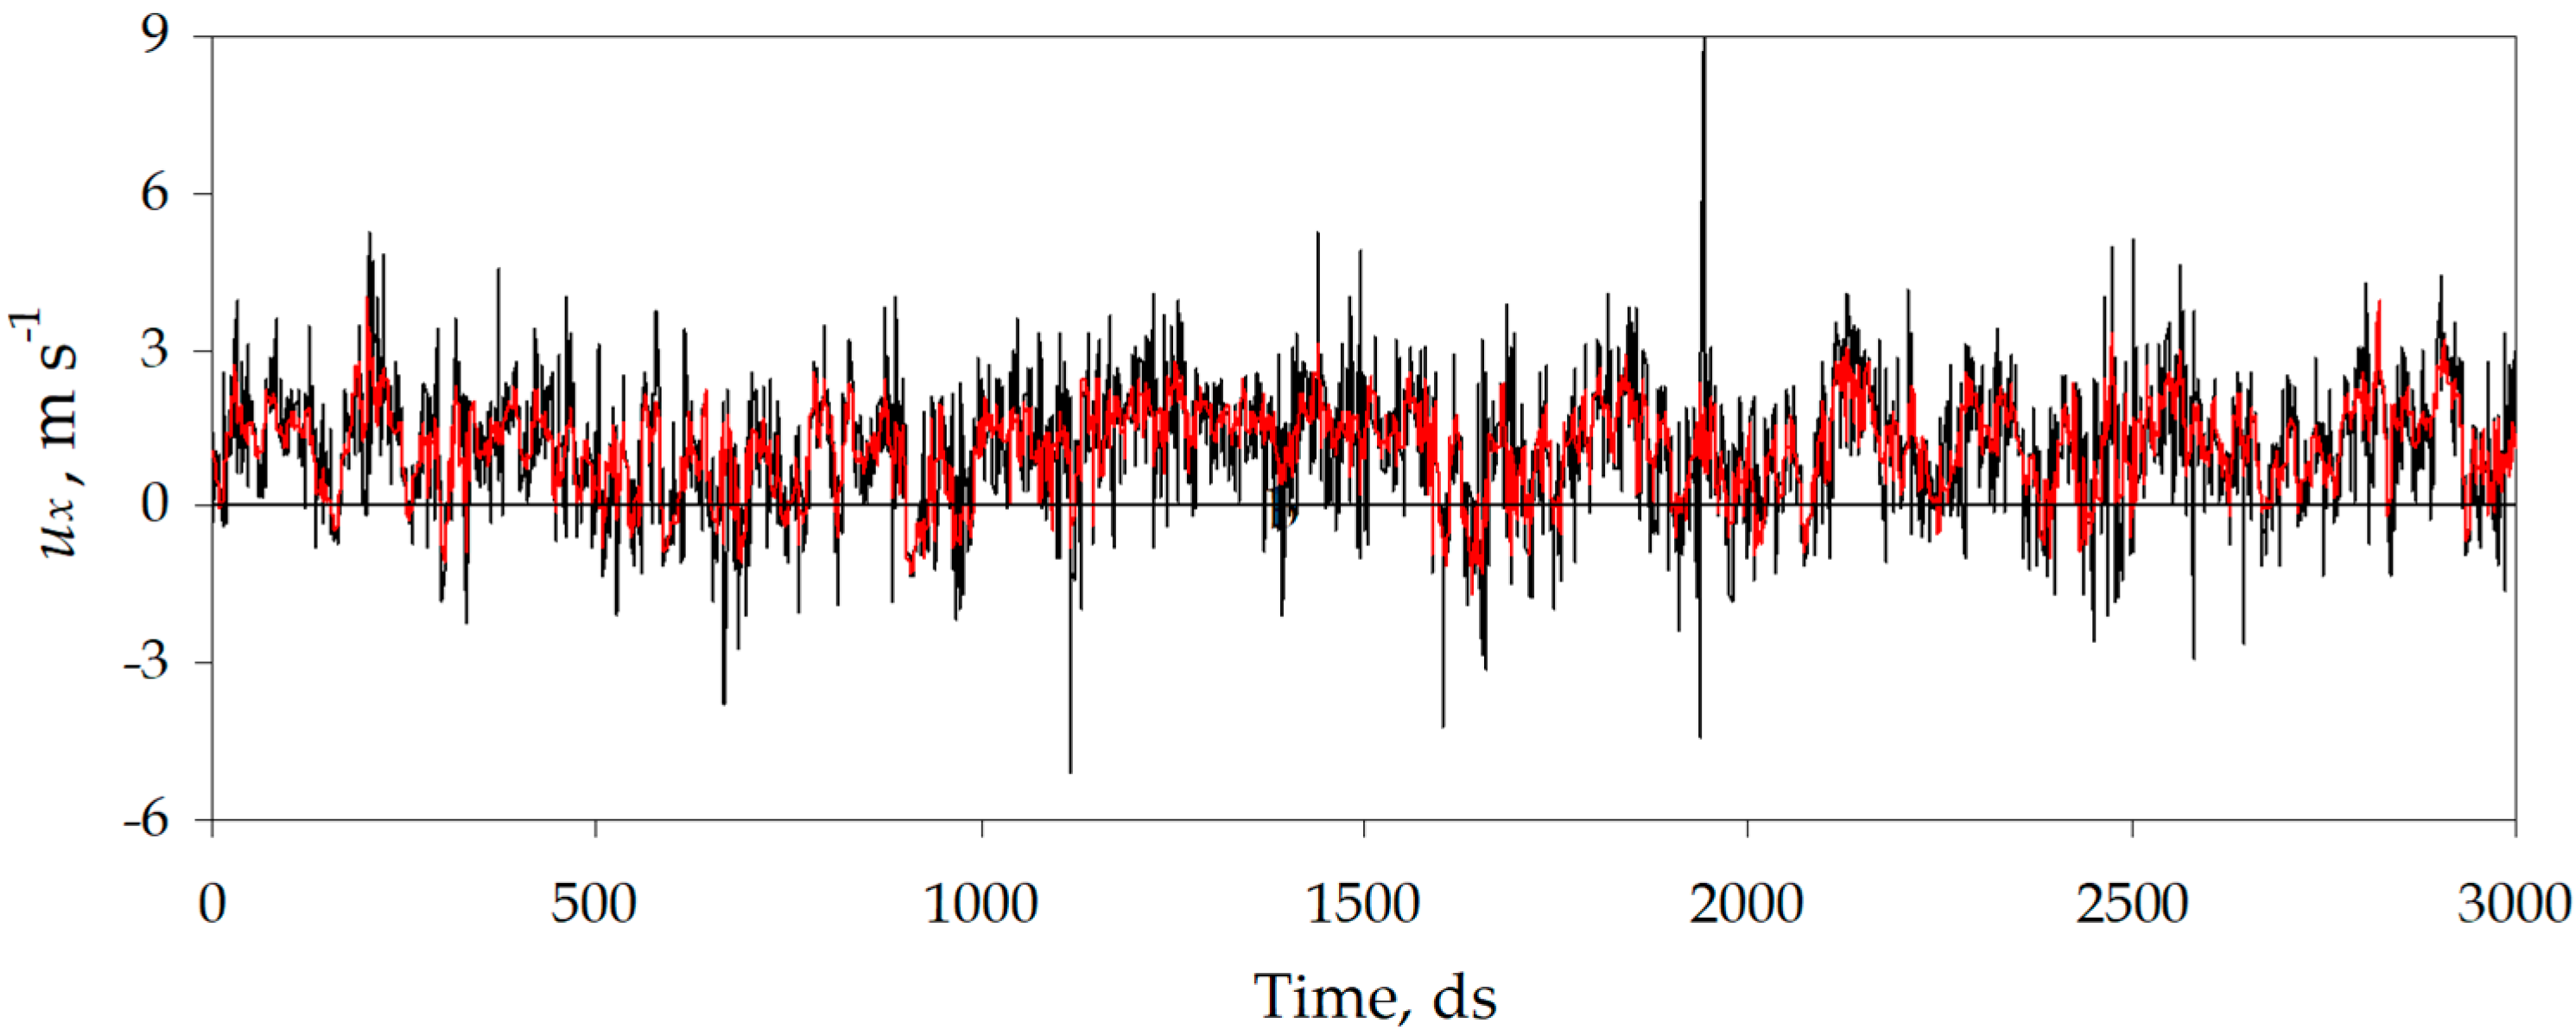
The porous IPS acts as a filter mainly for the
ux component, as it reduces part of the large fluctuations, while the lower variations are kept around the mean value (see
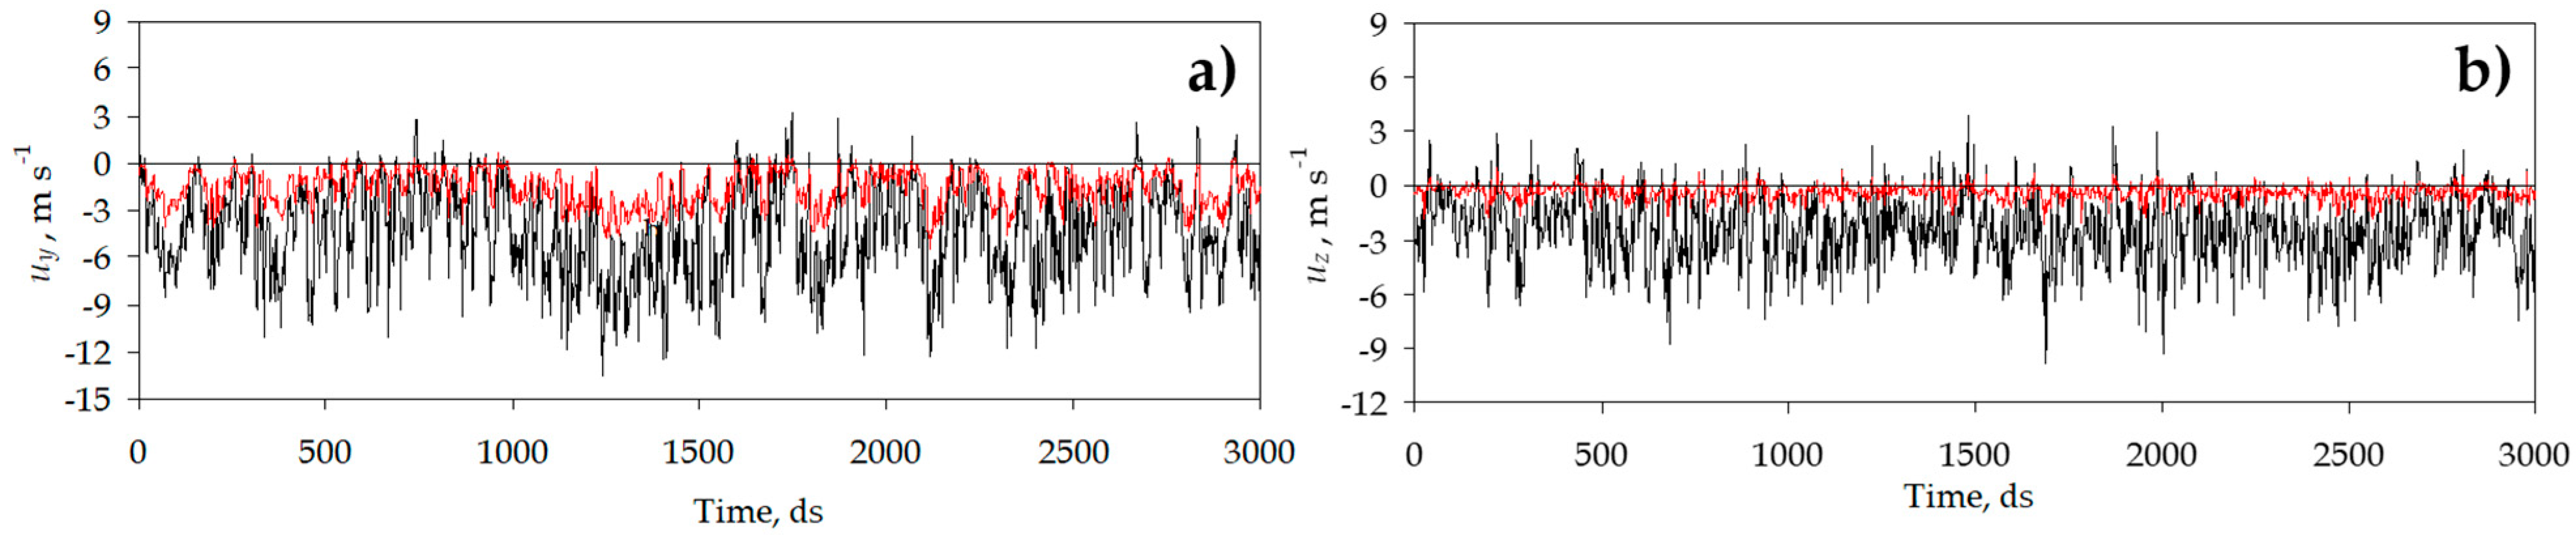
Figure 5). On the other hand, for the transversal and vertical components (see
Figure 6), in addition, to eliminate part of the large fluctuations, it considerably reduces the mean value of these components. This is reasonable because the size of the pores can filter only larger velocity fluctuations, and as the size of the pore increases (and actually the porosity), the filtering may be less noticeable. Thus, the filtering effect in
uy and
uz is directly related to the reduction of the turbulence scales for the said components after passing through the IPS (
Table 5). In this table, the macroscale (average size of the largest eddies) and microscale (average size of the smallest eddies) parameters are given (including also their three components) for the turbulence inside and outside the window sides observing a dramatical reduction in turbulence.
As also observed by other researchers, the use of a high-density IPS, such as the one studied in this work, reduces turbulence dramatically, whilst the spectral decay rate is increased. This is observed by a transition to smaller turbulence flow scales, which are less energetic and dissipative in the evacuation of heat and mass from the greenhouse [
2]. Thus, providing additional information on the characteristics of the turbulence filtering of IPS as performed in the present work is essential since the larger the size of the eddies, the more dominant the turbulent mixing, and hence the more efficient the ventilation is. Furthermore, as pointed out in Tanny et al. [
29], to find the potential relations between the turbulent scales and the geometric parameters of the IPS is of significant interest in the design of efficient, low-cost, and sustainable natural ventilation systems.
The effect on the scales of the turbulence of the IPS is different according to the orthogonal component of the air velocity considered. The structure of the IPS causes the breaking of the turbulence scales for the transverse component (
Liy and
λy) and the vertical component (
Liz and
λz), while an increase in the turbulence scales of the longitudinal component (
Lix and
λx) (
Table 5). This increase in the turbulence scale may be the consequence of the grid-generated effect on turbulence, which is adopted in many fluid dynamics experiments to generate turbulent flows by passing laminar flows through grids [
46,
55]. More specifically, for
uy and
uz, at each pore, there are top–bottom and left–right threads contributing to the filtering. However, for
ux, two scenarios take place together: small eddies can pass through the pore with minimal perturbations, and larger eddies may split or break due to the presence of the threads, leading quicker to smaller eddies entering the greenhouse. Thus, the macroscale of the longitudinal component
Lix can increase up to 220% on the inner face of the window and the microscale
λx up to 429% (Test 4). On the contrary, for the other two components, the macroscale is reduced by an average of 75% and 72% for the transversal component
Liy and vertical
Liz, respectively. Likewise, the microscale is reduced by an average of 74% and 87% for
λy and
λz, respectively. The increase in the longitudinal component of the turbulence scale and decrease in the transversal and vertical components has also been noticed by Teitel et al. [
16]. Although they characterized turbulence inside the greenhouse and not near the IPSs, they noticed the same behavior mainly due to the top bound and side bounds of the canopy. In our case, the threads also create lateral and top bounds that constrain the airflow, but not in the longitudinal motion, hence the here shown observation.
The main drawback from the use of IPSs is the reduction of the turbulent kinetic energy,
k, and the energy dissipation rate,
ε. The most relevant and useful characteristic of turbulence flows in natural ventilation is the ability of turbulent flows to mix and transport heat and water vapor [
28,
29]. This is mainly attributed to the turbulence kinetic energy: the higher the
k, the more efficient the heat and mass transfer. Unfortunately, the use of IPSs on the greenhouse window drastically reduced such turbulence kinetic energy levels, with an average reduction in turbulence kinetic energy
k of 95%, but even reaching reductions of up to 99.97% (Test 2). The dissipation rate was also reduced (average reduction of 99.9%).
The energy levels observed on the outer face of the side window are similar to the values observed by Boulard et al. [
56] inside a screenless tunnel greenhouse, with
k values greater than 1.44 m
2 s
−2, and
ε greater than 1.44 m
2 s
−3 in the lateral windward ventilation openings. Similar facts were observed in the macroscale. They indicated maximum values of
Lix equal to 8.37 m,
Liy equal to 3.76 m, and
Liz equal to 2.07 m in the windward-oriented window.
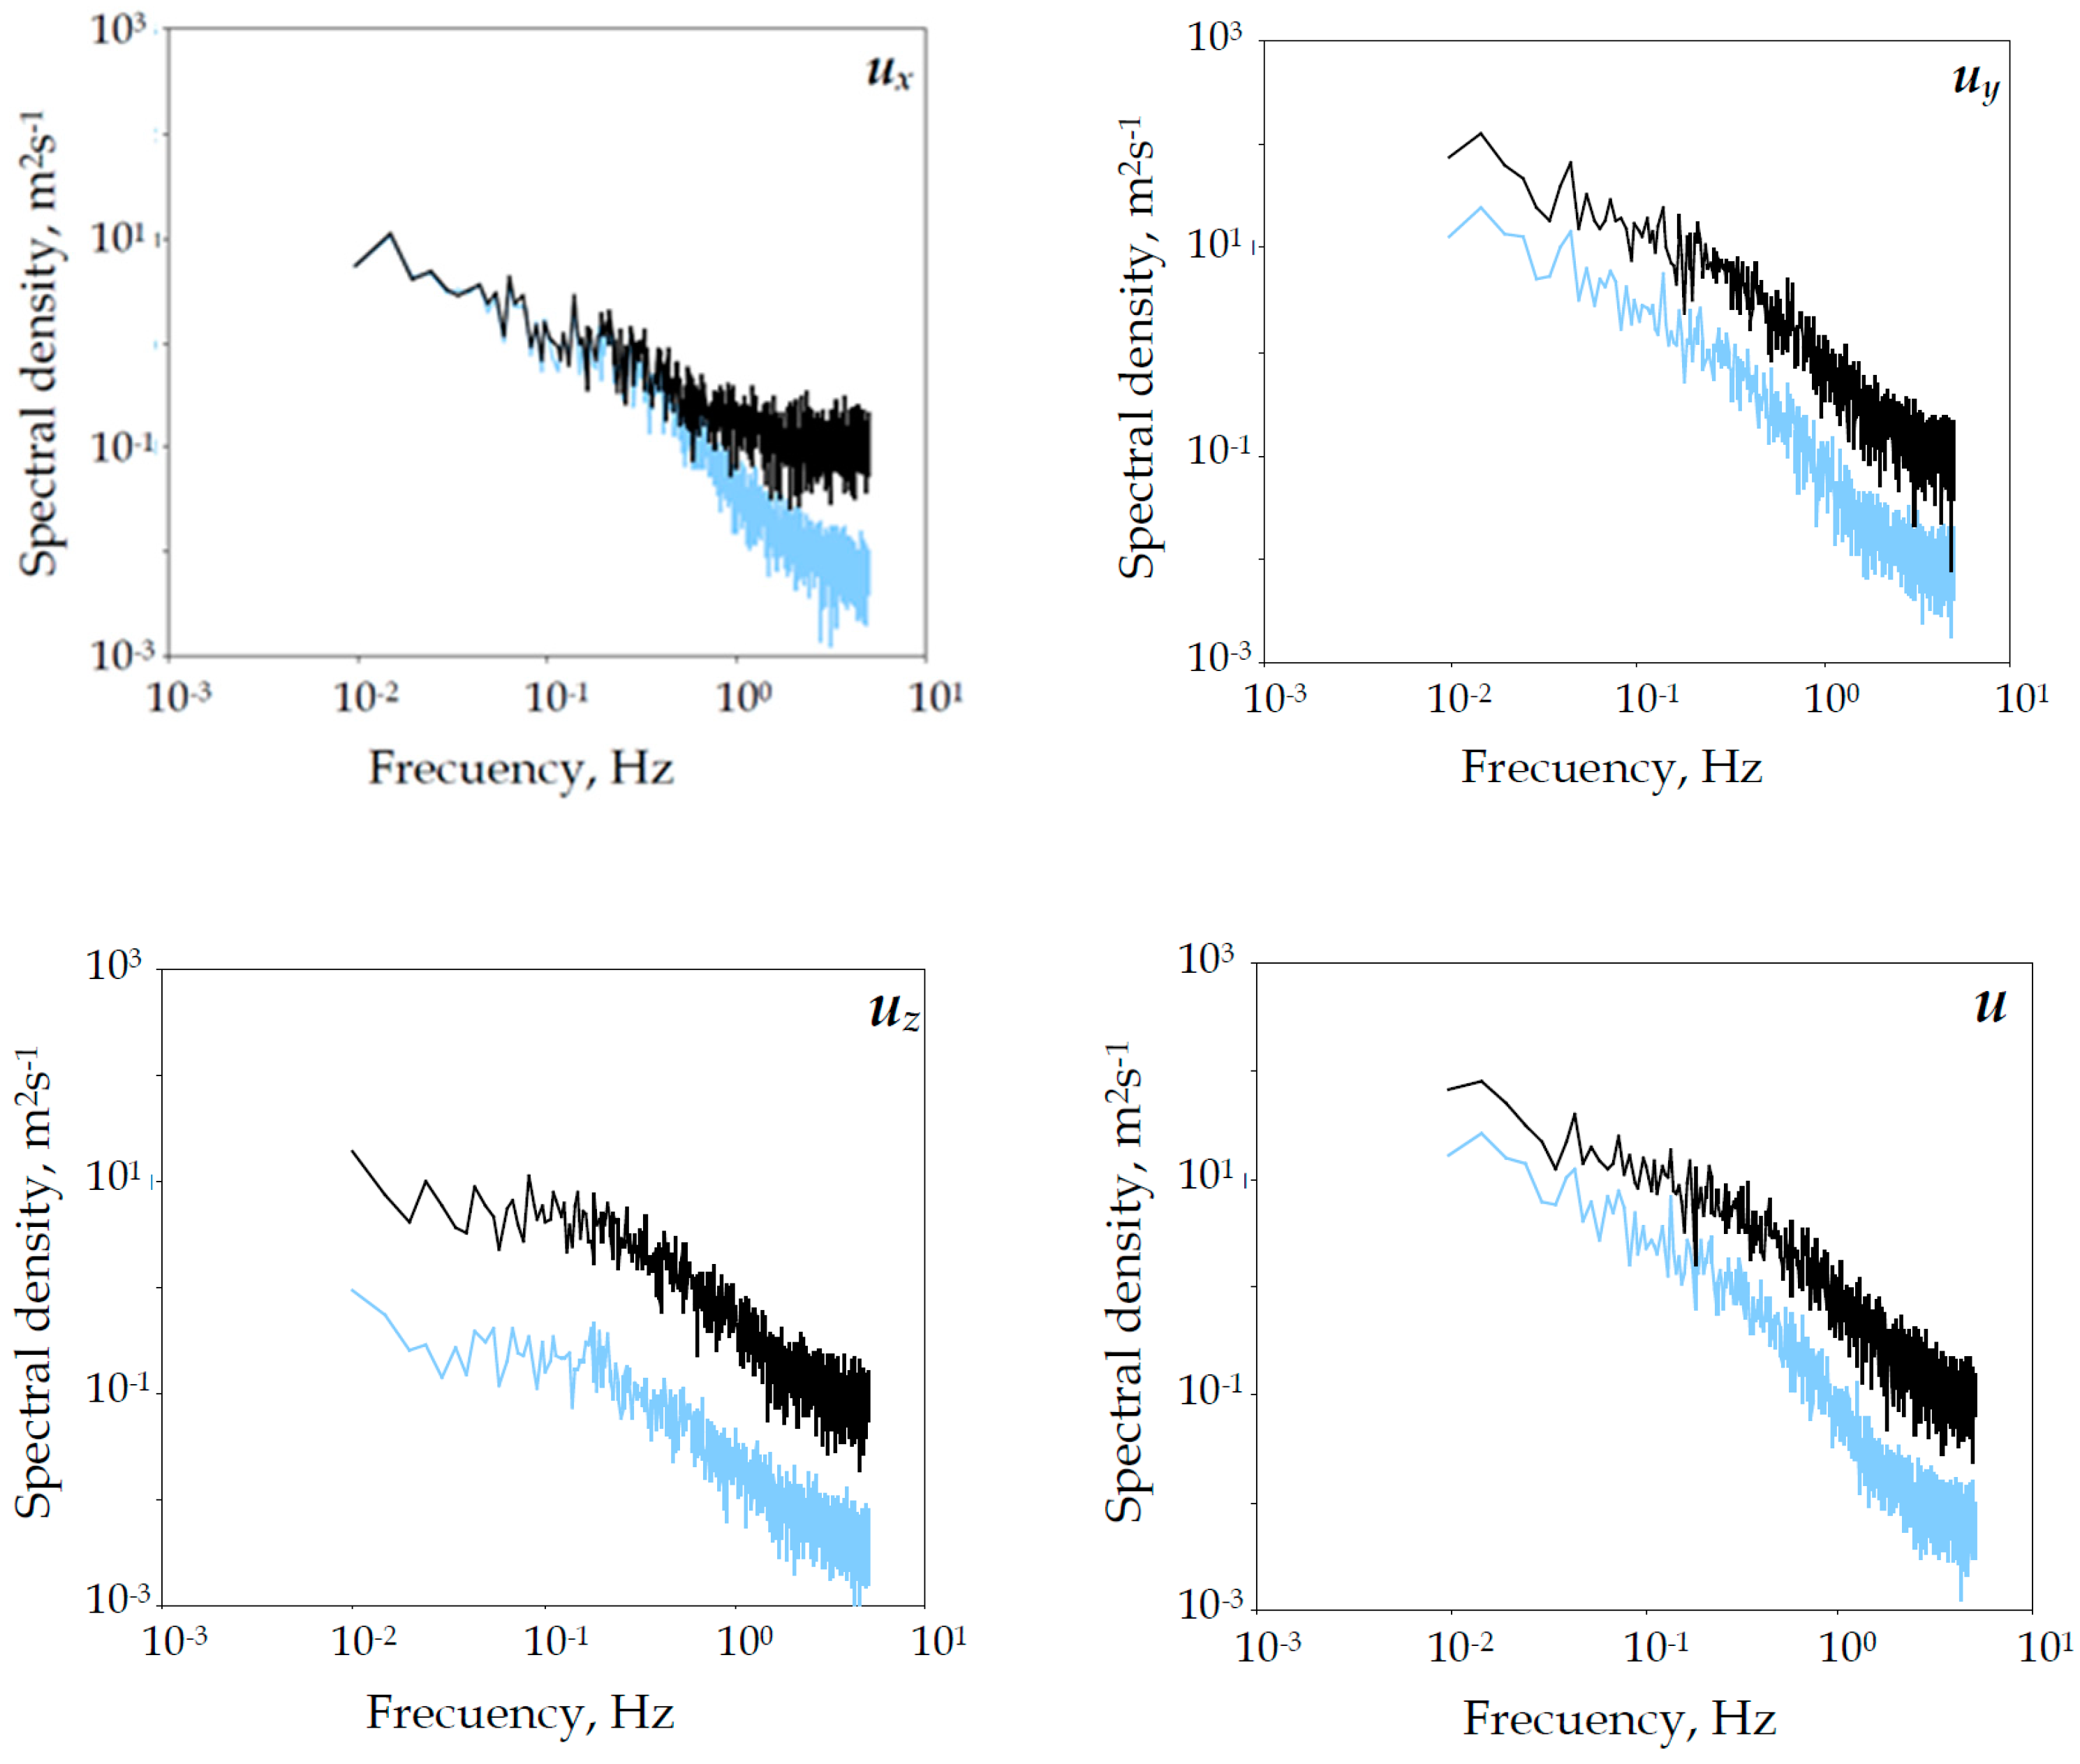
The reduction in energy suffered after passing through the IPS is clearly observed in the plot of the energy density spectra on the inner and outer faces of the window. Teitel and Tanny [
27] used a one-dimensional sonic anemometer to certify that the use of a high-mesh IPS leads to a reduction in turbulence levels and scales and an increase in the spectral decay rate. However, since they used a one-dimensional anemometer, they could not observe the effect on each airflow vector field component. In the present investigation, 3D sonic anemometers have been used, being possible to observe that the impact on each component is not the same. Spectra of the velocity components were calculated using detrended records of the 30 min data acquired by a sonic anemometer at a sampling rate of 10 Hz. The 30 min period was subdivided into six consecutive sections of 5 min, each with 3000 data points. A spectrum was calculated for each section, and the six resulting values were averaged. The results for each velocity component and total velocity are shown in
Figure 7.
From
Figure 7, interesting observations can be made. In the transversal and vertical components
uy and
uz, turbulence energy is reduced throughout the entire frequency range. However, in the longitudinal component
ux, the energy transported in the larger scales (at low frequency) is maintained after passing through the mesh, whereas the energy transported by the smaller scales (high frequency) is dissipated or lost when passing through the porous mesh. For the total airflow velocity
u, the results obtained agree with the observations made by Teitel and Tanny [
27], which confirms that the turbulence energy decreases and the spectral decay rate is increased. It is obvious that this loss of energy at high frequency is what produces the reduction in the velocity fluctuations of
ux (seen in
Figure 5). Regarding the other two components, the turbulence energy at low and high frequencies is reduced, which results in a decrease in the average airspeed and also in fluctuations (
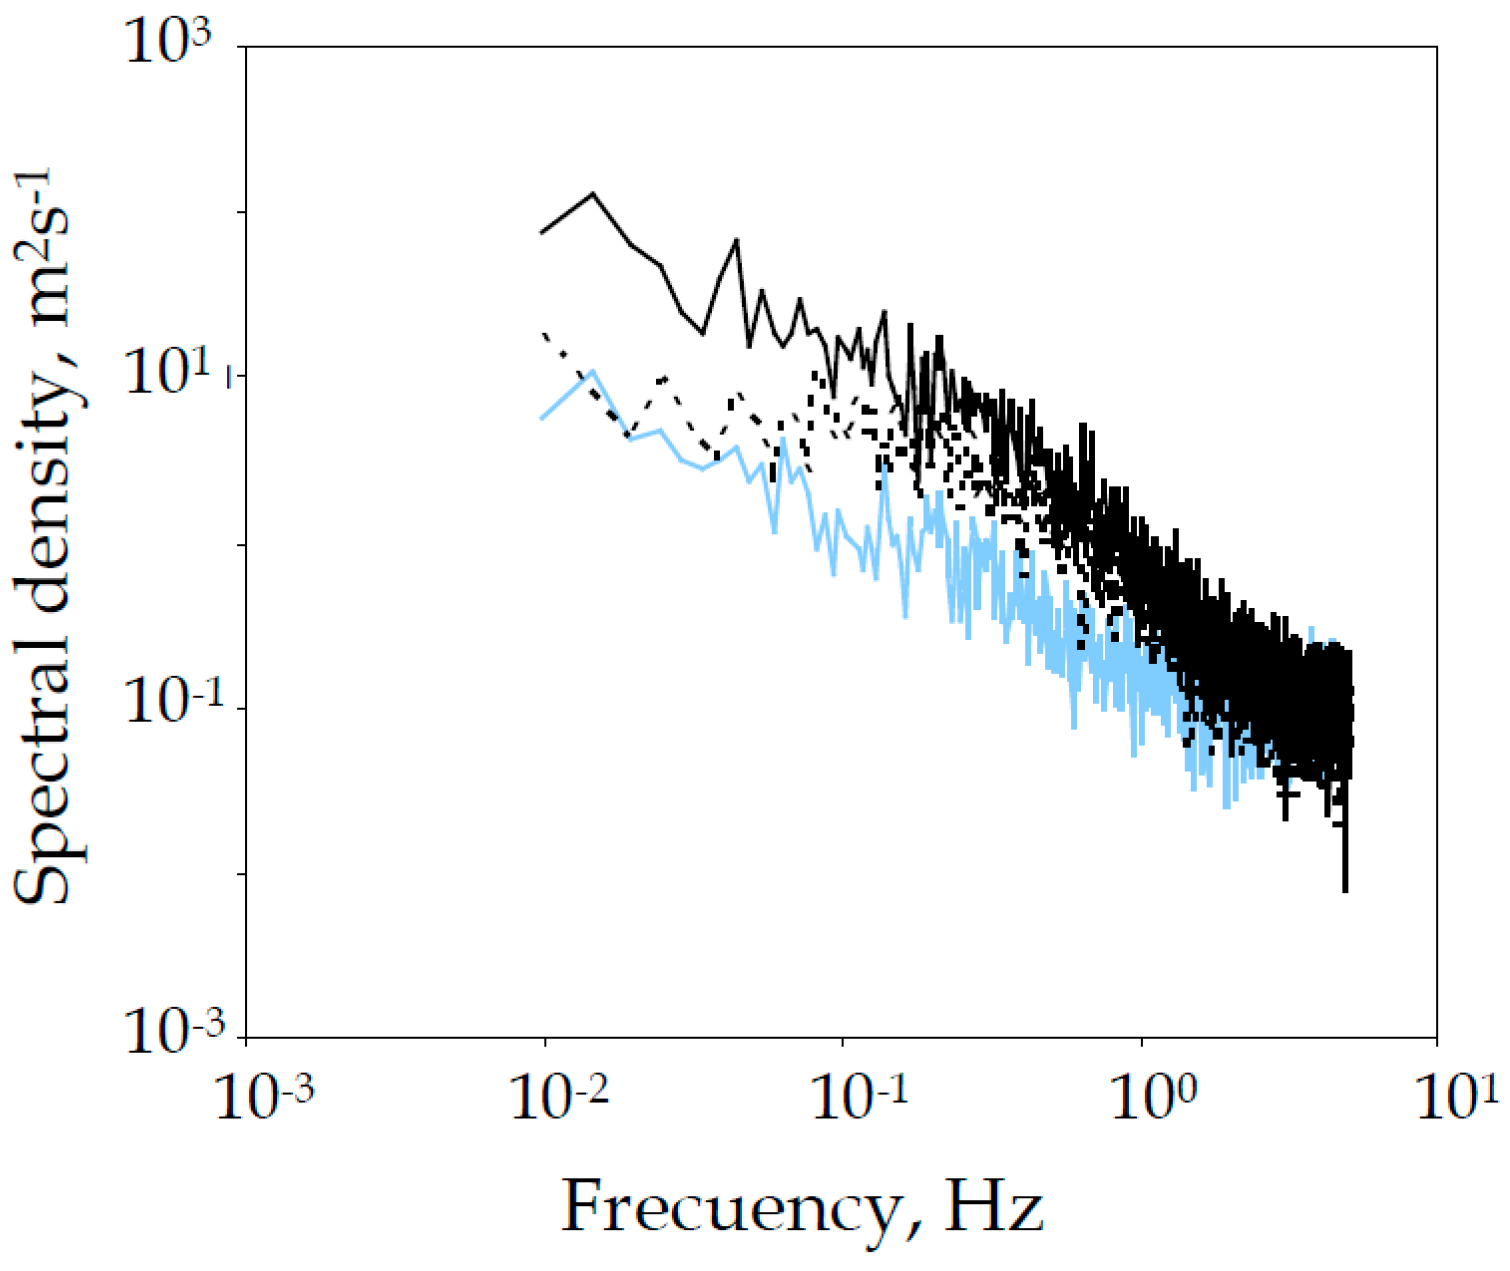
Figure 6). The passage of air through the mesh pores also causes a generalized increase in the slope of the spectrum (see
Table 6 and
Figure 7) [
2]. A greater slope of the spectrum indicates a greater distribution of energy in the larger scales (lower frequencies). In addition, if the three spectral density plots are matched, it can be observed that the one corresponding to
ux is less energetic (
Figure 8). Most of the airflow turbulence energy is transported in the transverse and vertical components. An important part of such energy is lost as discussed above, either when passing through the mesh or because of the air rejection due to the barrier created by the IPS threads, perhaps even avoiding part of the mass-flow rate to enter into the greenhouse as part of the flow may be deviated by the screen.


 ,
, 


 ).
).

