Article

Phenotypic Divergence among Sweet Pepper Landraces Assessed by Agro-Morphological Characterization as a Biodiversity Source

by
Eva Martínez-Ispizua
1,
Ángeles Calatayud
1,
José Ignacio Marsal
1,
Rubén Mateos-Fernández
2,
María José Díez
3,
Salvador Soler
3,
José Vicente Valcárcel
3 and
Mary-Rus Martínez-Cuenca
1,*
1
Valencian Institute for Agricultural Research (IVIA), CV-315, Km 10.7, 46113 Moncada, Spain
2
Plants Genomics and Biotechnology Department, Institute for Plant Molecular and Cell Biology (IBMCP), 46022 Valencia, Spain
3
Valencian Institute for the Conservation and Improvement of Agrobiodiversity (COMAV), Polytechnic University of Valencia, Camino de Vera s/n, 46022 Valencia, Spain
*
Author to whom correspondence should be addressed.
Agronomy 2022, 12(3), 632; https://doi.org/10.3390/agronomy12030632
Submission received: 27 January 2022 / Revised: 28 February 2022 / Accepted: 2 March 2022 / Published: 4 March 2022
(This article belongs to the Special Issue Utilizing Genetic Resources for Agronomic Traits Improvement)

Abstract

:
Traditional vegetable varieties constitute an important reservoir of biodiversity, so recovering, cultivating, and correctly classifying these landraces is part of key global heritage for the future of food security. In this study, 17 traditional pepper varieties from the Valencian Community (Spain) were characterized using 14 quantitative and 30 qualitative conventional morphological descriptors, including plant, flower, and fruit traits, in two ripening stages: green and red. As a result, landraces were grouped based mainly on their fruit morphology (G1: thin and elongated; G2: thick and robust; P-49: ball pepper). During a second trial, the preservation of the described characteristics was checked, and the number of fruit produced per plant was determined. From the acquired information, the most desirable traits that could be of interest for cultivation and harvesting practices were established, including erect growth habit, dense branching, big leaves, and uniformity and low persistence of fruit. Additionally, based mainly on fruit size and fruit wall thickness traits, the varieties with the highest potential to be marketed as fresh, P-37 (from G2), P-41, and P-72 (from G1), were determined. The ungrouped P-49 variety is an optimal candidate for industry processes because of its small size and robust fruit wall. The importance of phenotyping studies for preserving plant varieties is emphasized.

1. Introduction

In relation to agriculture, the industrial revolution led the countryside to intensify agrarian mechanization, which triggered a reduction in self-sustenance economies [1,2,3]. Because of these outstanding changes, special importance started to be attached to high-yielding varieties, which, in addition to their high productivity, have uniform size and external fruit appearance. Their use was profitable for the food industry [1], and they were resistant to diseases [4]. This situation caused remarkable genetic erosion, which led to a loss of biodiversity in crop production [5]. Such was the impact of these changes that the FAO declared in 2004 that global crop biodiversity was a risk that could seriously compromise world food security. Unfortunately, this problem is still being faced.
Traditional varieties or landraces are those that have been differentiated throughout the ages in a certain ecogeographical area by attending to local edaphoclimatic conditions and traditional management and uses [6]. Landraces contribute to the development of the local economy by offering specific products, uses, and qualities that diversify the food base [2]. For this reason, recovering, cultivating, and correctly classifying traditional varieties form part of key global heritage for the future of food security and the economy by preserving biodiversity.
The Valencian Community (Spain) has an extensive heritage compound of very high diversity, with traditional vegetable varieties selected based on their organoleptic quality, by taking flavor as the prominent factor in seed selection [7,8], although many of them are in real danger of disappearing. As the importance of recovering biodiversity is known, it is necessary to encourage the general conservation of these varieties by promoting their cultivation in their areas of origin, recovering their commercial exploitation, and maintaining farmers’ profitability and sustainability [6,7,9]. To carry out such conservation, a detailed description of the varieties’ characteristics and quality requirements must be provided, in addition to all the wisdom acquired from practical experience in cultivation and reproduction [10]. Many characterization studies based on standardized morphological and agronomic descriptors developed by the International Board for Plant Genetic Resources (IBPGR, 1995) have been performed in peppers [11,12,13,14,15] and have demonstrated that they can contribute to optimizing plant breeding programs by providing helpful information for pepper breeders. According to Uddin et al. [16], clustering accessions in different groups may be useful for providing a basis for further crop improvement.
Pepper (Capsicum spp.) belongs to the Solanaceae family and is the second most-consumed vegetable worldwide, with 1.99 million hectares (ha) currently reserved for cultivation [17]. In Spain [18], pepper occupied 20,388 ha in 2017, cultivated mainly in the Mediterranean Region, where its considerable agronomic and economic importance makes it a relevant crop. Peppers provide important nutritional benefits, which make them even more valuable. Peppers’ high antioxidant capacity, together with being very rich in ascorbic acid, carotene, phenols, xanthophylls, and flavonoids, make it a functional food [19,20]. Nonetheless, the proportion of these elements clearly depends on cultivar genotype and maturity stage, among other factors [21].
For all the above reasons, this work aims to conduct a detailed agromorphological and phenotypic description of Valencian pepper landraces, following the descriptors for Capsicum set by the International Board for Plant Genetic Resources, to identify valuable landraces and to recover lost genetic variability.

2. Materials and Methods

2.1. Plant Material

Plant material consisted of 17 pepper landraces (C. annuum L.) that have never been characterized before, representing one part of the pepper germplasm collection from the Valencian Community (Figure 1). Accessions were provided by the Germplasm Banks of the Institute for the Conservation and Improvement of Valencian Agrobiodiversity (COMAV, Spain) and the Valencian Institute of Agrarian Research (IVIA, Spain). They represent the most valued pepper types in the Valencian Community; a wide variety of phenotypes is managed. This trial forms part of a wider project in which we attempt to value traditional Valencian varieties, after previously publishing other articles such as Martínez-Ispizua et al. [22,23]. They have been previously selected based on geographical localization throughout the territory, fruit morphology, and possible use (Figure 1). The internal numerical code, passport identification from germplasm banks, group number based on fruit shape, fruit shape description, and origin for each accession are indicated in Table 1.

2.2. Greenhouse Conditions

Two different experiments were run from May to September for two consecutive years in an unheated plastic multi-span greenhouse in the experimental field of the IVIA (Moncada, Valencia, Spain; 39°35′22.3″ N, 0°23′44.0″ W, 37 cm above sea level). The soil composition within a 20 cm depth was 68% sand, 11% clay, and 21% silt (sandy clay loam) and contained 0.61% organic matter, 0.051% total N, less than 8 mg kg−1 of P, 301 mg kg−1 of K, and 2.87 meq·100 g−1 of assimilable Mg. Soil electrical conductivity was 0.290 dS m−1 with a pH of 8.1.

2.3. Phenotyping Study

The morphologic characterization was determined during the first-year experiment. The seeds from the 17 pepper landraces were sown on 5 March 2019. Seedlings were transplanted on 2 May 2019. Then, 2-month-old plants were grown under greenhouse conditions in single rows set 110 cm apart by leaving 50 cm between each plant. Eight plants per landrace were selected for this purpose. All eight pepper plants corresponding to the same variety were planted consecutively in a single cultivation area inside the greenhouse. The spot for each variety was selected randomly. Plant irrigation met 100% crop evapotranspiration, as described in Penella et al. [24], with a drip system. Nutrients were applied through the irrigation system at a rate (kg ha−1) of 200 N, 50 P2O5, 250 K2O, 110 CaO, and 35 MgO, as recommended by Maroto [25]. The average range of the minimum and maximum temperatures during the first-year experiment was 12–24 °C for May, 15–28 °C for June, 19–32 °C for July, 19–32 °C for August, and 18–29 °C for September [26].
Phenotypic measurements were taken upon flowering, except for fruit traits (upon commercial maturity, from July to September, depending on the descriptor and landrace). The data for the plant, leaf, and flower traits were acquired from eight independent plants per landrace. Fruit traits were measured in 10 different representative fruit per landrace and maturity state (green and red). Phenotyping traits were evaluated on plants using the International Board for Plant Genetic Resources descriptors for pepper [27] as a basis. The quantitative and qualitative descriptors data are recorded in Table S1.

2.4. Agronomic Trait

During the second-year experiment, the number of fruits produced per plant was evaluated after verifying that the phenotype characteristics described during the first-year experiment remained for each landrace. The seeds from the same landraces were sown on 7 March 2020, and the seedlings (4 plants per landrace) were planted on 13 May 2020. Like the year before, all four pepper plants corresponding to the same variety were planted consecutively in a single cultivation area inside the greenhouse. The spot for each variety was selected randomly. Agronomic culture practices were similar to those of the first year. The average range of the minimum and maximum temperatures was 11–31 °C for May, 14–31 °C for June, 18–33 °C for July, 19–34 °C for August, and 15–32 °C for September [20].
Fully developed fruit were harvested on four consecutive dates from the beginning of July to the end of August (green fruit: 10 July and 23 July; green and red fruit: 5 August and 24 August). The results are presented as the number of fruit per plant−1 (No. plant−1).

2.5. Statistical Analysis

For quantitative traits, a one-way ANOVA analysis was performed with the results obtained from the evaluated parameters with Statgraphics Centurion XVII (Statistical Graphics Corporation 2014, Englewood Cliffs, NJ, USA) using the selected landraces as the factor of analyses. The results were expressed as the means and accepted as being significantly different at the 95% confidence interval (p ≤ 0.05). For qualitative traits, the mean value for each landrace was represented by the most frequent representation of the trait after classifying the independent samples of plants and fruits (n = 8 for vegetative traits and n = 10 for fruit traits) according to the scale (Table S1). These values were used to calculate the frequency distribution of the traits for the 17 landraces.
Principal component analysis (PCA) was performed for standardized values using pairwise Euclidean distances among the means of accessions to determine similarities between genotypes. The extracted and statistically significant eigenvalues (1≤) and the relative and cumulative proportions of total variance explained by the first four components were calculated. A two-dimensional (2D) scatter plot (first vs. second PC) was executed based on a distance matrix for the principal components to visualize the relation explaining the traits. Information extracted from the feature plot was incorporated into the scatter plot to highlight the traits that contributed the most to the variability among landraces. PCA parameters were estimated using the ggrepel, Stat, FactoMineR, and Factoextra R packages. As complementary information, landraces were clustered and represented in a dendrogram (Figure S5) with Statgraphics Centurion XVII to further understand the relations found between the varieties.
A correlation analysis was run with the selected quantitative plant, leaf, and fruit traits, in which the individual samples of each landrace (n = 17) were subjected to linear regression and correlation coefficients (r) were obtained. Values were accepted as being significantly different at the 95% confidence interval (p ≤ 0.05). In addition, a separate correlation network was built [28] to help understand how different conventional descriptors contributed to diversity. The illustration was obtained using Comprehensive R Archive Network, using the Corrplot R package.

3. Results

3.1. Phenotypic Differences in Quantitative Vegetative Traits

Table 2 offers all the collected quantitative data about the vegetative parts and flowers of the pepper plants and their statistics. The mean of the group, range, CV, and significance are presented in Table S2. Generally, for the characters related to plant dimensions, the G1 landraces developed statistical significances in three length traits: stem to first bifurcation, plant width, and leaf length. In stem to first bifurcation, landraces P-44 and P-72 stood out for having the highest values (mean 33.1 ± 1.1 cm, 19.5% over the G1 average), while the opposite trend was observed in P-41 and P-48 (mean of 22.2 ± 0.4, 20% below the G1 average). Landraces P-41, P-48, and P-72 stood out for their plant width (mean of 67 ± 8.5, 10% above the G1 average). The highest leaf length values were for P-42, P-44, and P-72 (19.1 ± 0.9 cm), while the lowest ones went to P-41 and P-48 (16.9 ± 0.2 cm).
In contrast, all the plant quantitative traits showed significant differences in the G2 landraces. Regarding stem-related characters, landrace P-40 stood out for being much longer than the rest (43 ± 2.1 cm, 47.8% over the G2 average) when taking into account distance to the first bifurcation point. However, it had one of the smallest stem diameters (14.4 ± 0.8 cm, 10.8% below the G2 average). Finally, P-50 was outstanding for the large diameter of its stem (25.4 ± 5.1 cm, 56.6% higher than the G2 average). Landraces P-35, P-36, P-37, P-40, P-45, P-46, and P-51 stood out for developing the widest plants (mean 67.9 ± 2.7 cm, 7.7% over the G1 average). The thinnest plants were recorded for P-39, P-47, P-50, and P-70 (mean 54.4 ± 3.0 cm, 13.7% below the G2 average). Regarding leaves, landrace P-40 was remarkable for its big leaf size (23.2 ± 1.9 cm long and 14.8 ± 1.4 cm wide), followed by P-39 and P-45, whose leaves were also as long as P-40 but narrower (mean 22.3 ± 0.9 cm long and 12.2 ± 0.7 cm wide). P-35 and P-50 had the shortest leaves (mean 17.3 ± 0.9 cm). However, 5 of the 11 G2 accessions (P-35, P-36, P-37, P-50, P-70) appeared to have a similar leaf width (mean 10.2 ± 0.2 cm) with a downward trend. Two landraces were highlighted for the number of flowers per axile, P-37 and P-45, with 51.5% and 73.5% more blooms, respectively, than the G2 mean value (1.32 flowers per axile).
Finally, the ungrouped landrace, P-49, stood out for stem distance to first bifurcation (22.5% and 16.6% higher than the G1 and G2 means, respectively) and its narrow plants (9.8% and 5.6% lower than the G1 and G2 means, respectively).

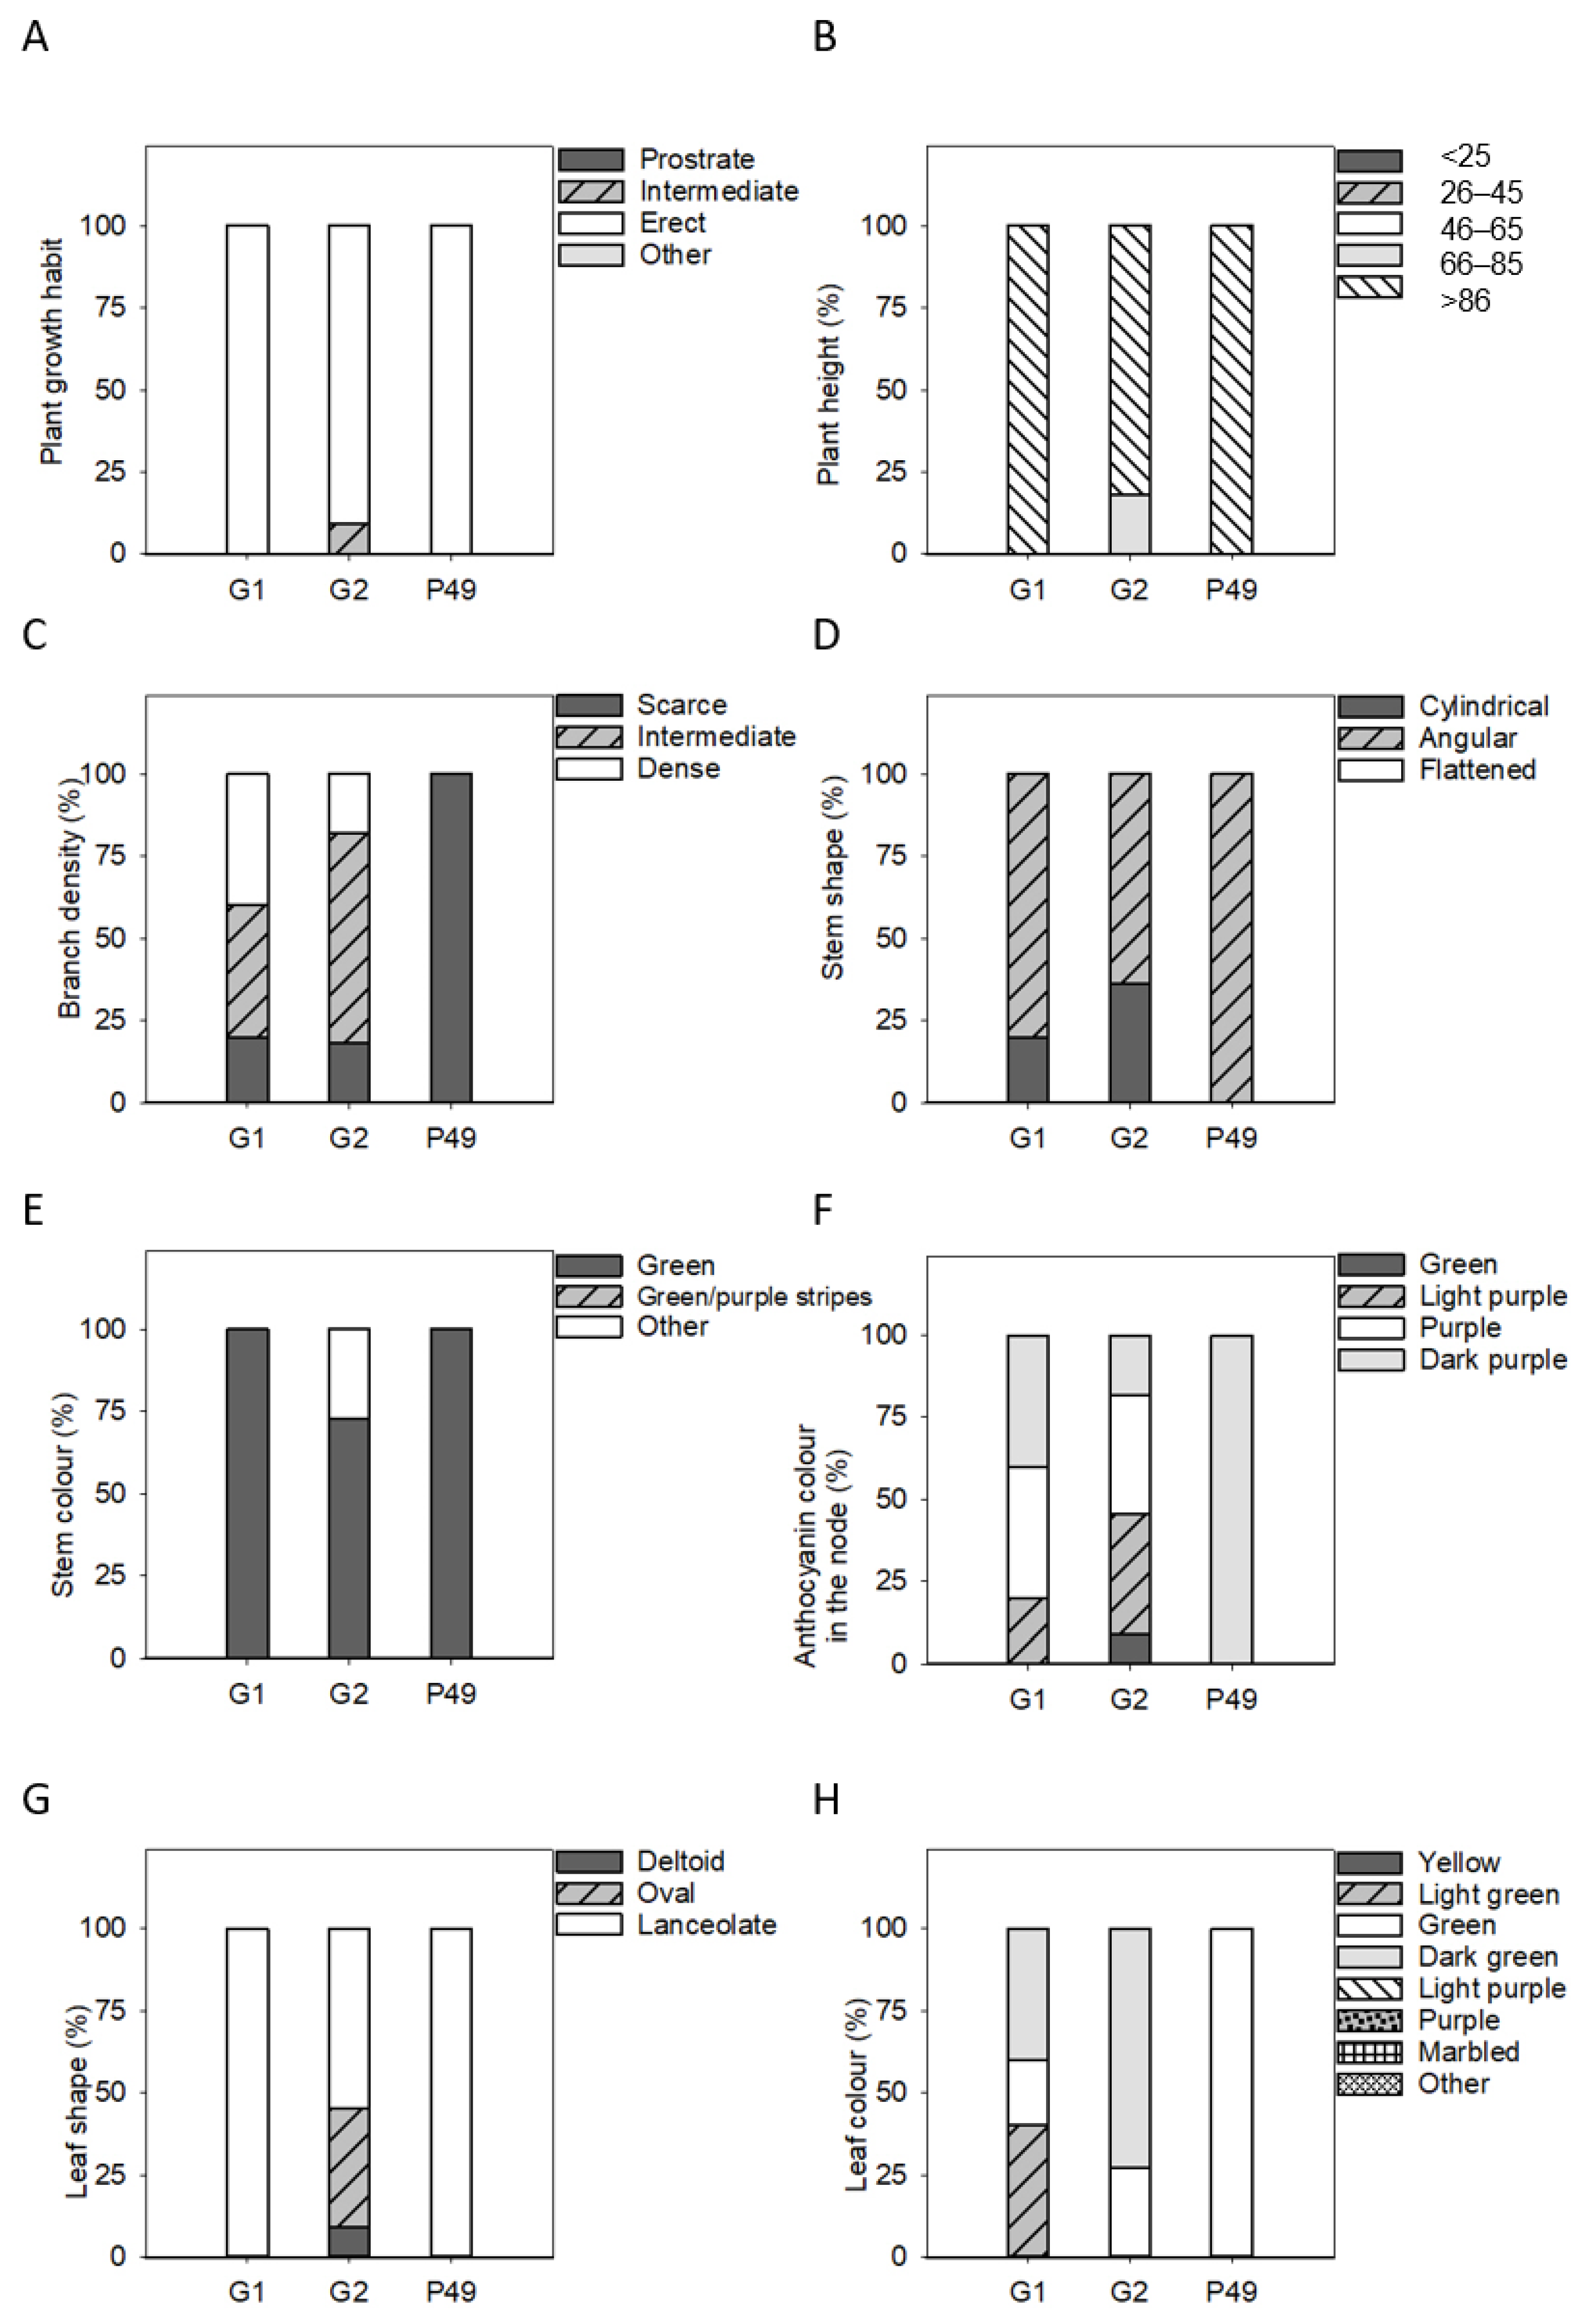
3.2. Phenotypic Differences in Qualitative Vegetative Traits

Many of the 17 studied pepper landraces generally developed erect growing plants (16 out of 17) (Figure 2A), which makes it easier for them to grow to a height exceeding 86 cm (15 out of 17) (Figure 2B).
For G1, no clear trend explained branch density (Figure 2C). However, almost all the landraces (4 out of 5) developed angular green stems (Figure 2D,E). Anthocyanin intensity in nodes varied from dark to light purple (Figure 2F). Leaf shape was clearly lanceolate and green in color. Some variation in intensity was noted and ranged from light (2 out of 5 landraces) to dark (2 out of 5 landraces) green (Figure 2G,H) in G1. Most G2 plants presented intermediate branch density and angular or cylindrical stems (Figure 2C,D). Although most stems were green with purple or light purple nodes (Figure 2E,F), one landrace had green nodes (P-47) and two had dark purple ones (P-37 and P-46). Leaves were mostly lanceolate or oval (5 and 4 out of 11, respectively), and their main color was dark green (3 out of 11) (Figure 3G,H).
P-49 presented erect plants that were more than 86 cm tall with scarce branch density. Stems were angular and green with dark purple nodes, and leaves were clearly lanceolate and green.
All the G1 flowers and P-49 (Figure 3) were erect, with a serrated calyx margin and white-yellow anthers. The stigma was inserted at the same height as anthers (Figure 3E); the calix was not pigmented, and the corolla was white. In G2, flowers were mostly erect (10 out of 11), with a serrated calyx margin (11 out of 11) and their own white filaments (10 out of 11) and anthers (7 out of 11). Their stigma appeared inserted at the same height as anthers. The calyx was not pigmented, and the corolla was white in all the studied cases (10 out of 11).

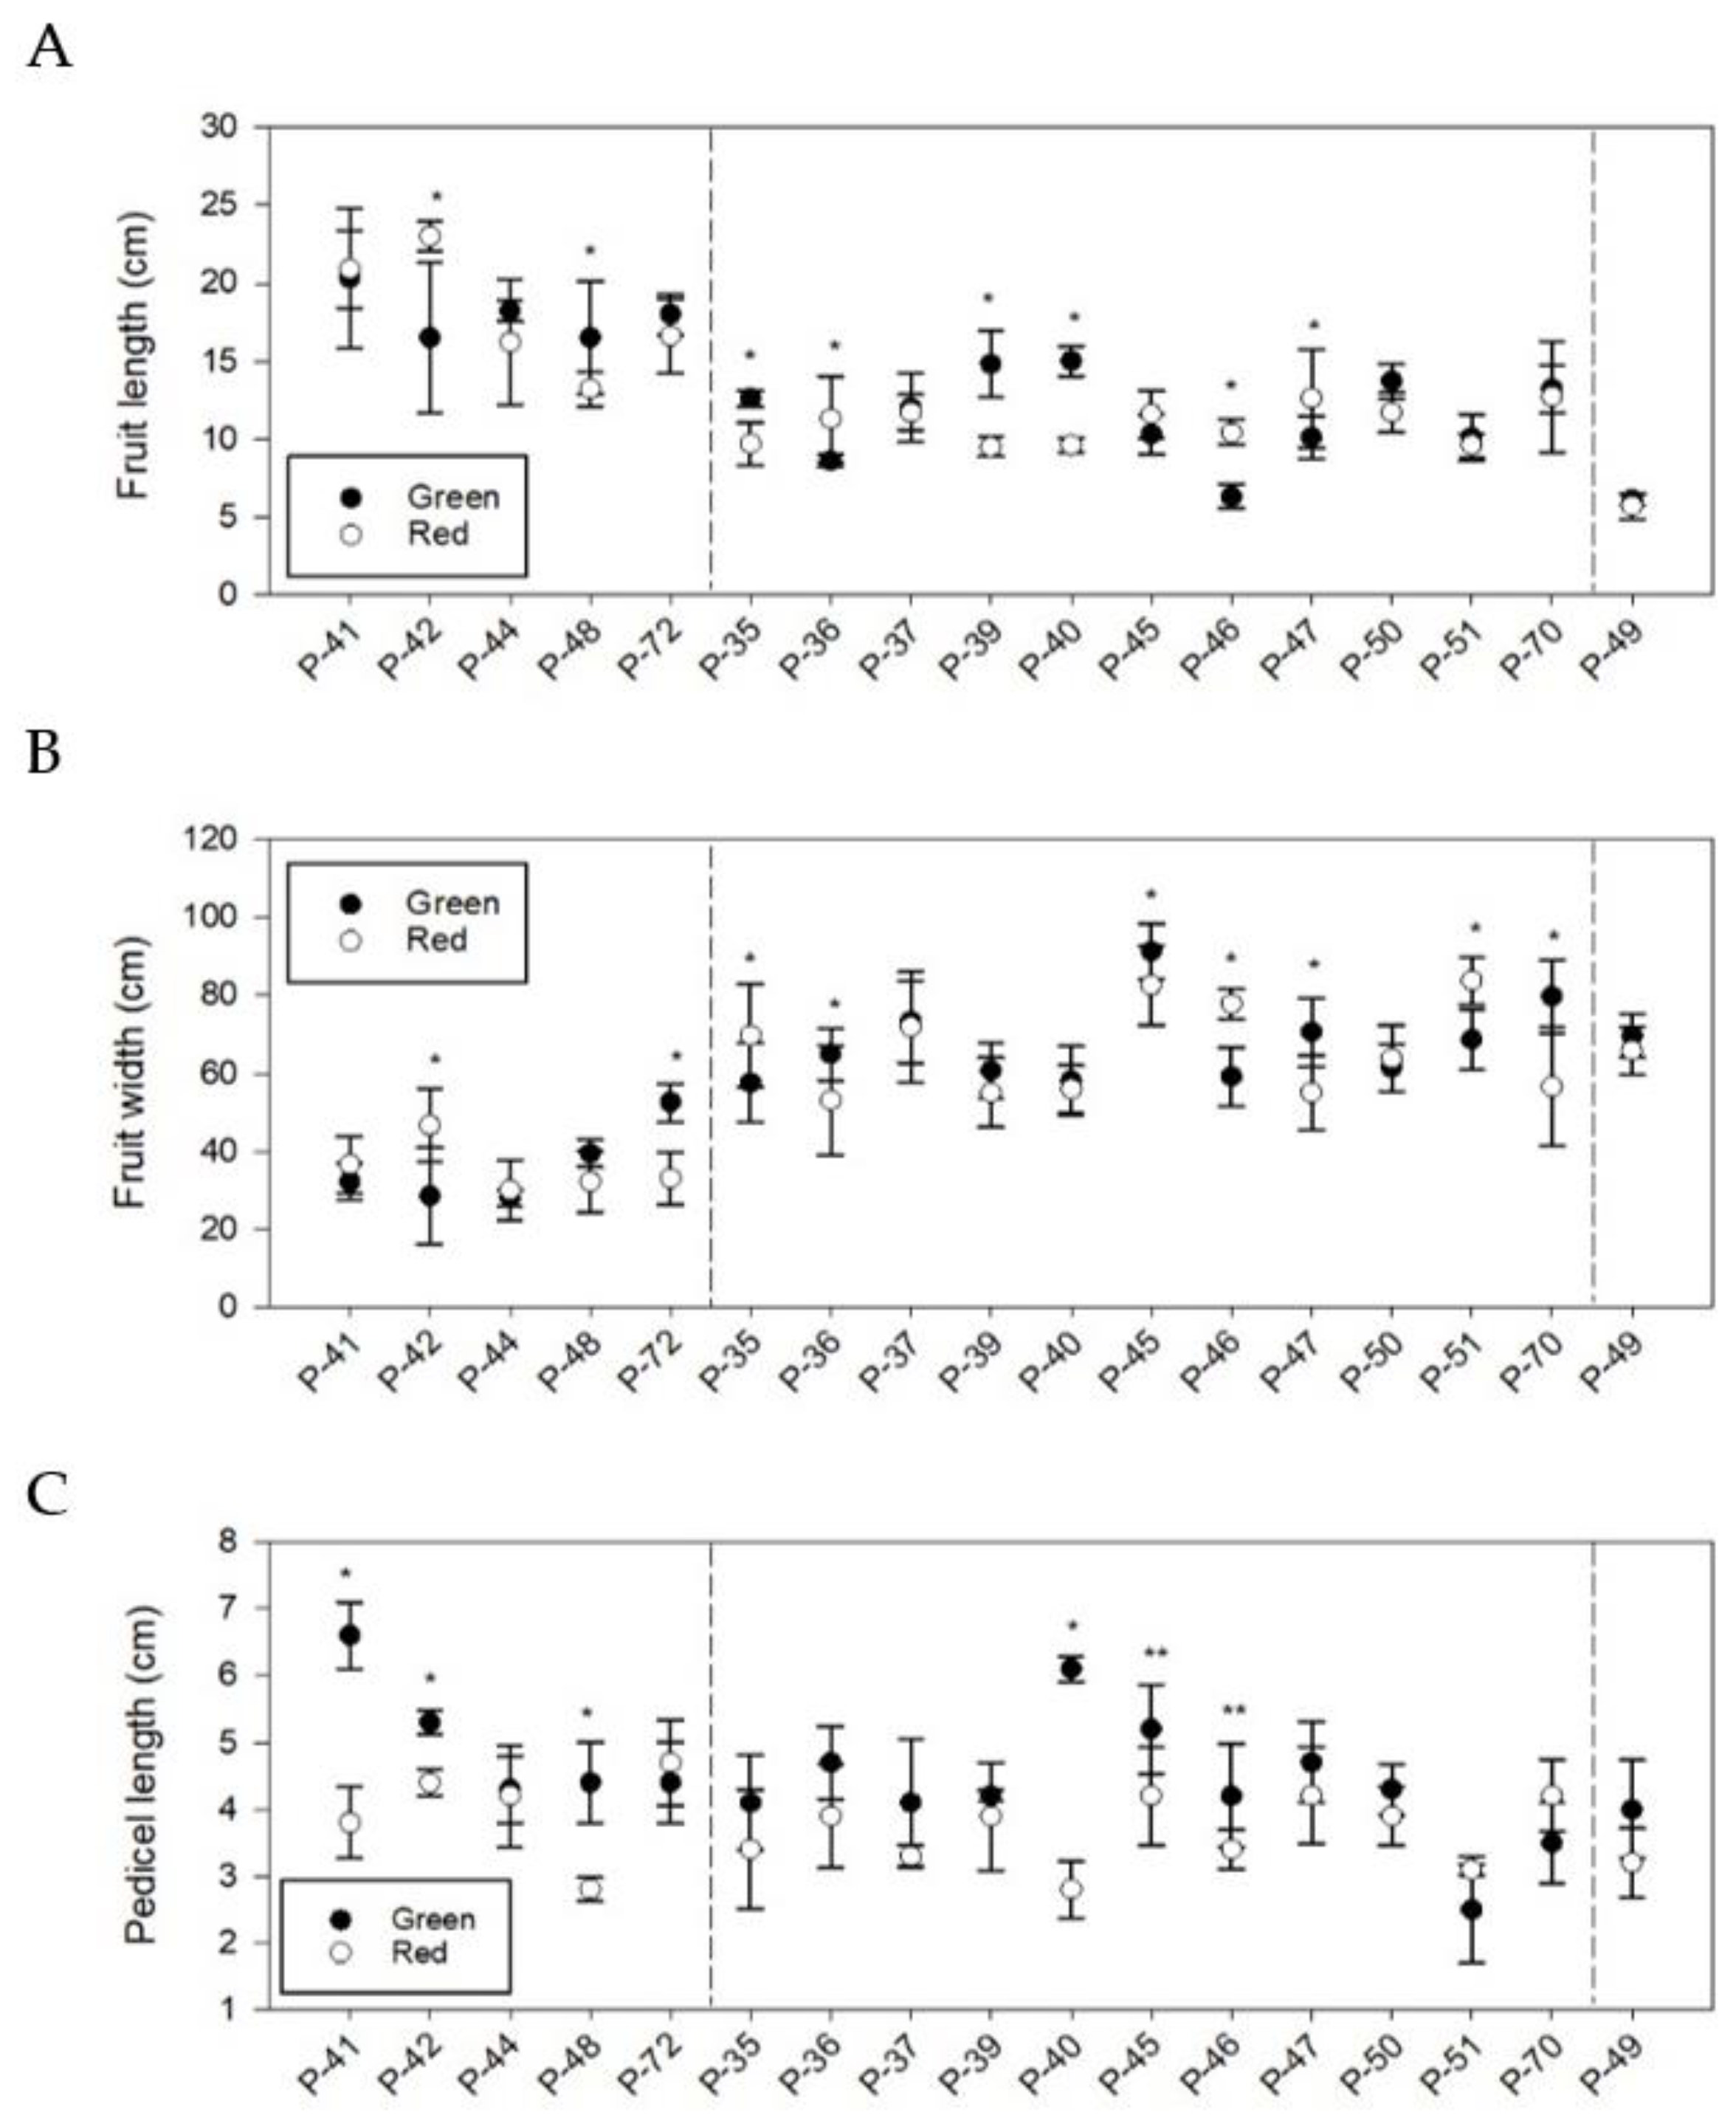
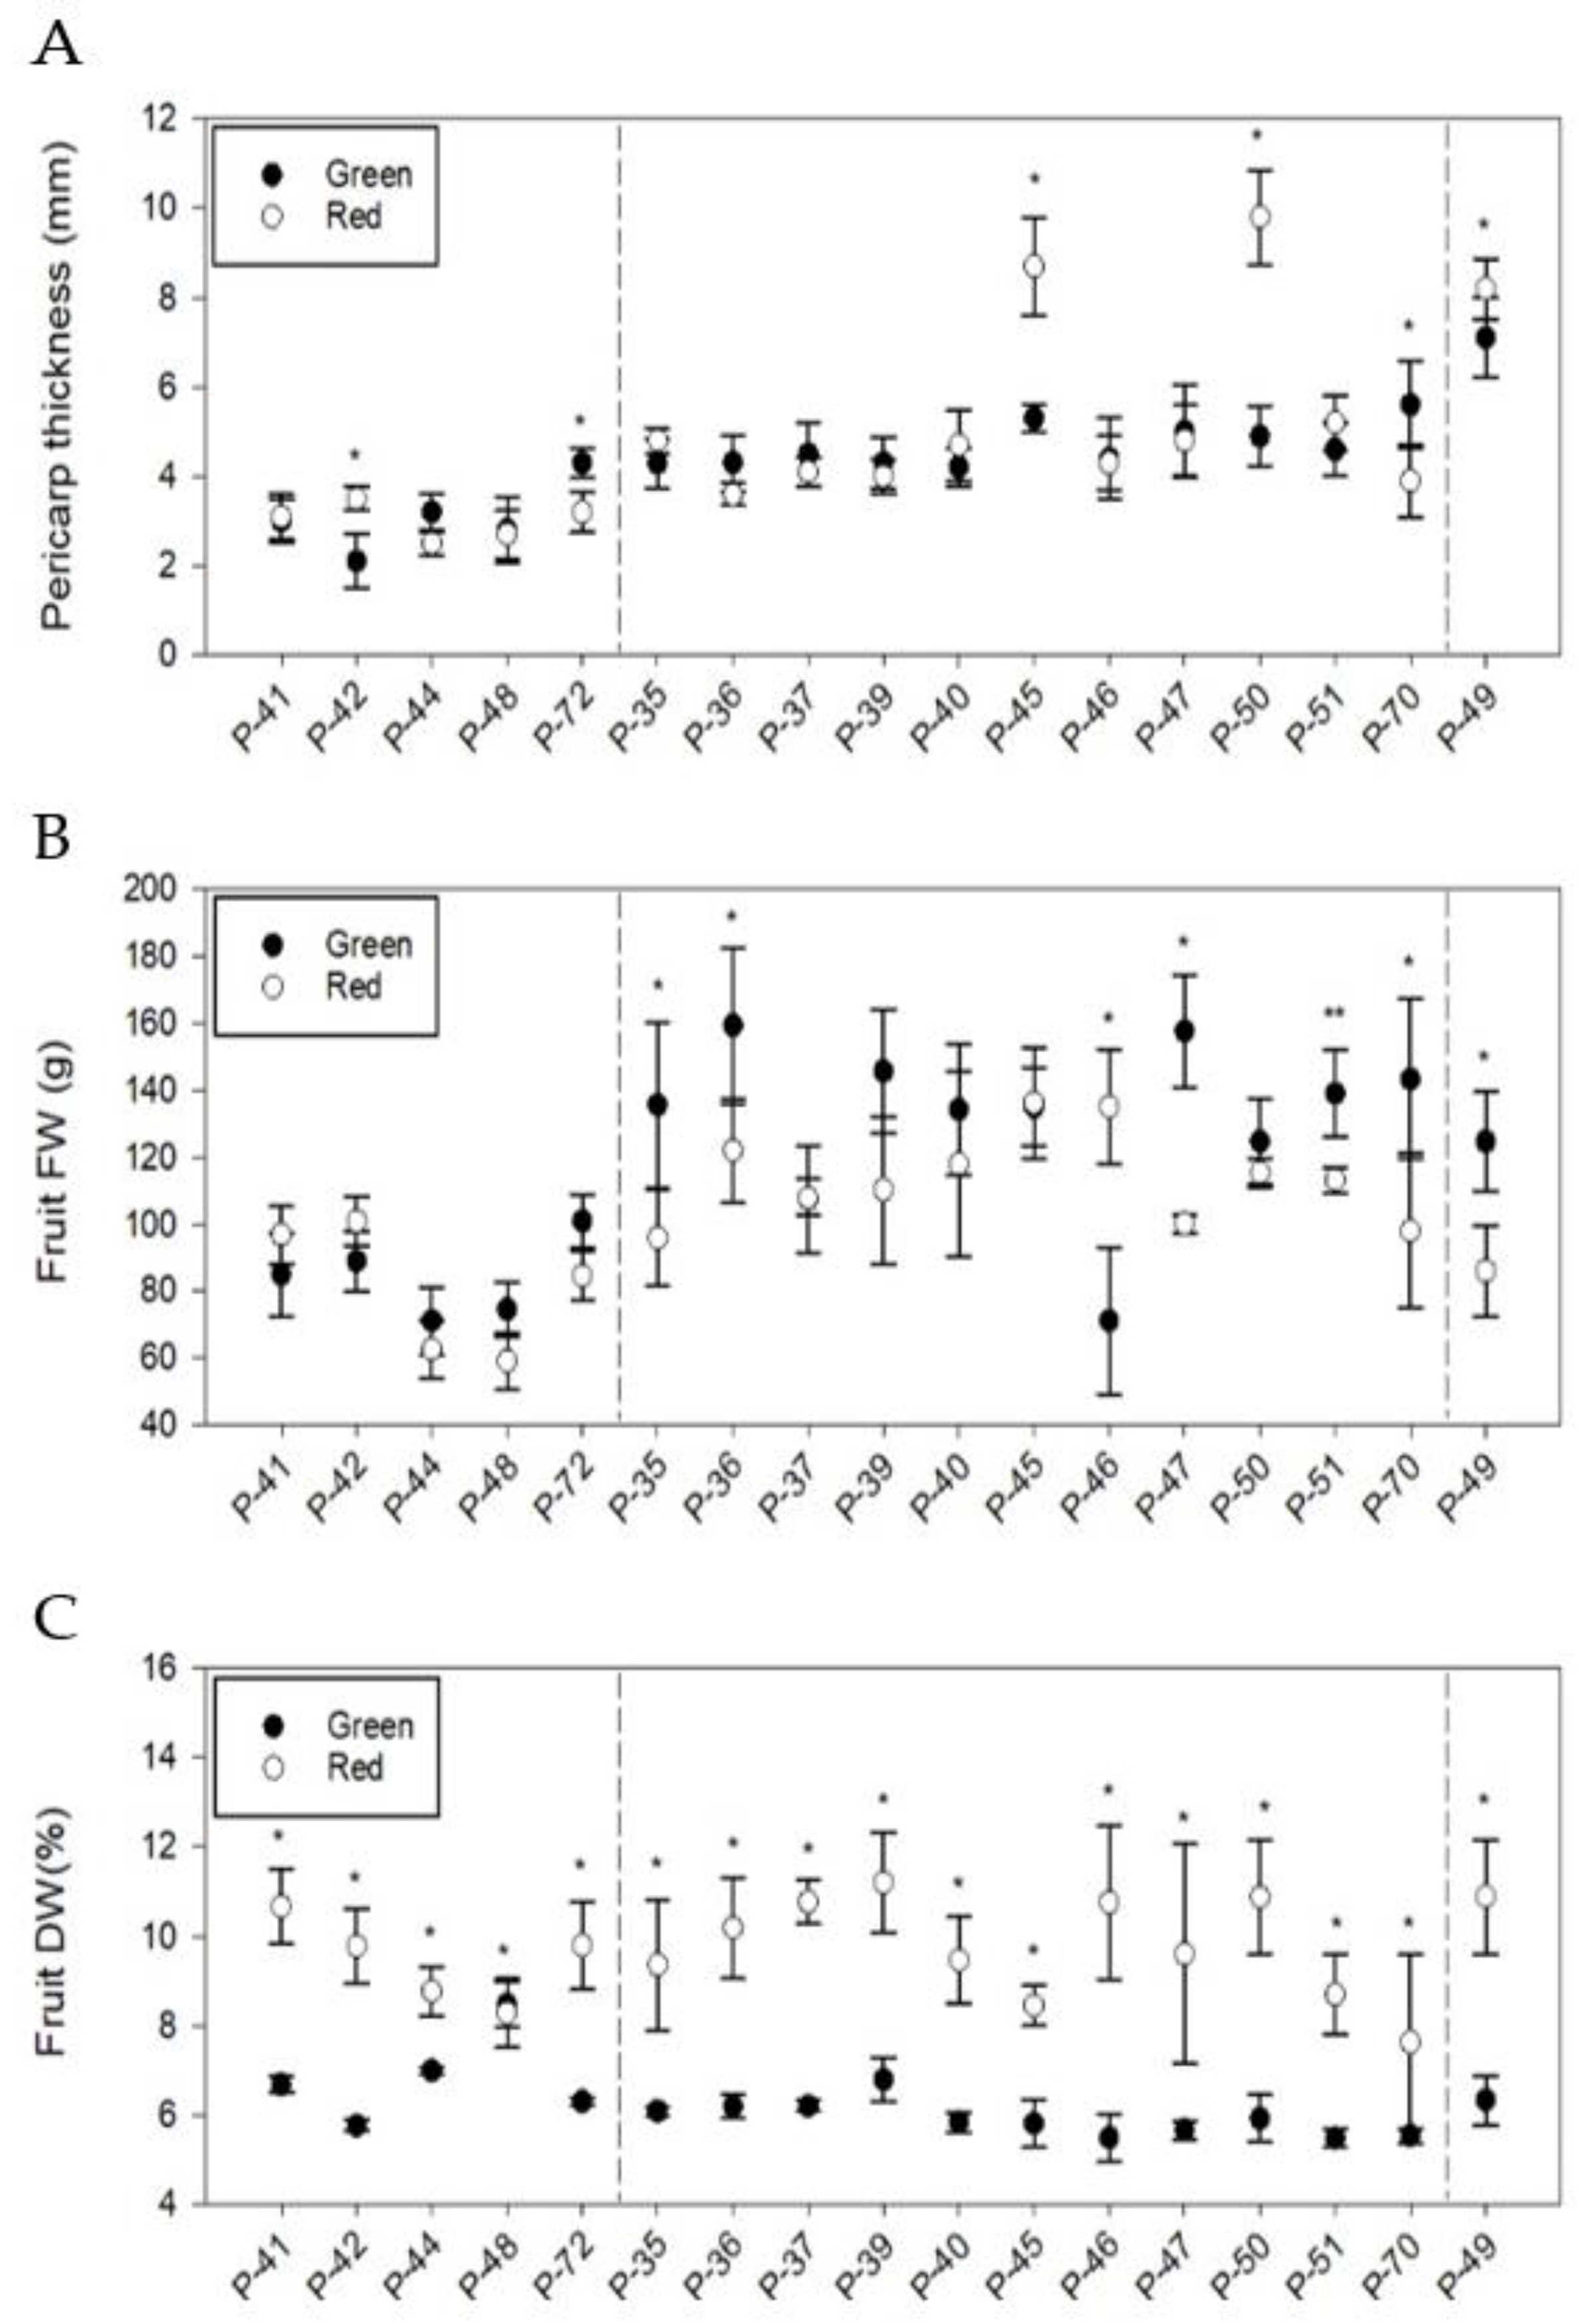
3.3. Phenotypic Differences in Quantitative Fruit Traits

All the quantitative data describing the green and red fruit are found in Table 3 and Table 4, respectively, along with the differences found between landraces for each trait in all the fruit groups. Once again, group average, range, CV, and significance are presented in Table S2. Regarding fruit dimensions, longer fruit were also narrower, and vice versa. In the G1 landraces, the difference between length and width in fruit P-41 and P-44 was independent of maturity state. They had the highest L/W (6.4 ± 0.1 and 5.3 ± 0.2 in the green and the red fruit, respectively). On the contrary, the lowest L/W was observed in the P-72 green fruit (3.5) because of its high width value (5.3 cm, 45.8% over the G1 mean). The opposite trend was noted upon ripening (3.0 cm wide, 5.6% below the mean) with a high L/W value (5.1). When comparing both states (Figure 4A,B), general behavior involved maintained dimensions, but the P-42 red fruit were statistically longer and wider than the green ones, while P-48 was wider in the immature state.
In the G2 green fruit (Table 3), the highest L/W values were for landraces P-35, P-39, P-40, and P-50 (2.4 ± 0.2), given their long narrow dimensions (20.5% over and 12.3% below the mean, respectively). On the contrary, P-36 and P-46 presented short narrow fruits (26.1% and 8.4% below the G2 mean, respectively) associated with low L/Ws (1.2 ± 0.2). P-45 also stood out for its low L/W but obtained the widest fruit in both ripening stages (34.7% over the G2 mean). The highest L/W values upon maturity were for P-47 and P-70, given their long but narrow fruit (around 14.6% above and 17.7% below the G2 length and width means, respectively) (Table 4). When comparing maturity states (Figure 4A,B), three landraces (P-35, P-39, P-40) were outstanding for having statistically significant longer fruit when green, while fruit P-36, P-46, and P-47 were longer when red (Figure 4A,B).
By far, the least elongated fruits of all the landraces appeared for the P-49 variety (65.9% and 44.5% below the G1 and G2 means, respectively), which falls in line with the lowest L/W (around 0.88 in maturity states, 83.0% and 47.1% below the G1 and G2 means, respectively (Table 3).
When analyzing pedicel length (Figure 4C), the general trend was to develop shorter pedicels in the red than green fruit (20.7%, 16.3%, and 20.0% decrease in G1, G2, and P-49, respectively), but a statistical significance was seen in only six landraces (P-41, P-42, and P-48 from G1 and P-40, P-45, and P-46 from G2). According to groups (Table 4 and Table 5), P48 (G1) was highlighted for short pedicel length in both maturity states, and P-40 (G2) stood out for having the longest pedicels when green but the shortest when red. The fruits of P-51 (G2) developed short pedicels independently of their ripening state.
Fruit wall thickness was studied. The landraces from G1 stood out for their low values in both maturity states (from 2.1 to 4.3 mm) compared to the G2 fruits, for which the mean values in the G2 fruit were 56.7% and 73.3% higher than the G1 green and red values, respectively. The ungrouped landrace (P-49) stood out for producing fruit with the thickest walls (136.7% and 173.3% higher than the G1 green and red fruits, respectively). In G2, 4 of the 11 landraces (P-45, P-47, P-50, P-70) had fruit wall thickness values above 5.0 cm in the green fruit, but they ranged from 4.2 to 4.6 in the others (Table 3). The maturity process significantly increased pericarp thickness in P-45 and P-50 (64.2% and 96.0%, respectively) but reduced it by 30% in P-70 (Figure 5A).
The majority of landraces had fruits formed by three independent locules (Table 3 and Table 4). In certain varieties, having four locules was the general tendency (i.e., P-35, P-39, P-40, P-45, P-46, and P-47 from G2) or only two (P-41 and P-72 from G1).
Regarding fruit fresh weight, the G1 landraces had the lightest fruits in the assay, regardless of maturity state (Figure 5B). An opposite trend was observed in the fruits from G2 and P-49 because they were heavier in the green than in the red state (20% and 30.9% in G2 and P-49, respectively) (Figure 5B). In G1 (Table 3 and Table 4), P-42 and P-72 were highlighted for their heavy fruit in both the green (95 ± 8.4 g, 12.9% above the G1 mean) and red (92.7 ± 11.5 g, 12.8% above the G1 mean) fruit. The lightest green fruit were from P-44 and P-48 (72.9 ± 2.4 g, 13.3% below the G1 mean), and these values were lowered to 60.9 ± 2.5 g (25.9% below the G1 mean) when red in color. Of all the G2 landraces (Table 3), the heaviest green fruit were recorded in landraces P-36, P-39, P-45, and P-46 (158.9 ± 11.1 g, 11.9% above the G2 mean), while the lightest ones went to P-37 (107.6 g, 24.2% below the G2 mean). In G2, six landraces (P-35, P-36, P-46, P-47, P-51, P-70) showed statistical differences between green and red fruit (Figure 5B).
As a general trend, the DW percentage considerably increased in the mature fruit (55.6%, 61.0%, and 73.0% in G1, G2, and P-49, respectively) (Figure 5C). In G1, the highest value for this trait was recorded for landrace P-48 in the green state (25.0% over the G1 green mean). In G2, landrace P-39 obtained the highest DW percentage in the green fruit (0.9% over the G2 green mean), while this ratio increased to 6 out of 11 (P-36, P-37, P-39, P-40, P-45, P-47) when analyzed in the red fruit (10.3 ± 0.7%, 0.8% over the G2 red mean) (Table 4). For the number of fruit produced per plant (Table 5), the G1 mean had the highest total values. The G1 varieties that produced the fewest peppers were P-44 and P-72 (10.5 and 11 fruit plant−1, respectively), while landrace P-42 stood out for producing many (56% more fruit than the G1 mean). Of the G2 landraces, P-37 produced the most fruit plant−1 (63.3% more fruit than the G2 mean). P-49 did not produce much fruit compared to the production averages obtained in the other variety groups (41.5% and 27.5% fewer fruit than the G1 and G2 means, respectively).

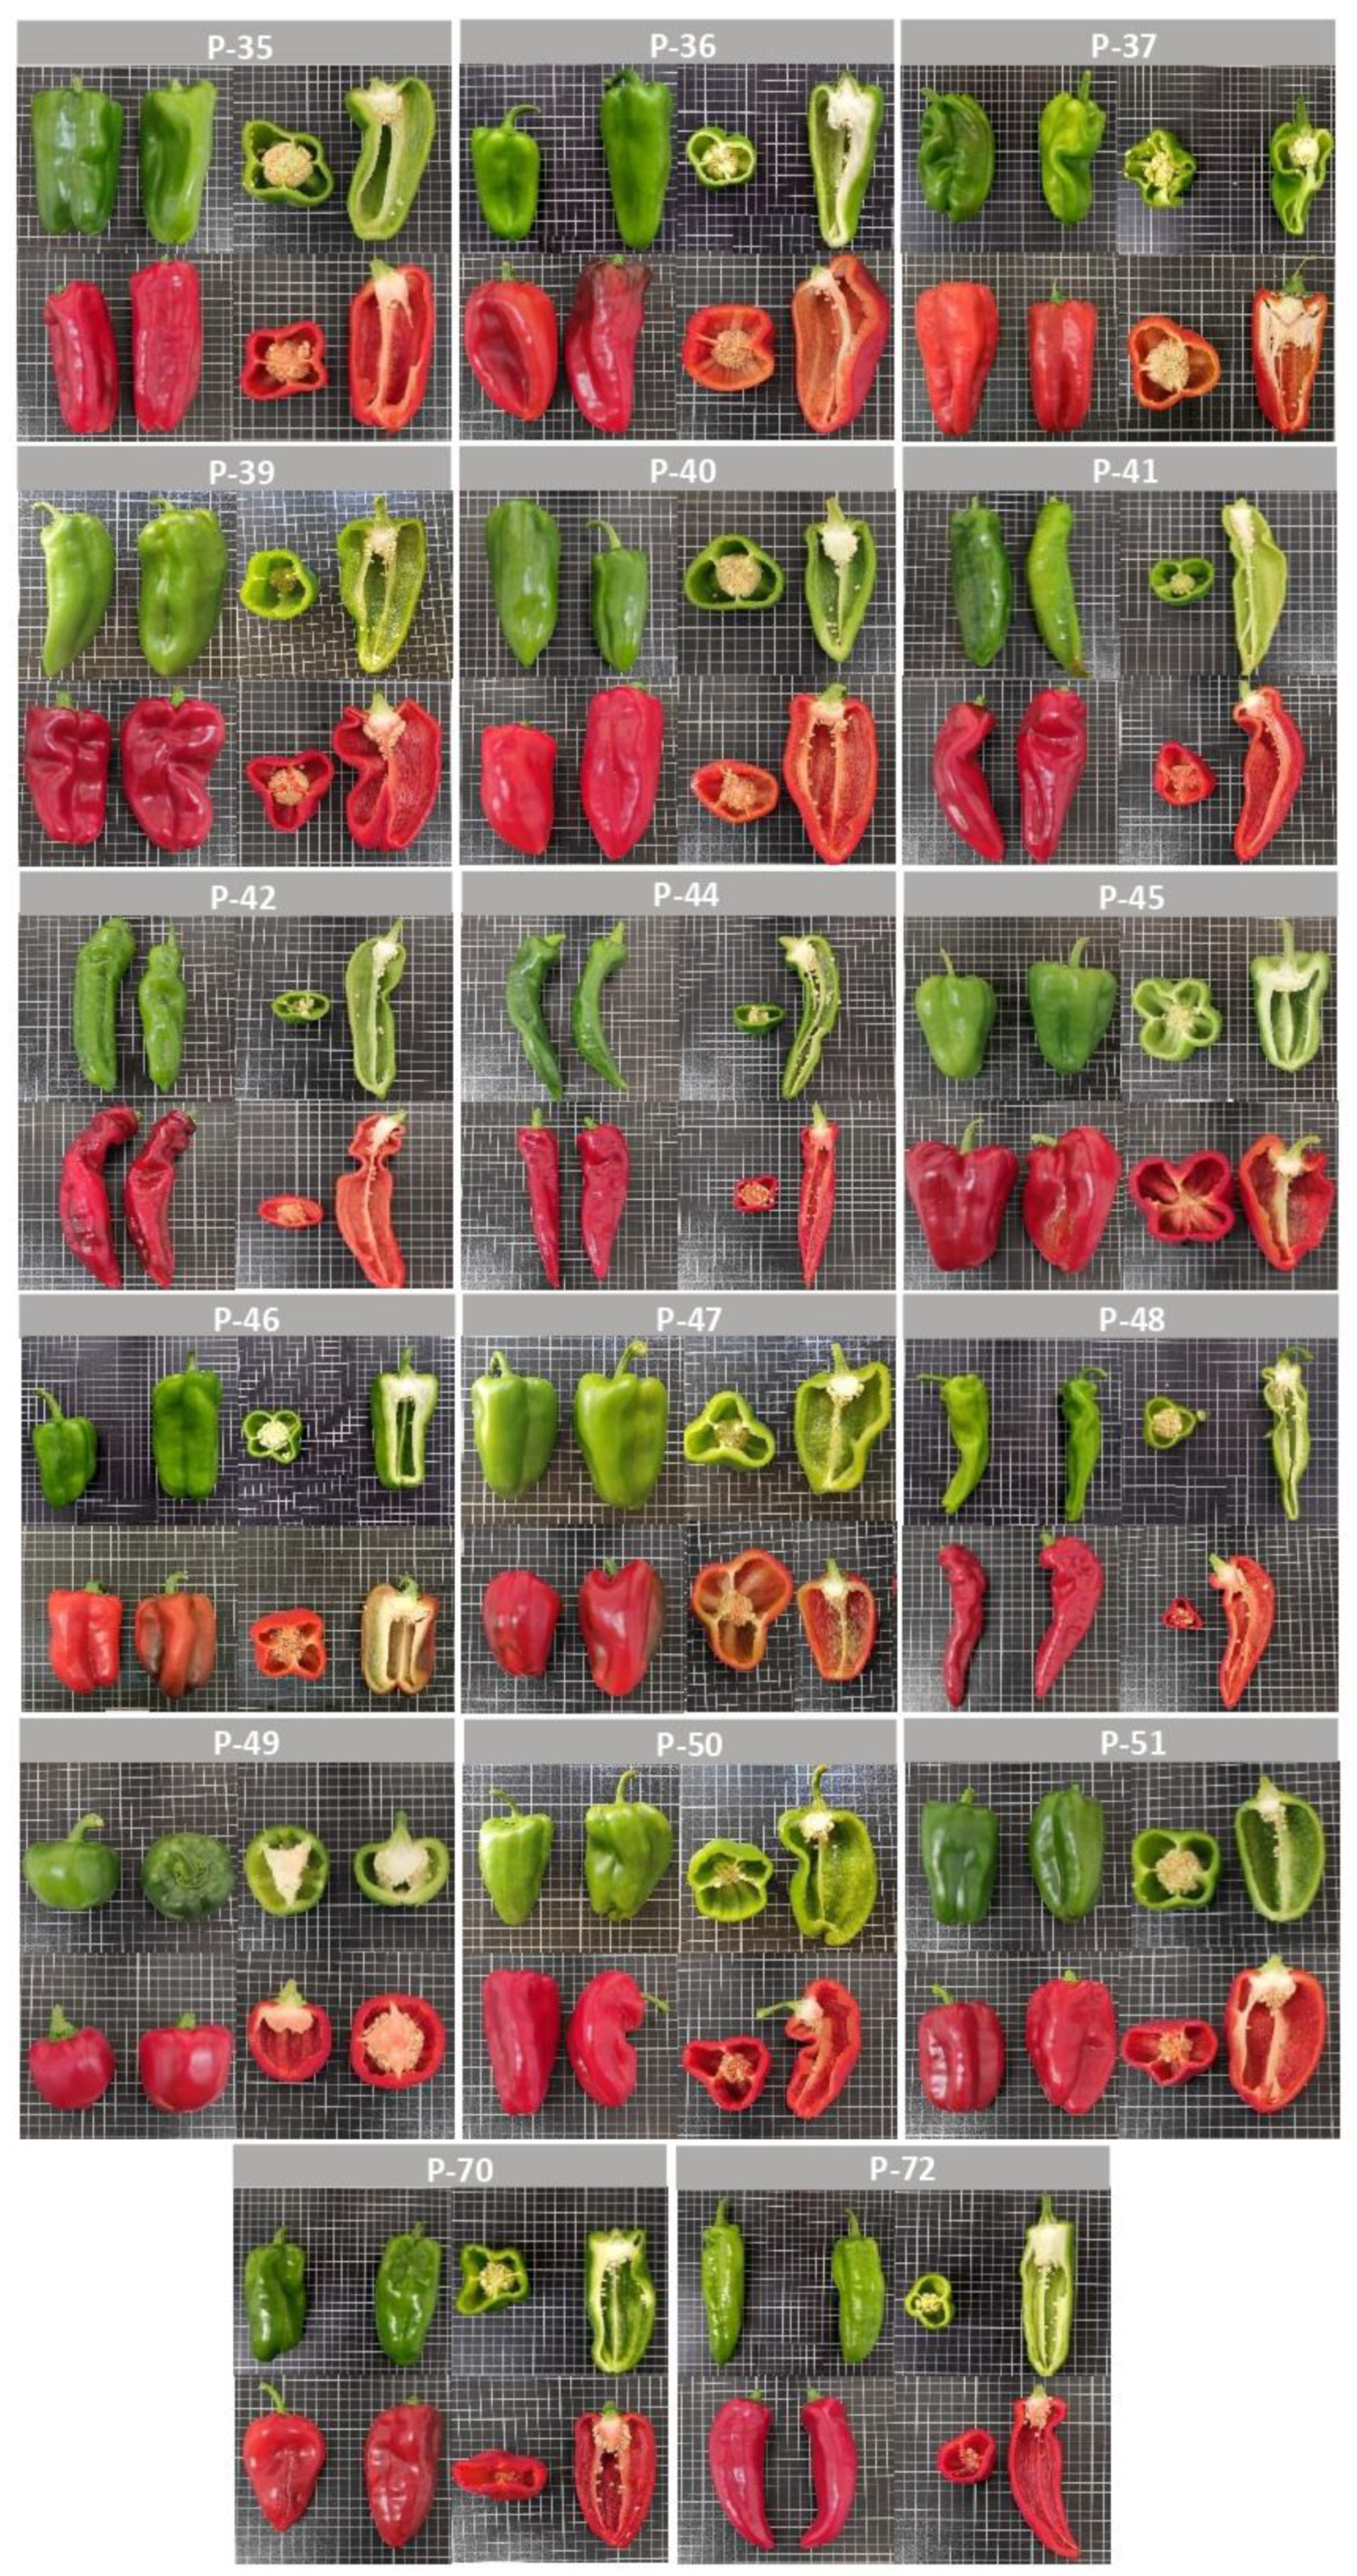
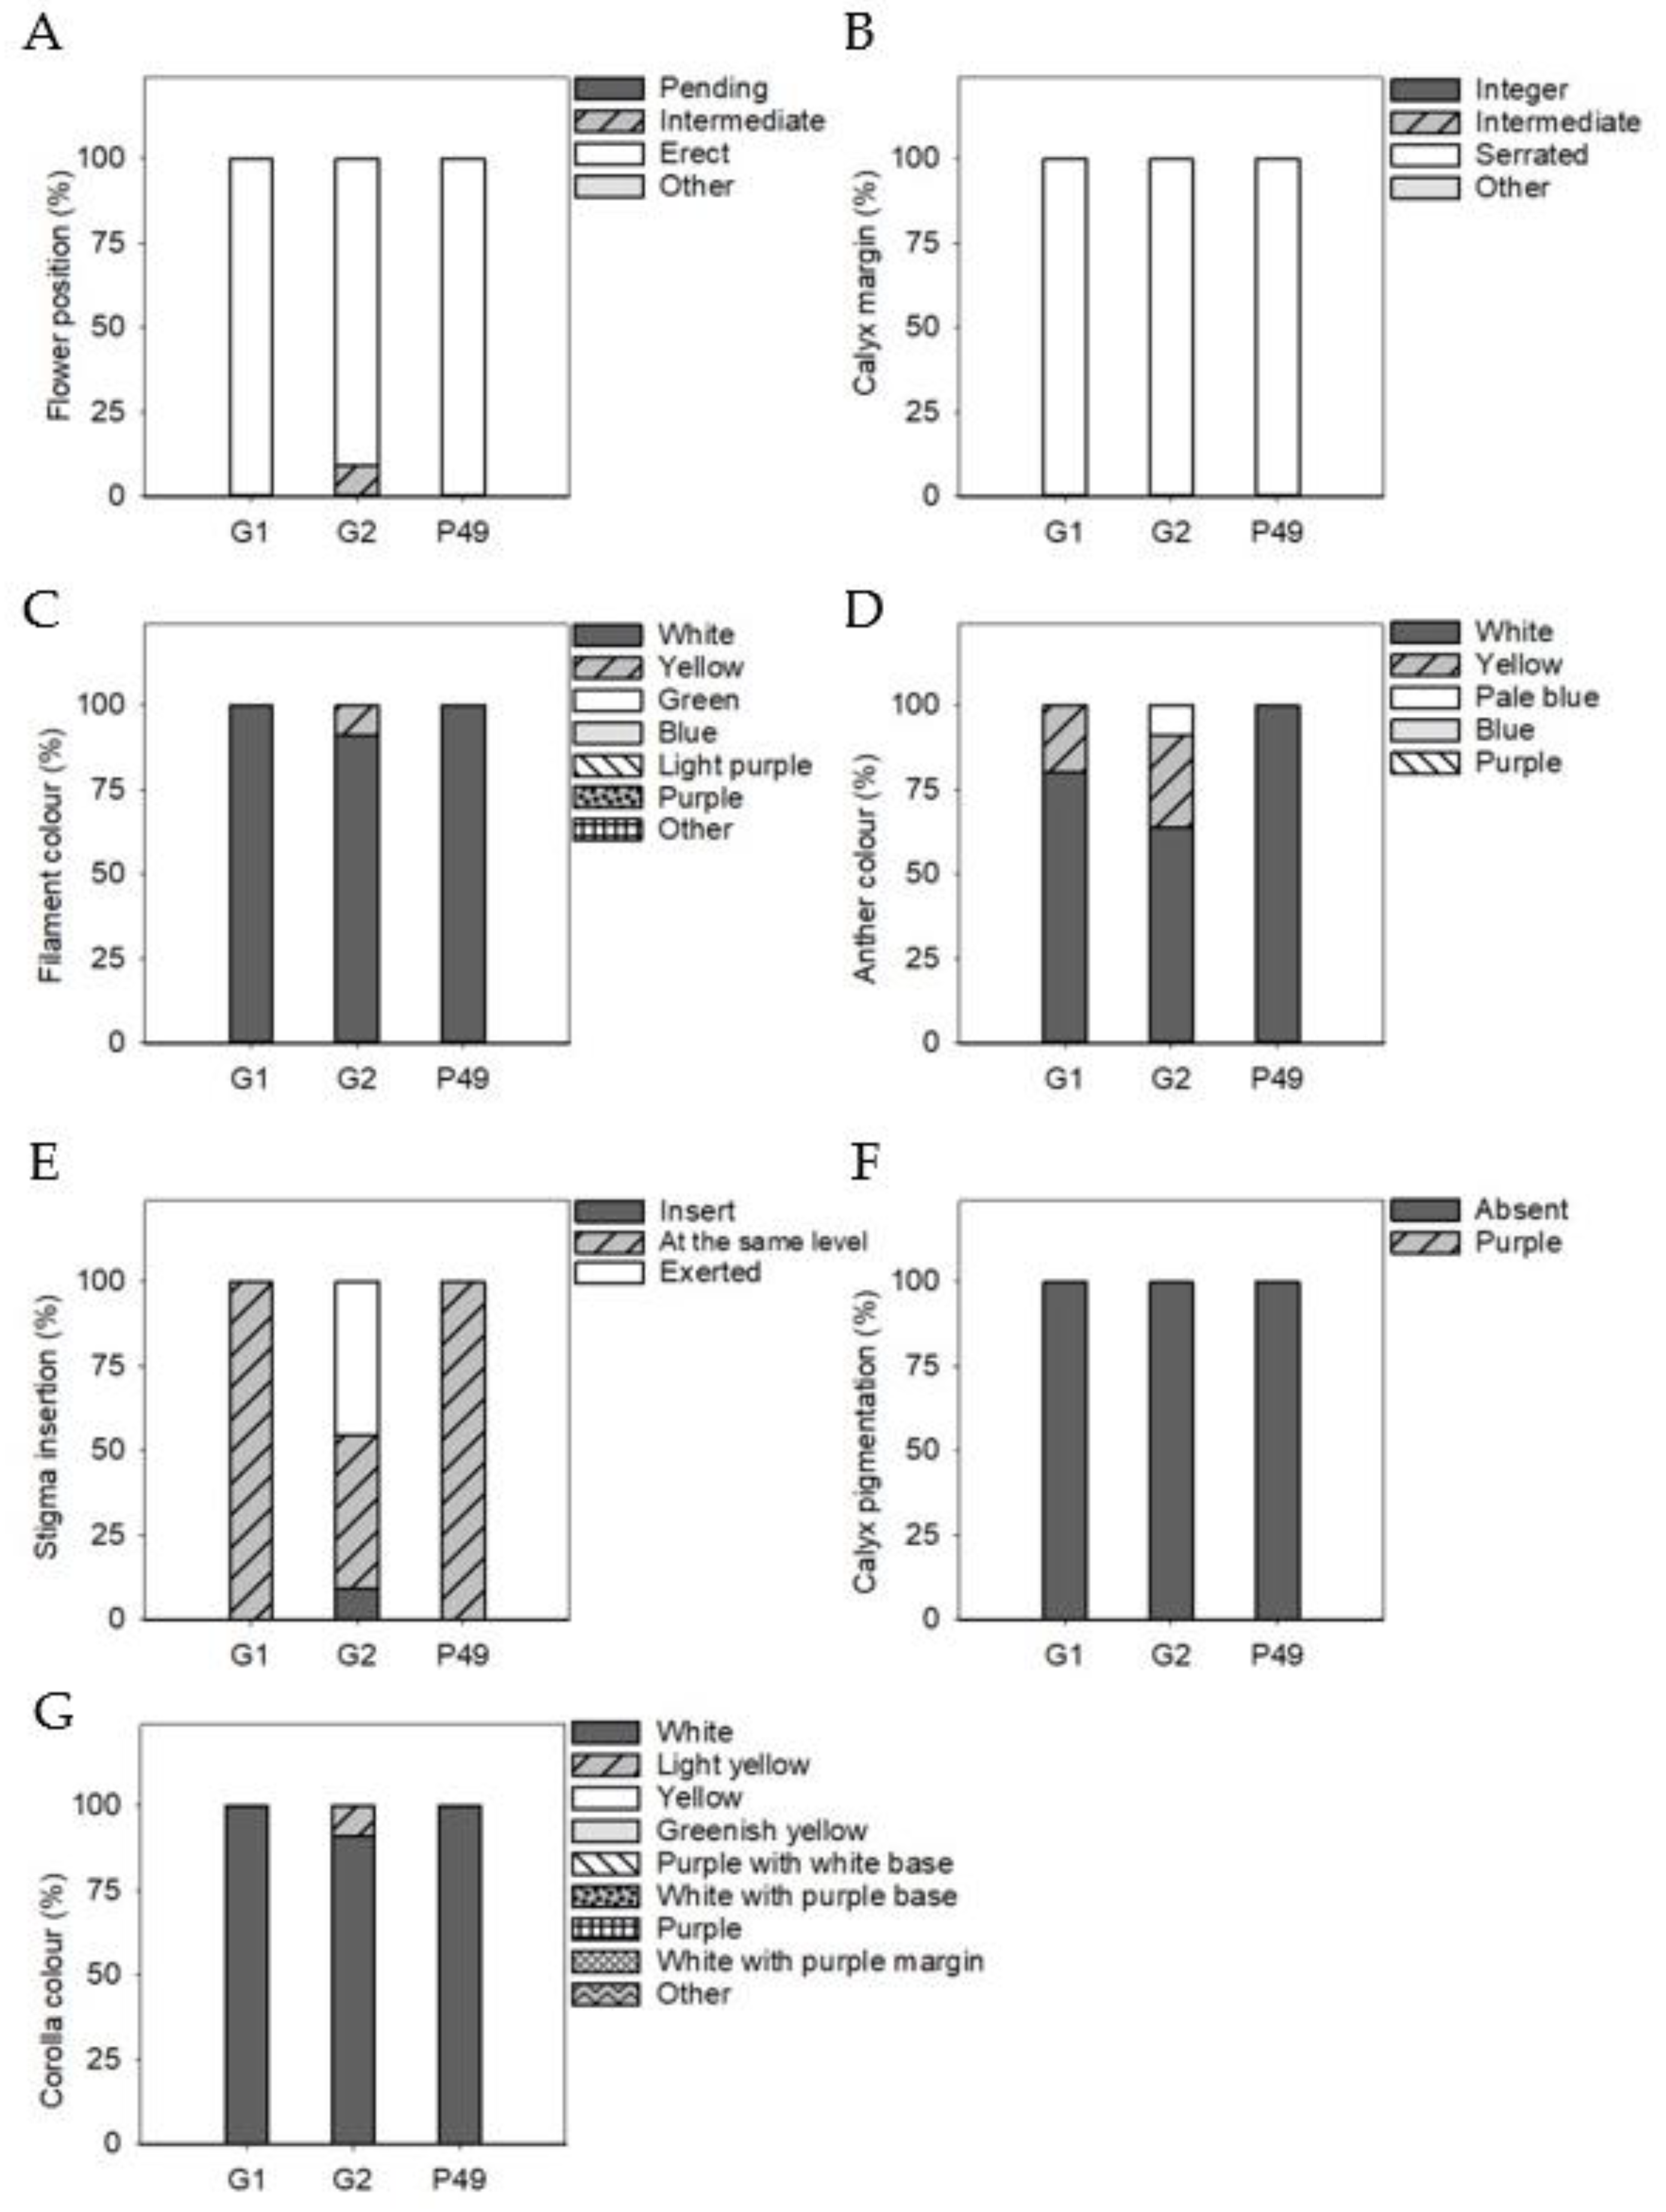
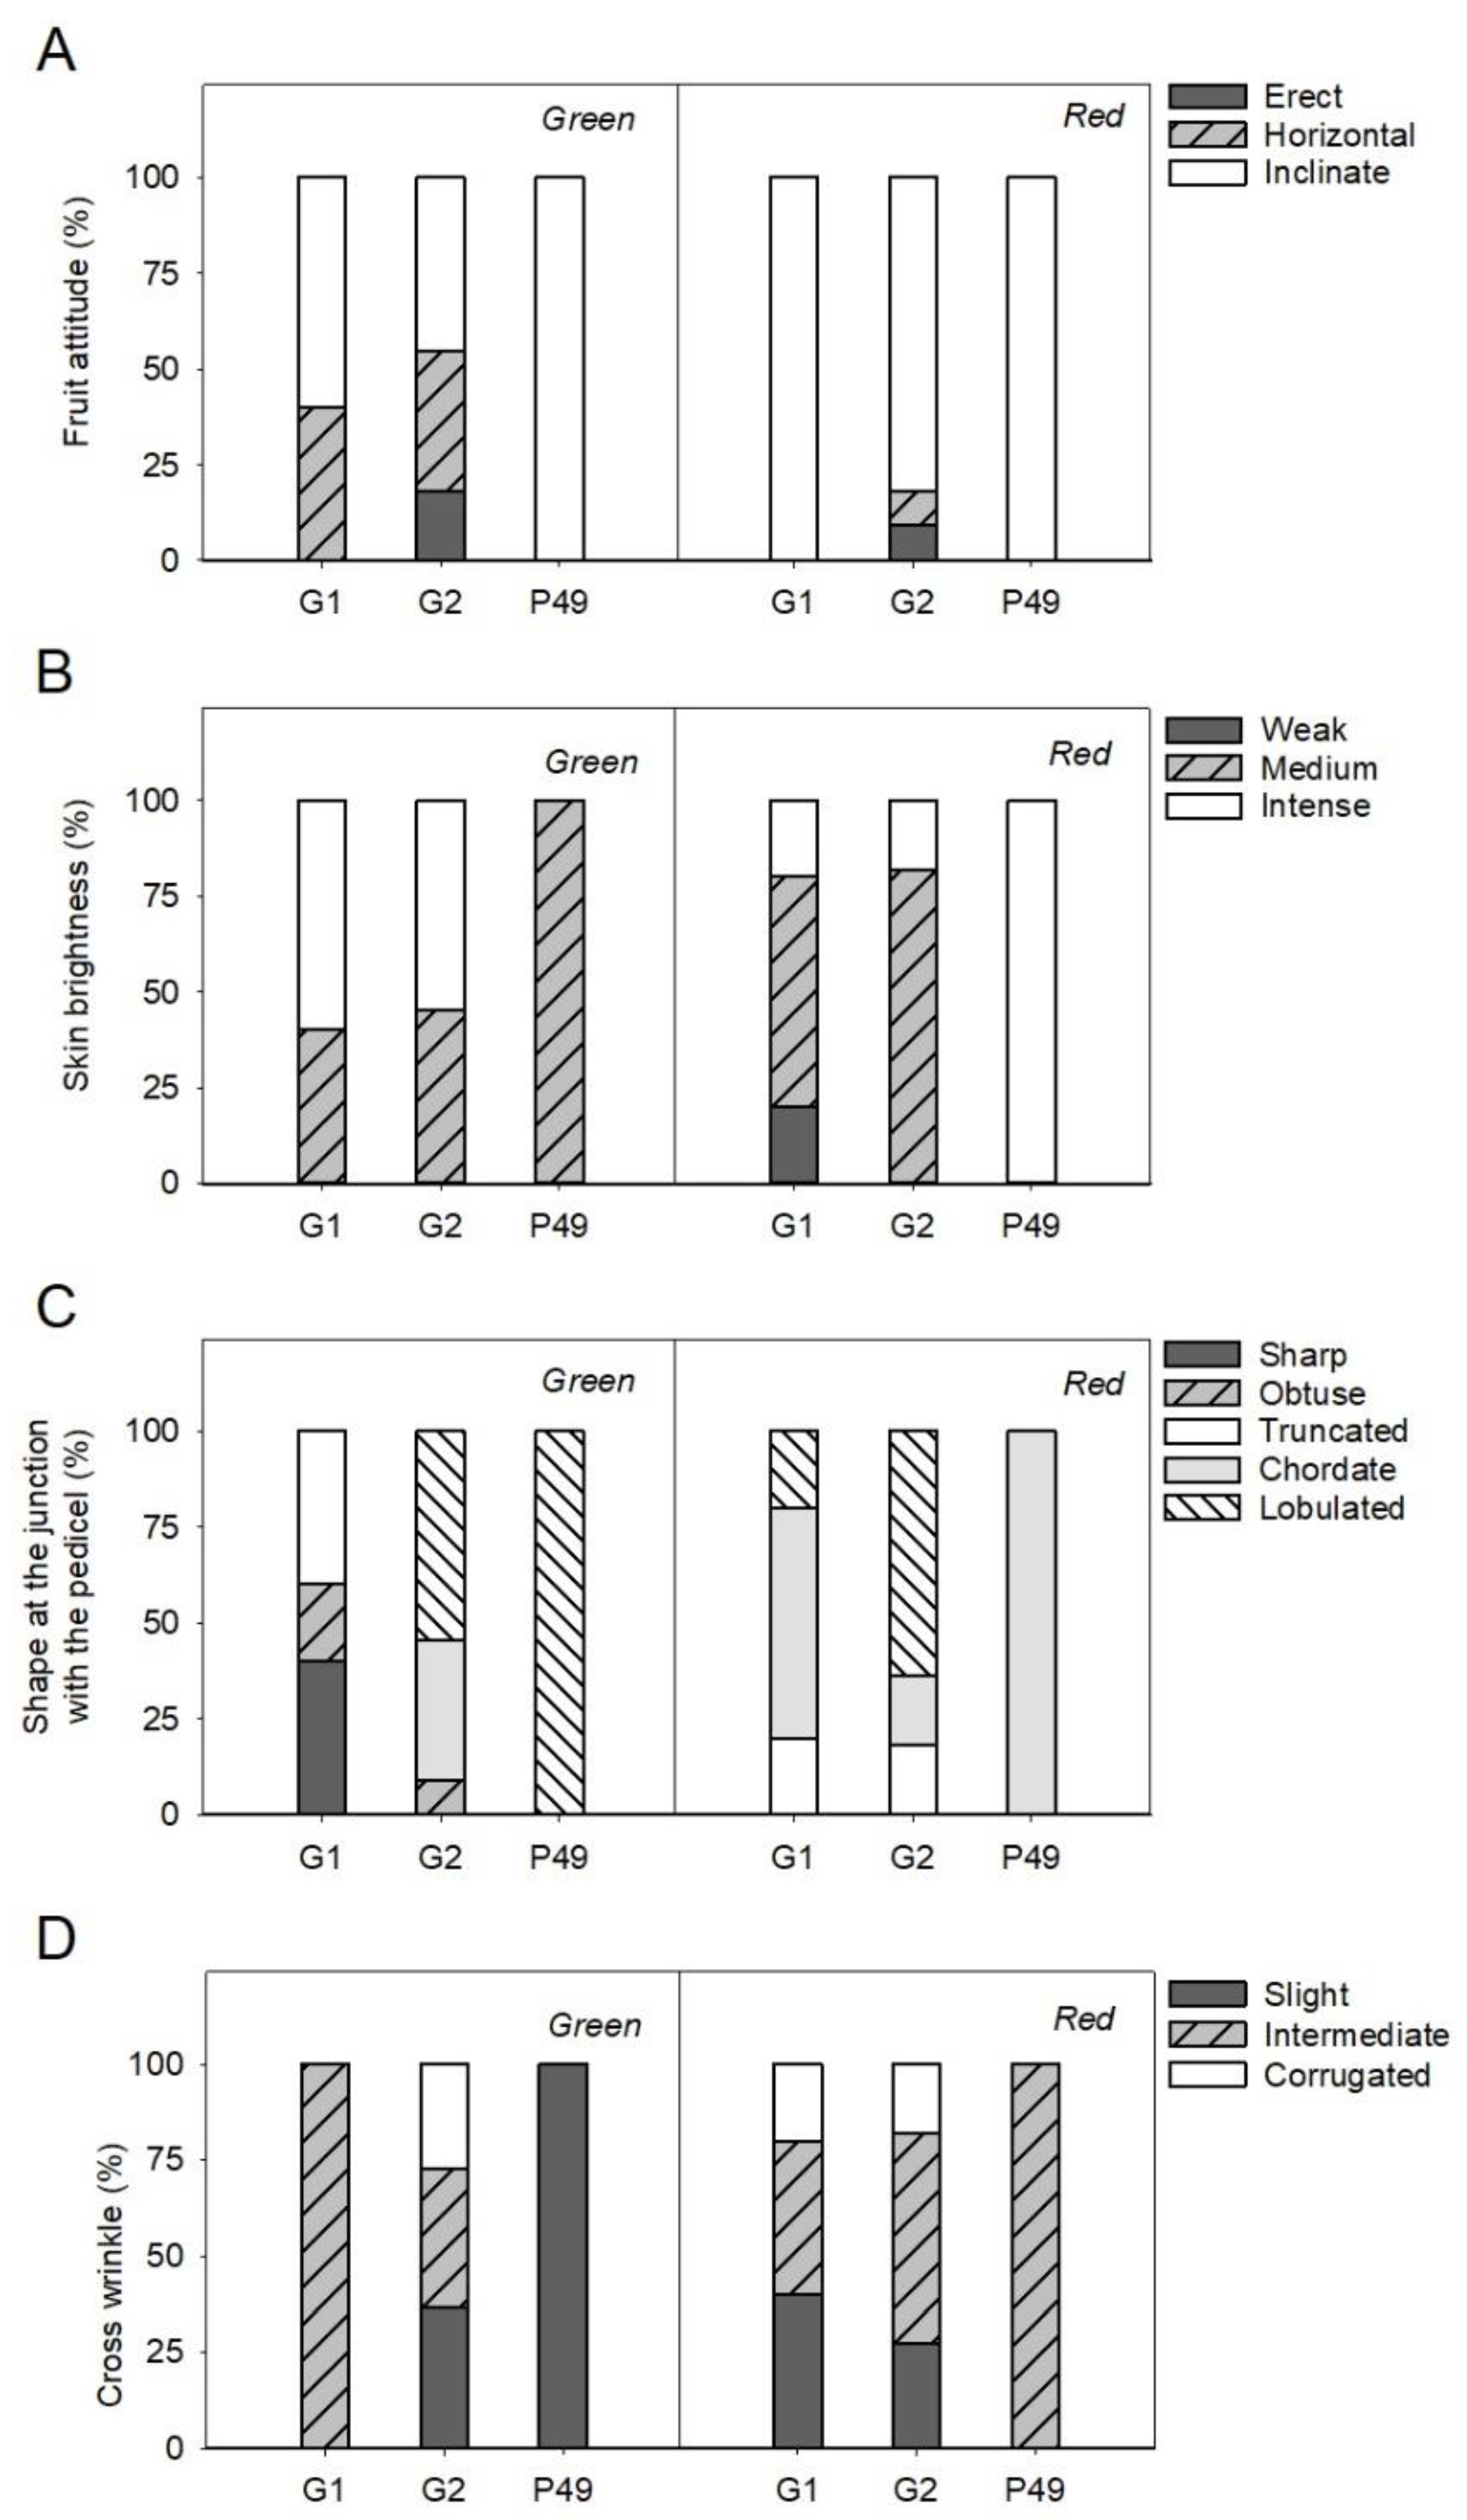
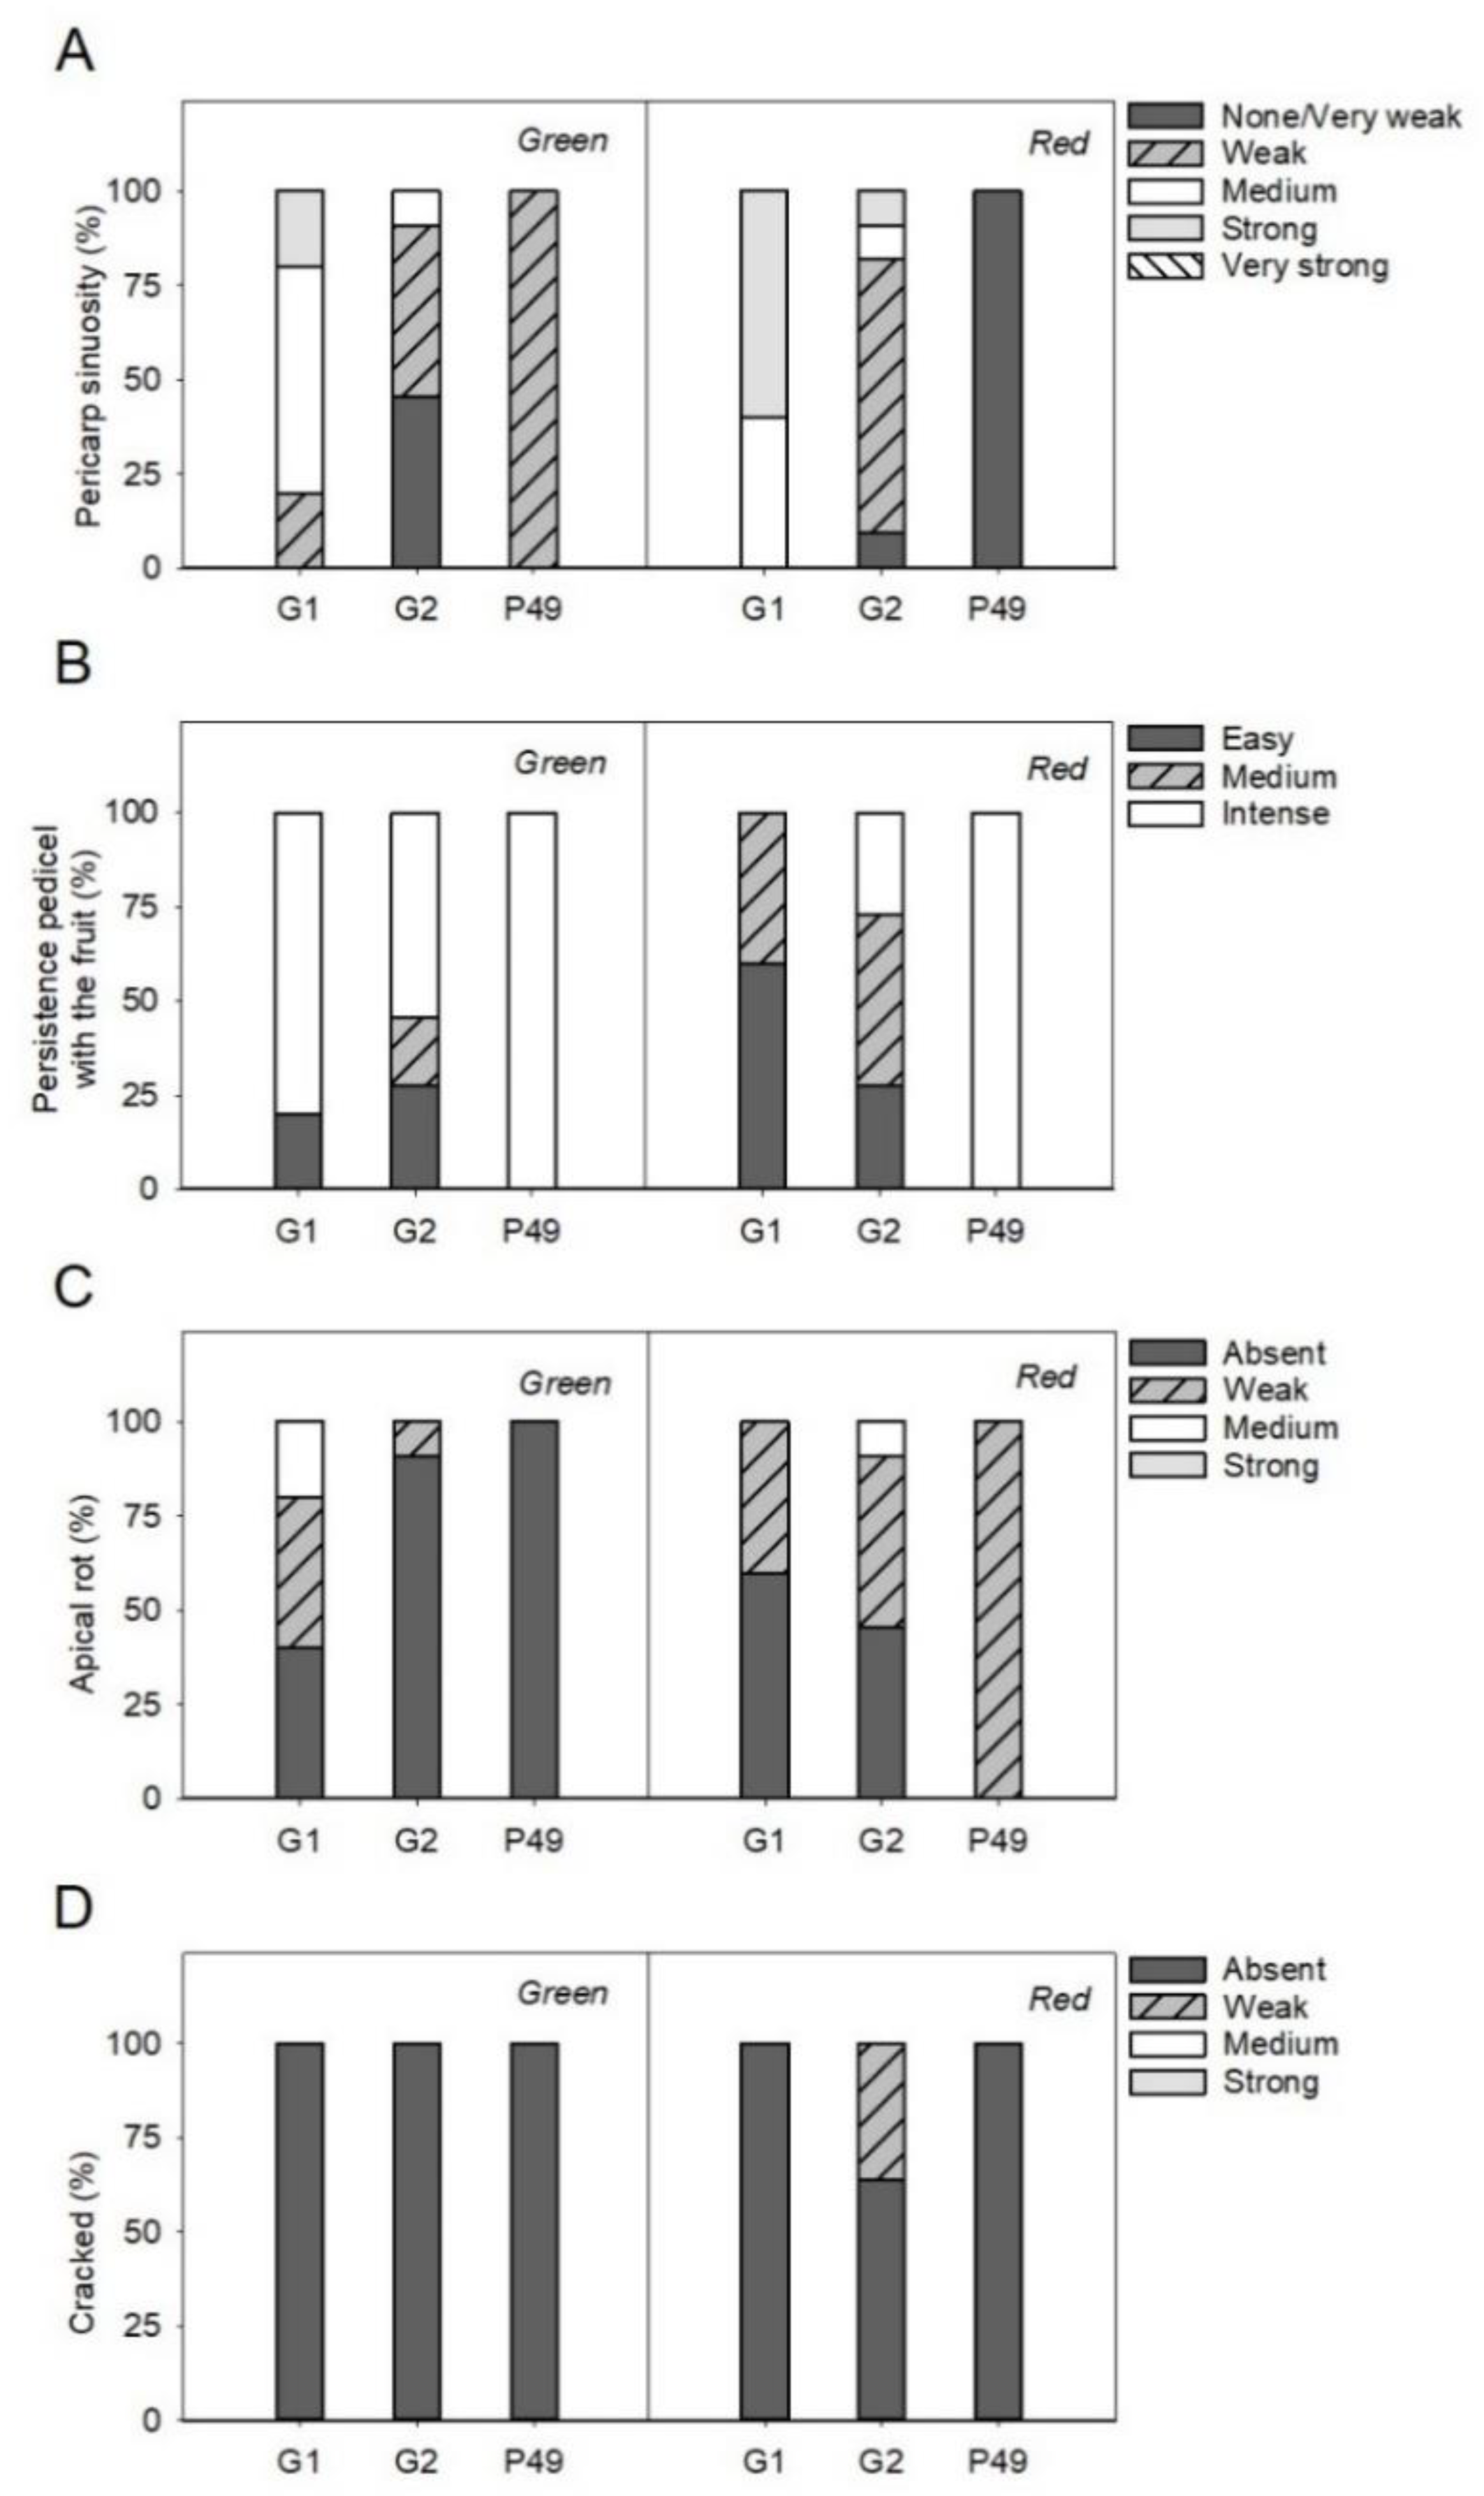
3.4. Phenotypic Differences in Qualitative Fruit Traits
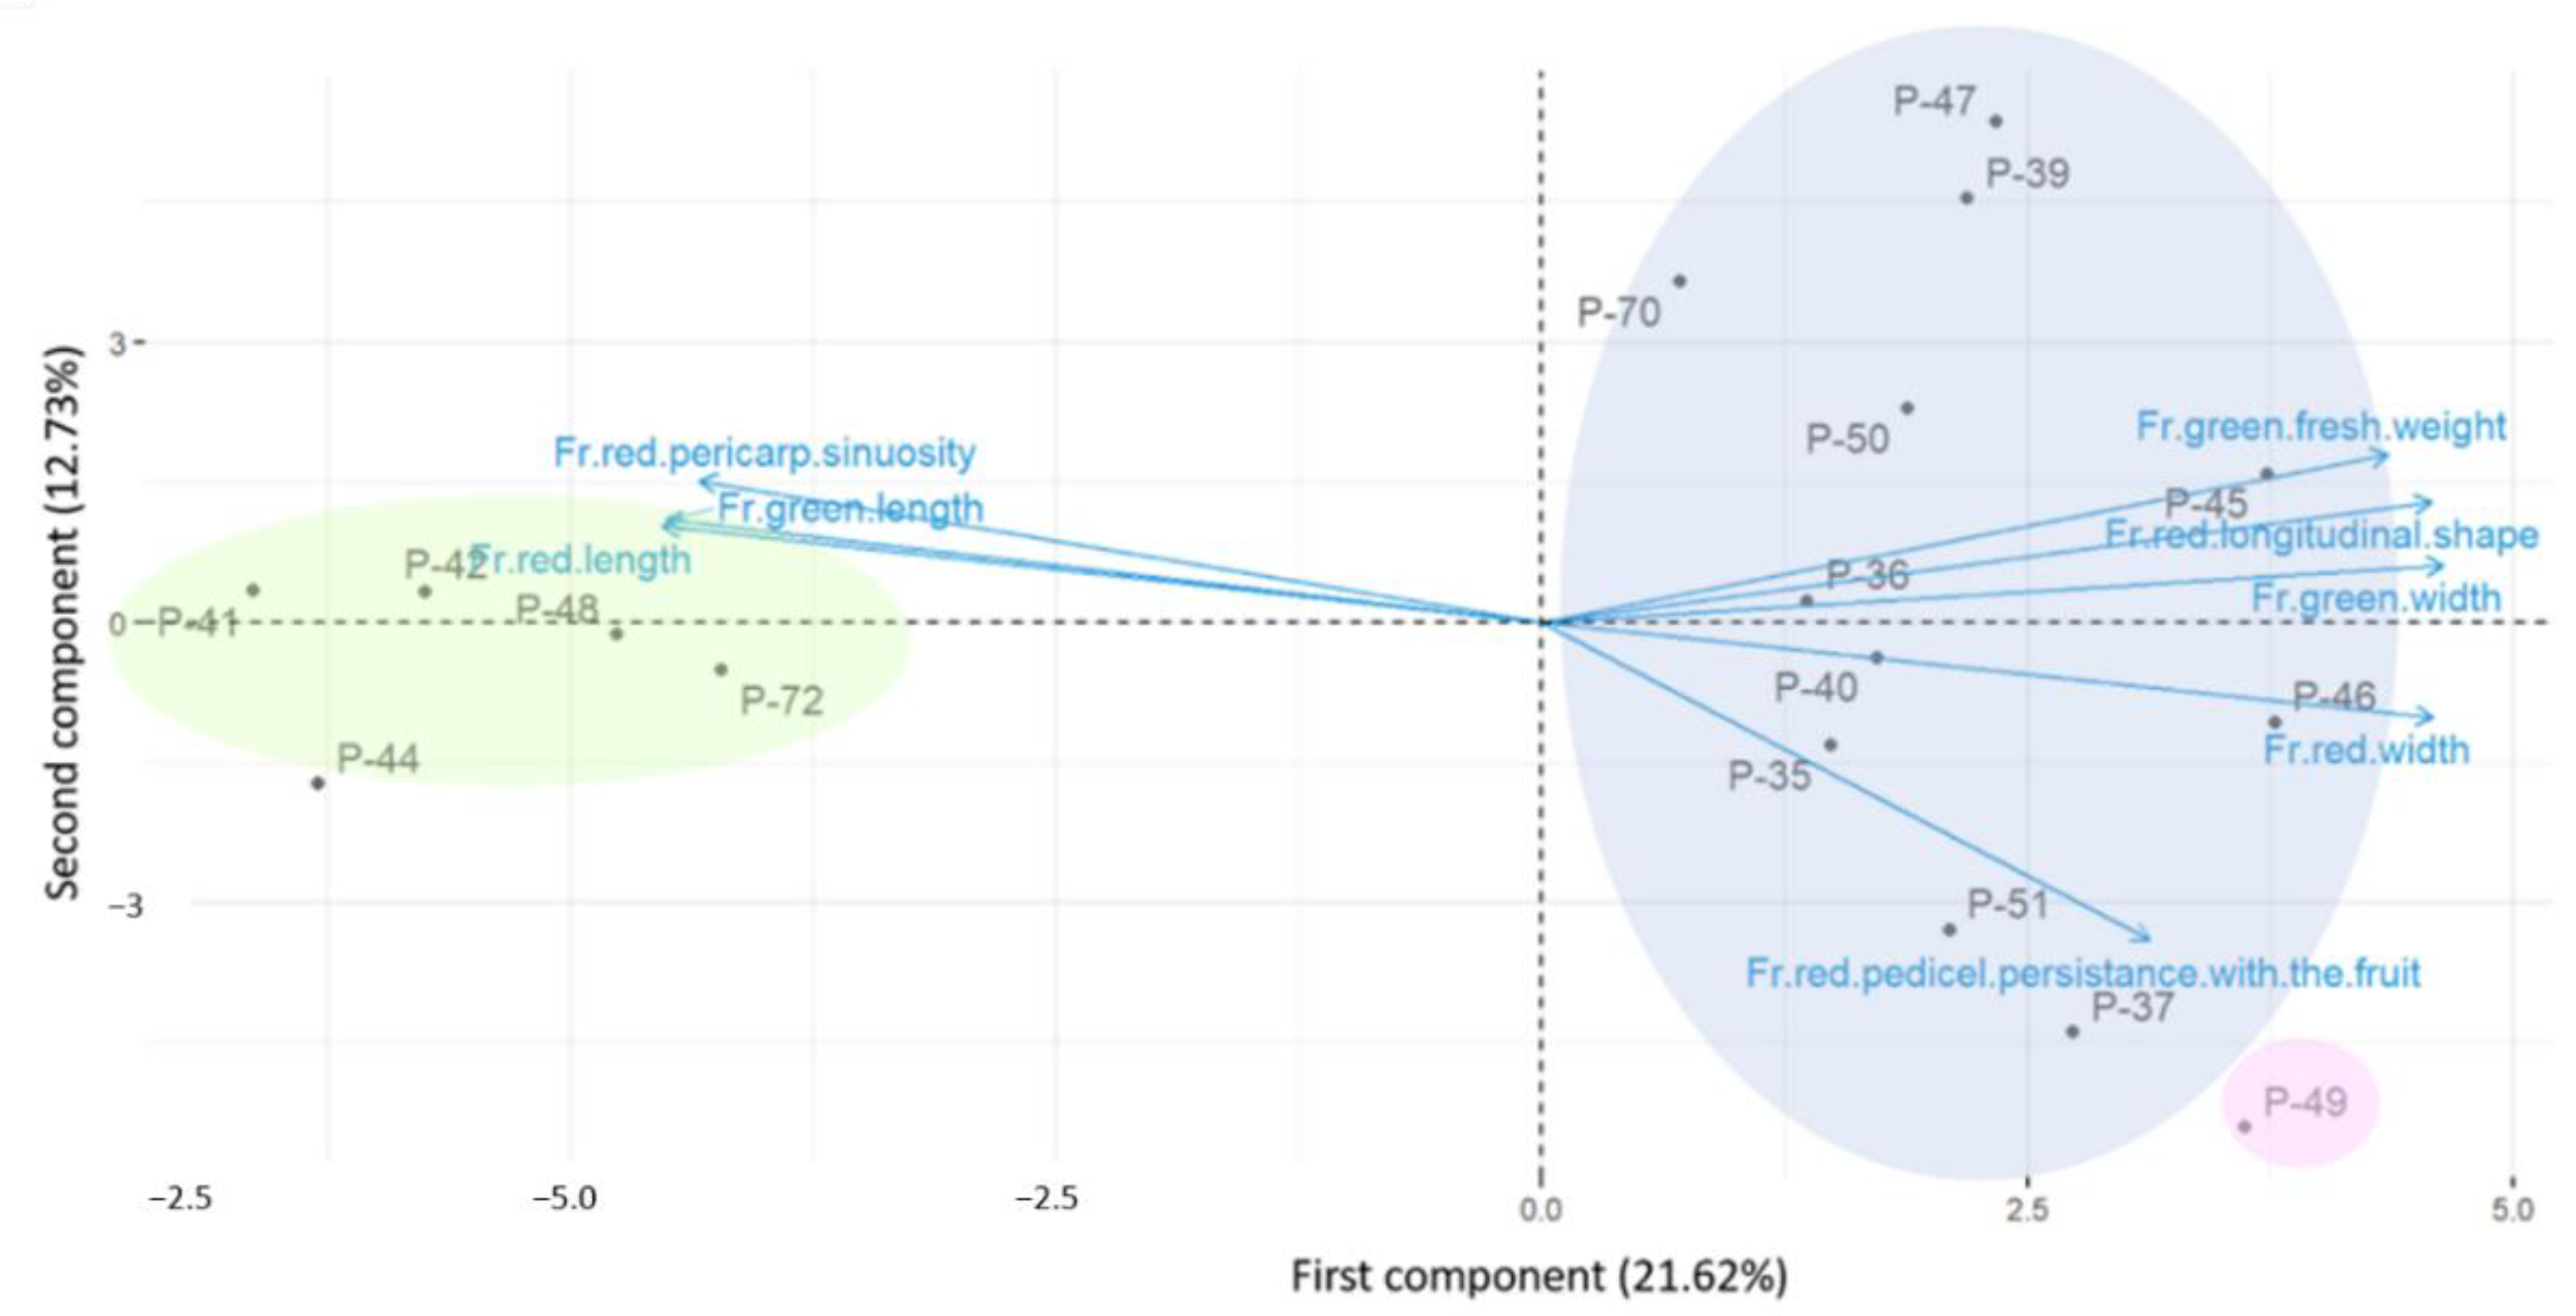
The frequency of several qualitative fruit traits occurring for each group and maturation stage was recorded in several histograms (Figure 6, Figure 7, Figures S1 and S2).
The G1 group fruit presented horizontal or inclined attitude (Figure 6A) and medium or intense skin brightness (Figure 6B) and were characterized by their elongated fruit shape (Figure S1A). The junction with the pedicel (Figure 6C) changed its sharp truncated shape to become more chordate with maturity. G2 was composed of varieties whose fruit had different morphologies (blocky, triangular, flared) (Figure S1A). Maturation changed somewhat in them because it distorted their attitude (Figure 6A) and skin brightness (Figure 6B) by reducing morphology (Figure 6C), which became more flared and shaped at the junction with the pedicel and was mainly chordate or lobulated in the green fruit but mostly lobulated or even truncated in the red fruit. The P-49 fruit had an inclined attitude (Figure 6A); skin brightness was amplified with maturity (Figure 6B), and they were the only ones with a round shape (Figure S1A). Maturation changed their shape at the junction with the pedicel (Figure 6C) to become lobulated when green and chordate when red.
G1 and G2 fruit were less wrinkled upon maturity (Figure 6D), but pericarp sinuosity increased (Figure 7A). Pedicel persistence with both the stem and, especially, fruit reduced during maturation (Figure 7B and Figure S2B). Maturity appeared to be related to the increased appearance of apical rot (Figure 7C), especially in the G2 fruit, for which the number of affected landraces rose from 1 to 6. This also occurred in P-49. Finally, fruit cracking (Figure 7D) seemed to accentuate with ripening, but only in G2 (rising from 0 to 5 out of 11 in the red fruit).

3.5. PCA Analysis

The PCA analysis and eigenvalues higher than 1 reflected different patterns in the pepper landraces correlation (Tables S3 and S4). Fifteen principal components were determined, which described around 98.86% of the total variability between landraces. Only the landrace distributions based on the strongest principal components are herein shown; the first (Figure S3), second, third, and fourth components of the PCA, respectively, accounted for 21.6%, 12.7%, 9.6%, and 8.7% of the variance of the total variation in the studied traits, while cumulative variance explained 52.71% (Tables S3 and S4). Only the correlations with an absolute value of ≥0.150 were listed to simplify the results (Table 2 and Table S4) and to highlight only those parameters that were really important for establishing differences between varieties.
Pepper landraces were widespread over the PCA projection area (Figure 8 and Figure S4). In general, the landraces that were similar in fruit shape were placed together, which suggests the importance of fruit morphology-related traits. Two groups were arranged based on their fruit length (L) and width (W) dimensions (G1 = elongated, L/W > 5; G2 = triangular, square or blocky, 1 < L/W < 5). Landrace P-49 was not included in any of these groups because of its unique fruit morphology, round shape (L/W < 1), and some distinctive characteristics (related to the percentage of dry weight, placenta length), and was, therefore, somewhat marginalized in the lower part of the plot (Figure 2).
In the plot corresponding to the first and second components (Figure 8), the G1 varieties (P-41, P-42, P-44, P-48, and P-72) are located furthest to the left and stand out for developing the most elongated and narrow fruit in the study and for having the lightest fruit with the strongest pericarp sinuosity. Based on apex shape, they can be classified as pointed. In contrast, the G2 landraces stand out for developing shorter, heavier, and wider fruit than the G1 ones. P-45 and P-46 are highlighted, which also present a practically smooth pericarp and a blunt or sunken apex after ripening. Hence, they are located mostly on the left of the graph. From G2, and in relation to the second component, varieties P-37 and P-51 and the ungrouped P-49 are located in the lower part of the PCA plot (Figure 2) for their strongest pedicel persistence with fruit in addition to other minor pondered traits such as the marked anthocyanin intensity in their stem nodes in P-37 and P-49, but to a lesser extent in P-51. Complementary information is shown in Figure S5.

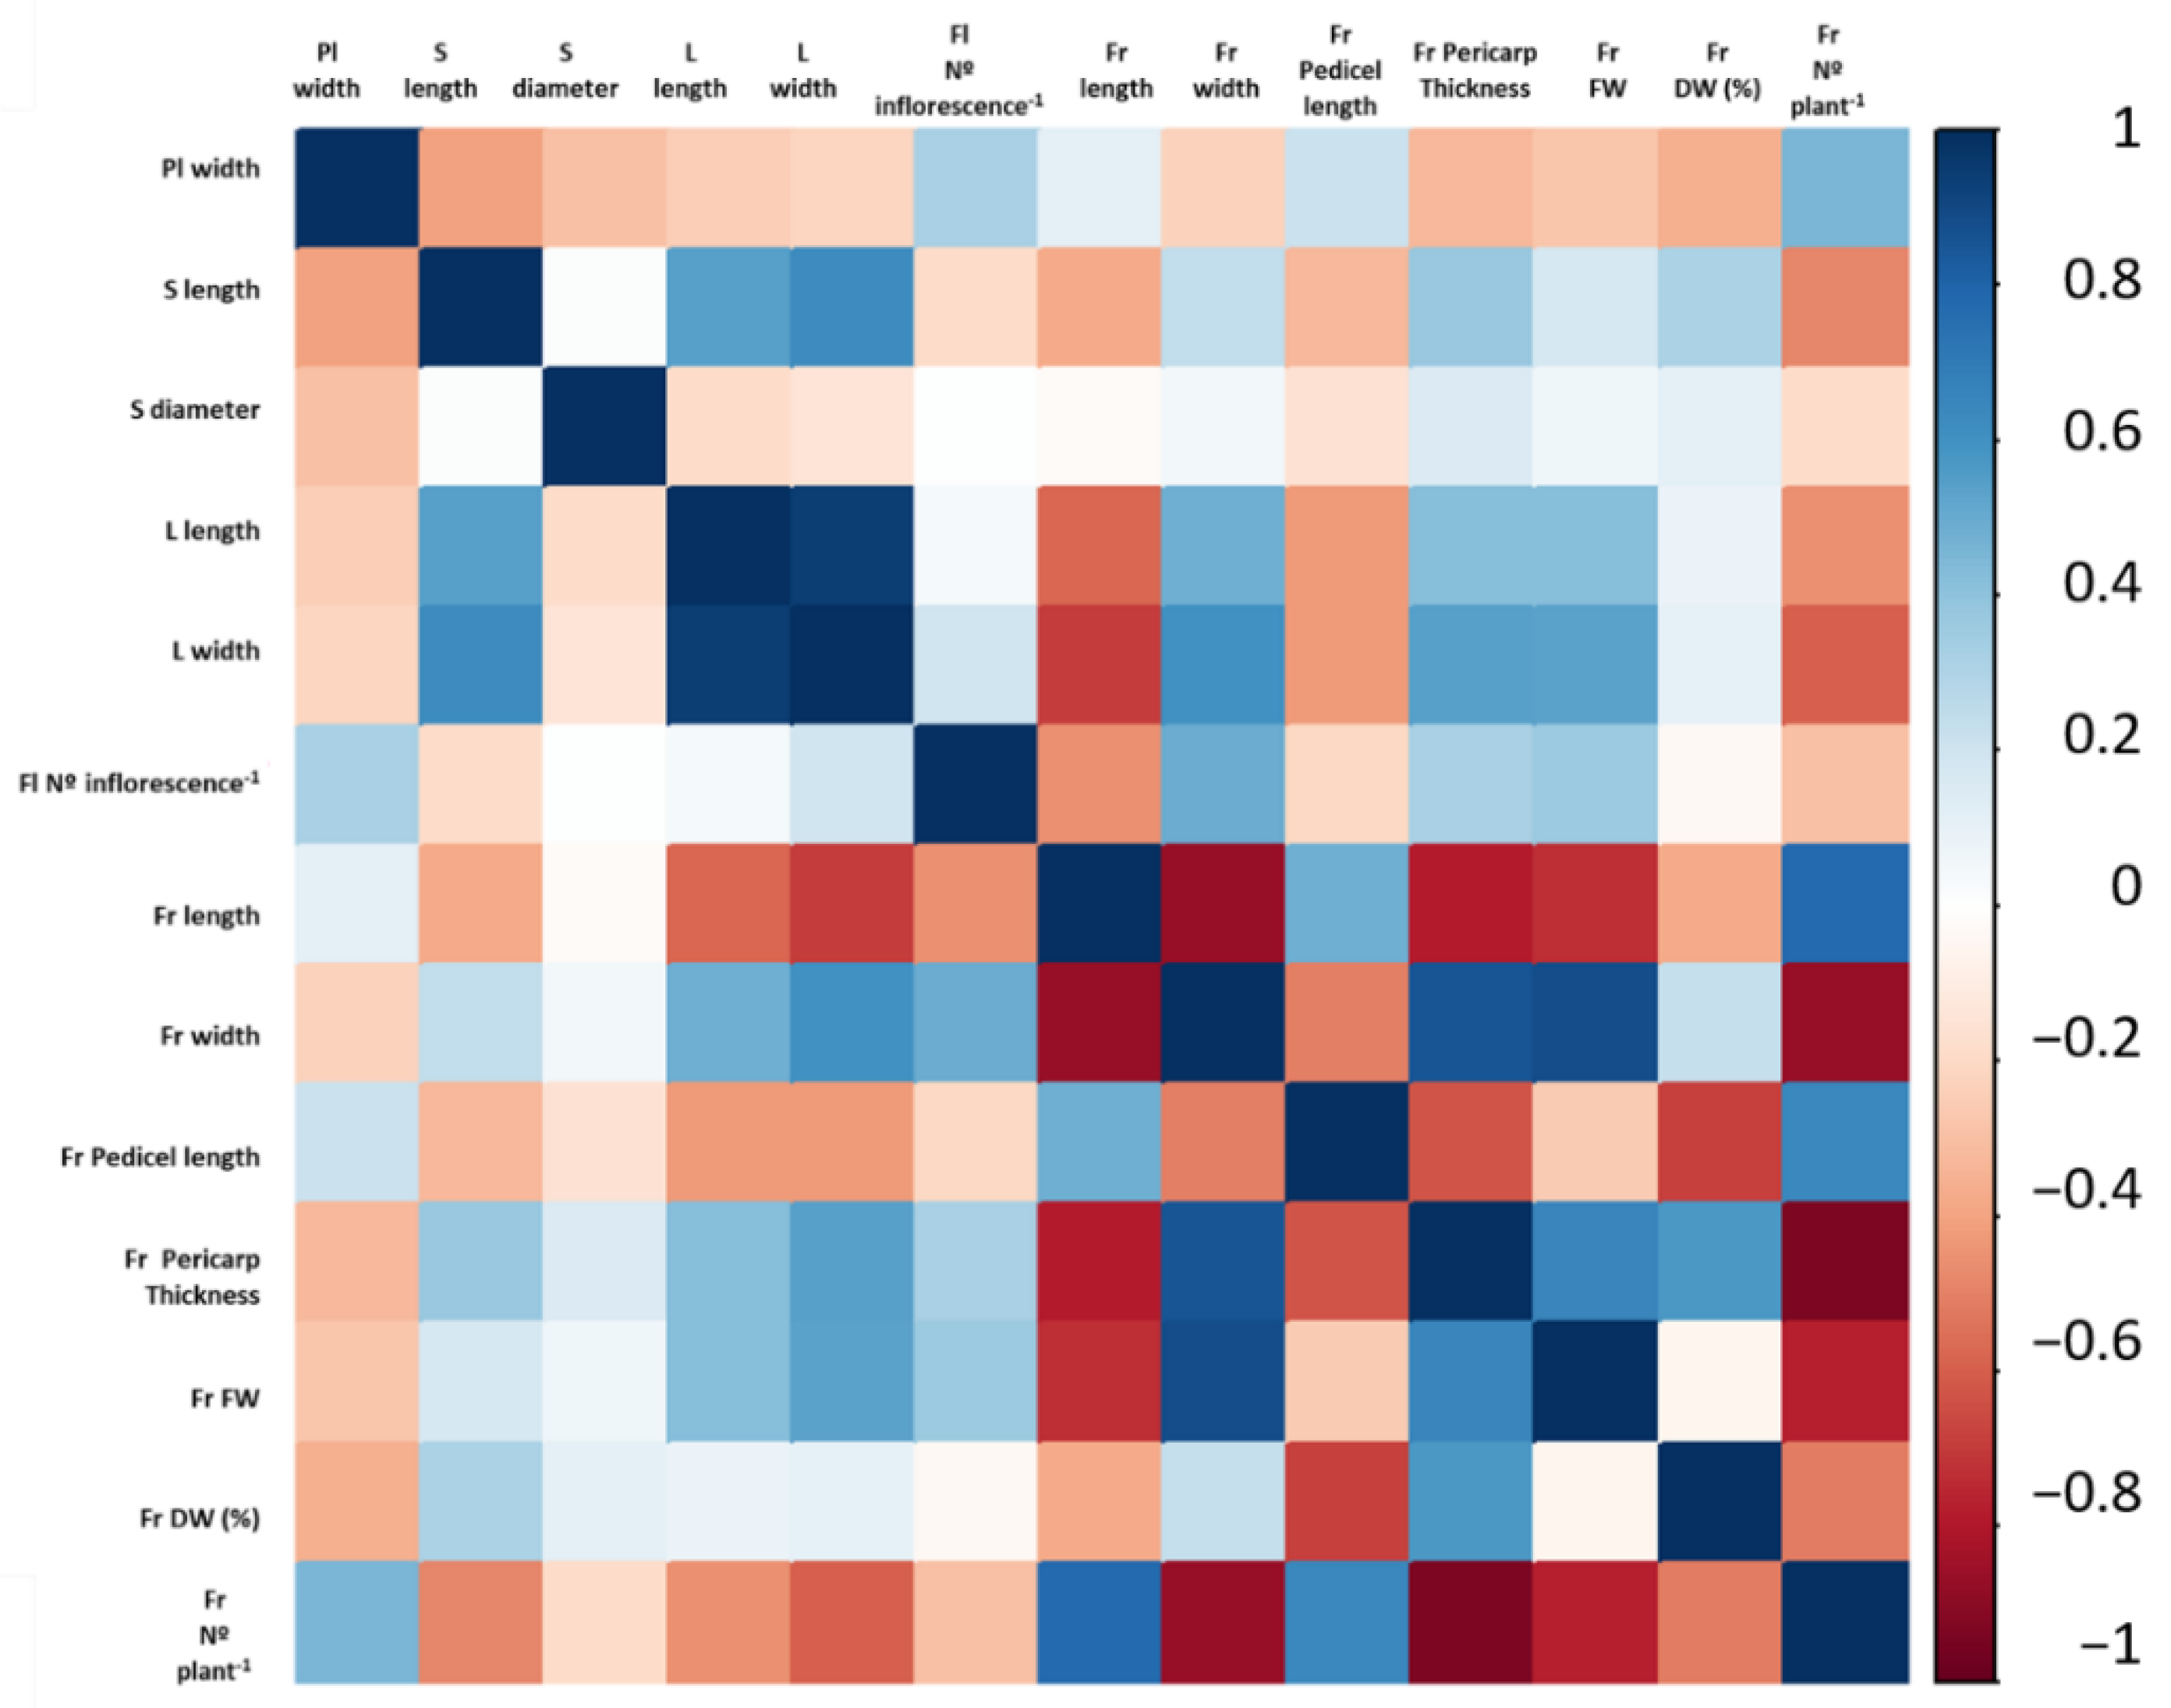
3.6. Correlation among the Selected Quantitative Traits

In order to estimate the contribution and relation between the most important quantitative traits, a correlation analysis was carried out and illustrated by a correlation heat map (Figure 9). The pairwise coefficients are shown in Table S5. The most representative positive correlations were detected for leaf length vs. width, fruit width vs. pericarp thickness, and fruit width vs. fruit fresh weight. These significant pairwise coefficients can be grouped mainly into three kinds of combinations: (1) related to plant size and both leaf dimension and flower/fruit number; (2) fruit width and leaf size; (3) pericarp thickness and fruit fresh and dry matter. The strongest negative relations appeared in three combinations of traits: number of fruit per plant, in particular, vs. fruit width, vs. pericarp thickness, and vs. fruit dry weight.

4. Discussion

The phenotyping or morpho-characterization of landraces with more descriptors facilitates the identification of discriminatory traits or combinations of traits among accessions [29]. This objective is very important because it determines each cultivar’s plant architecture or life cycle by contributing both the agronomic value of landraces and breeding practices; it is an efficient tool for estimating genetic diversity among genotypes because it illustrates divergence [30]. In our study, 20 qualitative and 45 quantitative traits were measured in the vegetative organs, flowers, and both immature and mature fruit of pepper plants. This provided a broader overview (65 data) than similar studies carried out on this crop [11,30,31,32,33,34,35].
PCA is a key tool for determining the most remarkable traits for landrace characterization in cultivated species, such as pepper [33,34,36,37,38,39], sweet potato [40], eggplant [23,41], and tomato [28,42,43] and in ornamental plants such as spider plants [44]. According to our results, when subjecting the phenotypic data of the 17 pepper landraces to PCA analysis, 15 principal components were established and corresponded to 98.92% total variation, but none explained more than 21.82% of diversity among landraces. From this, we inferred wide diversity among accessions even though landraces belonged to the same geographical zone (Valencian Community). Bianchi et al. [30] suggested that accessions from the same regions could not be grouped based on geographic origin. The same conclusion was drawn by Cardoso et al. [35], Baba et al. [45], Moreira et al. [46], and Lahbib et al. [47]. The extended variability in our 17 landraces shown by PCA was associated with different causes. (a) To some extent, Capsicum sp. is considered an autogamous plant. Hence, its reproductive behavior is fairly variable compared to other species, although a certain amount of cross-pollination can occur due to high temperatures, wind, and the presence of insects. Moreover, but no less importantly, (b) plants are transported between regions by human activity, which should not be underestimated, as pointed out by Bozokalfa et al. [11]. This would explain why a correlation is lacking between the geographic and genetic distances found by Finger et al. [48] in peppers. The same conclusion applies to other important cultivated crops like melon [49], lentil [50], sunflower [51], quinoa [52], and garlic [53].
The main principal component to explain 21.8% total variability correlates mostly with fruit descriptors because they are the main differential traits between landraces. The separation of accessions associated with fruit traits is a common practice among the landraces destined for the food market. As consumers accept different pepper sizes, Capsicum sp. breeding studies have focused on variability characterization for fruit-related traits when selecting promising accessions [34,35,45,47]. A similar conclusion has been reached with other fruit crops, such as eggplant [54,55] and tomato [56], and suggest the key role of morphological variation in this organ during species’ domestication process [57]. In particular, the traits related to fruit size, fresh weight, sinuosity, and pericarp thickness were highlighted in the first PCA component, and two groups (G1 and G2) were clearly differentiated. This proved the consistency of the analysis with varietal type, and it also means that genotypes with similar fruit characteristics are generally clustered together. Thus, the fruit from the G1 landraces (left side of the plot) were elongated and light, with marked sinuosity, and had the thinnest pericarps. G2 fruit (right side) were shorter and heavier and had thicker pericarps in both maturity states. Differences with the ungrouped P-49 fruits were even more marked because this landrace presented the shortest fruits with the thickest pericarps, as well as heavy fruit, at least when immature. A wide variation in fruit diameter and length has also been reported in other studies performed with pepper [30,34,58], and the characteristic that most contributes to genetic divergence is fruit length for [59] and fruit size [35]. Similarly, do Rego et al. [31] reported that fruit length and fruit width are the most important traits for phenotypic divergence (32.3% and 20.6% relative importance, respectively) from a list of 14 analyzed characters. The most discriminating traits for Tembe et al. [33] are fruit shape, width, thickness, and weight, in addition to some quality parameters. For Wasonga et al. [34], a hierarchical cluster analysis grouped the evaluated accessions into eight distinct clusters based on fruit shape, size, surface, and color. According to Bento [60], by means of fruit size, the most appropriate way to use accessions can be determined, as small pepper fruit are mostly employed by the processing industry, while large uniform peppers with good texture or firm fruit are preferably eaten fresh. Regarding pericarp thickness, a wide range (0.04–13.0 mm) was reported by do Rego et al. [31] in 69 accessions of the Capsicum genus. Lower values for pericarp thickness (1.38–3.08 mm) and apparent less variability were described by Bianchi et al. [30], but that study was carried on 55 accessions from the C. chinense Jacq species, which are notably smaller than the C. annuum species. For Tsoney et al. [33], most of the variation in Bulgarian pepper cultivars was manifested by fruit width, pericarp thickness, and fruit weight. These traits are the most discriminative found among the pepper accessions (C. annuum L.) used to study genetic and phenotypic landrace diversity in NW Spain [34] and Tunisia [47].
From the correlation analysis, pericarp thickness correlated positively with both fresh weight and dry matter content. This was the consequence of including fruit from both maturity states in the analysis. As red fruit had thicker walls than green ones, which was especially relevant in landraces G2 and P-49, their water content lowered during the natural ripening process, which increased the dry biomass percentage. The increment in DW biomass during the ripening process has been previously reported [61]. Similar results with a positive correlation between FW and thickness have been obtained by Lannes et al. [62] and Rego et al. [31], although they evaluated only one (ripe) fruit type, as well as a different species (C. chinense and C. baccatum, respectively). Moreover, thicker fruits also presented a higher placenta proportion, especially the mature ones, which was the case of some landraces from G2 (P-45, P-47, P-70) and the ungrouped P-49 variety (Figure S1). Both traits have been related to high soluble solid content levels and optimal qualities for the dehydration industry [62]. Placenta size has been related to the accumulation of higher levels of capsaicinoids [47] as they are preferentially synthesized in this tissue [63]. Pericarp thickness is favored by the maturity process, which increases the degree of resistance to pathogens and transportation damage during the postharvest [36,48] to allow longer commercialization periods [64].
Adequate pedicel length is always a desirable trait because it facilities harvest management [32] or is attention-grabbing for leaves to be ornamentally employed [65]. In our study, this trait was not a limiting factor for fruit picking because pedicel length in most landraces ranged from 3.5 to 6.6 cm (Table 4 and Table 5), and the minimum for this trait has been determined as 1.5 cm [66]. The interest of our data also lies in dependence on the maturity state as red fruit had shorter pedicels than green ones in all the studied groups/landraces (22.4%, 13.5%, and 18.5% reduction in the G1, G2, and P-49 means, respectively). The negative relation observed between pedicel length and the DW percentage is associated with water loss during maturity. Similarly, some authors describe xylem occlusion in pedicels and the disruption of fruit-to-plant junctions during fruit ripening as a mechanism that leads to fruit hydraulic isolation from the rest of the plant [67,68]. Trifilò et al. [69] determined that the hydraulic architecture in the fruiting phase of hot pepper plants is clearly addressed to favor water supply to growing fruit. Another correlation was found between pedicel length and fruit size because the longer the pedicels, the longer and narrower the fruit, and, in turn, the capacity to produce fruit was greater. One clear example was the landraces from G1. In contrast, the G2 landraces had fewer fruit plant−1 in relation to their high pericarp thickness values, whose mean value was even more marked upon ripening (53.6% and 67.0% higher than G1 in the green and the red fruit, respectively). The inverse relation between the number of fruit and their weight, which was positive with wall thickness, has also been described by Osschiuto et al. [36] and Lannes et al. [62]. A similar positive correlation has been found by Lahbib et al. [47] between fruit wall thickness vs. fruit width and fruit length vs. fruit plant−1. This means that the strong correlations (significance level p < 0.001) between the combination of several of these traits (fruit length vs. fruit width, fruit width vs. fruit plant−1, pedicel length vs. fruit DW, pericarp thickness vs. fruit plant−1) suggest that common or linked genes related to fruit size, pericarp thickness, and pedicel length control these traits, as previously reported [70]. According to do Rego [31], improving fruit wall thickness indirectly improves DW.
Regarding number of locules per fruit (Table 4 and Table 5), the mean value in the elongated fruit (G1) was lower than in the G2 varieties (2.9 and 3.5, respectively). The relation of this trait to fruit shape has been previously reported by Bozokalfa et al. [11].
Finally, fruit persistence on pedicel is an important agronomic trait for discriminating the final use of an accession. Searching for an accession with moderately-low persistent fruit that do not drop easily due to wind and rain but drop easily at harvest is a desirable trait when harvesting. This is the tendency in most of the G1 and G2 landraces, which increases with maturity (Figure 8). According to Poulos [71], with pepper breeding for fresh markets, special attention is paid to improvements for easy fruit detachment, plus other qualities (concentrating fruit set and ripening and short crop duration). In contrast, the P-49 landrace displayed moderate-intense persistence, even in the red fruit, due to its likely industrial use and potential mechanical harvest. This trait is also desirable in landraces for ornamental purposes, such as most C. chinense varieties [72], to maintain plants’ esthetic value for as long as possible.
Vegetative characters are also useful to distinguish between Capsicum landraces, where plant size is a good selection criterion because it influences the destination of plants [47]. Most landraces present plants taller plants 86 cm and an erect growth habit (Figure 2B), which made us realize the worthlessness of these data in our study. However, both are preferential qualities for fruit growers as crop management benefits (area between plants, harvesting, weed control) are evident, which proves the suitability of the studied local landraces. Our values agree with previous reports carried out in C. annuum plants to be sent to fresh markets [47]. Although yield per plant in pepper is a highly complex issue that is influenced by several traits, some authors have reported a positive correlation between pepper yield and plant size [73,74]. Genotypes with narrower plant widths allow more individuals per area unit, which promotes the better use of cultivation areas and higher economic yields. The importance of canopy diameter has been reported by do Rego et al. [75] to determine the space between plants and rows. Conversely, accessions with intermediate to prostrate growth habits tend to grow to a shorter height and are, therefore, more appreciated on ornamental plant markets [59,76]. The accessions selected for ornamental use, with a canopy diameter and plant height that are 1.5- to 2-fold larger than the pot they are planted in, are recommended, while larger plants are grown as outdoor crops [77].
Moreover, bigger-sized plants grow larger leaves (in both length and width terms), together with more flowers and fruit per plant. The correlations between leaf and fruit traits (positive with fruit width and wall thickness, negative with fruit length) are also notable. A larger foliar area offers a better photosynthate accumulation in plants, which ultimately produces thicker and wider fruit. This occurs in pepper and other crops [61,78]. In contrast, small leaves are interesting for ornamental peppers to better visualize the flowers and fruit [79] and for maintaining harmony with these plants’ required small size [77].
Although stem diameter does not correlate with any of the considered traits, our values exceeded 1.5 cm in all the landraces and even rose to 2.5 cm in P-50 (Table 4). These are good results compared to other studies [32] because the wider the stem, the better the weight support of both the plant and its fruit. For this reason, stem diameter is also considered an important trait for selecting genotypes [79]. Santos Pessoa et al. [32] recommended three genotypes for selection as they presented the widest stem diameter (72% bigger than the mean value) in a study carried out with 16 accessions of ornamental peppers.
In relation to flower traits, most accessions had only one flower per axile (Table 2), which is a typical trait of C. annuum. Although the same value has also been observed in C. baccatum var. pendulum, this descriptor is considered extremely important for differentiating botanical varieties [29]. In our study, flower traits did not vary much when comparing the different landraces. Independently of fruit shape or market destination, there is a clear trend for erect flowers, serrated and non-pigmented calyxes, and light tones (white or yellow) in filaments, anthers, and the corolla. Lack of flower variability in our landraces contrasts to other authors’ findings, who have related variation in flower characters as being fundamental in genetic breeding, given the need to carry out segregating generations and to produce hybrids [80].

5. Conclusions

Our results showed a high degree of diversity among the selected traditional pepper landraces. The desirable characteristics that may be of interest for culture practices and handling jobs, such as crop harvests, include erect growth habit, dense branching, big leaves, and uniformity and low persistence of fruit. Although landraces are clearly differentiated by their fruit shape (G1 elongated, G2 triangular, square or blocky), some are highlighted for having good attributes for some specific traits. In G1, P-41 produces the longest fruit with thick pericarps and high fresh weight values when the fruit are red. Quite the opposite occurs for the P-72 fruit, which are less elongated but with remarkable wall thickness and fresh weight. From G2, the most productive landrace is P-37, whose big plants produce heavy triangular fruits with high DW values or percentages in both fruit types. The ungrouped P-49 variety can also be promoted for the uniformity of its fruit, thick pericarp, and DW, which all make it an optimal candidate for the industry. Phenotypic description is a useful tool for complementing nutritional and genetic methods to analyze variability in crop diversity studies, identify valuable accessions for breeding programs, develop efficient conservation strategies, and produce detailed agricultural catalogs to facilitate variety selection for every case and need.

Supplementary Materials

The following supporting information can be downloaded at: https://www.mdpi.com/article/10.3390/agronomy12030632/s1, Figure S1:Frequency distribution of fruit traits; Figure S2: Frequency distribution of fruit traits; Figure S3: trait contribution to PC1; Figure S4: PCA analisi for the first four PCs; Figure S5: Dendrogram; Table S1: Descriptors used for phenotyping; Table S2: Descriptive statistics of quantitative traits; Table S3: PCA components; Table S4: Correlation coeficients for the first four PCs; Table S5: Linear correlation analysis (values).

Author Contributions

Conceptualization, Á.C., M.-R.M.-C. and E.M.-I.; Methodology, Á.C., E.M.-I., M.-R.M.-C., J.I.M. and R.M.-F.; Validation, Á.C., E.M.-I. and M.-R.M.-C.; Formal Analysis, E.M.-I. and M.-R.M.-C.; Investigation, Á.C., M.-R.M.-C. and E.M.-I.; Resources, Á.C., S.S., M.J.D. and J.V.V.; Data curation, Á.C. and M.-R.M.-C.; Writing—Original Draft Preparation, E.M.-I. and M.-R.M.-C.; Writing—Review and Editing, Á.C., S.S., M.J.D. and J.V.V.; Supervision, Á.C., S.S., M.J.D. and J.V.V.; Funding Acquisition, Á.C., S.S., M.J.D. and J.V.V. All authors have read and agreed to the published version of the manuscript.

Funding

This work is included in Project 51903, cofounded by the European Union through the European Regional Development Fund (ERDF) of the Generalitat Valenciana 2014–2020.

Institutional Review Board Statement

Not applicable.

Informed Consent Statement

Not applicable.

Data Availability Statement

Data are contained within the article or Supplementary Materials.

Acknowledgments

This work was funded by the Generalitat Valenciana and FEDER.

Conflicts of Interest

The authors declare that the research was conducted without any commercial or financial relationships that could be construed as a potential conflict of interest.

References

  1. Martínez-Castillo, R. Agricultura tradicional campesina: Características ecológicas. Rev. Tecnol. Marcha 2008, 21, 3–13. [Google Scholar]
  2. Ebert, A.W. Potential of Underutilized Traditional Vegetables and Legume Crops to Contribute to Food and Nutritional Security, Income and More Sustainable Production Systems. Sustainability 2014, 6, 319–335. [Google Scholar] [CrossRef] [Green Version]
  3. Kansanga, M.; Andersen, P.; Kpienbaareh, D.; Mason-Renton, S.; Atuoye, K.; Sano, Y.; Antabe, R.; Luginaah, I. Traditional agriculture in transition: Examining the impacts of agricultural modernization on smallholder farming in Ghana under the new Green Revolution. Int. J. Sustain. Dev. World Ecol. 2019, 26, 11–24. [Google Scholar] [CrossRef]
  4. Daivis, K.F.; Chhatre, A.; Rao, N.; Singh, D.; Ghosh-Jerath, S.; Mridul, A.; DeFries, R. Más allá de la Revolución Verde: Equilibrando múltiples objetivos para la producción sostenible de cereales. Actas Acad. Nac. Cienc. 2019, 116, 25034–25041. [Google Scholar]
  5. Brush, S.B. Reconsidering the green revolution: Diversity and stability in cradle areas of crop domestication. Hum. Ecol. 1992, 20, 145–167. [Google Scholar] [CrossRef]
  6. Casañas, F. Varietats tradicionals, obtenció de cultivars amb característiques organoléptiquessuperiors i agricultura en espais periurbans Catalans. Quad. Agrar. 2006, 30, 117–127. [Google Scholar]
  7. Cebolla-Cornejo, J.; Soler, S.; Nuez, F. Genetic erosion of traditional varieties of vegetable crops in Europe: Tomato cultivation in Valencia (Spain) as a case Study. Int. J. Plant Prod. 2012, 1, 113–128. [Google Scholar] [CrossRef]
  8. Soler, S.; Prohens, J.; López, C.; Aramburu, J.; Galipienso, L.; Nuez, F. Viruses infecting tomato in Valencia, Spain: Occurence, distribution and effect of seed rigin. J. Phytopathol. 2010, 158, 797–805. [Google Scholar] [CrossRef]
  9. Casañas, F.; Simó, J.; Casals, J.; Prohens, J. Toward an Evolved Concept of Landrace. Front. Plant Sci. 2017, 8, 145. [Google Scholar] [CrossRef] [Green Version]
  10. Díez, M.J.; De la Rosa, L.; Martín, I.; Guasch, L.; Cartea, M.E.; Mallor, C.; Casals, J.; Simó, J.; Rivera, A.; Anastasio, G. Plant Genebanks: Present Situation and Proposals for Their Improvement. the Case of the Spanish Network. Front. Plant Sci. 2018, 9, 1794. [Google Scholar] [CrossRef] [Green Version]
  11. Bozokalfa, M.K.; Eşiyok, D. Evaluation of Morphological and Agronomical Characterization of Turkish Pepper Accessions. Int. J. Veg. Sci. 2011, 17, 115–135. [Google Scholar] [CrossRef]
  12. Muñoz-Ramírez, L.S.; Peña-Yam, L.P.; Álvarez-Gil, M.A.; Iglesias-Andreu, L.G.; Avilés-Viñas, S.A.; Canto-Flick, A.; Guzmán-Antonio, A.; Santana-Buzzy, N. Selection of habanero pepper f1 hybrids (Capsicum chinense jacq.) at the yucatan peninsula, mexico with a high potential for different markets. Agriculture 2020, 10, 478. [Google Scholar] [CrossRef]
  13. Shivakumar, M.S.; Saji, K.V. Association and path coefficient analysis among yield attributes and berry yield in black pepper (Piper nigrum L.). J. Spices Aromat. Crop. 2019, 28, 106–112. [Google Scholar] [CrossRef] [Green Version]
  14. Prayoga, G.I.; Ropalia; Aini, S.N.; Mustikarini, E.D.; Rosalin, Y. Diversity of black pepper plant (Piper nigrum) in Bangka Island (Indonesia) based on agro-morphological characters. Biodivers. J. Biol. Divers. 2020, 21, 652–660. [Google Scholar] [CrossRef]
  15. Nsabiyera, V.; Logose, M.; Ochwo-Ssemakula, M.; Sseruwagi, P.; Gibson, P.; Ojiewo, C.O. Morphological characterization of local and exotic hot pepper (Capsicum annuum L.) collections in Uganda. Bioremediat. Biodivers. Bioavailab. 2013, 7, 22–32. [Google Scholar]
  16. Uddin, M.; Rahman, M.; Hossain, M.; Mian, M. Genetic diversity in eggplant genotypes for heat tolerance. SAARC J. Agric. 2015, 12, 25–39. [Google Scholar] [CrossRef] [Green Version]
  17. Inicio|Organización de las Naciones Unidas para la Alimentación y la Agricultura. Available online: http://www.fao.org/home/es/ (accessed on 15 April 2021).
  18. Agricultura, Pesca y Alimentación en España 2018. Memoria Annual. Available online: https://www.mapa.gob.es/es/ministerio/servicios/publicaciones/Memoria-MAPA-2018.aspx (accessed on 27 October 2021).
  19. Howard, L.R.; Talcott, S.T.; Brenes, C.H.; Villalon, B. Changes in phytochemical and antioxidant activity of selected pepper cultivars (Capsicum species) as influenced by maturity. J. Agric. Food Chem. 2000, 48, 1713–1720. [Google Scholar] [CrossRef]
  20. Zhuang, Y.; Chen, L.; Sun, L.; Cao, J. Bioactive characteristics and antioxidant activities of nine peppers. J. Funct. Foods 2012, 4, 331–338. [Google Scholar] [CrossRef]
  21. Martínez, S.; López, M.; González-Raurich, M.; Alvarez, A.B. The effects of ripening stage and processing systems on vitamin C content in sweet peppers (Capsicum annuum L.). Int. J. Food Sci. Nutr. 2005, 56, 45–51. [Google Scholar] [CrossRef]
  22. Martínez-Ispizua, E.; Martínez-Cuenca, M.-R.; Marsal, J.I.; Díez, M.J.; Soler, S.; Valcárcel, J.V.; Calatayud, Á. Bioactive Compounds and Antioxidant Capacity of Valencian Pepper Landraces. Molecules 2021, 26, 1031. [Google Scholar] [CrossRef]
  23. Martínez-Ispizua, E.; Calatayud, Á.; Marsal, J.I.; Mateos-Fernández, R.; Díez, M.J.; Soler, S.; Valcárcel, J.V.; Martínez-Cuenca, M.-R. Phenotyping Local Eggplant Varieties: Commitment to Biodiversity and Nutritional Quality Preservation. Front. Plant Sci. 2021, 12, 1305. [Google Scholar] [CrossRef] [PubMed]
  24. Penella, C.; Nebauer, S.G.; Bautista, A.S.; López-Galarza, S.; Calatayud, Á. Rootstock alleviates PEG-induced water stress in grafted pepper seedlings: Physiological responses. J. Plant Physiol. 2014, 171, 842–851. [Google Scholar] [CrossRef] [PubMed]
  25. Maroto Borrego, J.V. Horticultura Herbácea Especial; Mundi-Prensa: Madrid, Spain, 2002. [Google Scholar]
  26. IVIA (Instituto Valenciano de Investigaciones Agrarias). Cálculo de Necesidades de Riego. Available online: http://riegos.ivia.es/calculo-de-necesidades-de-riego (accessed on 13 January 2021).
  27. International Plant Genetic Resources Institute. Descriptors for Capsicum (Capsicum spp.); International Plant Genetic Resources Institute: Rome, Italy, 1995. [Google Scholar]
  28. Nankar, A.N.; Kostova, D.; Tringovska, I.; Grozeva, S.; Ganeva, D. Tomato phenotypic diversity determined by combined approaches of conventional and high-throughput tomato analyzer phenotyping. Plants 2020, 9, 197. [Google Scholar] [CrossRef] [PubMed] [Green Version]
  29. Sudré, C.P.; Gonçalves, L.S.A.; Rodrigues, R.; Amaral Júnior, A.D.; Riva-Souza, E.M.; Bento, C.D.S. Genetic variability in domesticated Capsicum spp. as assessed by morphological and agronomic data in mixed statistical analysis. Genet. Mol. Res. 2010, 9, 283–294. [Google Scholar] [CrossRef]
  30. Bianchi, P.A.; da Silva, L.R.A.; Alencar, A.A.D.S.; Santos, P.H.A.D.; Pimenta, S.; Sudré, C.P.; Corte, L.E.-D.; Gonçalves, L.S.A.; Rodrigues, R. Biomorphological Characterization of Brazilian Capsicum Chinense Jacq. Germplasm. Agronomy 2020, 10, 447. [Google Scholar] [CrossRef] [Green Version]
  31. Do Rêgo, E.R.; do Rêgo, M.M.; Cruz, C.D.; Finger, F.L.; Casali, V.W.D. Phenotypic diversity, correlation and importance of variables for fruit quality and yield traits in Brazilian peppers (Capsicum baccatum). Genet. Resour. Crop Evol. 2010, 58, 909–918. [Google Scholar] [CrossRef]
  32. Dos Pessoa, A.M.; Rêgo, E.R.D.; de Carvalho, M.G.; Santos, C.A.P.; do Rêgo, M.M. Genetic diversity among accessions of Capsicum annuum L. Through morphoagronomic characters. Genet. Mol. Res. 2018, 17, gmr16039883. [Google Scholar] [CrossRef] [Green Version]
  33. Tsonev, S.; Todorova, V.; Groseva, S.; Popova, T.; Todorovska, E.G. Evaluation of diversity in Bulgarian pepper cultivars by agronomical traits and issr markers. Genetika 2017, 49, 647–662. [Google Scholar] [CrossRef]
  34. Rivera, A.; Mallor, C.; Garcés-Claver, A.; García-Ulloa, A.; Pomar, F.; Silvar, C. Assessing the genetic diversity in onion (Allium cepa L.) landraces from northwest Spain and comparison with the European variability. N. Z. J. Crop Hortic. Sci. 2016, 44, 103–120. [Google Scholar] [CrossRef]
  35. Cardoso, R.; Ruas, C.F.; Giacomin, R.M.; Ruas, P.M.; Ruas, E.A.; Barbieri, R.L.; Rodrigues, R.; Gonçalves, L.S.A. Genetic variability in Brazilian Capsicum baccatum germplasm collection assessed by morphological fruit traits and AFLP markers. PLoS ONE 2018, 13, e0196468. [Google Scholar] [CrossRef] [Green Version]
  36. Occhiuto, P.N.; Peralta, I.E.; Asprelli, P.D.; Galmarini, C.R. Characterization of Capsicum germplasm collected in northwestern Argentina based on morphological and quality traits. AgriScientia 2014, 31, 63–73. [Google Scholar] [CrossRef]
  37. Zewdie, Y.; Tong, N.; Bosland, P. Establishing a core collection of Capsicum using a cluster analysis with enlightened selection of accessions. Genet. Resour. Crop Evol. 2004, 51, 147–151. [Google Scholar] [CrossRef]
  38. Nankar, A.N.; Todorova, V.; Tringovska, I.; Pasev, G.; Radeva-Ivanova, V.; Ivanova, V.; Kostova, D. A step towards Balkan Capsicum annuum L. core collection: Phenotypic and biochemical characterization of 180 accessions for agronomic, fruit quality, and virus resistance traits. PLoS ONE 2020, 15, e0237741. [Google Scholar] [CrossRef] [PubMed]
  39. Nankar, A.N.; Tringovska, I.; Grozeva, S.; Todorova, V.; Kostova, D. Application of high-throughput phenotyping tool Tomato Analyzer to characterize Balkan Capsicum fruit diversity. Sci. Hortic. 2019, 260, 108862. [Google Scholar] [CrossRef]
  40. Yada, B.; Tukamuhabwa, P.; Alajo, A.; Mwanga, R.O. Morphological Characterization of Ugandan Sweetpotato Germplasm. Crop Sci. 2010, 50, 2364–2371. [Google Scholar] [CrossRef]
  41. Cericola, F.; Portis, E.; Toppino, L.; Barchi, L.; Acciarri, N.; Ciriaci, T.; Sala, T.; Rotino, G.L.; Lanteri, S. The Population Structure and Diversity of Eggplant from Asia and the Mediterranean Basin. PLoS ONE 2013, 8, e73702. [Google Scholar] [CrossRef] [Green Version]
  42. Tembe, K.O.; Chemining’wa, G.; Ambuko, J.; Owino, W. Evaluation of African tomato landraces (Solanum lycopersicum) based on morphological and horticultural traits. Agric. Nat. Resour. 2018, 52, 536–542. [Google Scholar] [CrossRef]
  43. Grozeva, S.; Nankar, A.N.; Ganeva, D.; Tringovska, I.; Pasev, G.; Kostova, D. Characterization of tomato accessions for morphological, agronomic, fruit quality, and virus resistance traits. Can. J. Plant Sci. 2021, 101, 476–489. [Google Scholar] [CrossRef]
  44. Wasonga, D.O.; Ambuko, J.L.; Cheminingwa, G.N.; Odeny, D.A.; Crampton, B.G. Morphological Characterization and Selection of Spider Plant:Accessions from Kenya and South Africa. Asian J. Agric. Sci. 2015, 7, 36–44. [Google Scholar] [CrossRef]
  45. Baba, V.Y.; Rocha, K.R.; Gomes, G.P.; de Fátima Ruas, C.; Ruas, P.M.; Rodrigues, R.; Gonçalves, L.S.A. Genetic diversity of Capsicum chinense accessions based on fruit morphological characterization and AFLP markers. Genet. Resour. Crop Evol. 2015, 63, 1371–1381. [Google Scholar] [CrossRef]
  46. Moreira, A.F.P.; Ruas, P.M.; de Fátima Ruas, C.; Baba, V.Y.; Giordani, W.; Arruda, I.M.; Rodrigues, R.; Gonçalves, L.S.A. Genetic diversity, population structure and genetic parameters of fruit traits in Capsicum chinense. Sci. Hortic. 2018, 236, 1–9. [Google Scholar] [CrossRef]
  47. Lahbib, K. Genetic diversity evaluation of pepper (Capsicum annuum L.) in Tunisia based on morphologic characters. Afr. J. Agric. Res. 2012, 7, 3413–3417. [Google Scholar] [CrossRef]
  48. Finger, F.; Lannes, S.; Schuelter, A.; Doege, J.; Comerlato, A.; Gonçalves, L.; Ferreira, F.; Clovis, L.; Scapim, C. Genetic diversity of Capsicum chinensis (Solanaceae) accessions based on molecular markers and morphological and agronomic traits. Genet. Mol. Res. 2010, 9, 1852–1864. [Google Scholar] [CrossRef]
  49. López-Sesé, A.I.; Staub, J.; Katzir, N.; Gómez-Guillamón, M.L. Estimation of between and within accession variation in selected Spanish melon germplasm using RAPD and SSR markers to assess strategies for large collection evaluation. Euphytica 2002, 127, 41–51. [Google Scholar] [CrossRef]
  50. Toklu, F.; Tuba Biçer, B.; Karaköy, T. Agro-morphological characterization of the Turkish lentil landraces. Afr. J. Biotechnol. 2009, 8, 4121–4127. [Google Scholar] [CrossRef]
  51. Muller, M.H.; Délieux, F.; Fernández-Martínez, J.M.; Garric, B.; Lecomte, V.; Anglade, G.; Leflon, M.; Motard, C.; Segura, R. Occurrence, distribution and distinctive morphological traits of weedy Helianthus annuus L. populations in Spain and France. Genet. Resour. Crop Evol. 2009, 56, 869–877. [Google Scholar] [CrossRef]
  52. Bhargava, A.; Shukla, S.; Ohri, D. Genetic variability and interrelationship among various morphological and quality traits in quinoa (Chenopodium quinoa Willd.). Field Crop. Res. 2007, 101, 104–116. [Google Scholar] [CrossRef]
  53. Panthee, R.B.; Regmi, H.N.; Subedi, P.P.; Bhattarai, S.; Dhakal, J. Diversity Analysis of Garlic (Allium sativum L.) Germplasms Available in Nepal Based on Morphological Characters. Genet. Resour. Crop Evol. 2006, 53, 205–212. [Google Scholar] [CrossRef]
  54. Prohens, J.; Blanca, J.M.; Nuez, F. Morphological and molecular variation in a collection of eggplants from a secondary center of diversity: Implications for conservation and breeding. J. Am. Soc. Hortic. Sci. 2005, 130, 54–63. [Google Scholar] [CrossRef] [Green Version]
  55. Tümbilen, Y.; Frary, A.; Mutlu, S.; Doganlar, S. Genetic diversity in Turkish eggplant (Solanum melongena) varieties as determined by morphological and molecular analyses. Int. Res. J. Biotechnol. 2001, 2, 16–25. [Google Scholar]
  56. Paran, I.; van der Knaap, E. Genetic and molecular regulation of fruit and plant domestication traits in tomato and pepper. J. Exp. Bot. 2007, 58, 3841–3852. [Google Scholar] [CrossRef] [PubMed] [Green Version]
  57. Meyer, R.S.; Purugganan, M.D. Evolution of crop species: Genetics of domestication and diversification. Nat. Rev. Genet. 2013, 14, 840–852. [Google Scholar] [CrossRef] [PubMed]
  58. Domenico, C.I.; Coutinho, J.P.; Godoy, H.T.; de Melo, A.M. Caracterização agronômica e pungência em pimenta de cheiro. Hortic. Bras. 2012, 30, 466–472. [Google Scholar] [CrossRef] [Green Version]
  59. Silva, C.Q.; Jasmim, J.M.; Santos, J.O.; Bento, C.S.; Sudré, C.P.; Rodrigues, R. Fenotipagem e seleção de genitores em acessos de pimentas para fins ornamentais. Hortic. Bras. 2015, 33, 66–73. [Google Scholar] [CrossRef] [Green Version]
  60. Bento, C.S. Descritores qualitativos e multicategóricos na estimativa da variabilidade fenotípica entre acessos de pimentas. Sci. Agrar. 2014, 8, 147–154. [Google Scholar] [CrossRef]
  61. Gisbert-Mullor, R.; Ceccanti, C.; Padilla, Y.G.; López-Galarza, S.; Calatayud, Á.; Conte, G.; Guidi, L. Effect of Grafting on the Production, Physico-Chemical Characteristics and Nutritional Quality of Fruit from Pepper Landraces. Antioxidants 2020, 9, 501. [Google Scholar] [CrossRef]
  62. Lannes, S.D.; Finger, F.L.; Schuelter, A.R.; Casali, V.W.D. Growth and quality of Brazilian accessions of Capsicum chinense fruits. Sci. Hortic. 2007, 112, 266–270. [Google Scholar] [CrossRef]
  63. Suzuki, T.; Iwai, K. Chapter 4 Constituents of Red Pepper Species: Chemistry, Biochemistry, Pharmacology, and food Science of the Pungent Principle of Capsicum Species. Alkaloids Chem. Pharmacol. 1984, 23, 227–299. [Google Scholar] [CrossRef]
  64. Ferrão, L.F.V.; Cecon, P.R.; Finger, F.L.; e Silva, F.F.; Puiatti, M. Divergência genética entre genótipos de pimenta com base em caracteres morfo-agrônomicos. Hortic. Bras. 2011, 29, 354–358. [Google Scholar] [CrossRef]
  65. Melo, L.F.; Gomes, R.L.F.; da Silva, V.B.; Monteiro, E.R.; Lopes, Â.C.A.; Peron, A.P. Potencial ornamental de acessos de pimenta. Ciência Rural 2014, 44, 2010–2015. [Google Scholar] [CrossRef]
  66. De, A.K. Capsicum. The Genus Capsicum; CRC Press: London, UK, 2003. [Google Scholar]
  67. Malone, M.; Andrews, J. The distribution of xylem hydraulic resistance in the fruiting truss of tomato. Plant Cell Environ. 2001, 24, 565–570. [Google Scholar] [CrossRef]
  68. Tyerman, S.D.; Tilbrook, J.; Pardo, C.; Kotula, L.; Sullivan, W.; Steudle, E. Direct measurement of hydraulic properties in developing berries of Vitis vinifera L. cv Shiraz and Chardonnay. Aust. J. Grape Wine Res. 2004, 10, 170–181. [Google Scholar] [CrossRef]
  69. Trifilò, P.; Raimondo, F.; Lo Gullo, M.A.; Nardini, A.; Salleo, S. Hydraulic connections of leaves and fruit to the parent plant in Capsicum frutescens (hot pepper) during fruit ripening. Ann. Bot. 2010, 106, 333. [Google Scholar] [CrossRef] [PubMed]
  70. Ben-Chaim, A.; Paran, I. Genetic analysis of quantitative traits in pepper (Capsicum annuum). J. Am. Soc. Hortic. Sci. 2000, 125, 66–70. [Google Scholar] [CrossRef]
  71. Poulos, J.M. Pepper breeding (Capsicum spp.): Achievements, challenges and possibilities. Plant Breed. Abstr. 1994, 64, 143–155. [Google Scholar]
  72. Fonseca, R.M.; Lopes, R.; Barros, W.S.; Lopes, M.T.G.; Ferreira, F.M. Morphologic characterization and genetic diversity of Capsicum chinense Jacq. accessions along the upper Rio Negro-Amazonas. Crop Breed. Appl. Biotechnol. 2008, 8, 187–194. [Google Scholar] [CrossRef]
  73. Munchi, A.D.; Behera, T.K. Correlation and path coefficient analysis in chilli. Indian J. Hortic. Res. 2000, 11, 93–97. [Google Scholar]
  74. Do Rêgo, E.R.; do Rêgo, M.M.; de Matos, I.W.F.; Barbosa, L.A. Caracterização morfológica e química de frutos de acessos do gênero Capsicum spp. Hortic. Bras. 2011, 29, 364–371. [Google Scholar] [CrossRef] [Green Version]
  75. Do Rêgo, E.R.; do Rêgo, M.M.; Finger, F.L.; Cruz, C.D.; Casali, V.W.D. A diallel study of yield components and fruit quality in chilli pepper (Capsicum baccatum). Euphytica 2009, 168, 275–287. [Google Scholar] [CrossRef]
  76. De Carvalho, É.B.; Vitolo, M.R.; Gama, C.M.; Lopez, F.A.; Taddei, J.A.C.; de Morais, M.B. Fiber intake, constipation, and overweight among adolescents living in Sao Paulo City. Nutrition 2006, 22, 744–749. [Google Scholar] [CrossRef]
  77. Barroso, P.A.; Rêgo, E.R.; Rêgo, M.M.; Nascimento, K.S.; Nascimento, N.F.F.; Nascimento, M.F.; Soares, W.S.; Ferreira, K.T.C.; Otoni, W.C. Analysis of segregating generation for components of seedling and plant height of pepper (Capsicum annuum L.) for medicinal and ornamental purposes. Acta Hortic. 2012, 953, 269–276. [Google Scholar] [CrossRef]
  78. Kumar, S.R.; Arumugam, T.; Ulaganathan, V.; Kumar, S.R. Genetic diversity in eggplant germplasm by principal component analysis. J. Breed. Genet. 2016, 48, 162–171. [Google Scholar]
  79. Ferreira, K.T.C.; Rêgo, E.R.; Rêgo, M.M.; Fortunato, F.L.G.; Nascimento, N.F.F.; De Lima, J.A.M. Combining ability for morpho-agronomic traits in ornamental pepper. Acta Hortic. 2015, 1087, 187–194. [Google Scholar] [CrossRef]
  80. Do Rêgo, E.R.; Nascimento, M.F.; do Nascimento, N.F.F.; dos Santos, R.M.C.; Fortunato, F.L.G.; do Rêgo, M.M. Comparação de métodos para a produção de frutos autofecundados em pimenteiras ornamentais. Hortic. Bras. 2012, 30, 669–672. [Google Scholar] [CrossRef] [Green Version]
Figure 1. Pepper fruit from the 17 pepper landraces in two different ripening stages: immature: green; mature: red. The surface of each section making up the grid on which photos were taken equals 1 cm2.
Agronomy 12 00632 g001
Figure 2. Frequency distribution of the plant, stem, and leaf qualitative traits in 17 pepper landraces.(A) Plant growth habit; (B) Plant height; (C) Branch density; (D) Stem shape; (E) Stem colour; (F) Anthocyanin colour in the node; (G) Leaf shape; (H) Leaf colour. The mean value for each landrace was represented by the most frequent representation of the trait after classifying the independent plant samples (n = 8) according to the scale (Table S1).
Agronomy 12 00632 g002
Figure 3. Frequency distribution of the flower qualitative traits in the 17 pepper landraces. (A) Flower position; (B) Calyx margin; (C) Filament colour; (D) Anther colour; (E) Stigma insertion; (F) Calyx pigmentation; (G) Corolla colour. The mean value for each landrace was represented by the most frequent representation of the trait after classifying the independent plant samples (n = 8) according to the scale (Table S1).
Agronomy 12 00632 g003
Figure 4. Morphological ((A): length; (B): width; (C): pedicel length) traits of the fruit of the 17 pepper landraces in two ripening stages. Values are the mean ± SD of n = 10 fruit. Asterisks indicate significant differences of the red fruit to the green fruit for each landrace (p < 0.05).
Agronomy 12 00632 g004
Figure 5. Biomass traits ((A): pericarp thickness; (B): fresh weight; (C): dry weight) of the fruit of the 17 pepper landraces in two ripening stages. Values are the mean ± SD of n = 10 fruit. Asterisks indicate significant differences of the red fruit to the green fruit for each landrace (p < 0.05).
Agronomy 12 00632 g005
Figure 6. Frequency distribution of the selected fruit qualitative traits in the 17 pepper landraces in two ripening stages (green and red); (A) fruit attitude, (B) skin brightness, (C) shape at the junction with the pedicel, (D) cross wrinkle. The mean value for each landrace was represented by the most frequent representation of the trait after classifying the independent fruit samples (n = 10) according to the scale (Table S1).
Agronomy 12 00632 g006
Figure 7. Frequency distribution of the selected fruit qualitative traits in the 17 pepper landraces in two ripening stages (green and red); (A) pericarp sinuosity, (B) persistence pedicel with fruit, (C) apical rot, (D) cracked. The mean value for each landrace was represented by the most frequent representation of the trait after classifying the independent fruit samples (n = 10) according to the scale (Table S1).
Agronomy 12 00632 g007
Figure 8. Similarities among the pepper fruits belonging to the 17 evaluated pepper landraces based on the traits used for phenotyping represented in the two first components (first component, x-axis; second component, y-axis) of the principal components analysis (21.62% and 12.73% of total variation, respectively). Groups, arranged mainly according to fruit morphology (G1 = thin and elongated, G2 = thick and robust), are represented and rounded in plots G1 (green) and G2 (blue). Ungrouped P-49 (pink) is also expressed in the figure. Light blue arrows represent the eight strongest traits that contribute the most to total diversity among landraces, extracted from a previous feature plot performed with all the traits in the assay (data not shown).
Agronomy 12 00632 g008
Figure 9. Correlation network discerning the relation among 13 quantitative traits. Correlations between traits are illustrated using different gradient colors of blue and red to discern positive and negative correlations, respectively. The color intensity of the lines connecting traits explains the correlation robustness while Pl: plant, S: stem, L: leaf, Fl: flower, Fr: fruit, FW: fresh weight, DW: dry weight.
Agronomy 12 00632 g009
Table 1. Abbreviation, germplasm collection code, group (based mainly on fruit characteristics obtained in the actual study, G1 = elongated; G2 = triangular, square or blocky; “-” = non-grouped), fruit shape description, and origin of the 17 varieties of pepper used in the study. Plant material was provided by: (1) the Valencian Institute for the Conservation and Improvement of Agrobiodiversity (COMAV, Spain) and (2) the Valencian Institute for Agricultural Research (IVIA, Spain). (3) Town, province, country.
Abbreviation CodeGermplasm CodeGroupFruit DescriptionOrigin/Cultivated Zone (3)Intended Use (Consumption)
P-35BGV005087 (1)G2Rectangular shape, blocky and with four shoulders and locule markedFanzara, Castellón, SpainRoasted, preferably when mature (red)
P-36BGV005035 (1)G2Irregular, rectangular-conical shape, but an inconsistent pattern, slightly marked shouldersChelva, Valencia, SpainRoasted
P-37BGV005097 (1)G2Triangular shape and apex truncatedCastillo de Villamalefa, Castellón, SpainRoasted, preferably when mature (red)
P-39BGV005115 (1)G2Triangular shape and apex truncatedAlicante, SpainRoasted, preferably when mature (red)
P-40BGV005125 (1)G2Rounded- elongated triangular shape and apex truncatedElda, Alicante, SpainRoasted, preferably when mature (red)
P-41BGV014141 (1)G1Elongated (horn type), only slightly marked shouldersVinaroz, Castellón, SpainFried, preferably when immature (green)
P-42BGV014145 (1)G1Elongated (horn type), only slightly marked shouldersAlmenara, Castellón, SpainFried, preferably when immature (green)
P-44BGV016188 (1)G1Elongated (horn type), only slightly marked shouldersGuardamar del Segura, Alicante, SpainFried, preferably when immature (green)
P-45BGV005064 (1)G2Triangular shape and apex truncatedAdemuz, Valencia, SpainRoasted, preferably when mature (red)
P-46BGV005085 (1)G2Rectangular shape, blocky and with four shoulders and locule markedOnda, Castellón, SpainRoasted
P-47BGV005040 (1)G2Rounded-elongated triangular shape and apex truncatedSiete Aguas, Valencia, SpainRoasted
P-48BGV005034 (1)G1Elongated (horn type), only slightly marked shouldersChelva, Valencia, SpainFried, preferably when immature (green)
P-49BGV005046 (1)-Ball-like shape with only slightly marked shouldersBenissa, Alicante, SpainRoasted, preferably when mature (red)
P-50BGV005116 (1)G2Triangular shape and apex truncatedRojales, Alicante, SpainRoasted
P-51BGV014553 (1)G2Rectangular shape, blocky and with four shoulders and locule markedTales, Castellón, SpainRoasted
P-70IVIA 70 (2)G2Rounded- elongated triangular shape and apex truncatedMoncada, Valencia, SpainRoasted, preferably when immature (green)
P-72IVIA 72 (2)G1Elongated (horn type), only slightly marked shouldersCanal de Navarrés, Valencia, SpainFried, preferably when immature (green)
Table 2. Quantitative traits for conventional morphologic descriptors in plant, leaf, and flower of 17 local pepper landraces cultivated in Spain. Statistics were performed by the formed groups based on fruit shape; G1 = elongated; G2 = triangular, square or blocky. Data belonging to the outlier ungrouped landrace (-, P-49 landrace) are also shown. For each landrace, values represent the mean for the studied conventional morphological descriptors (n = 8). Different letters in a group indicate significant differences at p ≤ 0.05 (LSD test). L: length; W: width; FW: fresh weight; DW: dry weight.
GroupLandraceStem L to 1st Bifurcation (cm)Stem Diameter
(mm)
Plant W
(cm)
Leaf L
(cm)
Leaf W
(cm)
Flowers Per Axile
G1P-4122.4c15.7 64.8ab16.7c9.2 1.00
P-4228.9b15.6 61.6b19.1ab10.2 1.00
P-4433.9a14.4 61.4b20.1a10.2 1.00
P-4821.9c15.3 68.1a17.0bc9.5 1.00
P-7232.3ab14.6 68.3ab18.3abc9.9 1.00
G2P-3531.4b15.6bc65.6abc16.7f10.1d1.28b
P-3630.0bc15.2bcd66.6ab19.3de10.3d1.00c
P-3723.3ef15.1bcd69.3a19.3de10.6cd2.00a
P-3928.4bcd16.0bc50.3e22.9ab11.7bc1.00c
P-4043.0a14.5cd64.4abcd23.2a14.8a1.00c
P-4529.9bc16.6b71.0a21.7abc12.7b2.29a
P-4622.1f14.0d70.4a20.2cd11.8b1.50b
P-4730.9b16.2bc54.3de20.9bcd12.7b1.37b
P-5030.1bc25.4a55.9cde17.9ef10.1d1.25bc
P-5126.6cde15.2bcd69.9a20.8bcd11.7bc1.00c
P-7024.5def15.2bcd57.1bcde19.3de10.1d1.00c
-P-4933.9 15.7 59.7 21.0 12.4 1.00
Table 3. Quantitative traits for conventional morphologic descriptors in green fruits of the 17 local pepper landraces cultivated in Spain. Statistics were performed by the formed groups based on fruit shape; G1 = elongated; G2 = triangular, square or blocky. Data belonging to the outlier ungrouped landrace (-, P-49 landrace) are also shown. For each landrace, values represent the mean for the studied conventional morphological descriptors (n = 10). Different letters in a group indicate significant differences at p ≤ 0.05 (LSD test). L: length; W: width; FW: fresh weight; DW: dry weight.
GroupLandraceLength
(cm)
Width
(cm)
L/WPedicel L
(cm)
Wall
Thickness
(mm)
Locule
Number
FW
(g)
DW
(%)
G1P-4120.3a3.2c6.4a6.6a3.0b2.5b84.9bc6.7bc
P-4216.5b2.9c6.4a5.3b2.1c2.8b89.0ab5.8d
P-4418.2ab2.8c6.5a4.3c3.2b3.5a71.2c7.0b
P-4816.5b3.9b4.4b4.4c2.8b3.0ab74.6bc8.5a
P-7218.0ab5.3a3.5b4.4c4.3a2.6b100.9ab6.3c
G2P-3512.6bc5.8f2.4b4.1cde4.3d3.5bc135.6bc6.1bc
P-368.6e6.5def1.4de4.7bc4.3d3.0d159.4ab6.2b
P-3712.0cd7.3bc1.5cd4.1de4.5cd3.0cd107.6e6.2b
P-3914.8a6.1f2.3b4.2cde4.3cd3.5bcd145.7abc6.8a
P-4015.0a5.8f2.7a6.1a4.2d3.8ab131.8cd5.8bcd
P-4510.3d9.1a1.1e5.2b5.3ab4.0a157.6abc5.8bcd
P-466.3f5.9f1.1e4.2cd4.4cd3.8a172.8a5.5d
P-4710.1d7.1cd1.5cd4.7bcd5.0abc4.0a134.3bcd5.7cd
P-5013.7ab6.1ef2.3b4.3cd5.0bcd3.0d135.1bc5.9bcd
P-5110.1d6.9cde1.5cd2.5f4.6cd3.5b139.1bc5.5d
P-7013.2bc8.0b1.7c3.5e5.6a3.5b143.4bc5.5d
-P-496.1 7.0 0.9 4.0 7.1 2.8 124.7 6.3
Table 4. Quantitative traits for conventional morphologic descriptors in red fruit of the 17 local pepper landraces cultivated in Spain. Statistics were performed by the formed groups based on fruit shape; G1 = elongated; G2 = triangular, square or blocky. Data belonging to the outlier ungrouped landrace (-, P-49 landrace) are also shown. For each landrace, values represent the mean for the studied conventional morphological descriptors (n = 10 for fruit traits). Different letters in a group indicate significant differences at p ≤ 0.05 (LSD test). L: length; W: width; FW: fresh weight; DW: dry weight.
GroupLandraceL
(cm)
W
(cm)
L/WPedicel L
(cm)
Wall
Thickness
(mm)
Locule
number
FW
(g)
DW
(%)
G1P-4120.9a3.7b5.9a3.8b3.1a2.7b96.7a9.8c
P-4223.0ab4.7a5.0ab4.4a3.5a3.4a100.8a8.8bc
P-4416.2a3.0b5.5a4.2ab2.5b2.9ab62.7bc10.8b
P-4813.2b3.2b4.5b2.8c2.7b3.4a59.1c13.8a
P-7216.6ab3.0b5.1ab4.7a3.3a2.6b84.6ab9.8bc
G2P-359.7d7.0bc1.4e3.4bc4.8cde3.6a95.9c9.4bcde
P-3611.3abcd5.3d2.0bc3.9ab3.6g3.4a122.0ab10.2abc
P-3711.7ab7.6bc1.5de3.3bcd4.1efg3.3a107.9bc10.8ab
P-399.5cd5.5d1.8cd3.9ab4.0defg3.8a110.2abc11.2a
P-409.6d5.6d1.8c2.8d4.7cde3.7a118.0abc10.7ab
P-4511.6ab8.2a1.4e4.2a8.7b3.6a136.3a9.6abcd
P-4610.4bcd7.8ab1.4ef3.4bc4.3def3.7a135.2a8.3de
P-4712.6a5.5d2.3a4.2a4.8cd3.6a100.1bc9.5abcde
P-5011.7abc6.4cd1.8c3.9ab9.8a3.3a115.4abc8.4cde
P-519.6d8.4a1.1f3.1cd5.2c3.4a113.3abc8.7cde
P-7012.7a5.7d2.3ab4.2a3.9fg3.3a97.9c7.6e
-P-495.7 6.7 0.9 3.2 8.2 3.3 86.1 10.9
Table 5. Productivity parameter number of fruits per plant (n = 4) in the collection of the 17 pepper landraces cultivated in Spain.
GroupLandraceNumber Plant−1
G1P-4122.3
P-4224.3
P-4410.5
P-4819.8
P-7211.0
Mean17.6
G2P-358.50
P-3616.00
P-3721.75
P-3911.75
P-4015.25
P-4516.00
P-4611.25
P-4713.75
P-5012.25
P-5117.00
P-7012.25
Mean14.2
-P-4910.3
Publisher’s Note: MDPI stays neutral with regard to jurisdictional claims in published maps and institutional affiliations.

