Article

Surface Soil Moisture Retrieval Using Sentinel-1 SAR Data for Crop Planning in Kosi River Basin of North Bihar

Department of Geoinformatics, School of Natural Resource Management, Central University of Jharkhand, Ranchi 835222, India
*
Author to whom correspondence should be addressed.
Agronomy 2022, 12(5), 1045; https://doi.org/10.3390/agronomy12051045
Submission received: 11 March 2022 / Revised: 19 April 2022 / Accepted: 26 April 2022 / Published: 27 April 2022

Abstract

:
Surface Soil Moisture (SSM) is a key factor for understanding the physical process between the land surface and atmosphere. With the advancement of Synthetic Aperture Radar (SAR) technology and backscattering models, retrieval of SSM over the land surface at higher spatial resolution became effective and accurate. This study examines the potential of C-band Sentinel-1 SAR data to derive SSM in a dry season (February 2020) over bare soil and vegetated agricultural fields in the Kosi River Basin (KRB) in North Bihar. Field campaigns were conducted simultaneously with Sentinel–1A acquisition date, and measurements comprised 54 in-situ sampling plots for the top of the soil (0–7.6 cm depth) using time-domain reflectometry (TDR–300). The modified Dubois model was employed to estimate relative soil permittivity from the backscatter values (σ°) of VV polarization. With the help of Topp’s model, volumetric SSM (m3/m3) was derived for all areas with normalized difference vegetation index (NDVI) less than 0.4 that majorly covered bare land or sparse vegetation. The key findings demonstrated that model-derived SSM was well correlated with the in-situ SSM with the coefficient of determination (R2) of 0.77 and root mean square error (RMSE) of 0.06 m3/m3. The spatial distribution of SSM ranged from 0.05 to 0.5 m3/m3 over the KRB, and the highest moisture was found in the Kosi Megafan. The modified Dubois model was effective in providing SSM from Sentinel–1A data in bare soil and agricultural fields and, thus, supporting use in hydrological, meteorological and crop planning applications.

1. Introduction

Surface soil moisture (SSM) plays a significant role in the hydrological cycle for connecting water and energy exchanges between the land surface and atmosphere. It is also a key input for various land surface applications, such as agronomy, ecology, hydrology, meteorology, and climatology, including drought and flood forecasting [1,2,3,4,5]. With high temporal variations of SSM over space, retrieval of reliable soil moisture information from in-situ measurements over large areas is challenging. These ground-based SSM measurements are often time-consuming and not effective since it provides only point-based SSM information. Therefore, retrieval of accurate spatial SSM is crucial from local to global scales [6] and potentially can be achieved using space-borne technologies [7] and smart sensors [8].
Remote sensing techniques have been employed to retrieve SSM over different geographical setups, which mostly used optical [9,10,11] and microwave sensors [12,13] along with the in-situ measurements. There are readily available SSM products, such as Soil Moisture and Ocean Salinity (SMOS) and Soil Moisture Active Passive (SMAP), available for numerous applications [14,15]. However, these products have a coarser spatial resolution (approx. 40 km), making them unsuitable for crop planning at the field scale. Numerous studies based on Synthetic Aperture Radar (SAR) have been introduced to retrieve SSM at a finer scale [16,17,18,19]. However, retrieving SSM in the presence of vegetation (i.e., sparse and dense cover) using SAR data is challenging owing to volume scattering, leaf moisture content as well as underlying soil surface scattering [20,21]. Previously, many studies have deployed SAR-based X, C, and L-bands to retrieve SSM over different types of surface cover, such as bare land, agricultural fields, and sparsely vegetated surface [4,22,23]. Among these bands, L-band is effective because of its penetration capabilities [24]; however, L-band is usually not readily available due to limited sensors and their global coverage, which are also not available free of cost. Consequently, after the Launch of the Sentinel-1A (C-band) satellite, numerous studies were attempted to retrieve SSM and applied in water management processes, such as irrigation scheduling [13] and crop growth monitoring [4,24]. Besides SAR-bands, the backscattering of radar signals for SSM depends on incidence angle, which means the sensitivity of radar signals is high at lower incidence angles [25,26]. The radar backscattering coefficient also depends on other target factors, such as surface roughness, dielectric constant, vegetation cover, soil types, and topography [27,28]. The soil’s dielectric constant strongly influences the radar backscattering coefficient (σ°) that increases with increasing SSM [29].
Various physical [29], empirical [30,31], or even semi-empirical models [32,33,34] have been developed to retrieve SSM over bare soil or sparse vegetation. Over sparse to densely vegetated surfaces, Water Cloud Model (WCM) is generally used. WCM modelizes the radar signal as a sum of vegetation contribution and soil contribution attenuated by the vegetation cover and the underneath surface [35,36,37]. The WCM model simulates the backscattered coefficient using HH or VV polarization as a function of soil properties (i.e., soil moisture and surface roughness) and vegetation descriptors (i.e., plant height, leaf area index (LAI), vegetation water content, and normalized difference vegetation index (NDVI)) [38]. Studies have indicated that under high vegetation cover, the modified WCM can be applied for deriving SSM [4,20,39] with crop LAI between 3 and 6 [18]. By contrast, the theoretical model called Integral Equation Model (IEM) typically demands a large number of parameters [40]. The empirical models are simple because they need a minimum number of input parameters but have some limitations due to site-specific factors [41,42]. Moreover, machine learning methods, such as random forest (RF), support vector machine (SVM), and neural network, were employed for retrieving SSM over different crops [43,44]. Using in-situ measurements, most of those studies demonstrated that VV polarization was more effective than that of the VH for modeling SSM. Change detection method [45,46] and a Bayesian merging method [47] have also been deployed to estimate SSM, which combines passive microwave and SAR data.
Various backscattering models have been formulated over the years, such as physical, empirical, and semi-empirical. However, the progress realized by these soil backscatter models and large-scale mapping of SSM over time and space has not yet been fully fledged. Dubois model showed a low correlation with real data and the model was modified to provide a better estimate of SSM over the bare soils and sparsely vegetated surfaces by incorporating in-situ measurements and field settings. The objective of this study is to retrieve SSM at high spatial resolution using C-band Sentinel-1A SAR data with the help of an empirical model (i.e., Dubois model) over bare soil and sparsely vegetated surface (i.e., agricultural fields) along with the in-situ measurements. This study would offer a useful tool for mapping soil moisture effectively at a local to regional scale by using high spatial and temporal resolutions (10 m at 12-day intervals) of Sentinel-1A images.

2. Materials and Methods

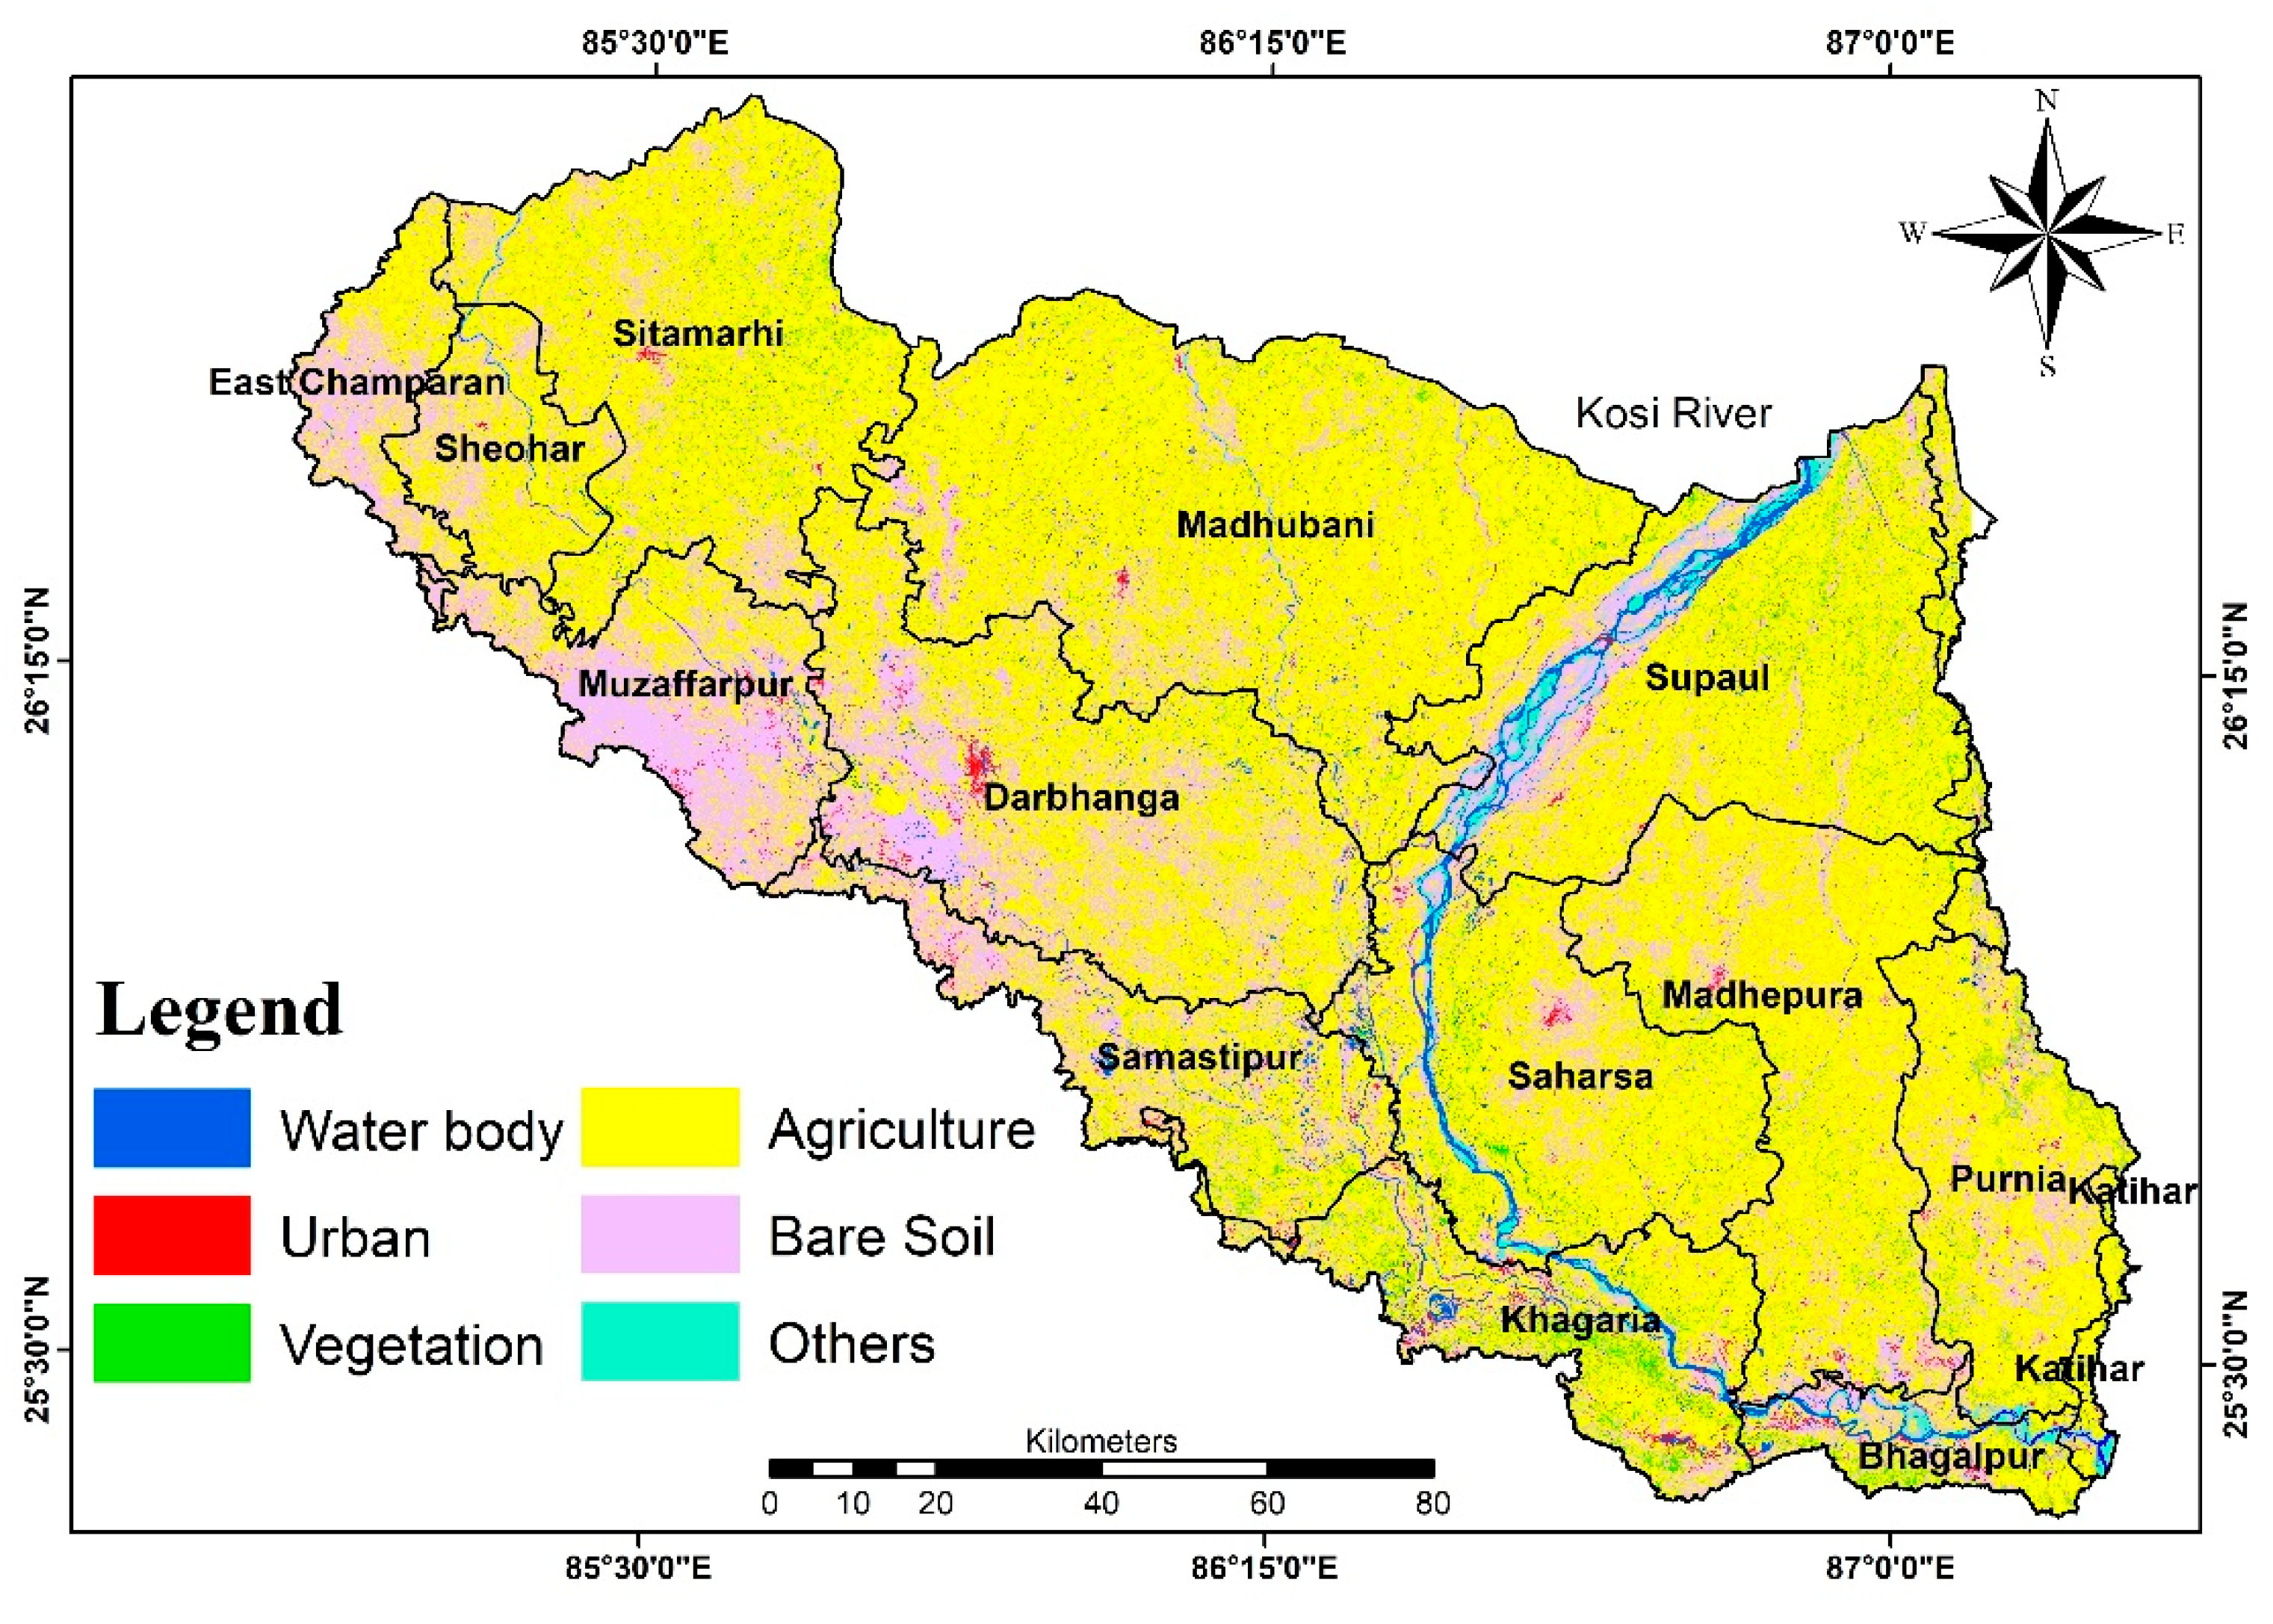
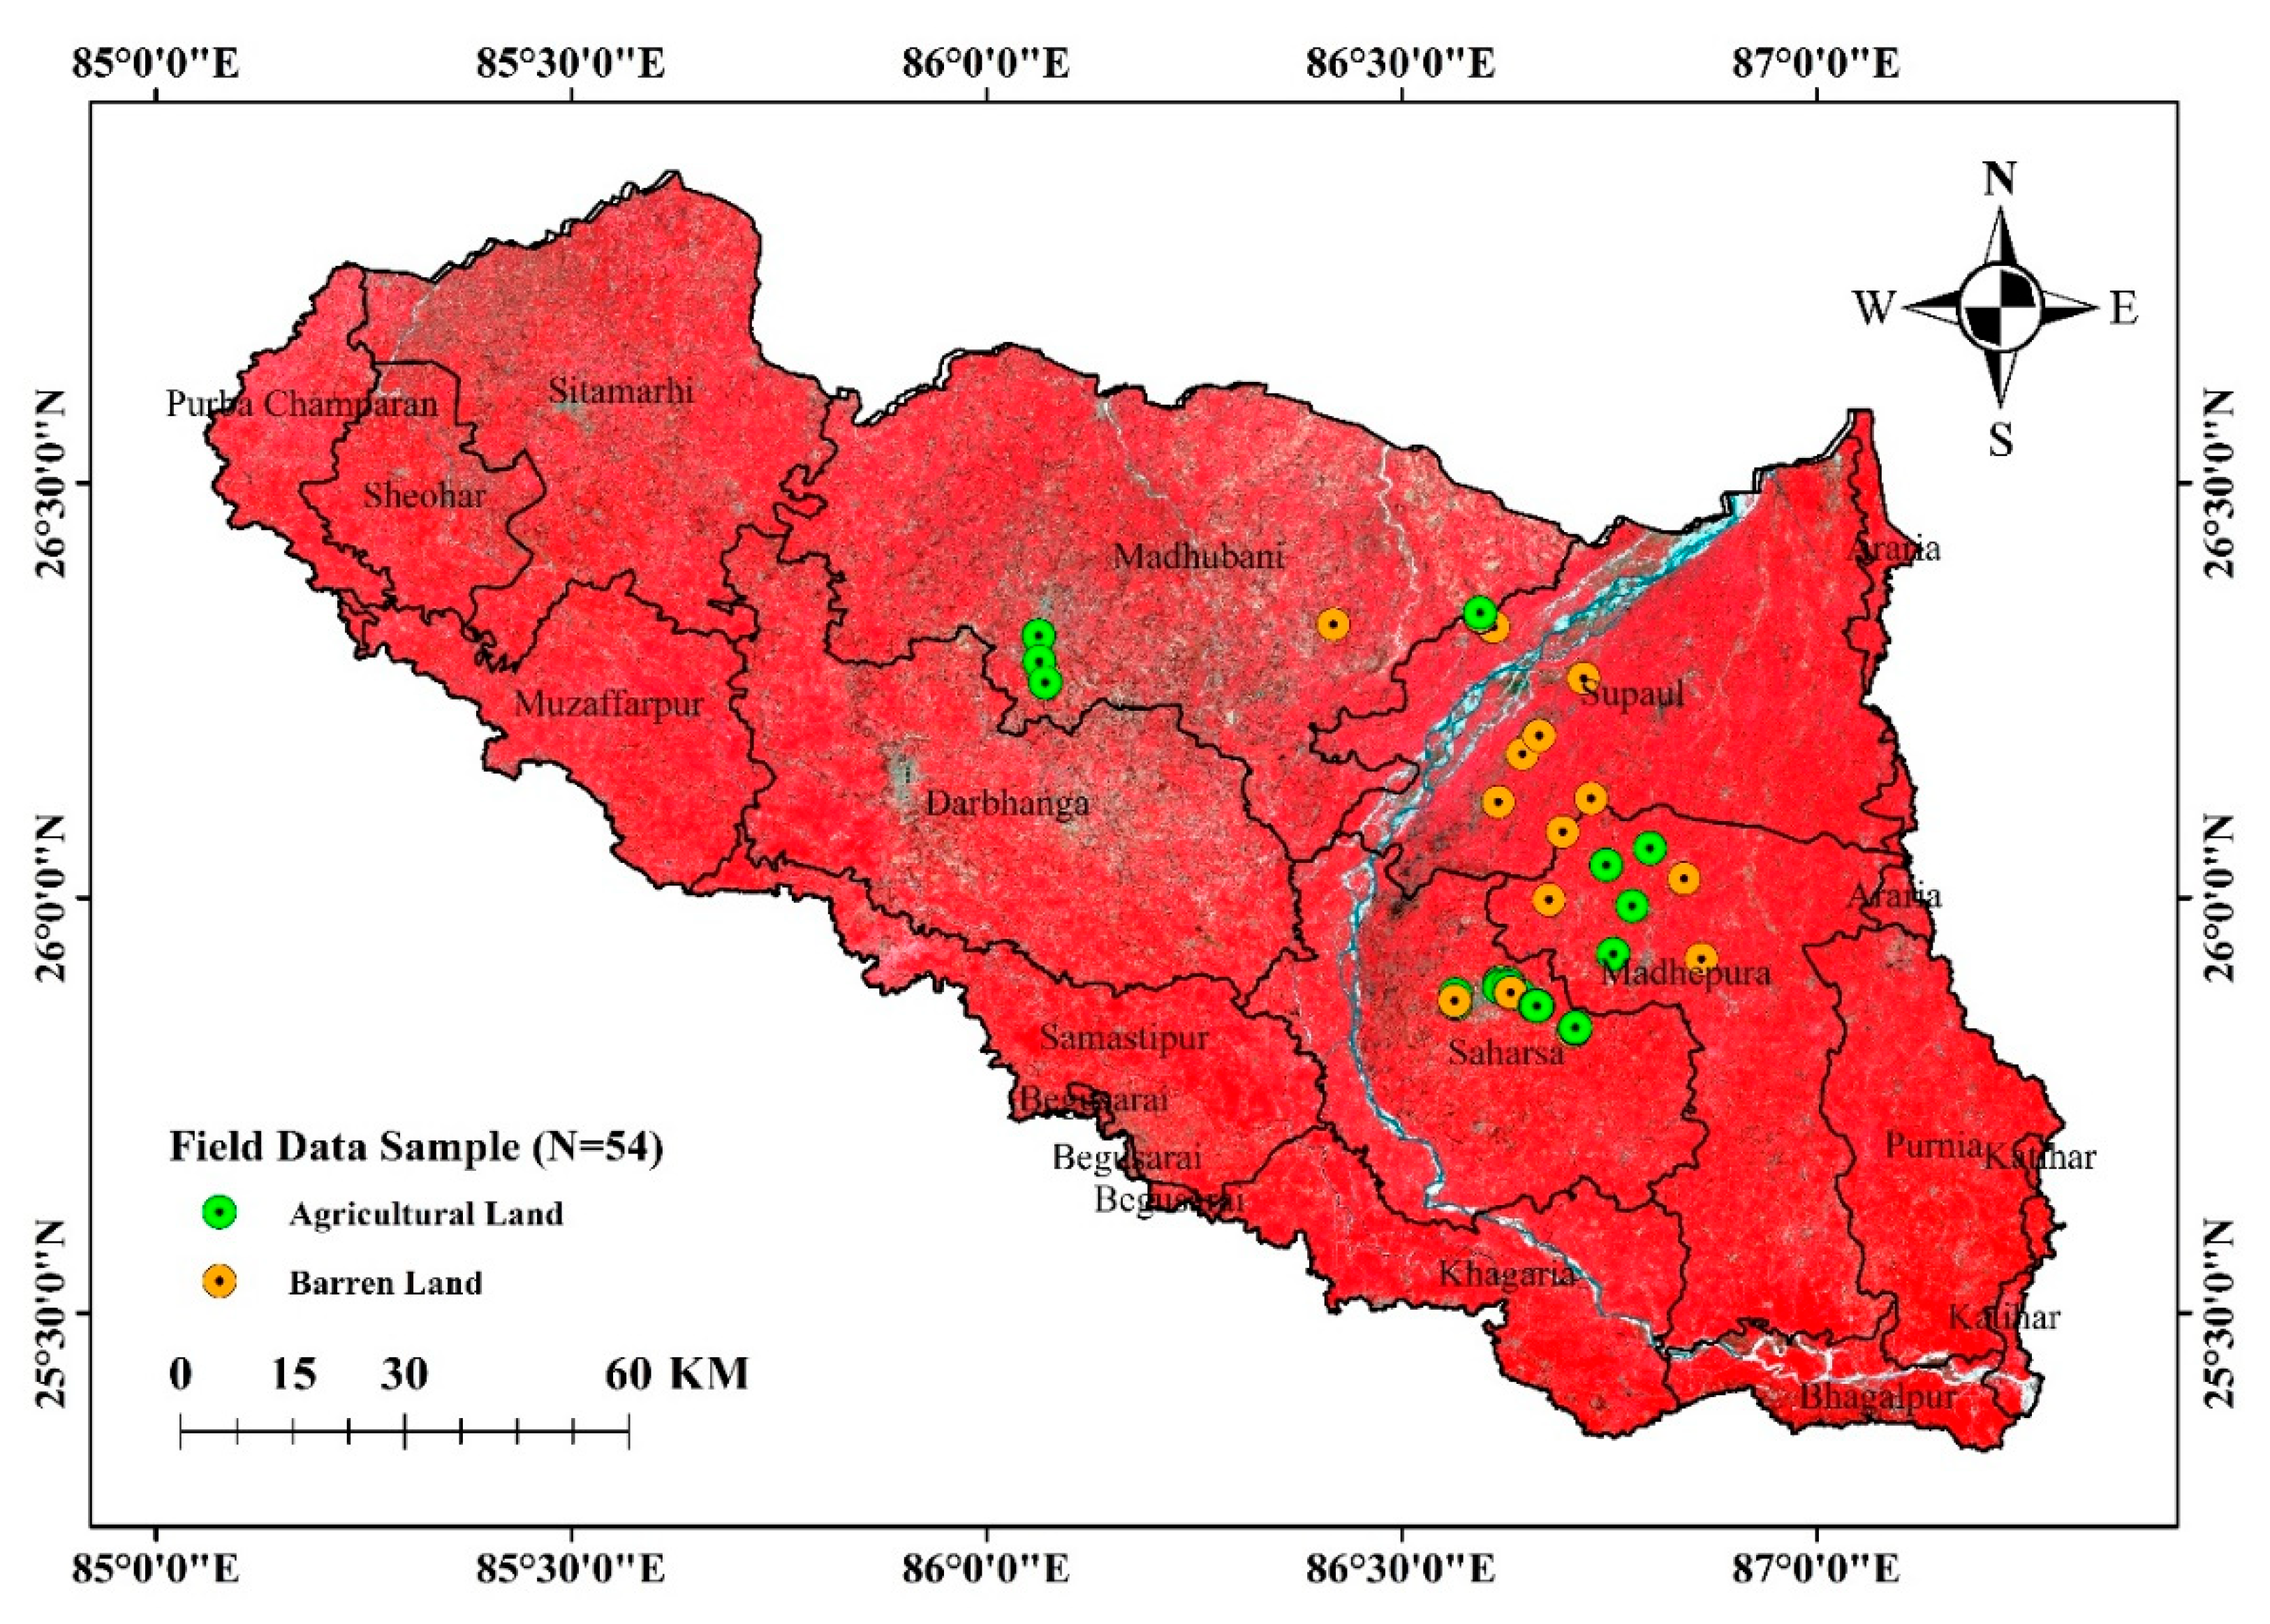
2.1. Study Area Description

The study area comprising the Kosi River Basin (KRB) is located in North Bihar in India, covering 22 districts within longitude 85°03′30″ E to 87°18′00″ E and latitude 25°20′00″ N to 26°52′30″ N (Figure 1). The KRB in north Bihar has a total geographical area of 19,674 km2 with a maximum elevation of 40 m [48]. However, the downstream areas are mostly flatter (5 to 8 m above mean sea level) [49], and therefore, during the monsoon season (June–September), these areas are severely inundated with floodwater [50,51,52]. The climate is subtropical monsoon with mild to dry winters and hot summers. The long-term average annual rainfall is between 1036 mm and 1625 mm, and the monsoon season accounts for nearly 86% of annual rainfall [53]. The annual average temperature was between 19.2 °C and 32.7 °C [53]. The Kosi River originates at an altitude of 7000 m from the Himalayas, drains the southern slopes of Nepal, and finally enters north Bihar. The downstream areas of north Bihar are prone to flooding and waterlogging [54]. Soils of KRB have formed due to the deposition of sediments from the Mahananda and Kosi rivers, and the major types are Terai and Gangetic alluvium soils. The terai soil is present in the northern part along the border of Nepal that is characterized by sandy and calcareous with a lower amount of silt content. The alluvium soil consists of silt, sand, clay, and gravel, which develops from the sediment deposited by the river Ganga in the Indo–Gangetic plain (soil order Entisols). The fertile alluvium soil is more loamy and clayey, and adequate groundwater resources make the diversified agriculture activities. Therefore, almost 76% of the population is directly dependent on Kharif crops grown during the monsoon season. The study area major comprises croplands (nearly 70%) and fallow lands (25%), followed by other land use and land covers (Figure A1) [48]. The area under high vegetation cover (i.e., forests) was about 1.2% of the study area.

2.2. Satellite Data Used & Pre-Processing

The satellite data used in this study are Sentinel–1A and Sentinel–2B. The Sentinel–1A based SAR data was utilized to estimate SSM in the KRB along with in-situ soil moisture measurements. The data are described in detail in the following sections. Sentinel-1A provides C-band SAR data at different modes. This study has used an interferometric wide-swath (IW) mode image for 15 February 2021, which is in dual-polarization (VV and VH). The data are available at a pixel spacing of 10 m × 10 m with an incidence angle of 38.39°. Sentinel-2B data are available at a spatial resolution of 10 m × 10 m, and it was used to derive an NDVI map over the study area. Table 1 summarizes the data used for this study.
ESA’s Sentinel Application Platform (SNAP) v6.0 was used to process the C-band Sentinel-1A data. In the pre-processing step of SAR data, radiometric calibration, speckle noise removal (i.e., refined Lee filter, window size 7 × 7), and terrain correction are performed. The digital elevation model (DEM) data of the Shuttle Radar Topography Mission (SRTM) was used for terrain correction of SAR data. After pre-processing, the VV and VH images contain the backscatter (σ°) values on a linear scale. Sentinel–2A satellite data were also processed to compute the NDVI using red (R) and near-infrared (NIR) bands. In this study, NDVI value ≤0.4 was utilized to specify the validity range of SSM as per the modified Dubois model [32,55].

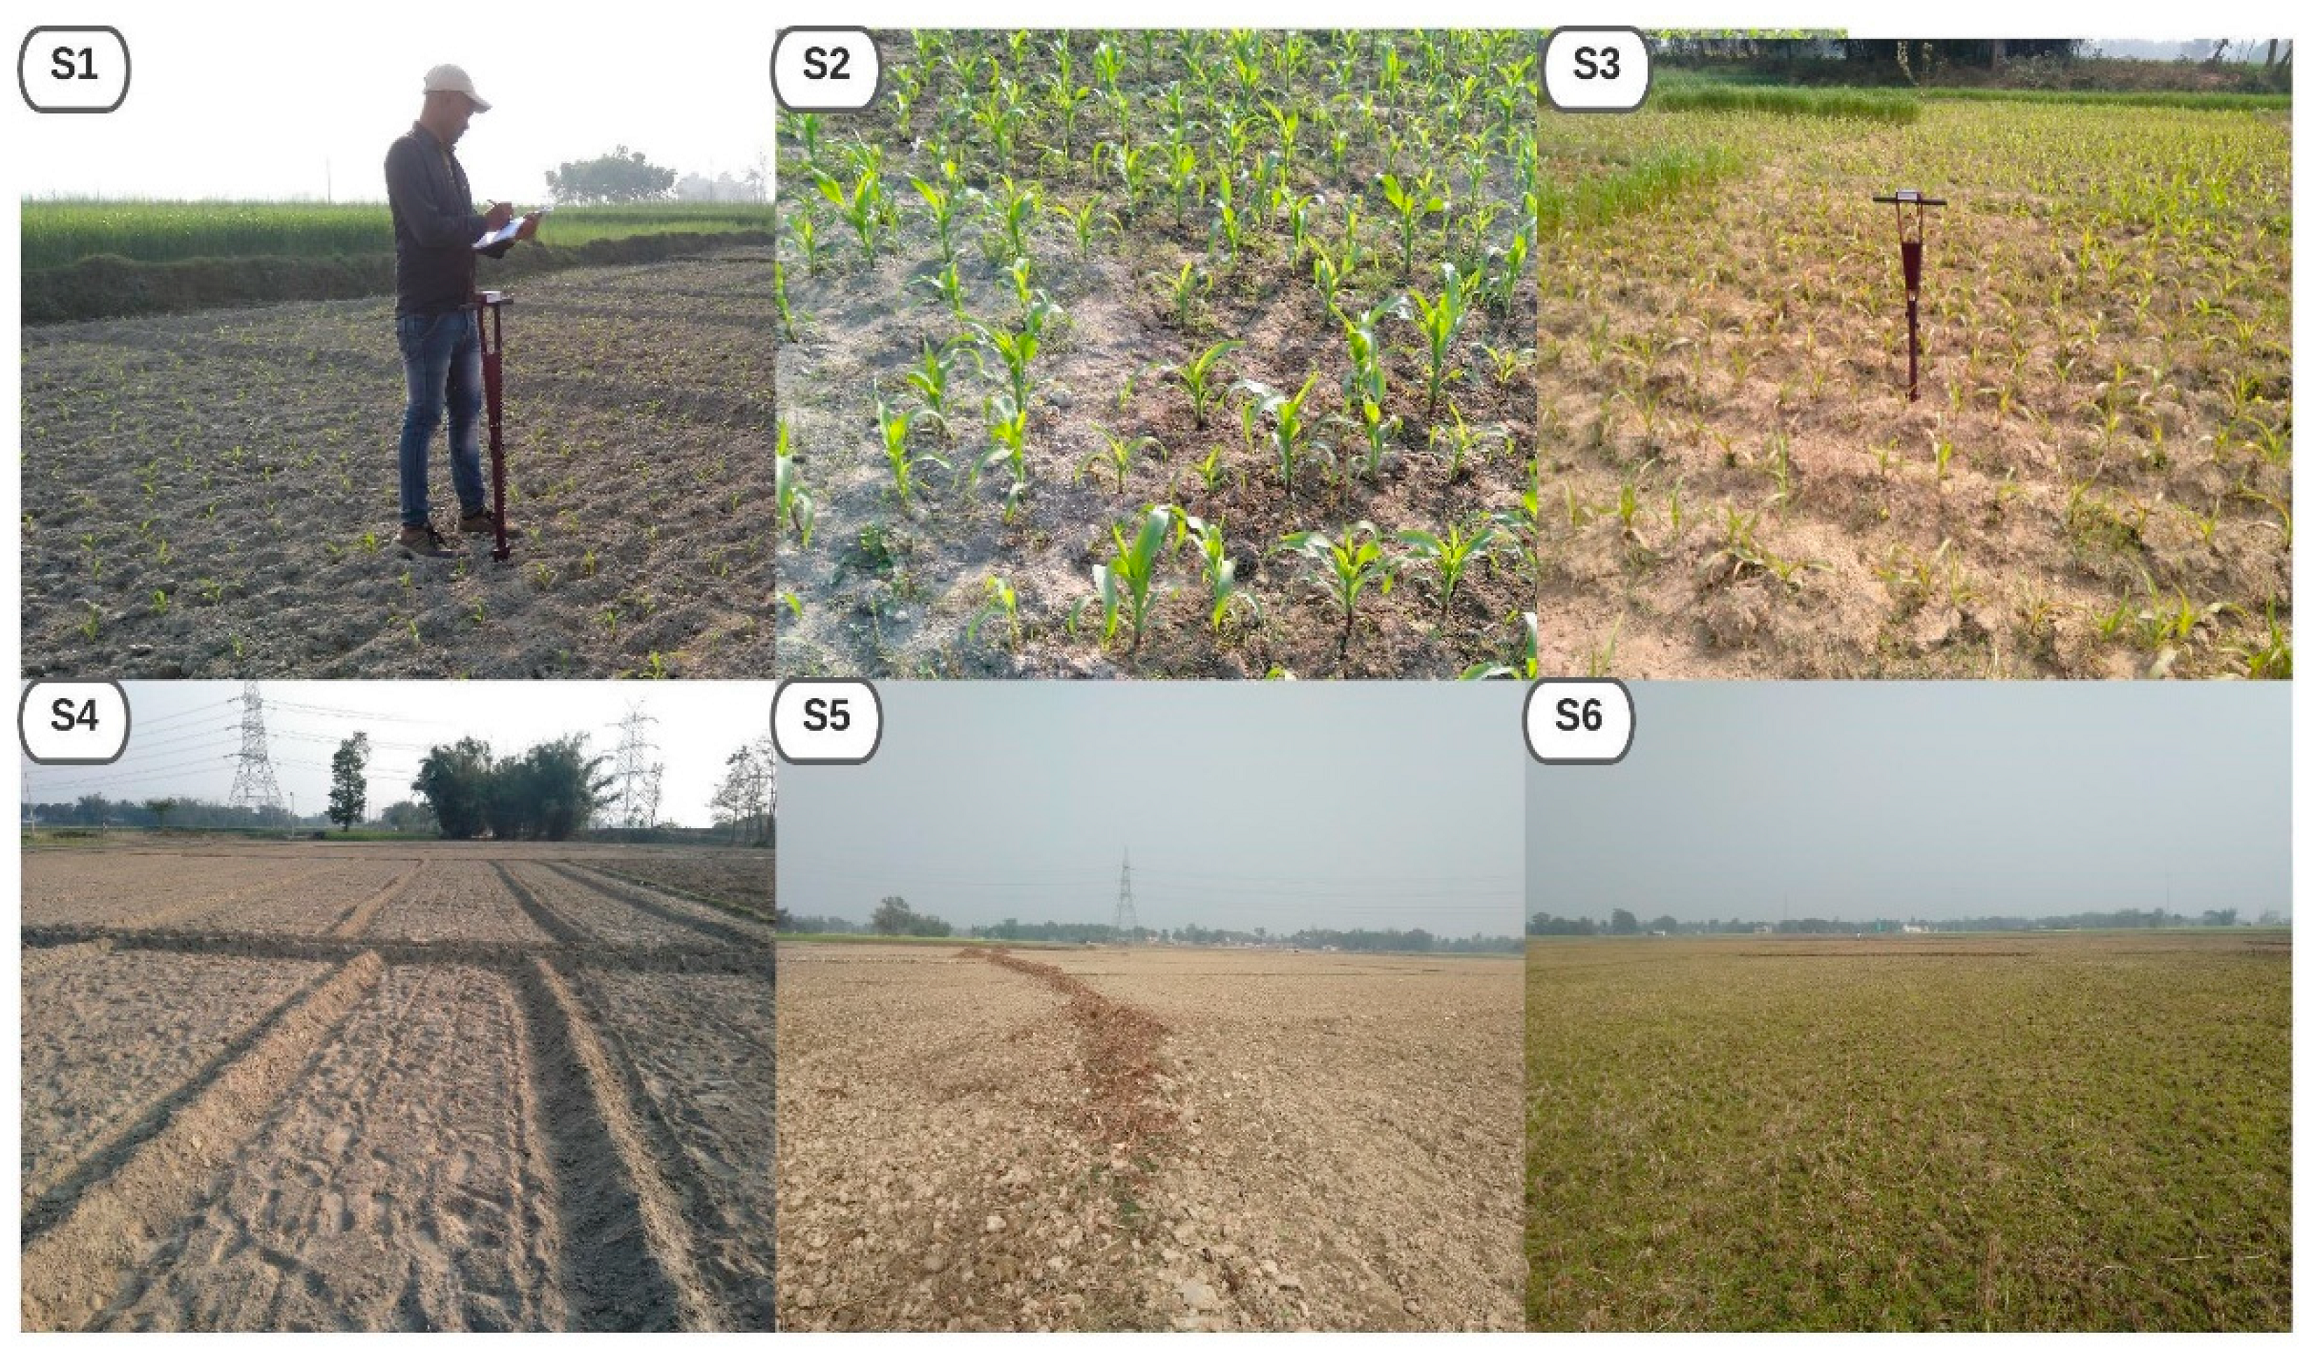
2.3. In-Situ SSM Measurements

The field campaign was conducted on 15–18 February 2021 to measure SSM, which coincided with the acquisition timing of SAR data. The in-situ measurements comprise 23 reference plots over bare soil and 31 reference plots over agricultural fields. Each reference plot consists of an average of 15 measurements from the plot size of 15 m × 15 m for the top of the soil (0–7.6 cm depth) that corresponds to the length of the Theta probe needles. The time-domain reflectometry (FieldScout TDR–300) was deployed for collecting the in-situ measurements of SSM in volumetric water content (VWC) covering different locations in entire study regions (Figure 1). The TDR–300 is a handheld instrument used to record surface soil moisture based on the principle of electrical signals that pass through probes placed in the soil. Typically, wet and saturated soils return the signal slowly compared to dry soils. It provides fast and accurate readings of soil moisture. Per the TDR-300 product manual manufactured by Spectrum Technologies Inc (Aurora, Illinois, USA)., the accuracy of percent VWC is ±3%. The existing weather conditions over the four meteorological stations of the India Meteorological Department (IMD) are provided in Table 2. The samples over vegetated agricultural fields are mainly covered with maize and wheat with an average plant height of 20 cm (i.e., 5–35 cm). The sample locations were acquired using Mobile Mapper handheld GPS (MM-50) manufactured by a Spectra Geospatial. Some selected samples of SSM measurements are shown in Figure 2 (over maize and bare soil), and the corresponding coordinate information has been provided in Table A1.

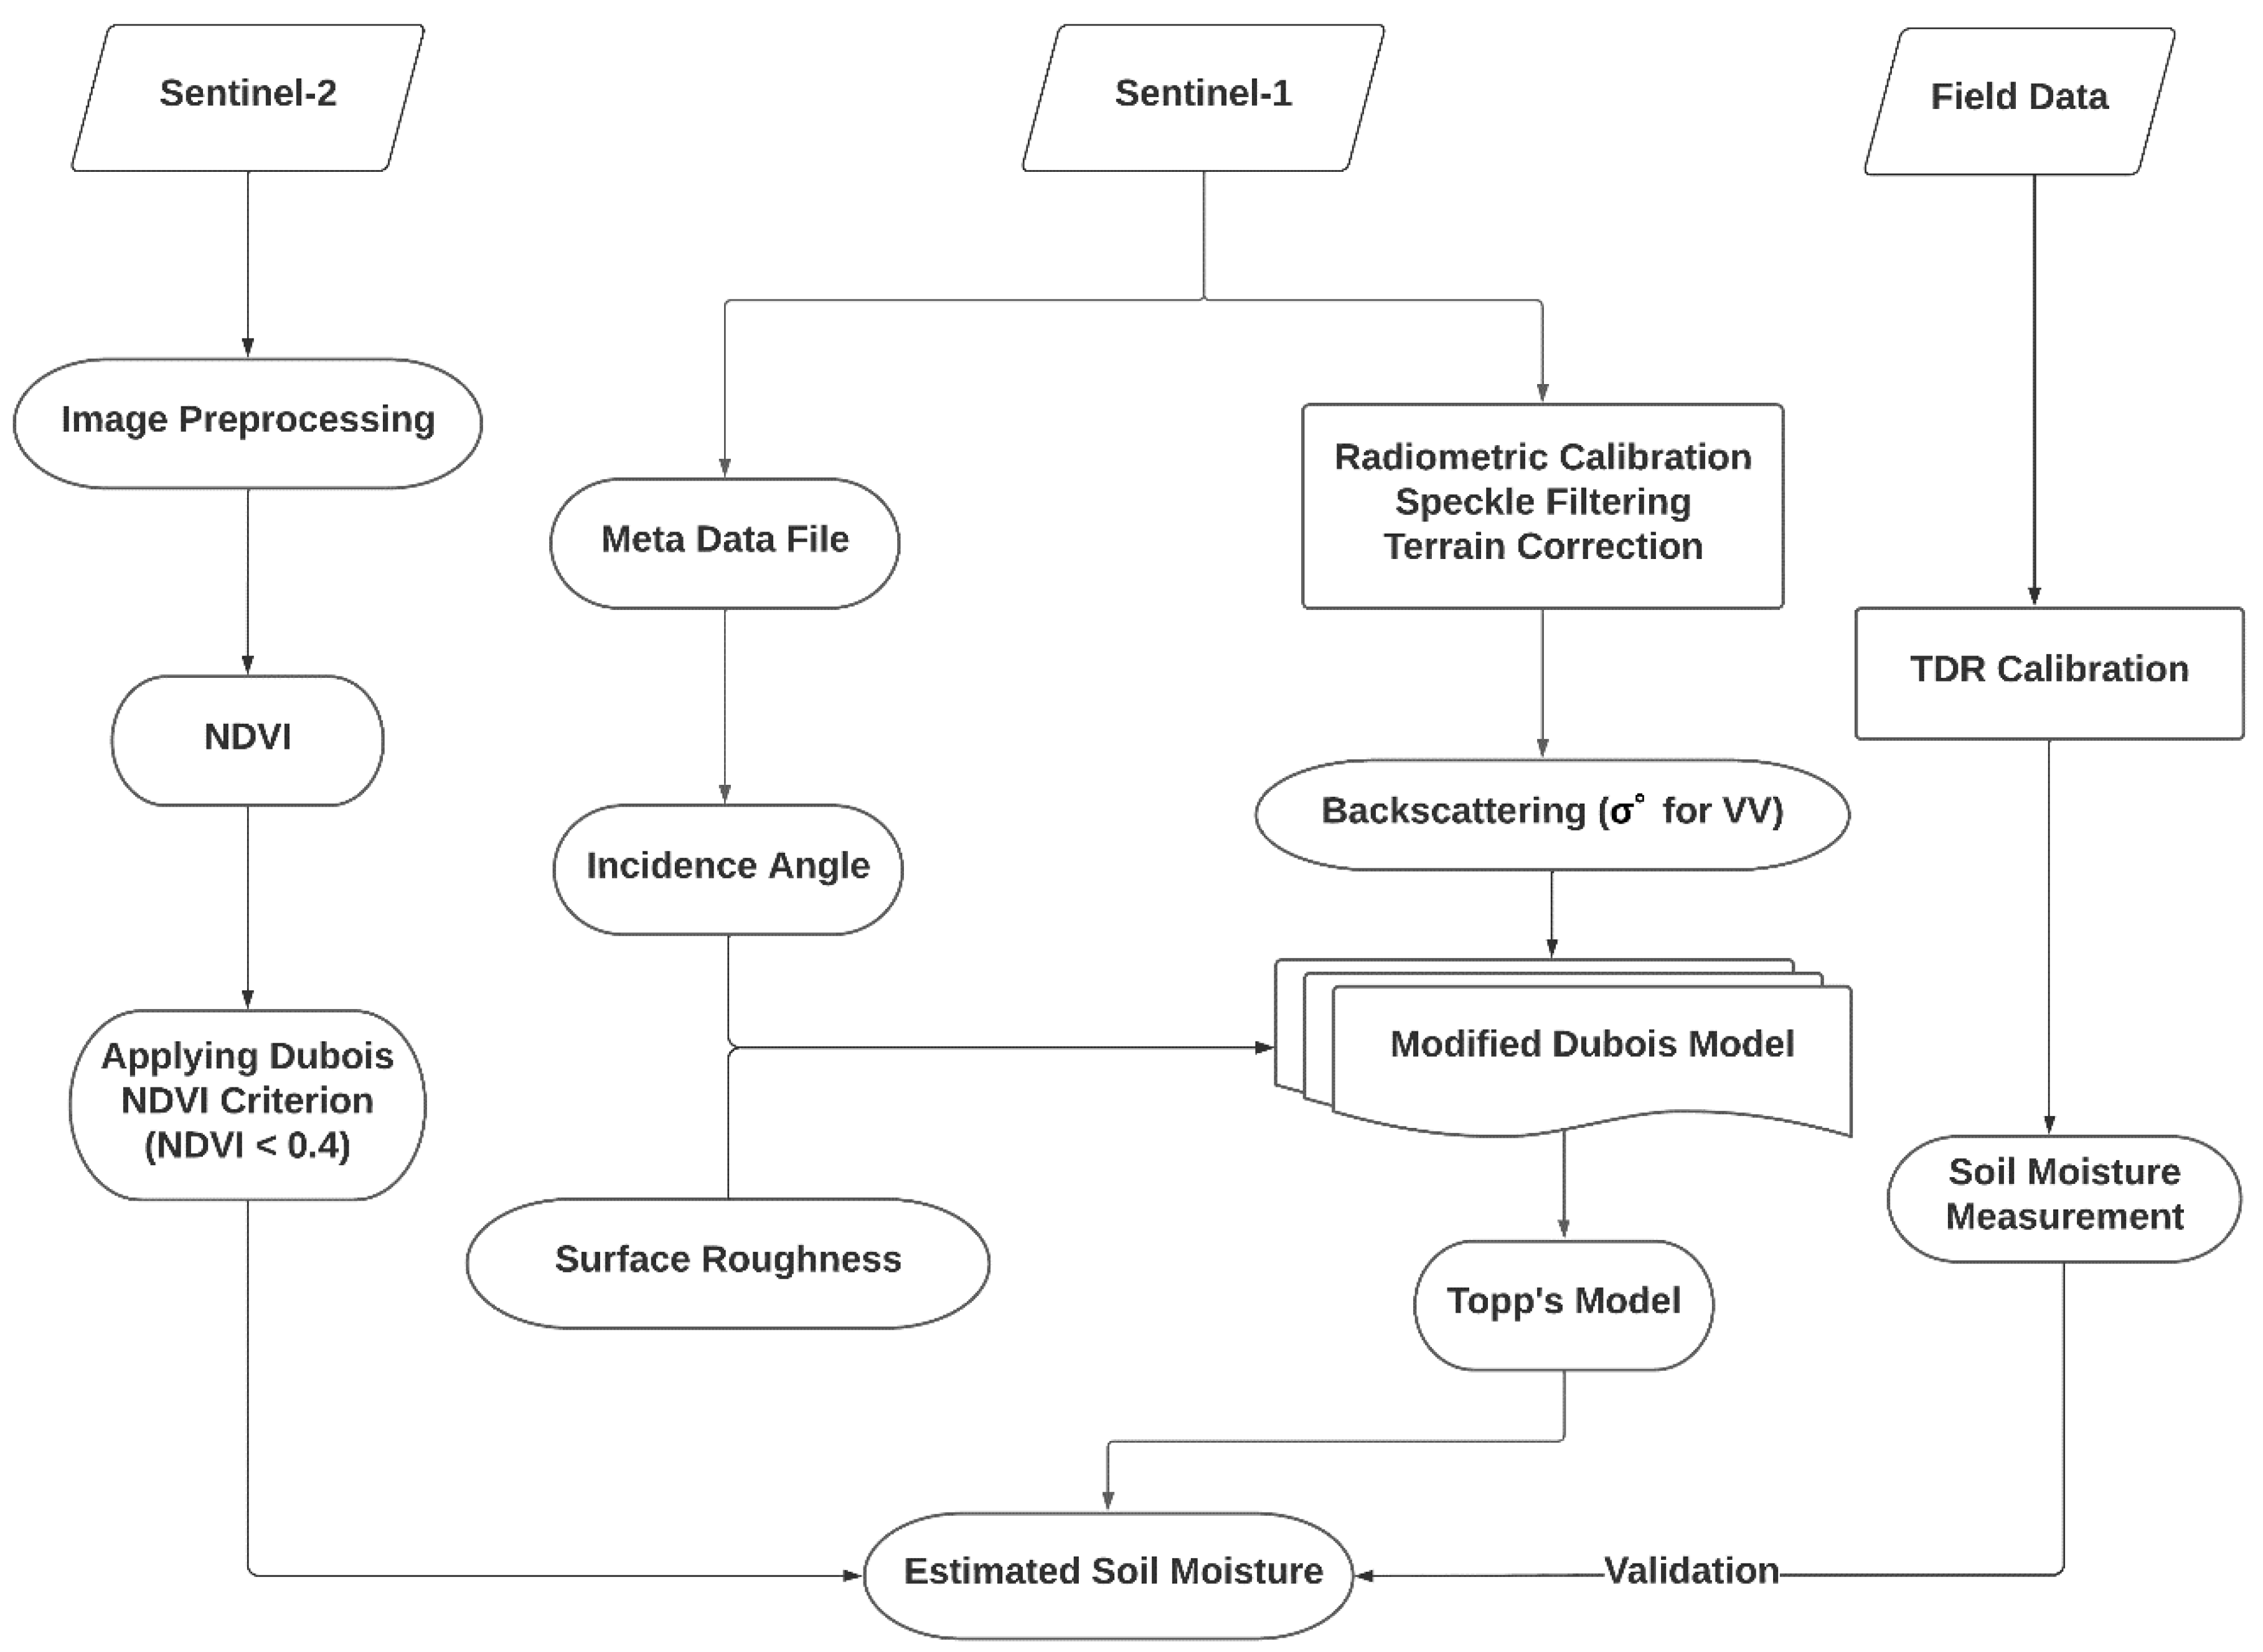
2.4. Method for Modeling SSM

The procedure adopted to retrieve SSM is shown in Figure 3. Backscatter values of VV polarization of C-band (Sentinel–1A) and incidence angle were used to calculate the relative soil permittivity (ε) as an input to the Dubois model [32]. Volumetric soil moisture was computed using the ε in universal Topp’s model [56]. Initially, Dubois et al. [32] established an empirical model to calculate the ε using quad polarized SAR data for L, C, and X bands [23,26,57]. The backscattering coefficient (σ°) can be calculated using Equations (1) and (2) for HH and VV polarizations, respectively. In this study, we have used only Equation (2), which is based on VV.
σ°HH = 10−2.75 (cos1.5θ/sin5θ) × 100.028εtan θ (k·s·sinθ)1.4λ0.7
σ°VV = 10−2.37 (cos3θ/sin3θ) × 100.046εtan θ (k·s·sinθ)1.1λ0.7
where θ is the incidence angle, s is the soil surface roughness (cm), λ is the SAR wavelength (5.3 cm), and k is (2π/λ). The θ and λ are related to the sensor parameters, while ε and s are the target parameters which are usually unknown. Dubois model is applied only over the sparse vegetation or bare soil. Therefore, NDVI < 0.4 criteria are usually applied to retrieve SSM using the modified Dubois model [55]. Albeit initially, the model was developed for quad polarized data for retrieving SSM, but the modified Dubois model [55] allowed to retrieve SSM using the dual-polarized SAR data like Sentinel–1A. As per the modified Dubois model, ε can be calculated using Equation (3) using VV polarization.
ε = log σ ° VV log A C B
where A is 10−2.37(cos3θ/sin3θ), B is 0.046 tan θ, and C is (k·s·sinθ)1.1λ0.7. The unknown surface roughness parameter (s) has been assigned as 1.8 cm, which is an average value of surface roughness (0.61–5.45 cm) based on in-situ measurements of 78 sample points over the Kosi fan in North Bihar [43,58]. The average roughness value was taken from the literature [43,58] which was measured using a one-dimensional pin-profiler in December 2019.
Finally, volumetric SSM (mv) can be retrieved using Equation (4) by applying Topp’s model [59], where ε is derived from VV polarization of C-band data (Sentinel–1A). This model is independent of soil properties (e.g., texture, grain size), and hence it is an effective approach for modeling SSM [59].
mv = −5.3 × 10⁻² + 2.92 × 10⁻²ε − 5.5 × 10⁻⁴ε2 + 4.3 × 10⁻⁶ε3
The TDR-based SSM measures the volumetric soil moisture (mv) in percentage; therefore, measurements data have been converted to [m3/m3]. Statistical indicators such as root mean square error (RMSE), percentage bias, and coefficient of determination (R2) were computed for comparison between in-situ SSM and satellite-derived SSM that comprised 54 sample points distributed over parts of the study area.

3. Results

3.1. Measured Surface Soil Moisture

The TDR–300 based measurements of surface soil moisture results showed that the mean SSM over bare soil and the agricultural fields was 0.23 m3/m3 (0.017–0.586 m3/m3) and 0.25 m3/m3 (0.022–0.598 m3/m3), respectively. The corresponding descriptive statistics, such as standard deviation (SD) and coefficient of variation (CV) of SSM, are shown in Table 3. During data collection in mid-February 2021, maize and wheat crops were seen with average crop heights of 20 cm with a minimum and maximum of 5 cm and 35 cm, respectively (Table 3).

3.2. Modeled Surface Soil Moisture and Comparisons with In-Situ Measurements

The presence of vegetation cover makes soil moisture retrieval from SAR data more complicated because the soil’s contribution is attenuated by the vegetation. To eliminate the effect of vegetation by using the modified Dubois model, we used NDVI < 0.4 criteria that indicate all areas of SSM are preserved whose NDVI is less than 0.4 corresponds to bare land or sparse vegetation coverage areas. The spatial patterns of modeled soil moisture showed that moisture value ranges from 0.05 to 0.5 m3/m3 over KRB (Figure 4). Most of the areas had shown lower soil moisture conditions (<0.1 m3/m3). The moderate conditions of soil moisture between 0.1 and 0.3 m3/m3 were seen across the KRB except for the Kosi megafan region. The highest soil moisture (>0.3 m3/m3) was only seen along the Kosi River located in the downstream areas as well as south-easterner most regions of KRB (i.e., Purulia, Madhepura, Khagaria, and Saharsa districts). Moreover, the highest soil moisture was found in the Kosi Megafan, which can be attributed to various landforms, such as waterlogged areas, palaeochannels, low-lying depressions, and groundwater seepage [60]. Compared to our estimates, a recent study has reported that surface soil moisture of the Kosi region varies from 0.12 to 0.53 m3/m3 [43]. A modified Dubois model was also used to estimate soil moisture based on Sentinel-1 SAR data in central India. Those results showed that SSM varied from 0.05 to 0.35 m3/m3, and the modeled SSM was found to be either overestimated or underestimated compared to the measured values [61].
The scatter plot was made between satellite-based SSM and in-situ measurements of 54 samples (Figure 5). The results exhibited a good agreement with R2 of 0.77 (p-value < 0.001), RMSE of 0.06 m3/m3, and percentage bias of 2% between the measured and satellite-based soil moisture. A similar range of R2 (0.75) and RMSE (0.035 m3/m3) was also reported by Singh et al. [61] over central India. Moreover, this statistical performance was consistent with the RMSE reported from 0.03–0.06 m3/m3, which used RADARSAT-2 C-band data [26,62]. The derived soil moisture of this study has shown both underestimation and overestimation in the study area, which indicates heterogeneity of landforms that control the SAR backscattering coefficient. The overestimation of SSM could be due to high soil surface roughness leading to higher backscattering coefficients. The underestimation can be attributed to lower backscatter coefficients from smooth surfaces.

4. Discussion

In this study, we employed the Dubois model to derive soil moisture from Sentinel-1A SAR data using VV polarization over bare soil and agricultural fields. The derived soil moisture was well correlated (R2 = 0.77) with the in-situ SSM measurement with RMSE of 0.06 m3/m3 and biases of 0.02 m3/m3. The derived SSM provides a first-order approximation of soil moisture, albeit there are some limitations of modeling approaches, such as dependency on the frequency of SAR data, ground condition, and land-use land cover types. Moreover, the modified Dubois model was applicable when SSM ranged from 0 to 0.35 m3/m3 [55], which depicts the model performance degraded when moisture level approaches saturated conditions. SAR signals are limited up to a few cm below the ground surface, and therefore, this study has measured in-situ moisture up to 7.6 cm. It can be concluded that the modified Dubois model has the potential to capture SSM, especially over bare soil and agricultural fields. However, SSM retrieval cannot be obtained using the modified Dubois model when the vegetation effect starts dominating (e.g., NDVI > 0.4) [18,23]. Alternatively, under high vegetation cover, the modified WCM is suggested to be applied for deriving SSM [4,20,39].
Other approaches such as Multiple Linear Regression (MLR), artificial neural networks (ANN) and machine learning have also been employed to retrieve SSM for various applications [63,64,65]. The MLR approach of SSM based on SAR backscatter coefficient, local incidence angle, surface roughness height, Leaf Area Index, and Plant Water Content has demonstrated an error within ±20% for all the three land cover types (i.e., bare soil, sugarcane, and wheat) in the catchment area of river Solani which is a tributary of river Ganges [64]. The highest accuracy was found in bare soil with R2 of 0.78 (RMSE = 1.31%) as compared to sugarcane (R2 = 0.67, RMSE = 3.6%) and wheat (R2 = 0.72 and RMSE = 1.94%). SSM estimated from the ANN-based approach using various surface parameters and C-band data also demonstrated a higher R2 (0.90) with RMSE of less than 7% [66,67]. A semi-empirical model based on only surface roughness height, SAR backscatter coefficient, and dielectric constant of soil has demonstrated that the modeled SSM was highly correlated with the in-situ measurement with R2 of 0.88 (RMSE = 1.93%) over bare soils in the tropical semiarid region of India [65]. The machine learning-based study demonstrated that the modeled SSM based on polarimetric Phased Array-type L-band SAR 2 (PALSAR-2) data achieved R2 of 0.6 with RMSE of 7.7% over the study region in Arkansas in the United States [63]. Similarly, SSM based on X-band TerraSAR-X and ML technique has achieved a relatively high accuracy with RMSE of 6% [68]. The modeled SSM based on decomposition models indicated an RMSE close to 10% [63,69]. Numerous studies have adopted SAR data along with various models for deducing SSM. The present approach has also provided cost-effective field-scale soil moisture to apply in various crop planning and agronomy applications.
The applied methodology has been adopted for a single time frame of SAR data (15 February 2021), and the results of SSM are well comparable to field-based in-situ measurements. This implies that the developed methodological framework can be applied to other dates of SAR image acquisition to deduce SSM at higher spatial resolution (10 m). The change in the heterogeneity of the landforms, rainfall, soil types, topography, roughness, and wetness conditions usually alters the radar signal and, therefore, the radar backscatter coefficient across different polarizations (i.e., HH, VV, VH, etc.). The derived SSM has the potential for further applications, such as crop planning, irrigation scheduling, agronomy and meteorological. The SAR data, along with the Dubois model, is hence designed to be not site-specific but universally applicable to any area and any dates [67], albeit these physical surface scattering models of SSM are not valid for deducing SSM under dense vegetation cover [34].
It is worth mentioning that the roughness parameter (root mean square height) of the area outside the sampling point is unknown. The mean value of the root mean square height derived from a limited number of sample points as the input parameter to the model might not effectively characterize the roughness of the whole area. Hence, future studies should emphasize a high volume of in-situ measurements of roughness parameters along with statistical techniques for upscaling roughness parameters to pixel-level for modeling SSM accurately. Moreover, the land types covered in the study area are majorly agricultural fields and bare soils [48], and the applicability of the Dubois model is suitable. However, it could be limited in case the same methodology is applied in other parts of the world where the study area is covered by high vegetation cover.

5. Conclusions

The present study has deployed VV polarization of the C-band of Sentinel-1A to retrieve the spatial pattern of SSM over bare soil and sparsely vegetated surface. The VV was found to be suitable for retrieving SSM since the VV polarization is generally sensitive to the variation of soil conditions. The proposed methodology framework has captured the spatial heterogeneity of soil moisture across the study area with an R2 of 77 and RMSE of 0.06 m3/m3. Caution must be taken on the applicability of the Dubois model depending on the land types covered in the study area, as the modified Dubois model has limited capability under dense vegetation cover.
In future work, the retrieval model of SSM may be evaluated using dual-polarized SAR data from different bands, such as the L-band of ALOS PALSAR and/or the S and L bands of NASA-ISRO Synthetic Aperture Radar (NISAR) mission because of their higher penetration depth (10–30 cm) in the near-surface soil layer compared to the C-band (5 cm). Nevertheless, the outcome of the present study would be beneficial for monitoring SSM, crop water use, crop irrigation scheduling, water management, droughts and flooding, and soil erosion.

Author Contributions

B.R.P. and A.C.P.: conceptualization, investigation, methodology, software, analysis, visualization, validation, supervision, writing–original draft, review, and editing. R.K.: methodology, software, data curation, analysis, visualization, writing–review, and editing. S.K. has contributed to the data collection in the field. All authors have read and agreed to the published version of the manuscript.

Funding

This research received no external funding.

Institutional Review Board Statement

Not applicable.

Informed Consent Statement

Not applicable.

Data Availability Statement

All the satellite datasets used in this study are publicly available. The in-situ SSM measurements are provided in Table A1.

Acknowledgments

The authors wish to acknowledge the Alaska Satellite Facility (ASF) for providing Sentinel-1A SAR satellite data free of cost.

Conflicts of Interest

The authors declare no conflict of interest.

Appendix A

Figure A1. Land use Land cover map of North Bihar as derived from Sentinel-2 satellite data.
Agronomy 12 01045 g0a1
Table A1. Measurement of in-situ SSM using TDR-300 at different sample plots in KRB and corresponding coordinates.
Site IDLatitude (° N)Longitude (° E)Date
(dd-mm-yyy)
Crop Height (cm)SSM
(m3/m3)
Sampling DepthLand Use
S126.059186.710115 February 202150.217.6 cmMaize
S226.006086.773515 February 202120.20.3657.6 cmMaize
S325.842186.709215 February 202111.70.097.6 cmMaize
S425.876186.564315 February 2021-0.0557.6 cmBare soil
S526.264686.720315 February 2021-0.547.6 cmBare soil
S626.264786.719815 February 2021-0.3857.6 cmBare soil
S726.326186.610215 February 2021200.0347.6 cmWheat
S826.326486.611315 February 2021-0.5347.6 cmBare soil
S926.337686.594915 February 2021230.2097.6 cmWheat
S1026.337886.594715 February 2021250.307.6 cmWheat
S1126.33986.594915 February 2021-0.0637.6 cmBare soil
S1226.343486.594815 February 2021130.4237.6 cmWheat
S1326.329586.418415 February 2021-0.1927.6 cmBare soil
S1426.315886.063515 February 2021-0.1857.6 cmBare soil
S1526.315586.06315 February 2021-0.177.6 cmBare soil
S1626.315586.063315 February 2021130.3157.6 cmWheat
S1726.270386.068916 February 2021-0.2077.6 cmBare soil
S1826.284586.06416 February 2021130.1517.6 cmWheat
S1926.259386.07116 February 2021100.3657.6 cmWheat
S2026.173386.646116 February 2021-0.4977.6 cmBare soil
S2126.195586.666316 February 2021-0.317.6 cmBare soil
S2226.079686.694416 February 2021-0.1697.6 cmBare soil
S2326.080186.694816 February 2021-0.1467.6 cmBare soil
S2426.115786.616916 February 2021-0.4497.6 cmBare soil
S2526.05986.709716 February 2021220.0927.6 cmWheat
S2626.001986.775716 February 2021-0.0437.6 cmBare soil
S2726.001886.775916 February 2021350.1367.6 cmMaize
S2826.006486.774116 February 2021320.307.6 cmMaize
S2925.883586.565216 February 2021140.2257.6 cmMaize
S3025.883386.642316 February 2021150.4187.6 cmWheat
S3125.889386.630516 February 2021-0.0237.6 cmBare soil
S3225.895186.630116 February 202122.50.5187.6 cmWheat
S3325.897986.627717 February 202190.1077.6 cmWheat
S3425.898886.624117 February 2021-0.4657.6 cmBare soil
S3525.899286.61917 February 2021-0.417.6 cmBare soil
S3625.896886.618917 February 2021170.2877.6 cmMaize
S3725.892986.619317 February 2021-0.3217.6 cmBare soil
S3825.89286.61917 February 202111.650.1127.6 cmMaize
S3925.892286.628117 February 2021200.2037.6 cmMaize
S4025.885786.630317 February 202117.50.2257.6 cmMaize
S4125.88686.63217 February 2021-0.0917.6 cmMaize
S4225.870486.660717 February 2021-0.0817.6 cmBare soil
S4325.870286.661617 February 2021350.1267.6 cmBare soil
S4425.870586.663617 February 2021250.2957.6 cmMaize
S4525.870186.66517 February 2021150.3337.6 cmWheat
S4625.869386.663218 February 2021350.2117.6 cmWheat
S4725.838686.707218 February 2021-0.0987.6 cmMaize
S4825.843286.709518 February 202130.70.3817.6 cmBare soil
S4925.843586.709618 February 2021320.3857.6 cmMaize
S5025.843886.709618 February 202130.50.3057.6 cmMaize
S5125.843886.709818 February 2021310.2457.6 cmMaize
S5225.871886.566118 February 2021100.2817.6 cmMaize
S5325.873986.564418 February 2021110.2867.6 cmWheat
S5425.876686.561818 February 2021-0.0757.6 cmWheat

References

  1. Srivastava, P.K.; O’Neill, P.; Cosh, M.; Kurum, M.; Lang, R.; Joseph, A. Evaluation of Dielectric Mixing Models for Passive Microwave Soil Moisture Retrieval Using Data From ComRAD Ground-Based SMAP Simulator. IEEE J. Sel. Top. Appl. Earth Obs. Remote Sens. 2015, 8, 4345–4354. [Google Scholar] [CrossRef]
  2. Torres-Rua, A.; Ticlavilca, A.; Bachour, R.; McKee, M. Estimation of Surface Soil Moisture in Irrigated Lands by Assimilation of Landsat Vegetation Indices, Surface Energy Balance Products, and Relevance Vector Machines. Water 2016, 8, 167. [Google Scholar] [CrossRef] [Green Version]
  3. Petropoulos, G.; Srivastava, P.; Piles, M.; Pearson, S. Earth Observation-Based Operational Estimation of Soil Moisture and Evapotranspiration for Agricultural Crops in Support of Sustainable Water Management. Sustainability 2018, 10, 181. [Google Scholar] [CrossRef] [Green Version]
  4. Zribi, M.; Muddu, S.; Bousbih, S.; Al Bitar, A.; Tomer, S.K.; Baghdadi, N.; Bandyopadhyay, S. Analysis of L-Band SAR Data for Soil Moisture Estimations over Agricultural Areas in the Tropics. Remote Sens. 2019, 11, 1122. [Google Scholar] [CrossRef] [Green Version]
  5. Sekertekin, A.; Marangoz, A.M.; Abdikan, S. ALOS-2 and Sentinel-1 SAR Data Sensitivity Analysis to Surface Soil Moisture over Bare and Vegetated Agricultural Fields. Comput. Electron. Agric. 2020, 171, 105303. [Google Scholar] [CrossRef]
  6. Şekertekin, A.; Marangoz, A.M.; Abdikan, S. Soil Moisture Mapping Using Sentinel-1A Synthetic Aperture Radar Data. Int. J. Environ. Geoinform. 2018, 5, 178–188. [Google Scholar] [CrossRef]
  7. Sadeghi, M.; Babaeian, E.; Tuller, M.; Jones, S.B. The Optical Trapezoid Model: A Novel Approach to Remote Sensing of Soil Moisture Applied to Sentinel-2 and Landsat-8 Observations. Remote Sens. Environ. 2017, 198, 52–68. [Google Scholar] [CrossRef] [Green Version]
  8. Moghaddam, M.; Entekhabi, D.; Goykhman, Y.; Li, K.; Liu, M.; Mahajan, A.; Nayyar, A.; Shuman, D.; Teneketzis, D. A Wireless Soil Moisture Smart Sensor Web Using Physics-Based Optimal Control: Concept and Initial Demonstrations. IEEE J. Sel. Top. Appl. Earth Obs. Remote Sens. 2010, 3, 522–535. [Google Scholar] [CrossRef]
  9. Tian, J.; Philpot, W.D. Relationship between Surface Soil Water Content, Evaporation Rate, and Water Absorption Band Depths in SWIR Reflectance Spectra. Remote Sens. Environ. 2015, 169, 280–289. [Google Scholar] [CrossRef]
  10. Zeng, W.; Xu, C.; Huang, J.; Wu, J.; Tuller, M. Predicting Near-Surface Moisture Content of Saline Soils from Near-Infrared Reflectance Spectra with a Modified Gaussian Model. Soil Sci. Soc. Am. J. 2016, 80, 1496–1506. [Google Scholar] [CrossRef]
  11. Patel, N.R.; Mukund, A.; Parida, B.R. Satellite-Derived Vegetation Temperature Condition Index to Infer Root Zone Soil Moisture in Semi-Arid Province of Rajasthan, India. Geocarto Int. 2019, 34, 179–195. [Google Scholar] [CrossRef]
  12. Aubert, M.; Baghdadi, N.N.; Zribi, M.; Ose, K.; El Hajj, M.; Vaudour, E.; Gonzalez-Sosa, E. Toward an Operational Bare Soil Moisture Mapping Using TerraSAR-X Data Acquired Over Agricultural Areas. IEEE J. Sel. Top. Appl. Earth Obs. Remote Sens. 2013, 6, 900–916. [Google Scholar] [CrossRef]
  13. Bazzi, H.; Baghdadi, N.; El Hajj, M.; Zribi, M.; Belhouchette, H. A Comparison of Two Soil Moisture Products S2MP and Copernicus-SSM Over Southern France. IEEE J. Sel. Top. Appl. Earth Obs. Remote Sens. 2019, 12, 3366–3375. [Google Scholar] [CrossRef]
  14. Kerr, Y.H.; Waldteufel, P.; Wigneron, J.-P.; Delwart, S.; Cabot, F.; Boutin, J.; Escorihuela, M.-J.; Font, J.; Reul, N.; Gruhier, C.; et al. The SMOS Mission: New Tool for Monitoring Key Elements Ofthe Global Water Cycle. Proc. IEEE 2010, 98, 666–687. [Google Scholar] [CrossRef] [Green Version]
  15. Brown, M.E.; Escobar, V.; Moran, S.; Entekhabi, D.; O’Neill, P.E.; Njoku, E.G.; Doorn, B.; Entin, J.K. NASA’s Soil Moisture Active Passive (SMAP) Mission and Opportunities for Applications Users. Bull. Am. Meteorol. Soc. 2013, 94, 1125–1128. [Google Scholar] [CrossRef]
  16. Gorrab, A.; Zribi, M.; Baghdadi, N.; Mougenot, B.; Fanise, P.; Chabaane, Z. Retrieval of Both Soil Moisture and Texture Using TerraSAR-X Images. Remote Sens. 2015, 7, 10098–10116. [Google Scholar] [CrossRef] [Green Version]
  17. Esetlili, M.T.; Kurucu, Y. Determination of Main Soil Properties Using Synthetic Aperture Radar. Fresenius Environ. Bull. 2016, 25, 23–36. [Google Scholar]
  18. Yadav, V.P.; Prasad, R.; Bala, R.; Vishwakarma, A.K. An Improved Inversion Algorithm for Spatio-Temporal Retrieval of Soil Moisture through Modified Water Cloud Model Using C- Band Sentinel-1A SAR Data. Comput. Electron. Agric. 2020, 173, 105447. [Google Scholar] [CrossRef]
  19. Mirsoleimani, H.R.; Sahebi, M.R.; Baghdadi, N.; El Hajj, M. Bare Soil Surface Moisture Retrieval from Sentinel-1 SAR Data Based on the Calibrated IEM and Dubois Models Using Neural Networks. Sensors 2019, 19, 3209. [Google Scholar] [CrossRef] [Green Version]
  20. Bindlish, R.; Barros, A.P. Parameterization of Vegetation Backscatter in Radar-Based, Soil Moisture Estimation. Remote Sens. Environ. 2001, 76, 130–137. [Google Scholar] [CrossRef]
  21. Le Hegarat-Mascle, S.; Zribi, M.; Alem, F.; Weisse, A.; Loumagne, C. Soil Moisture Estimation from ERS/SAR Data: Toward an Operational Methodology. IEEE Trans. Geosci. Remote Sens. 2002, 40, 2647–2658. [Google Scholar] [CrossRef]
  22. Aubert, M.; Baghdadi, N.; Zribi, M.; Douaoui, A.; Loumagne, C.; Baup, F.; El Hajj, M.; Garrigues, S. Analysis of TerraSAR-X Data Sensitivity to Bare Soil Moisture, Roughness, Composition and Soil Crust. Remote Sens. Environ. 2011, 115, 1801–1810. [Google Scholar] [CrossRef] [Green Version]
  23. Dave, R.; Kumar, G.; Pandey, D.K.; Khan, A.; Bhattacharya, B. Evaluation of Modified Dubois Model for Estimating Surface Soil Moisture Using Dual Polarization RISAT-1 C-Band SAR Data. Geocarto Int. 2021, 36, 1459–1469. [Google Scholar] [CrossRef]
  24. El Hajj, M.; Baghdadi, N.; Zribi, M. Comparative Analysis of the Accuracy of Surface Soil Moisture Estimation from the C- and L-Bands. Int. J. Appl. Earth Obs. Geoinf. 2019, 82, 101888. [Google Scholar] [CrossRef]
  25. Anguela, T.P.; Zribi, M.; Baghdadi, N.; Loumagne, C. Analysis of Local Variation of Soil Surface Parameters With TerraSAR-X Radar Data Over Bare Agricultural Fields. IEEE Trans. Geosci. Remote Sens. 2010, 48, 874–881. [Google Scholar] [CrossRef]
  26. Hosseini, R.; Newlands, N.; Dean, C.; Takemura, A. Statistical Modeling of Soil Moisture, Integrating Satellite Remote-Sensing (SAR) and Ground-Based Data. Remote Sens. 2015, 7, 2752–2780. [Google Scholar] [CrossRef] [Green Version]
  27. Fernández-Prieto, D.; Kesselmeier, J.; Ellis, M.; Marconcini, M.; Reissell, A.; Suni, T. Earth Observation for Land-Atmosphere Interaction Science. Biogeosciences 2013, 10, 261–266. [Google Scholar] [CrossRef]
  28. Grillakis, M.G.; Koutroulis, A.G.; Komma, J.; Tsanis, I.K.; Wagner, W.; Blöschl, G. Initial Soil Moisture Effects on Flash Flood Generation—A Comparison between Basins of Contrasting Hydro-Climatic Conditions. J. Hydrol. 2016, 541, 206–217. [Google Scholar] [CrossRef]
  29. Fung, A.K.; Li, Z.; Chen, K.S. Backscattering from a Randomly Rough Dielectric Surface. IEEE Trans. Geosci. Remote Sens. 1992, 30, 356–369. [Google Scholar] [CrossRef]
  30. Oh, Y.; Sarabandi, K.; Ulaby, F.T. An Empirical Model and an Inversion Technique for Radar Scattering from Bare Soil Surfaces. IEEE Trans. Geosci. Remote Sens. 1992, 30, 370–381. [Google Scholar] [CrossRef]
  31. Das, K.; Paul, P.K. Soil Moisture Retrieval Model by Using RISAT-1, C-Band Data in Tropical Dry and Sub-Humid Zone of Bankura District of India. Egypt. J. Remote Sens. Space Sci. 2015, 18, 297–310. [Google Scholar] [CrossRef] [Green Version]
  32. Dubois, P.C.; van Zyl, J.; Engman, T. Measuring Soil Moisture with Imaging Radars. IEEE Trans. Geosci. Remote Sens. 1995, 33, 915–926. [Google Scholar] [CrossRef] [Green Version]
  33. Oh, Y. Quantitative Retrieval of Soil Moisture Content and Surface Roughness From Multipolarized Radar Observations of Bare Soil Surfaces. IEEE Trans. Geosci. Remote Sens. 2004, 42, 596–601. [Google Scholar] [CrossRef]
  34. Petropoulos, G.P.; Ireland, G.; Barrett, B. Surface Soil Moisture Retrievals from Remote Sensing: Current Status, Products & Future Trends. Phys. Chem. Earth Parts A/B/C 2015, 83–84, 36–56. [Google Scholar] [CrossRef]
  35. Kumar, K.; Suryanarayana Rao, H.P.; Arora, M.K. Study of Water Cloud Model Vegetation Descriptors in Estimating Soil Moisture in Solani Catchment. Hydrol. Process. 2015, 29, 2137–2148. [Google Scholar] [CrossRef]
  36. Bao, Y.; Lin, L.; Wu, S.; Kwal Deng, K.A.; Petropoulos, G.P. Surface Soil Moisture Retrievals over Partially Vegetated Areas from the Synergy of Sentinel-1 and Landsat 8 Data Using a Modified Water-Cloud Model. Int. J. Appl. Earth Obs. Geoinf. 2018, 72, 76–85. [Google Scholar] [CrossRef]
  37. Baghdadi, N.; El Hajj, M.; Zribi, M.; Bousbih, S. Calibration of the Water Cloud Model at C-Band for Winter Crop Fields and Grasslands. Remote Sens. 2017, 9, 969. [Google Scholar] [CrossRef] [Green Version]
  38. Bai, X.; He, B. Potential of Dubois Model for Soil Moisture Retrieval in Prairie Areas Using SAR and Optical Data. Int. J. Remote Sens. 2015, 36, 5737–5753. [Google Scholar] [CrossRef]
  39. Du, J.; Shi, J.; Sun, R. The Development of HJ SAR Soil Moisture Retrieval Algorithm. Int. J. Remote Sens. 2010, 31, 3691–3705. [Google Scholar] [CrossRef]
  40. Fung, A.K. Microwave Scattering and Emission Models and Their Applications; Artech House: Norwood, MA, USA, 1994. [Google Scholar]
  41. Zribi, M.; Baghdadi, N.; Holah, N.; Fafin, O. New Methodology for Soil Surface Moisture Estimation and Its Application to ENVISAT-ASAR Multi-Incidence Data Inversion. Remote Sens. Environ. 2005, 96, 485–496. [Google Scholar] [CrossRef]
  42. Gorrab, A.; Zribi, M.; Baghdadi, N.; Mougenot, B.; Chabaane, Z. Potential of X-Band TerraSAR-X and COSMO-SkyMed SAR Data for the Assessment of Physical Soil Parameters. Remote Sens. 2015, 7, 747–766. [Google Scholar] [CrossRef] [Green Version]
  43. Singh, A.; Gaurav, K.; Kumar, S. Evaluating the Potential of Sentinel-1 Images for the Estimation of Soil Moisture on an Alluvial Fan. In Proceedings of the EGU General Assembly 2020, EGU2020-19614, Online, 4–8 May 2020. [Google Scholar]
  44. Kumar, P.; Prasad, R.; Choudhary, A.; Gupta, D.K.; Mishra, V.N.; Vishwakarma, A.K.; Singh, A.K.; Srivastava, P.K. Comprehensive Evaluation of Soil Moisture Retrieval Models under Different Crop Cover Types Using C-Band Synthetic Aperture Radar Data. Geocarto Int. 2019, 34, 1022–1041. [Google Scholar] [CrossRef]
  45. Njoku, E.G.; Wilson, W.J.; Yueh, S.H.; Dinardo, S.J.; Li, F.K.; Jackson, T.J.; Lakshmi, V.; Bolten, J. Observations of Soil Moisture Using a Passive and Active Low-Frequency Microwave Airborne Sensor during SGP99. IEEE Trans. Geosci. Remote Sens. 2002, 40, 2659–2673. [Google Scholar] [CrossRef]
  46. Das, N.N.; Entekhabi, D.; Njoku, E.G. An Algorithm for Merging SMAP Radiometer and Radar Data for High-Resolution Soil-Moisture Retrieval. IEEE Trans. Geosci. Remote Sens. 2011, 49, 1504–1512. [Google Scholar] [CrossRef]
  47. Zhan, X.; Houser, P.R.; Walker, J.P.; Crow, W.T. A Method for Retrieving High-Resolution Surface Soil Moisture from Hydros L-Band Radiometer and Radar Observations. IEEE Trans. Geosci. Remote Sens. 2006, 44, 1534–1544. [Google Scholar] [CrossRef]
  48. Parida, B.R.; Tripathi, G.; Pandey, A.C.; Kumar, A. Estimating Floodwater Depth Using SAR-Derived Flood Inundation Maps and Geomorphic Model in Kosi River Basin (India). Geocarto Int. 2021, 1–26. [Google Scholar] [CrossRef]
  49. Tripathi, G.; Pandey, A.C.; Parida, B.R. Flood Hazard and Risk Zonation in North Bihar Using Satellite-Derived Historical Flood Events and Socio-Economic Data. Sustainability 2022, 14, 1472. [Google Scholar] [CrossRef]
  50. Tripathi, G.; Parida, B.R.; Pandey, A.C. Spatio-Temporal Rainfall Variability and Flood Prognosis Analysis Using Satellite Data over North Bihar during the August 2017 Flood Event. Hydrology 2019, 6, 38. [Google Scholar] [CrossRef] [Green Version]
  51. Tripathi, G.; Pandey, A.C.; Parida, B.R.; Kumar, A. Flood Inundation Mapping and Impact Assessment Using Multi-Temporal Optical and SAR Satellite Data: A Case Study of 2017 Flood in Darbhanga District, Bihar, India. Water Resour. Manag. 2020, 34, 1871–1892. [Google Scholar] [CrossRef]
  52. Pandey, A.C.; Kaushik, K.; Parida, B.R. Google Earth Engine for Large-Scale Flood Mapping Using SAR Data and Impact Assessment on Agriculture and Population of Ganga-Brahmaputra Basin. Sustainability 2022, 14, 4210. [Google Scholar] [CrossRef]
  53. Tesfaye, K.; Aggarwal, P.; Mequanint, F.; Shirsath, P.; Stirling, C.; Khatri-Chhetri, A.; Rahut, D. Climate Variability and Change in Bihar, India: Challenges and Opportunities for Sustainable Crop Production. Sustainability 2017, 9, 1998. [Google Scholar] [CrossRef] [Green Version]
  54. Pandey, A.C.; Singh, S.K.; Nathawat, M.S. Waterlogging and Flood Hazards Vulnerability and Risk Assessment in Indo Gangetic Plain. Nat. Hazards 2010, 55, 273–289. [Google Scholar] [CrossRef]
  55. Rao, S.; Kumar, D.S.; Das, S.N.; Nagaraju, M.S.S.; Venugopal, M.V.; Rajankar, P.; Laghate, P.; Reddy, M.S.; Joshi, A.K.; Sharma, J.R. Modified Dubois Model for Estimating Soil Moisture with Dual Polarized SAR Data. J. Indian Soc. Remote Sens. 2013, 41, 865–872. [Google Scholar] [CrossRef]
  56. Topp, G.C.; Davis, J.L.; Annan, A.P. Electromagnetic Determination of Soil Water Content: Measurements in Coaxial Transmission Lines. Water Resour. Res. 1980, 16, 574–582. [Google Scholar] [CrossRef] [Green Version]
  57. Bauer-Marschallinger, B.; Freeman, V.; Cao, S.; Paulik, C.; Schaufler, S.; Stachl, T.; Modanesi, S.; Massari, C.; Ciabatta, L.; Brocca, L.; et al. Toward Global Soil Moisture Monitoring With Sentinel-1: Harnessing Assets and Overcoming Obstacles. IEEE Trans. Geosci. Remote Sens. 2019, 57, 520–539. [Google Scholar] [CrossRef]
  58. Singh, A.; Gaurav, K.; Rai, A.K.; Beg, Z. Machine Learning to Estimate Surface Roughness from Satellite Images. Remote Sens. 2021, 13, 3794. [Google Scholar] [CrossRef]
  59. Song, K.; Zhou, X.; Fan, Y. Empirically Adopted IEM for Retrieval of Soil Moisture From Radar Backscattering Coefficients. IEEE Trans. Geosci. Remote Sens. 2009, 47, 1662–1672. [Google Scholar] [CrossRef]
  60. Sinha, R. The Kosi Megafan: The Best-Known Himalayan Megafan. In Landscapes and Landforms of India; Kale, V.S., Ed.; World Geomorphological Landscapes; Springer: Dordrecht, The Netherlands, 2014; pp. 151–156. ISBN 978-94-017-8028-5. [Google Scholar]
  61. Singh, A.; Gaurav, K.; Meena, G.K.; Kumar, S. Estimation of Soil Moisture Applying Modified Dubois Model to Sentinel-1; A Regional Study from Central India. Remote Sens. 2020, 12, 2266. [Google Scholar] [CrossRef]
  62. Merzouki, A.; McNairn, H.; Pacheco, A. Mapping Soil Moisture Using RADARSAT-2 Data and Local Autocorrelation Statistics. IEEE J. Sel. Top. Appl. Earth Obs. Remote Sens. 2011, 4, 128–137. [Google Scholar] [CrossRef]
  63. Huang, X.; Ziniti, B.; Cosh, M.H.; Reba, M.; Wang, J.; Torbick, N. Field-Scale Soil Moisture Retrieval Using PALSAR-2 Polarimetric Decomposition and Machine Learning. Agronomy 2020, 11, 35. [Google Scholar] [CrossRef]
  64. Said, S. Modeling Surface Soil Moisture from Microwave Remote Sensing Data in Solani River Catchment, Uttarakhand, India. J. Geogr. Stud. 2017, 1, 3–10. [Google Scholar] [CrossRef]
  65. Gururaj, P.; Umesh, P.; Shetty, A. Modeling of Surface Soil Moisture Using C-Band SAR Data over Bare Fields in the Tropical Semi-Arid Region of India. Appl. Geomat. 2021, 13, 555–564. [Google Scholar] [CrossRef]
  66. Said, S.; Kothyari, U.C.; Arora, M.K. ANN-Based Soil Moisture Retrieval over Bare and Vegetated Areas Using ERS-2 SAR Data. J. Hydrol. Eng. 2008, 13, 461–475. [Google Scholar] [CrossRef]
  67. Paloscia, S.; Pettinato, S.; Santi, E.; Notarnicola, C.; Pasolli, L.; Reppucci, A. Soil Moisture Mapping Using Sentinel-1 Images: Algorithm and Preliminary Validation. Remote Sens. Environ. 2013, 134, 234–248. [Google Scholar] [CrossRef]
  68. El Hajj, M.; Baghdadi, N.; Zribi, M.; Belaud, G.; Cheviron, B.; Courault, D.; Charron, F. Soil Moisture Retrieval over Irrigated Grassland Using X-Band SAR Data. Remote Sens. Environ. 2016, 176, 202–218. [Google Scholar] [CrossRef] [Green Version]
  69. Hajnsek, I.; Jagdhuber, T.; Schon, H.; Papathanassiou, K.P. Potential of Estimating Soil Moisture Under Vegetation Cover by Means of PolSAR. IEEE Trans. Geosci. Remote Sens. 2009, 47, 442–454. [Google Scholar] [CrossRef] [Green Version]
Figure 1. The location of Kosi River Basin in north Bihar, India. The in-situ SSM measurements (N = 54 samples) over agriculture and barren land are overlaid on the False Color Composite (FCC) of Sentinel–2B acquired on 15 February 2021.
Agronomy 12 01045 g001
Figure 2. Measurement of in-situ SSM using TDR-300 at sample plots in KRB and the corresponding coordinates of S1 to S6 were provided in Table A1. The sample plots S1–S3 represent maize fields, whereas S4–S6 represent bare soil.
Agronomy 12 01045 g002
Figure 3. The flow chart illustrates the methodology used for the estimation of soil moisture from Sentinel-1 images.
Agronomy 12 01045 g003
Figure 4. Spatial distribution of estimated SSM (m3/m3) from C-band of Sentinel-1. Pixels shown in white correspond to the region where the NDVI mask was applied (>0.4).
Agronomy 12 01045 g004
Figure 5. The 1:1 scatter plot showing the relationship between in-situ SSM and satellite-derived moisture (n = 54). The dotted dash line represents the least square regression line.
Agronomy 12 01045 g005
Table 1. Details of the Sentinel–1A and Sentinel–2B images used in this study that are acquired from Copernicus.
Data UsedAcquisitionCharacteristicsPurpose
Sentinel-1A (VV)15 February 2021 (descending)10 m × 10 m
Incidence angle: 38.39°
Soil Moisture
Sentinel-2B16 February 202110 m × 10 m
Bands: 4 and 8
NDVI
Table 2. Weather conditions during the field campaign as per the IMD station located in Supaul and Muzaffarpur. Across all stations, there were no wet days recorded during this period and in the previous week.
AcquisitionTmax (°C)Tmin (°C)Rainfall
(mm)
SupaulMuzaffarpurSupaulMuzaffarpur
15 February 202127.925.415.414.60
16 February 202127.025.614.214.60
17 February 202126.526.615.715.70
18 February 202127.925.616.016.70
Table 3. Descriptive statistics of SSM using FieldScout TDR–300 over bare soil (n = 23) and vegetated agricultural fields (n = 31) during 15–18 February 2021. Similarly, crop height information has been shown.
LULCSSM (m3/m3)Crop Height (cm)
Mean (Min–Max)SD, CVMean (Min–Max)SD, CV
Bare soil0.23 (0.017–0.586)0.04, 0.17
Agricultural fields (maize, wheat)0.25 (0.022–0.598)0.05, 0.2020 (5–35)7.93, 0.44
Publisher’s Note: MDPI stays neutral with regard to jurisdictional claims in published maps and institutional affiliations.

