Article

Nitrogen Critical Level in Leaves in ‘Chardonnay’ and ‘Pinot Noir’ Grapevines to Adequate Yield and Quality Must

by
Adriele Tassinari
1,
Lincon Oliveira Stefanello
1,
Rai Augusto Schwalbert
2,
Beatriz Baticini Vitto
1,
Matheus Severo de Souza Kulmann
3,
João Pedro Jung Santos
1,
Wagner Squizani Arruda
1,
Raissa Schwalbert
4,
Tadeu Luis Tiecher
5,
Carlos Alberto Ceretta
1,
Lessandro De Conti
6,
Rafael Lizandro Schumacher
7 and
Gustavo Brunetto
1,*
1
Department of Soil Science, Federal University of Santa Maria (UFSM), Santa Maria 97105-900, Rio Grande do Sul, Brazil
2
Department of Agronomy, Kansas State University (KSU), Manhattan, KS 66506-0110, USA
3
Department of Forest Engineering, Federal University of Santa Maria (UFSM), Santa Maria 97105-900, Rio Grande do Sul, Brazil
4
Department of Phytotechnics, Federal University of Santa Maria (UFSM), Santa Maria 97105-900, Rio Grande do Sul, Brazil
5
Federal Institute of Rio Grande do Sul (IFRS), Campus Restinga, Porto Alegre 91791-508, Rio Grande do Sul, Brazil
6
Federal Institute Farroupilha (IFFar), Campus Santo Augusto, Santo Augusto 98590-000, Rio Grande do Sul, Brazil
7
Department of Enology, Federal University of Pampa (Unipampa), Dom Pedrito 96450-000, Rio Grande do Sul, Brazil
*
Author to whom correspondence should be addressed.
Agronomy 2022, 12(5), 1132; https://doi.org/10.3390/agronomy12051132
Submission received: 28 March 2022 / Revised: 4 May 2022 / Accepted: 4 May 2022 / Published: 7 May 2022
(This article belongs to the Special Issue Application of Organic Amendments in Agricultural Production)

Abstract

:
The nitrogen (N) critical level in leaves and maximum technical efficiency (MTE) doses contribute to the grape yield, must quality, and fertilizers rationalization. This study aimed to define sufficient ranges and critical levels in leaves and maximum technical efficiency doses to obtain high yields and quality must in grapevines grown in sandy soil in a subtropical climate. ‘Chardonnay’ and ‘Pinot Noir’ grapevines were subjected to the annual application of 0, 10, 20, 40, 60, and 80 kg N ha−1 in a vineyard. The nitrogen concentration in leaves at flowering and veraison, grape yield and grape must chemical parameters (total soluble solids—TSS, total titratable acidity—TTA and total anthocyanins—TA) were evaluated. The N critical level in leaves at flowering was different between grapevines cultivars, but this was not observed in leaves at veraison. It was possible to estimate MTE for ‘Chardonnay’ grapevines, in the evaluated growing seasons. In the range of higher probability of the N critical level in leaves, the TSS and TTA variables showed opposite responses, for both cultivars. This study proposes different N critical levels for red and white grapevines, in a subtropical climate.

1. Introduction

Sandy soils in vineyards do not provide the amount of nitrogen (N) needed by grapevines. Therefore, it is necessary to carry out N fertilization in vineyards [1,2]. Nitrogen needs and doses in several traditional wine regions worldwide can be established considering soil organic matter (SOM) or N concentration in the soil, in the form of nitrate concentration (NO3-N). However, SOM mineralization rate changes over time, and it influences NO3-N concentration in the soil. Additionally, NO3-N concentrations can be quickly reduced due to leaching losses and surface runoff, decreasing the N uptake by grapevines [3]. Thus, it is necessary to propose more stable reference values for plants, such as critical levels (CL) and sufficient ranges (SR) of N in leaves, and maximum technical efficiency (MTE) doses of fertilizers, which allows the maximization of resources.
Leaf analysis is one of the strategies adopted to determine N concentration in plants. The leaves can be collected at pre-set times, such as at flowering and veraison [4,5]. The recorded concentration can be related to grape yield or even to variables linked to grape must chemical features, such as total soluble solids (TSS) and total anthocyanins (TA), which determine alcohol concentration and wine color, respectively [6,7,8], as well as total titratable acidity (TTA), which defines wine stability [6,9]. Accordingly, it is possible define SR and/or CL in leaves, whose grape yield response does not demonstrate increment. Thus, N concentration below CL allows the nutrient application, mainly for MTE obtention.
Nitrogen SR and CL in grapevine leaves are often found in calibration experiments carried out with only a few cultivars, based on the relation between N concentration in the leaves and grape yield. Nevertheless, studies that address the relation of N doses, or even of CL, or yet, of SR, in the leaves with grape must physical-chemical variables remain scarce, although these elements are determinants of wine composition and quality. Therefore, it is essential to calibrate these variables in red grapevines, such as ‘Pinot Noir’, as well as in the white ones, such as ‘Chardonnay’, since they can be different in their vigor and root morphological parameters. These parameters are N absorption efficiency determinants, besides differing in grape yield potential [10,11].
However, SR and CL values in grapevine leaves and MTE doses are not always found in research results recorded during calibration experiments, because the adopted mathematical models do not always properly represent plant biological responses [12]. In Bayesian modeling, a priori information about the parameters to be estimated is used in association with the sample data by likelihood function [13,14]. This allows for combining information from previous knowledge, together with the problem data, thus generating a joint distribution at posteriori, so that: posteriori α likelihood x prior [14,15].
Previous research has shown that high N doses increase grapevine yield, but negatively influence grape must physical-chemical parameters [16,17]. Thus, it is necessary to define the best SR or CL in grapevine leaves and MTE doses to obtain a high grape yield coupled with adequate grape must chemical parameters. The study aimed to define nitrogen sufficient ranges and critical levels in leaves and maximum technical efficiency doses to obtain high yields and quality must in grapevines grown in sandy soil in a subtropical climate.

2. Materials and Methods

2.1. Experiment Description

The experiment was carried out in a vineyard planted in 2011 in Santana do Livramento (Latitude 30°48′31″ S; Longitude 55°22′33″ W, altitude 208 m), Campanha Gaúcha Region, Southern Brazil. The soil in the region is classified as Typic Hapludalf [18], based on the following physical-chemical features in the 0–20 cm soil layer: clay = 82 g kg−1, sand = 655 g kg−1 and silt = 251 g kg−1 (pipette method), soil organic matter = 10.6 g kg−1 (Walkley-Black method), water pH = 5.9 (ratio 1:1), exchangeable Ca, Mg and Al = 1.8, 1.4 and 0.0 cmolc kg−1, respectively (extracted by KCl 1 mol L−1), available P and K = 11.0 and 90.8 mg kg−1, respectively (extracted by Mehlich-1) and cation exchange capacity (CEC) at pH7.0 = 4.6 cmolc kg−1.
The climate in the region is classified as humid subtropical (Cfa) [19]. The mean temperature in the region is 18.4 °C and the mean annual rainfall is 1467 mm. Climatic variables, namely minimum, median, and maximum temperature, as well as accumulated monthly rainfall, were monitored in the experimental site throughout all of the assessed growing seasons (Figure 1). Cover plants Desmodium afinne Schltdl., Lolium multiflorum, Vicia sativa, and Raphanus raphanistrum and grasses native to the Pampa biome, such as Paspalum notatum, Paspalum plicatulum, and Axonopus affinis, prevailed between grapevine rows. Cover plants were cut three times, at 10 cm cutting height; their waste was deposited on the soil surface. Vegetation in grapevine rows was removed three times a year, on average, by using non-residual herbicide.
The study followed a completely randomized experimental design, with three repetitions; each repetition comprised ten plants. The eight central plants were considered useful plants. Two grapevine cultivars (Vitis vinifera L.), ‘Chardonnay’ and ‘Pinot Noir’, were assessed. Cultivars were grafted on Paulsen 1103 rootstock and conducted in an espalier system. The pruning system adopted was spur, with 12 buds per branch. The grapevines were planted in rows spaced 2.5 m from each other; plants were spaced 1.0 m from each other in the rows. Thus, there were 4000 plants per hectare in total. Treatments were applications of 0, 10, 20, 40, 60, and 80 kg N ha−1 year−1. Urea was the N source (45% total N). The N was applied on the soil surface, without incorporation, at grapevine canopy projection, within approximately 0.5 m wide lines, in comparison to the planting line. Nitrogen fertilizer application took place between September and October—this period corresponds to the budburst phase. The applications of N fertilizer occurred annually from 2011 onwards. Evaluations in the current study were carried out in the 2016/17, 2017/18, and 2018/19 growing seasons.

2.2. Leaf Collection and N Analysis

Complete leaves, positioned on the opposite side to the clusters, in the third partition of the branch of the year were collected in the 2016/17, 2017/18, and 2018/19 growing seasons at flowering and veraison. The leaves were dried in a forced-air circulation oven at 65 °C until constant mass was reached. Next, they were ground in a Willey-type mill and sieved in 2 mm mesh. The samples were subjected to sulfuric digestion [20]. Subsequently, digestion extract was distilled in N distiller micro-Kjeldahl (Tecnal, TE-0363, São Paulo, Brazil) and titrated in 0.025 mol L−1 of sulfuric acid for total N determination [20].

2.3. Grape Yield

All clusters in the plants were harvested in January in the 2016/17, 2017/18, and 2018/19 growing seasons. Clusters were weighed on a digital scale adjusted to three-digit accuracy (Walmur, Wa4434, Rio Grande do Sul, Brazil) to determine grape yield. Next, clusters from each repetition were reserved. Berries in the upper, median, and lower thirds of these clusters were selected and weighed (Bel Engineering, L303i, São Paulo, Brazil) to set the weight of 100 berries. Finally, they were reserved to determine grape must chemical parameters.

2.4. Grape Must Composition

The reserved berries were manually peeled, the pulp and seeds were separated from the peel. Total soluble solids (TSS), pH, and total titratable acidity (TTA) in the pulp and seeds were determined to analyze grape must chemical composition. Thus, TSS concentration in the samples was quantified by a straight determination in digital refractometer (Reichert Technologies, Brix/RI-Chek, New York, NY, USA). A benchtop digital pHmeter with automatic temperature control, previously calibrated with pH buffer solution (4.0 and 7.0), was used to determine hydrogen potential (pH). The TTA determination was carried out by using 10 mL of grape must added with NaOH 0.1 N and 1% phenolphthalein (color indicator), until the first pinkish shade persisted for approximately 30 s. Only the peel was used for total anthocyanin (TA) determination. TA determination was performed only in the red cultivar, based on the methodology described by [21].

2.5. Statistical Analysis

The variance of component analysis was carried out to measure the contribution of each variation source in the study (N dose, growing seasons, grapevine cultivars, interactions, and residues) to the total variation in response variables. The “varComp” package [22] of the R statistical environment [23] was used to do so. The mixed model was adjusted to test treatment significance (fixed and random effects) by taking into consideration the N doses, cultivars, and interaction among them as fixed effect blocks, and growing seasons were considered random effects. N dose effect on the response variables was assessed through regression analysis.
Linear regression with a plateau at the 95% percentile was used to quantify the association between grape yield and N concentration in the leaves (at flowering and veraison). We used hierarchical Bayesian models that allowed us to explore all regression lines possible. Two hierarchical levels were taken into account in this analysis: cultivar (cultivar- growing seasons studies) and global. The prediction parameter was defined as the inverse of the variation; the more precise the prediction, the smaller the variation. All previous distributions were configured to embody great variations; they did not have much influence on the analysis in comparison to the observed data [24]. The subsequent distributions were found through Monte Carlo simulation of the Markov chain [25] with one Gibbs sampling algorithm, which presented 20 thousand random drawings after 10-thousand interaction heating time. The “rjags” package [26] was used to build all the models.
The same approach was adopted to estimate the maximum technical efficiency (MTE) doses, but this association was assumed as quadratic at plateau behavior, rather than linear. Assumingly, MTE doses were calculated at 90% maximum grape yield. In addition, a principal component analysis (PCA), which combined all response variables assessed in the three growing seasons, was carried out in the “FactorExtra” package [27]. PCA was performed based on a set of components (in this case, we use PC1 and PC2), which comprised a whole set of standardized orthogonal linear combinations that, all together, explained the original data variance.

3. Results

3.1. Variance Components

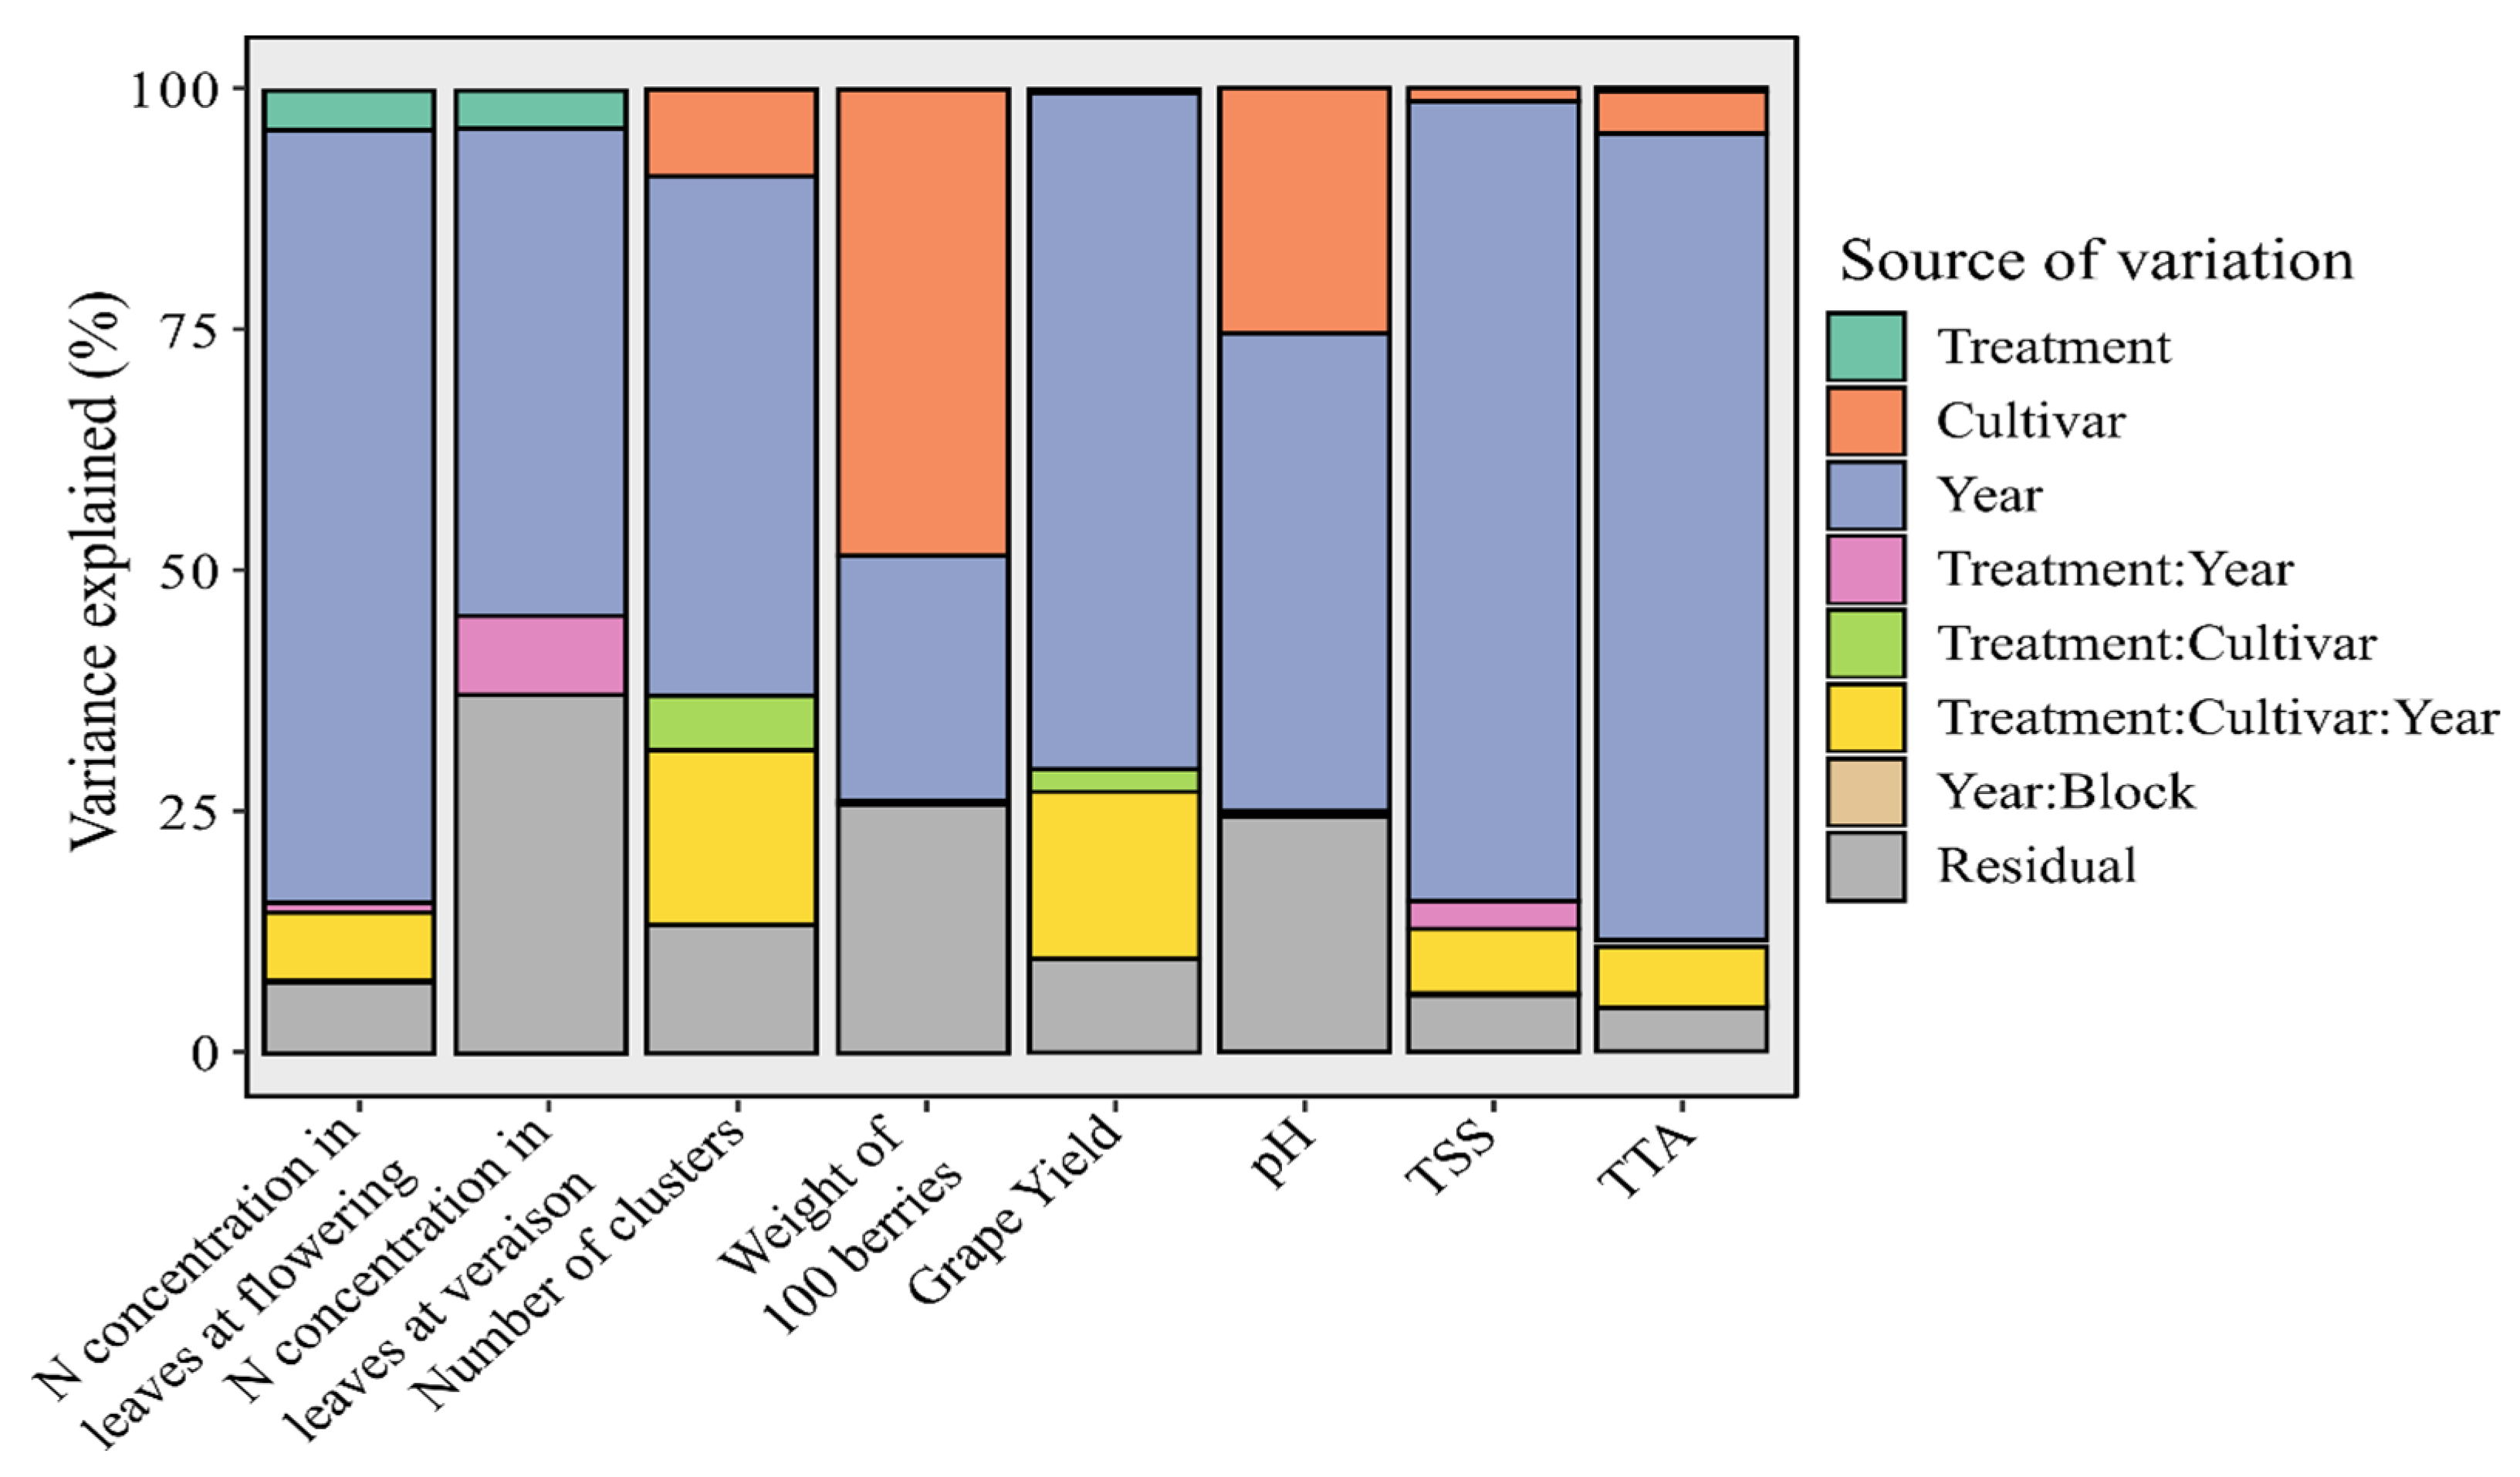
The analysis of variance components showed the great influence of growing seasons (year) on most response variables, with emphasis on N concentration in the leaves at flowering, grape yield, and TSS and TTA concentrations (Figure 2). N doses did not change the N concentrations in the leaves much. The cultivar effect explained approximately 50% variation in the weight of 100 berries and almost 10% in the number of clusters (Figure 2). Furthermore, the cultivar effect accounted for 25% of pH value variations in grape must (Figure 2).

3.2. N Critical Levels in Leaves

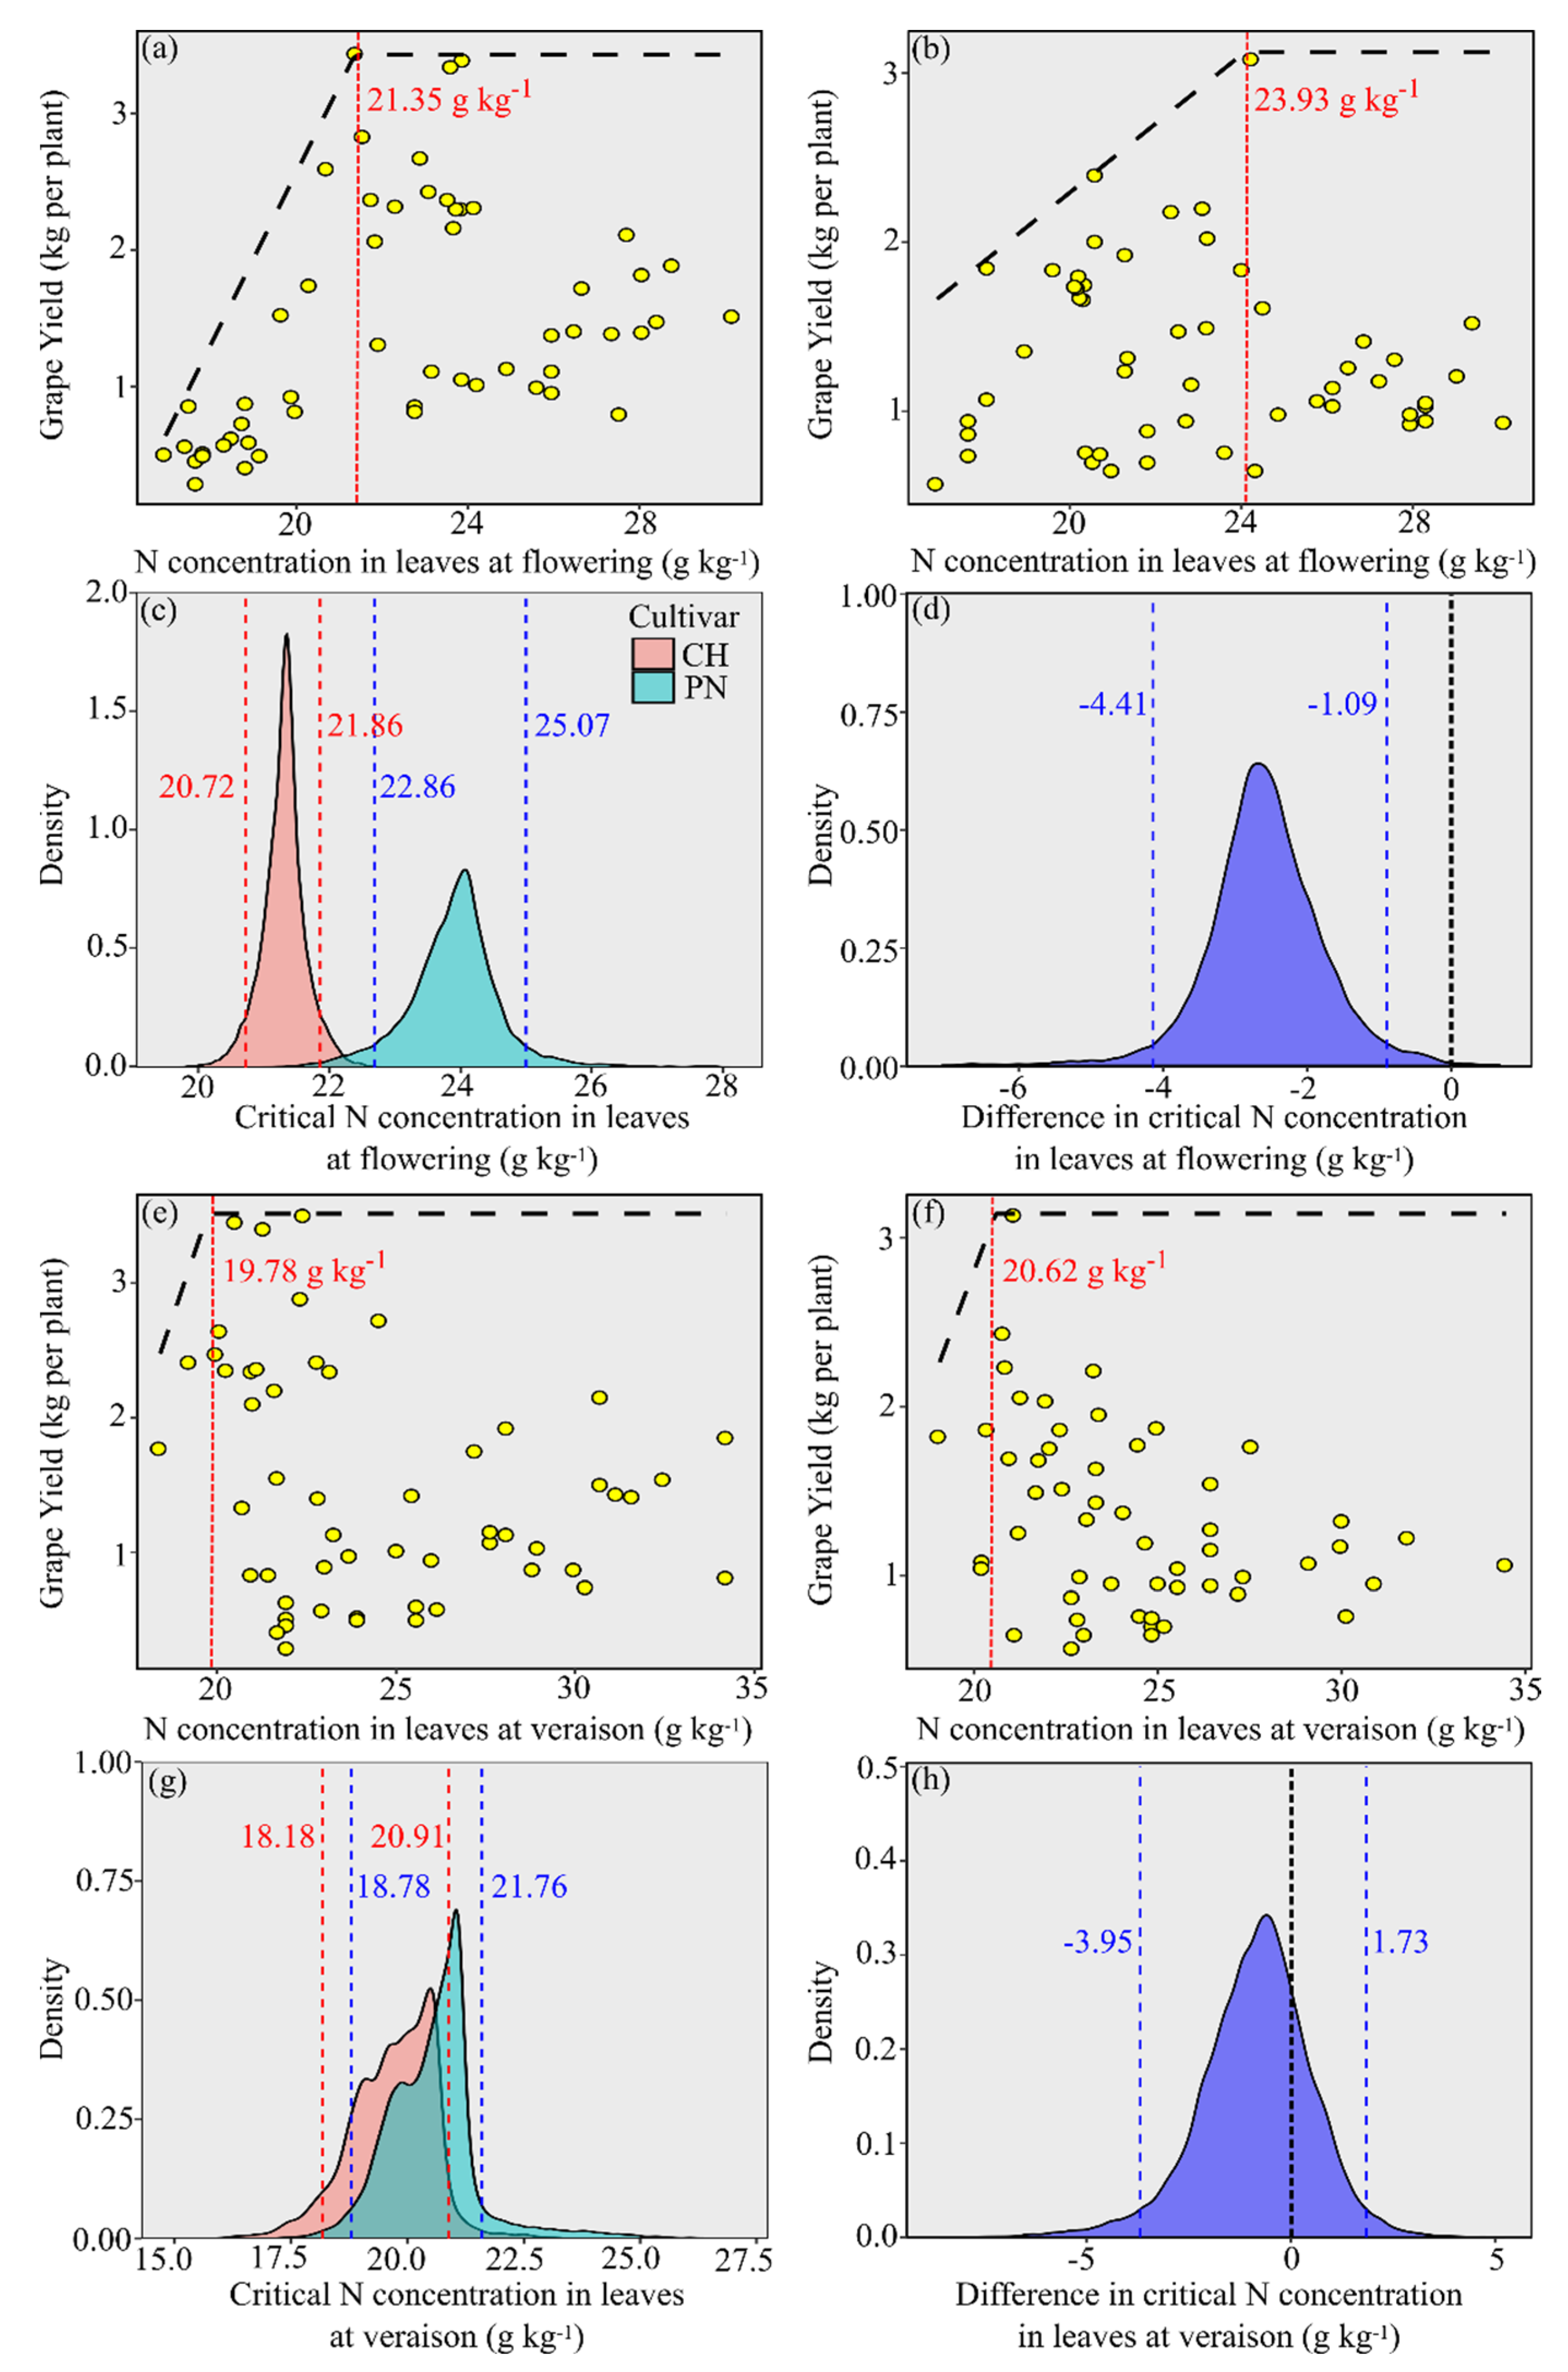
The N critical levels in the leaves at flowering reached 21.35 g N kg−1 (Figure 3a) and 23.93 g N kg−1 (Figure 3b) in the cultivars ‘Chardonnay’ and ‘Pinot Noir’, respectively. The highest possibility of critical N concentration occurrence in the leaves, based on the density of value distributions, ranged from 20.72 to 21.86 g N kg−1 in the cultivar ‘Chardonnay’ and from 22.86 to 25.07 g N kg−1 in the cultivar ‘Pinot Noir’ (Figure 3c). Thus, according to the distribution amplitude between differences in critical N concentrations between cultivars (from −4.41 to −1.09 g kg−1), the critical N concentrations are different (they did not reach the black dashed line, which refers to zero) (Figure 3d).
The critical N concentration was similar between cultivars in leaves collected at veraison. N critical levels in the leaves at veraison were 19.78 g N kg−1 (Figure 3e) and 20.62 g N kg−1 (Figure 3f) in the cultivars ‘Chardonnay’ and ‘Pinot Noir’, respectively. The highest probability of critical N concentration occurrence at veraison, based on the density of value distributions, ranged from 18.18 to 20.91 g N kg−1 in the cultivar ‘Chardonnay’ and from 18.78 to 21.76 g N kg−1 in the cultivar ‘Pinot Noir’ (Figure 3g). Thus, it was possible observe that according to the distribution amplitude between critical N concentrations differences between cultivars (from −3.95 to 1.73 g kg−1), critical N concentrations are not different (they reached the black dashed line, which refers to zero) (Figure 3h). Moreover, the N concentration in the leaves in both cultivars and the critical concentrations of it were lower at veraison (Figure 3c,g).

3.3. Maximum Technical Efficiency (MTE) Doses

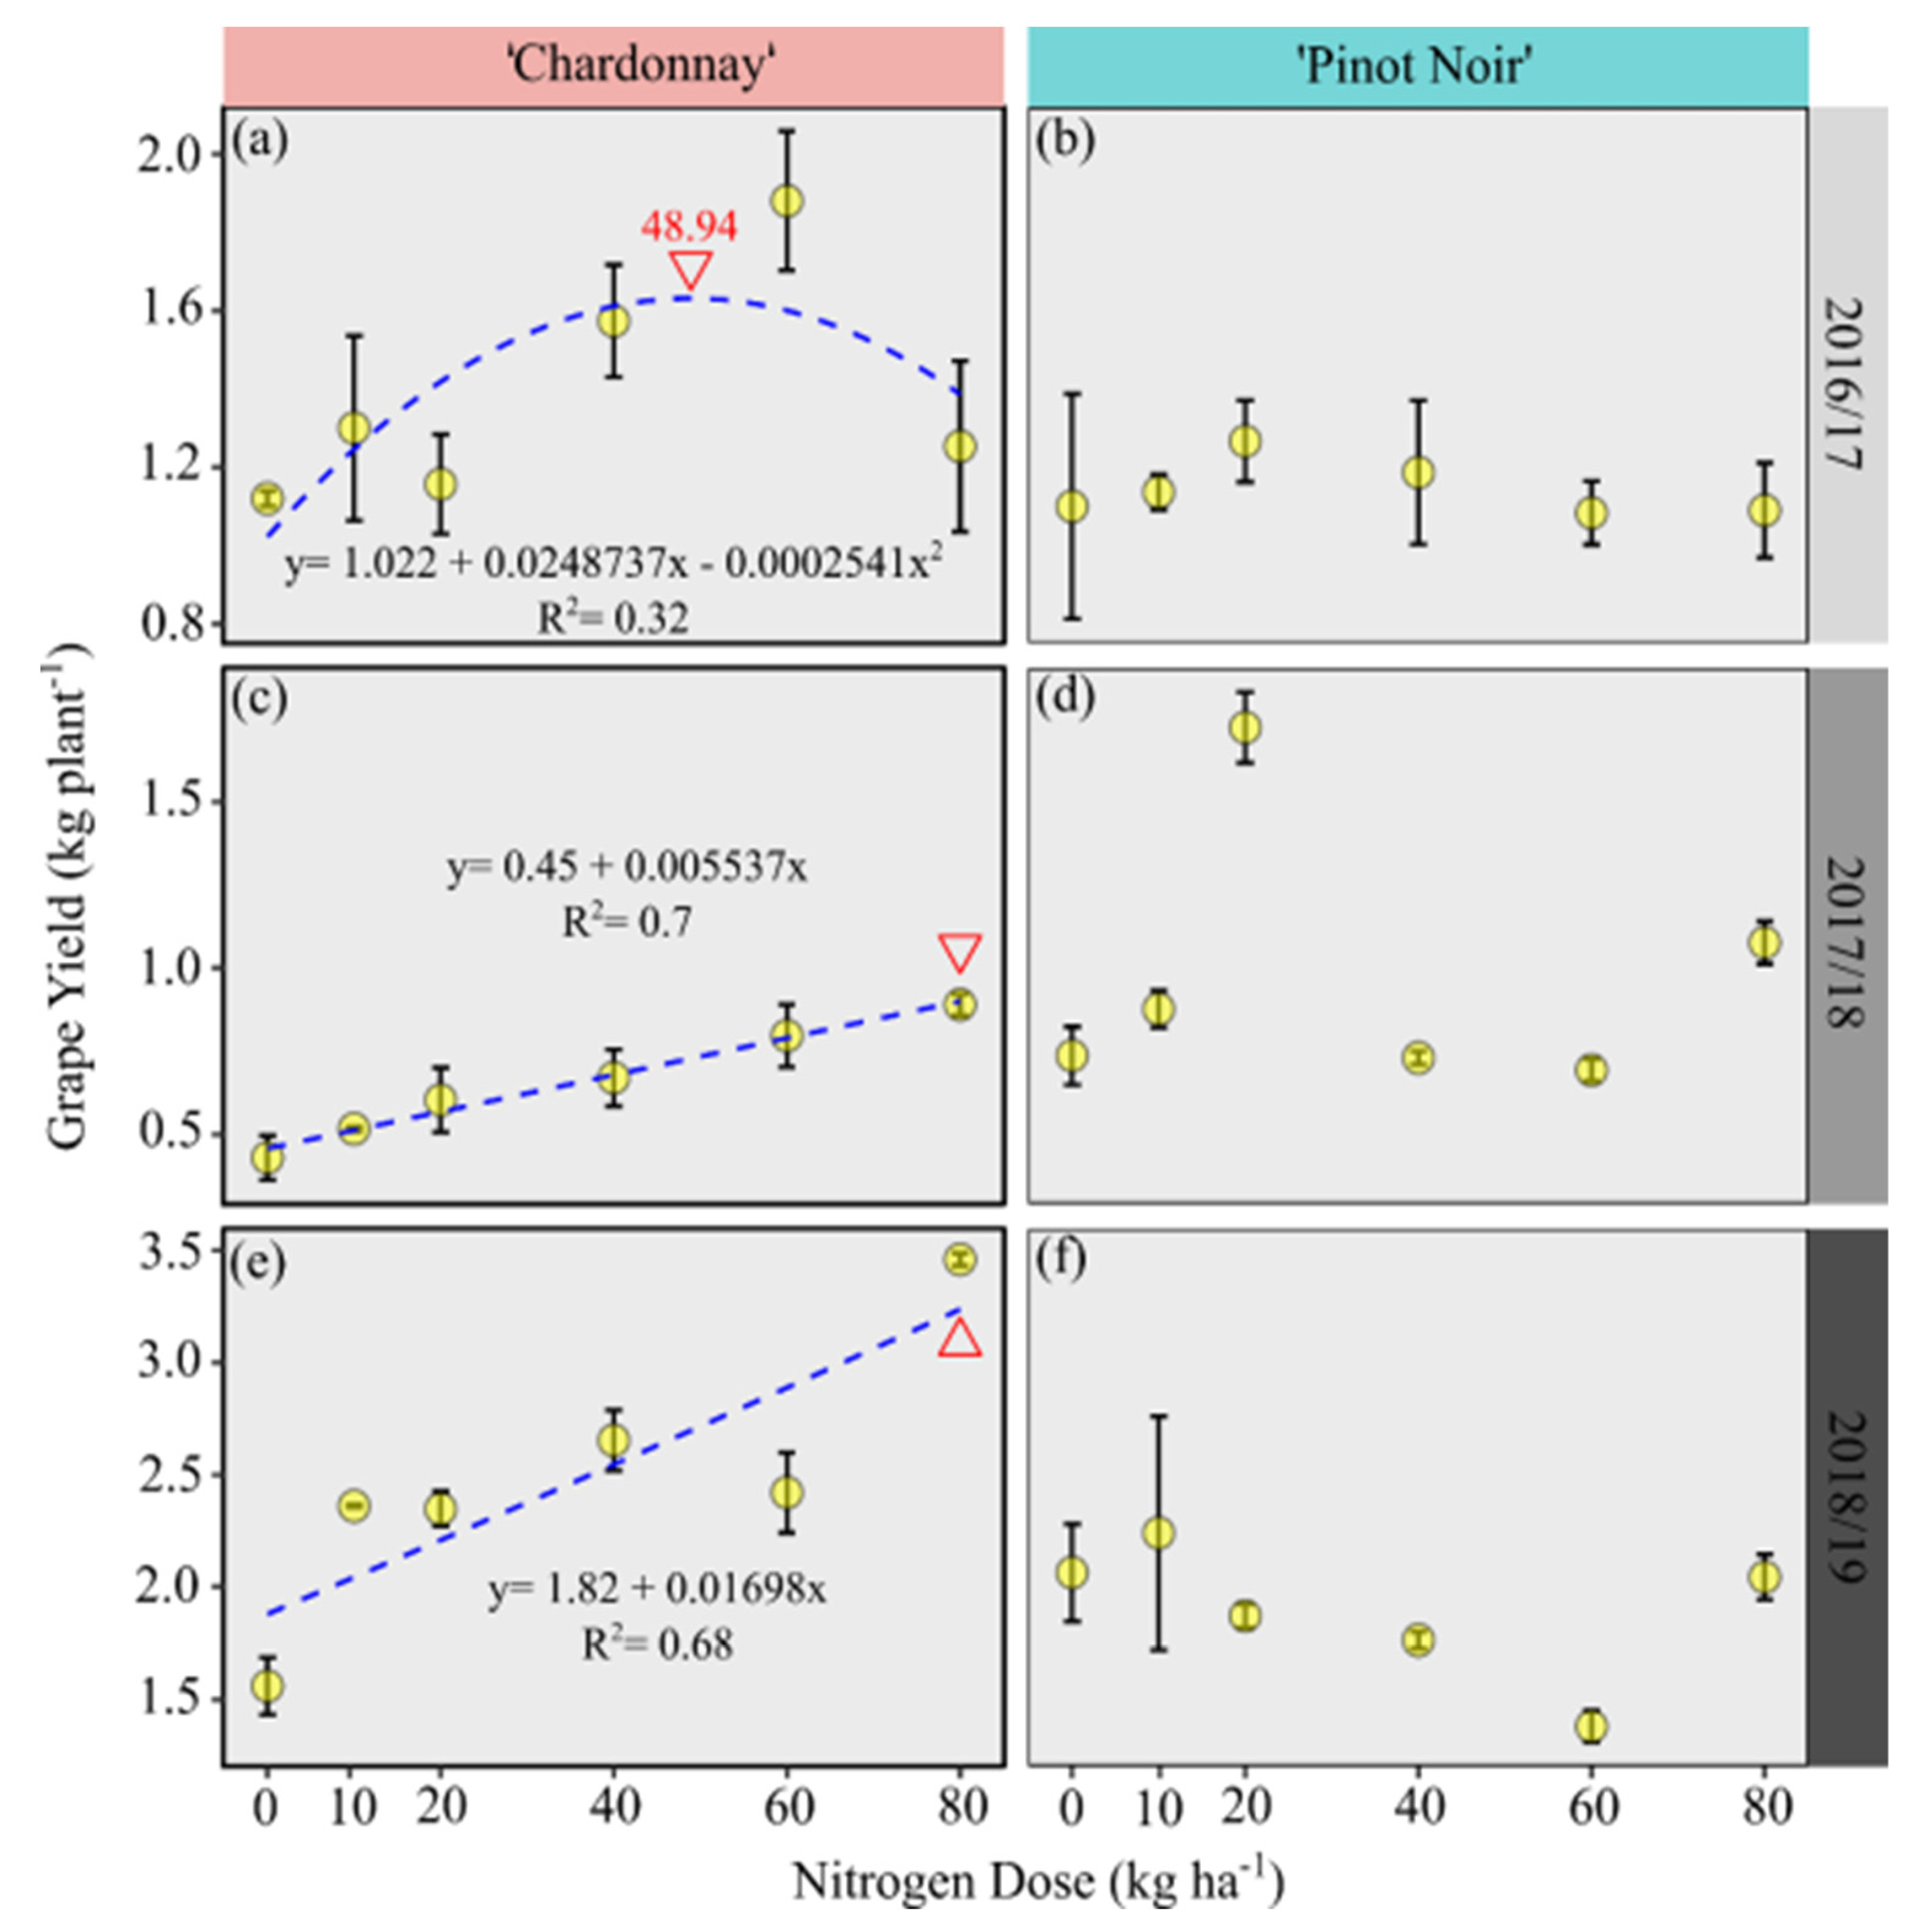
The MTE dose in the cultivar ‘Chardonnay’ was found through the application of approximately 50 kg N ha−1 in the 2016/17 growing season (Figure 4a) and of 80 kg N ha−1 in the 2017/18 and 2018/19 growing seasons (Figure 4c,e). On the other hand, it was not possible to adjust the MTE dose to the cultivar ‘Pinot Noir’ in any of the assessed growing seasons (Figure 4b,d,f).

3.4. Relationship between N Concentration in Leaves and Grape Must Composition for ‘Chardonnay’

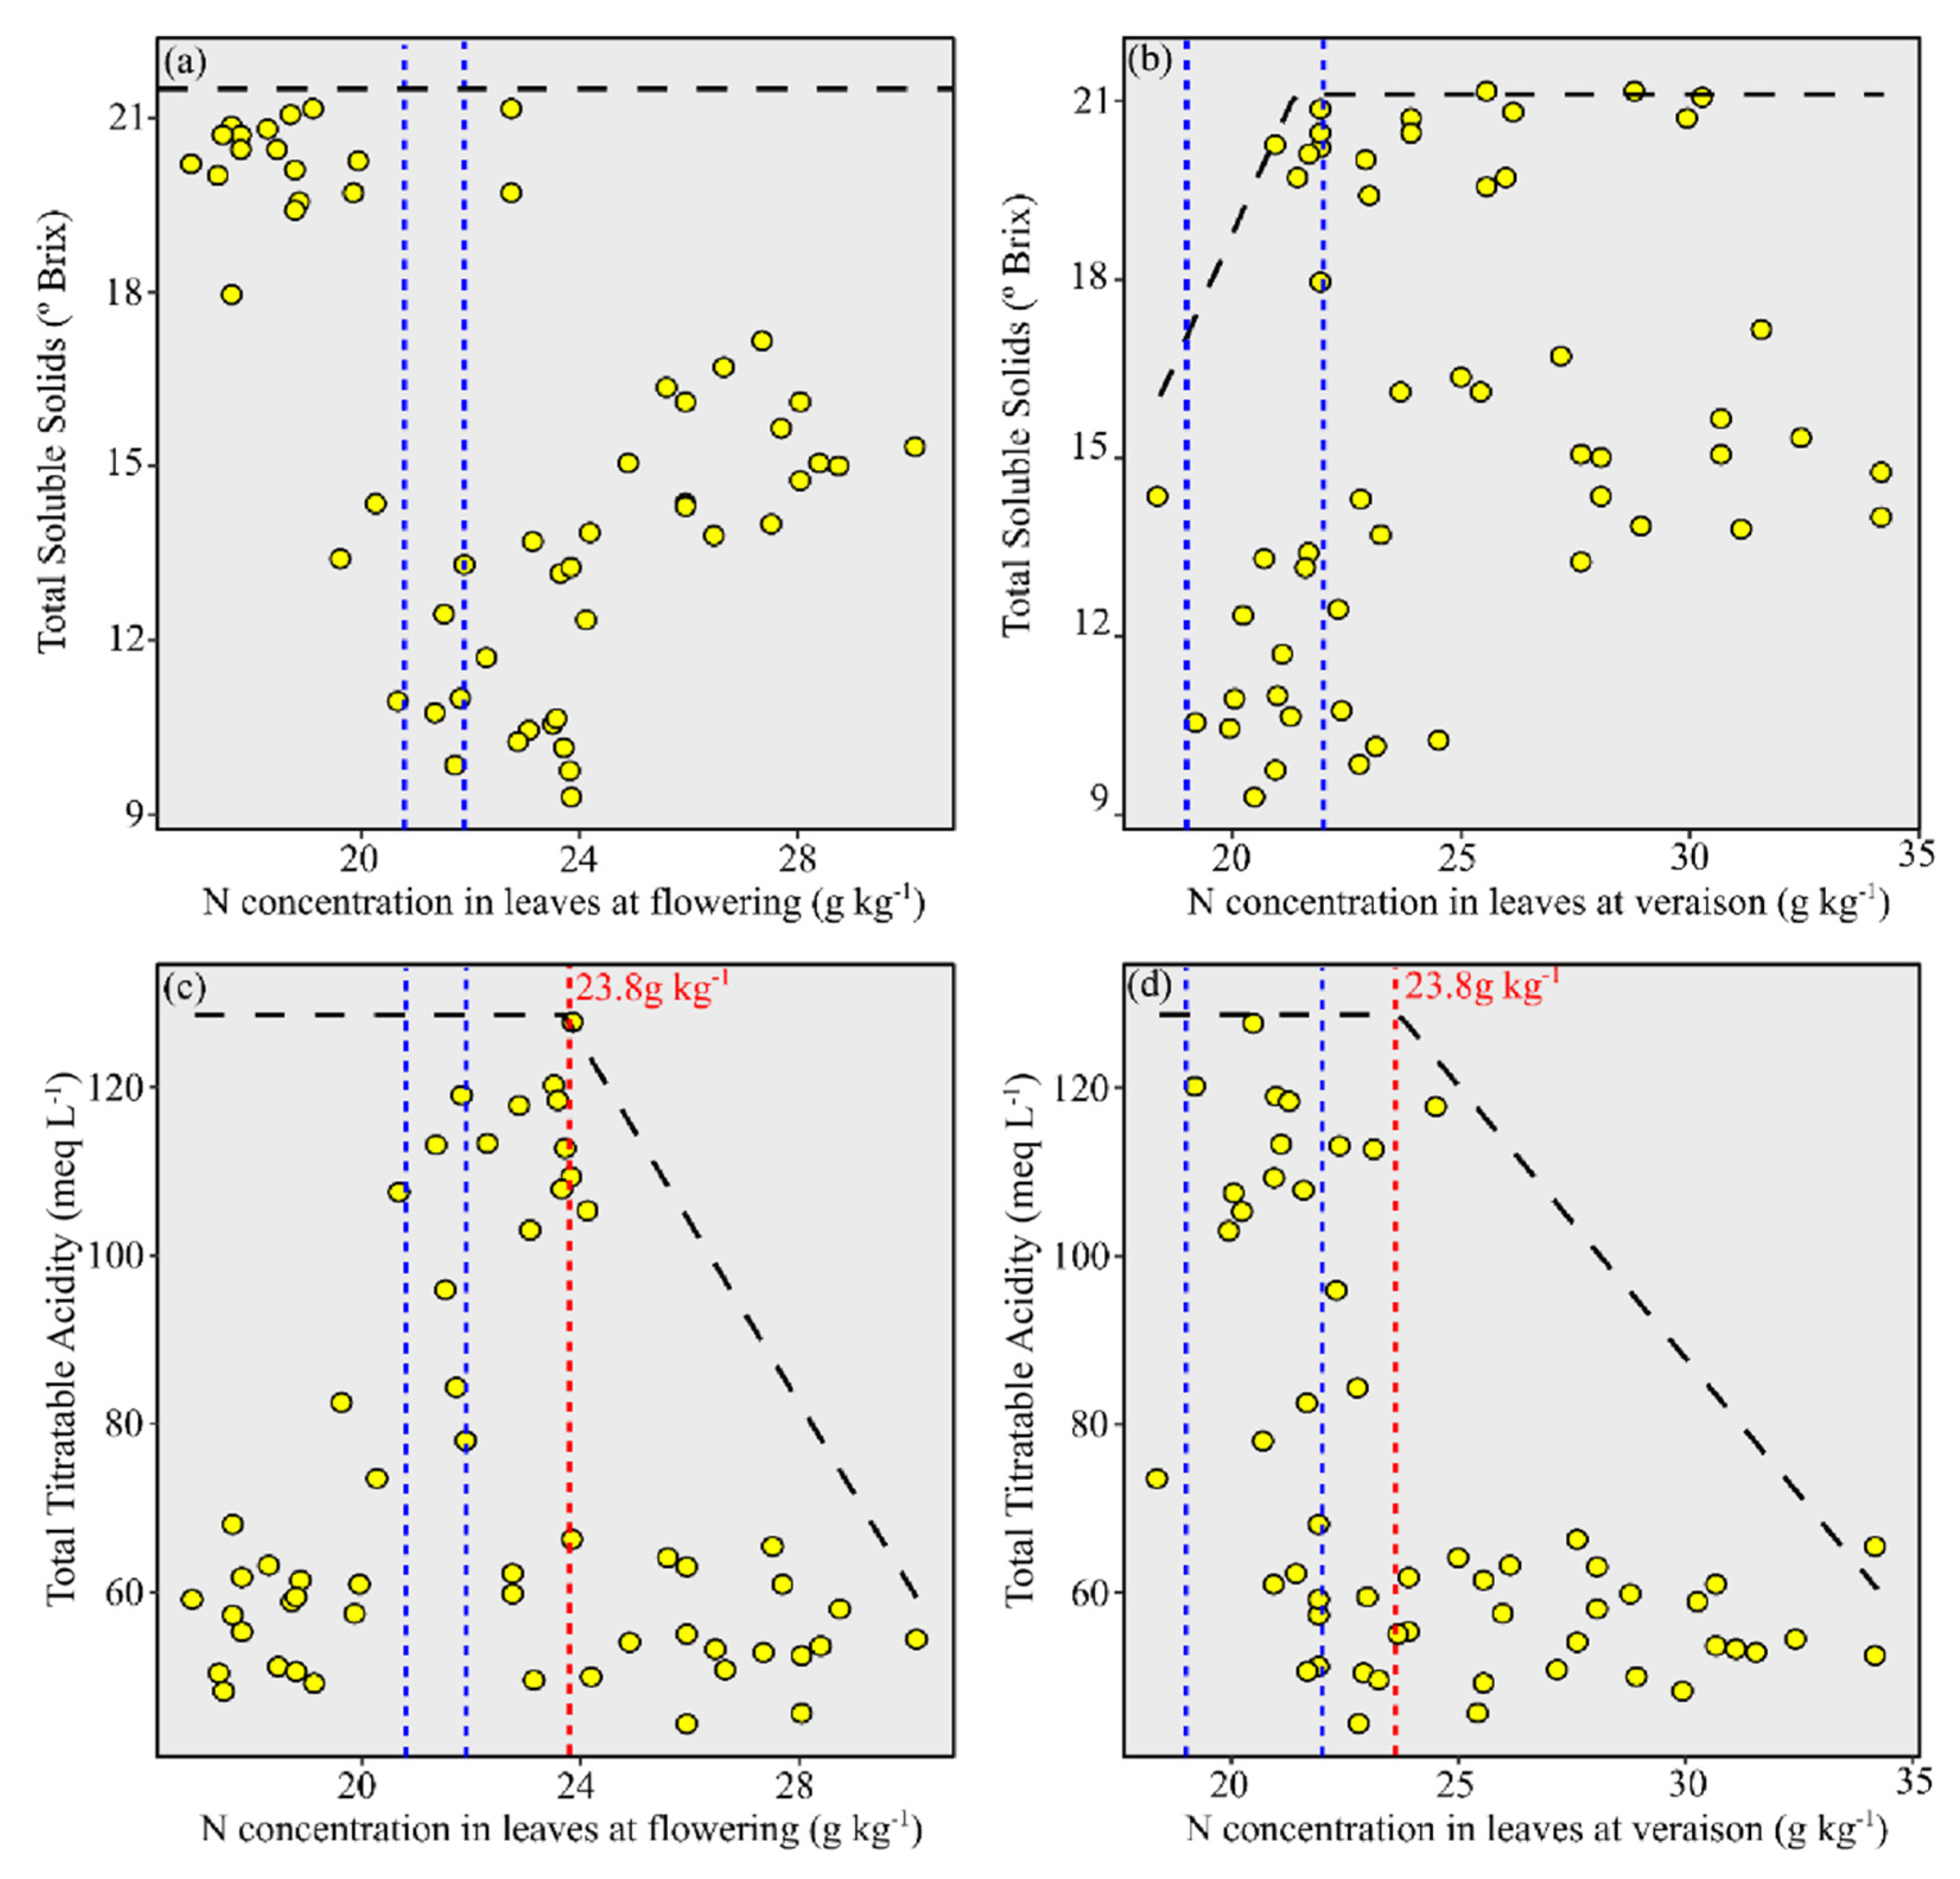
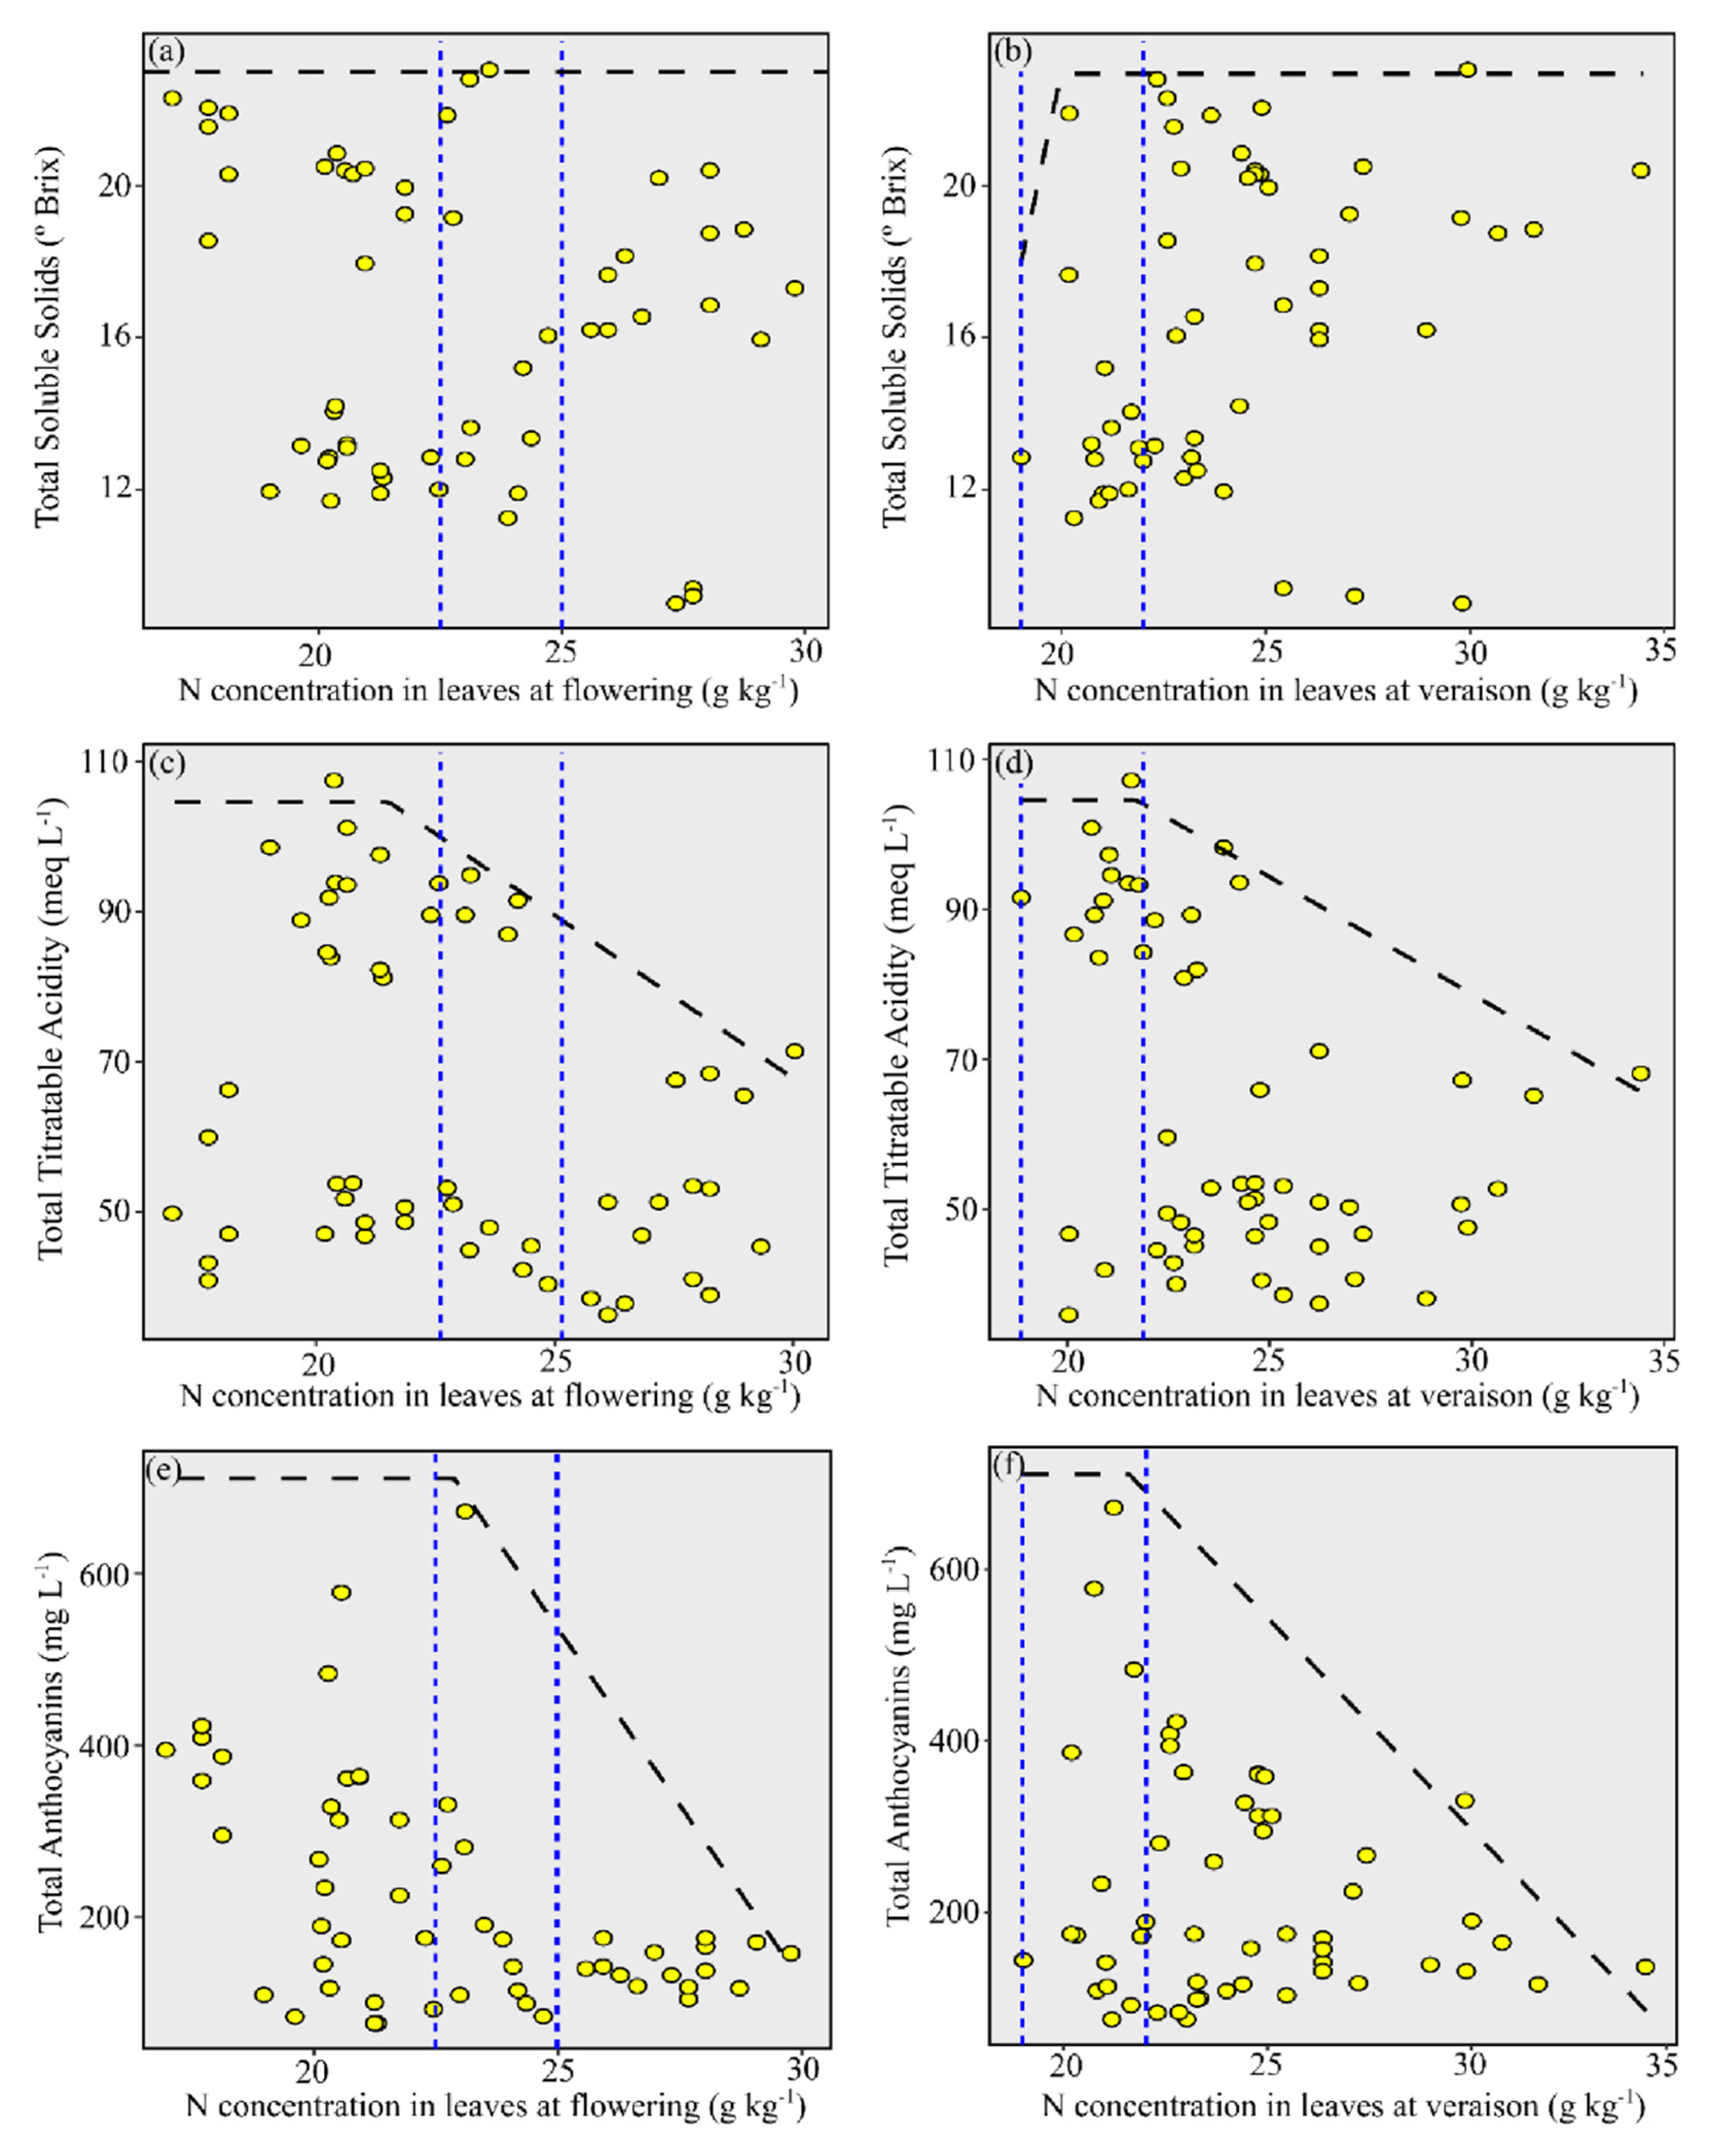
Based on the highest probability of critical level occurrence (Figure 3c), it was possible to draw the relation between some grape must quality parameters and N concentration in the leaves. However, there was no clear relation between N concentration in leaves collected at flowering and TSS concentration (Figure 5a). On the other hand, there was a relationship between TSS concentration and N in the leaves at veraison, with increased TSS concentration (Figure 5b). Concerning the relationship between TTA concentration and N in the leaves at flowering and veraison, it was possible observing a substantial decrease in TTA values after the probability range (Figure 5c,d).

3.5. Relationship between N Concentration in Leaves and Grape Must Composition for ‘Pinot Noir’

There was no relation between N concentration in the leaves at flowering and TSS in the ‘Pinot Noir’ cultivar (Figure 6a). On the other hand, there was a relationship between TSS concentration and N in the leaves at veraison, with increased TSS concentration. However, close to the upper borderline of the N critical level in leaves, the TSS values tended to stabilize (Figure 6b). TTA concentrations decreased when N concentration in the leaves (at flowering) was within the critical N concentration range (Figure 6c). However, when the N concentration in the leaves at veraison was higher than the upper borderline of critical N in the leaves, there was a substantial TTA value decrease (Figure 6d). Nitrogen concentration in the leaves at both collection times presented a negative relationship with total anthocyanin (TA) concentration. However, at flowering, the TA values decreased in the probability range (Figure 6e), while at veraison, the TA values tended to decrease after the probability range of occurrence of the N critical level (Figure 6f).

3.6. Principal Component Analysis (PCA)

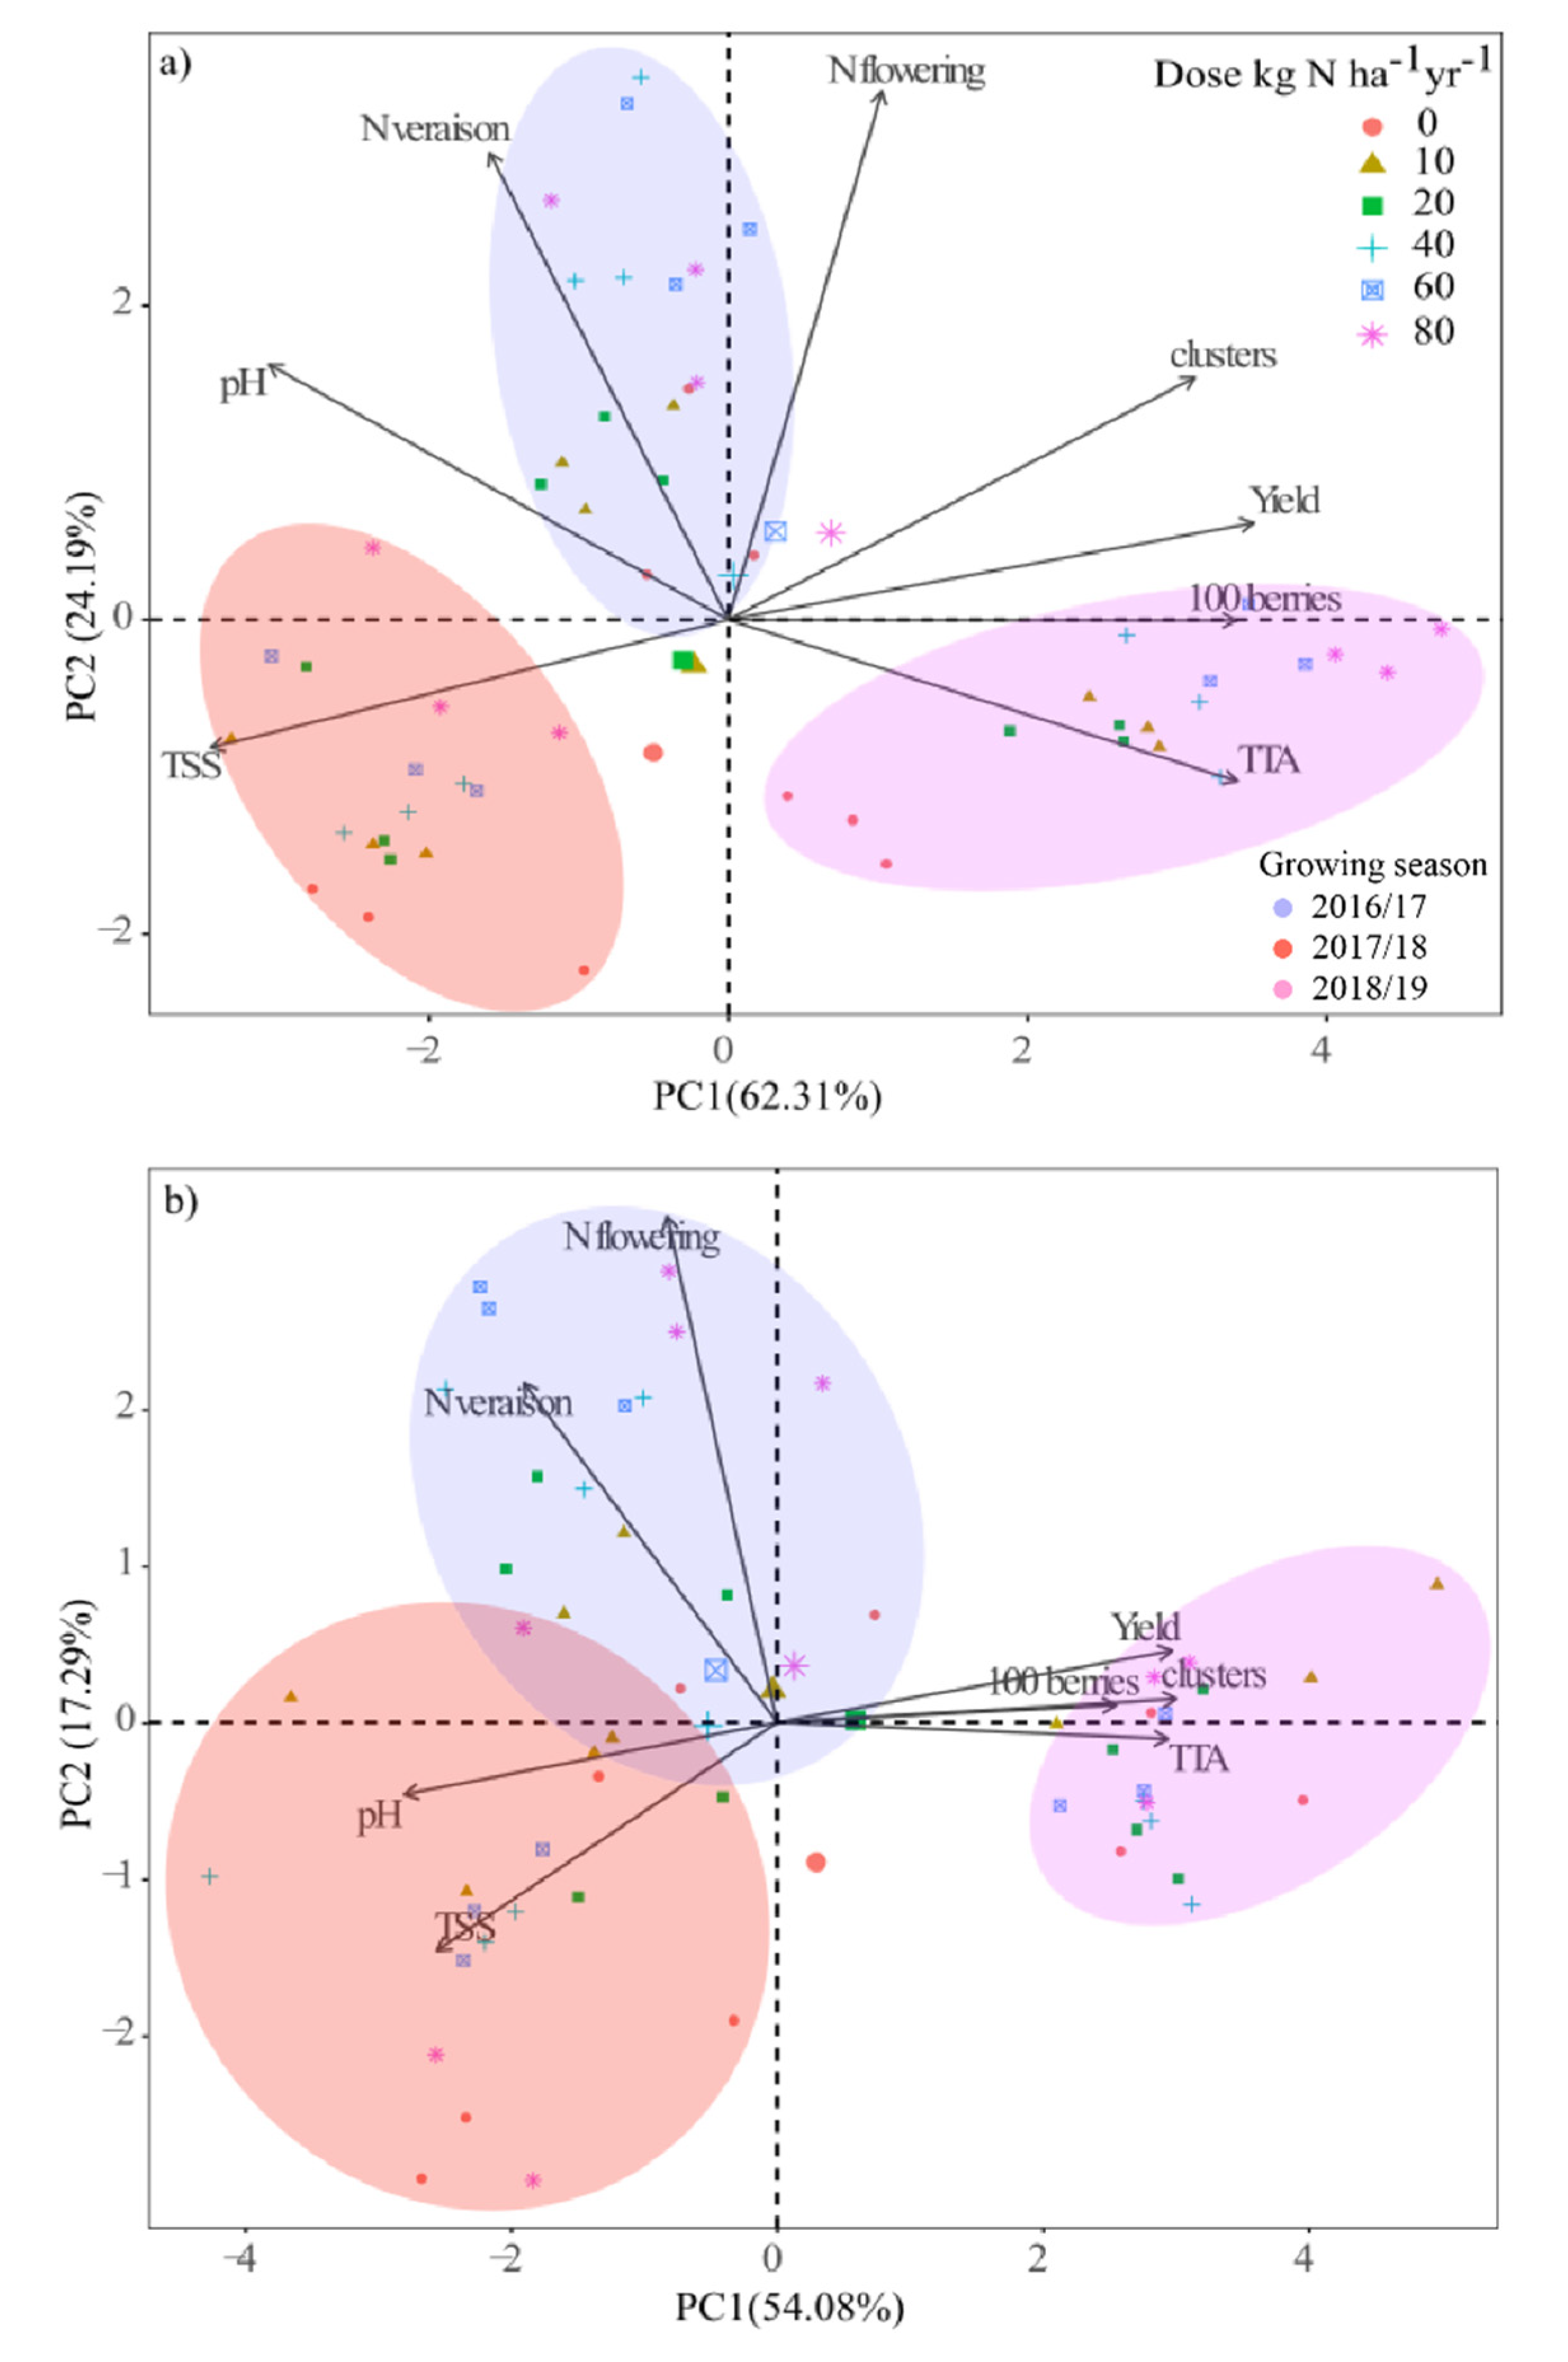
Principal component 1 (PC1) of the cultivar ‘Chardonnay’ explained 62.31% of data variability and allowed for visualizing growing season behavior (delimited by different ellipses) in comparison carried out based on the response variables (Figure 7a). The 2018/19 growing season and the highest N doses (60 and 80 kg N ha−1 year−1) were to the right of the spatial distribution and positively related to production variables such as grape yield, 100 berry weight, cluster number, and TTA (Figure 7a). These outcomes show that the 2017/18 growing season and the lowest doses (0, 10, and 20 kg N ha−1 year−1) were positioned to the left of the spatial distribution and were positively related to variable TSS. Principal component 2 (PC 2) explained 24.19% of data variability and was efficient in separating the behavior of the 2016/17 growing season, which was influenced by N veraison and N flowering variables.
Principal component 1 (PC 1) of the cultivar ‘Pinot Noir’ explained 54.08% of data variability (delimited by the ellipses) and was efficient in separating growing season based on response variables (Figure 7b). The variables pH and TSS were mostly influenced by the 2017/18 growing season and by the dose of 40 kg N ha−1 year−1. These outcomes presented a negative linear correlation with the 2018/19 growing season, at a dose of 20 kg N ha−1 year−1, as well as with the variables yield, 100 berry weight, cluster number, and TTA, which were positioned to the right of the spatial distribution and were positively correlated with each other. Principal component 2 (PC 2) explained 17.29% of data variability and clarified the behavior of N veraison and N flowering response variables, which were mostly influenced by the higher N doses (60 and 80 kg N ha−1 year−1) based on the 2016/17 growing season.

4. Discussion

The climatic conditions of the present study contribute to explaining some of the results obtained, such as, e.g., the greatest rainfall volumes recorded in September and October in the 2017/18 growing season (Figure 1) met the time of N dose application, which may have increased N losses in its mineral form through solution runoff or, mainly, through leaching, since the assessed soil had low clay and SOM concentrations (82 g kg−1 and 11 g kg−1, respectively). These losses tend to decrease the use of N applied by the grapevine, which might lead to lower N absorption by plants, leading to lower N concentration in the leaves [21]. Such a reduction can decrease chlorophyll concentration in the leaves and, consequently, influence the electron transportation rate in the chloroplasts and decrease the photosynthetic rate [28]. In addition, the carboxylation process also gets compromised, since important enzymes of the Calvin cycle, such as RuBisCo, have their synthesis reduced due to low N concentrations [29]. These changes in leaf photosynthetic potential limit reserve accumulation in the form of starch, a fact that decreases growth ability and likely reduces yield. On the other hand, the greatest rainfall volumes at grape maturation time, which were observed in January, in the 2018/19 growing season, may have favored berry size but also diluted TSS and anthocyanins in red grapes. Furthermore, January is often the month presenting the highest air temperatures in the region where the current research was carried out, and such temperatures stimulate an anthocyanin concentration decrease in grapes due to anthocyanin inhibition and chemical and enzymatic degradation [30,31,32].
However, the cultivar effect was observed in the response variables mainly related to yield parameters, such as the weight of 100 berries and number of clusters. This outcome can be attributed to behaviors intrinsic to the assessed cultivars, which present lightly different berry sizes. Such a feature can influence grape must physical-chemical attributes because anthocyanin concentrations and phenolic compounds are related to peel relative mass and berry size [33].
In this study, we detect for the first time values of N critical levels for white and red cultivars, so that the highest values of N critical levels in leaves were slightly observed in the cultivar ‘Pinot Noir’. This behavior may be related to kinetic absorption parameters that can be different between grapevine cultivars [34,35], which may contribute to explaining why the N critical levels in the leaves collected during flowering were different between the cultivars ‘Chardonnay’ and ‘Pinot Noir’. On the other hand, the smallest values of critical levels occurred at veraison when compared to flowering can be due to the dilution and degradation of N compounds, which are followed by N redistribution to growing organs, such as the branch of the year and clusters. These organs are the main nutrient drains at the culture-cycle development stage [1,36]. Thus, N concentration in the leaves is expected to decrease and to make leaves less sensitive to N concentration diagnostic inside the grapevines [37]; it could even explain the equal N concentrations between leaves in both cultivars at veraison.
The decrease in ‘Chardonnay’ grape yield with high doses of N (60 and 80 kg N ha−1), which can be seen in 2016/17, defines the MTE dose for this season at half that estimated for the 2017/18 and 2018/19. This can be attributed to the differences in rainfall during the year; we noticed that in the 2016/17 harvest, there was less rainfall and low minimum temperature in the period regarding the sprouting of vines, which may have slightly compromised the inflorescence. On the other hand, the MTE dose in ‘Pinot Noir’ could not be calculated as there was no fertilization effect on yield components.
Here, we detect for the first time the proposition of the N sufficiency range being related to the must variables. From there, the lack of clarity in behavior with regard to the TSS concentration in comparison with N concentration in ‘Chardonnay’ and ‘Pinot Noir’ cultivars at flowering may have occurred because of the transition between the phase of reserve mobilization and the phase of leaf assimilate export. On the other hand, in leaves collected at veraison, the increment of TSS values in grape must occurred in both cultivars. Such an outcome may have happened because sugar accumulation in fruits started at veraison and went on throughout the maturation stage [38]. TTA values decreased in ‘Chardonnay’ and ‘Pinot Noir’ grape must depending on the N concentration increasing in the leaves when leaves were collected at flowering and veraison. This process may have happened because grapevines subjected to N application via fertilizer tend to have a greater shoot organ vigor, including clusters with bigger berries; such a feature can contribute to the dilution of organic acids in fruits [21,36].
In the ‘Pinot Noir’ cultivar, there was an increase in N concentrations in leaves collected at flowering and veraison, while in leaves collected at flowering the TA values in grape must decreased. This process can happen because of the excess of applied N, which, in turn, can stimulate shoot vegetative growth and increase shading over the berries. Consequently, this process decreases total anthocyanins formation in the berries [39,40]. In addition, some of the anthocyanins in grapevines—representing vigorous shoots—can migrate to the berries and the growing organs [41]. It is known that there are differences between grapevine cultivars based on sugar concentration in grapes at the beginning of anthocyanin synthesis [42]. This process can be related to the photosynthesis process, which provides reduced C for sugar accumulation in fruits. Additionally, sugar production is larger at veraison, to the detriment of anthocyanin production [43]. Anthocyanin gives color to, and has antioxidant activity in grapes and, later, in wine. Accordingly, the composition and concentration of anthocyanins play a key role in the color stability of red wine [44,45]; therefore, their dilution tends to influence wine stability. However, as the vine invests N compounds in the clusters and berries, there is an increase in the weight values of 100 berries and the number of clusters (data not shown) due to the increase in the doses of N applied via fertilizer.

5. Conclusions

Nitrogen critical levels in the leaves of the cultivars ‘Chardonnay’ and ‘Pinot Noir’ collected at flowering were 21.35 and 23.93 g N kg−1, respectively, whereas in leaves collected at veraison these levels were 19.78 and 20.62 g N kg−1 in the cultivars ‘Chardonnay’ and ‘Pinot Noir’, respectively. This reminds us that flowering is an appropriate time for evaluation, since, at veraison, the range of the critical N level was lower when compared to flowering, which indicates that the grapevine has a greater use for N before this period.
From the higher probability range of occurrence of N critical level, the TSS and TTA values presented opposite behaviors, which requires estimating the priority in the analyzed variable.
The maximum technical efficiency (MTE) dose of N adjusted for the ‘Chardonnay’ cultivar was approximately 50 kg N ha−1 in the 2016/17 growing season and 80 kg N ha−1 in the 2017/18 and 2018/19 growing seasons. It was not possible to mathematically adjust satisfactory MTE doses of N models for ‘Pinot Noir’ grapevines.

Author Contributions

Conceptualization, A.T., L.O.S., C.A.C. and G.B.; methodology, A.T., L.O.S. and G.B.; formal analysis, R.A.S. and M.S.d.S.K.; investigation, A.T., L.O.S., B.B.V., M.S.d.S.K., J.P.J.S. and W.S.A.; writing—original draft, A.T.; writing—review and editing, A.T., L.O.S., R.S., T.L.T., C.A.C., L.D.C., M.S.d.S.K., R.L.S. and G.B.; supervision and project administration, C.A.C. and G.B. All authors have read and agreed to the published version of the manuscript.

Funding

This study was supported by Conselho Nacional de Desenvolvimento Científico e Tecnológico (CNPq—423772/2018-0), Fundação de Amparo à Pesquisa do Estado do Rio Grande do Sul (FAPERGS—21/2551-0002232-9; 21/2551-0000602-1), and Vinícola Família Salton.

Institutional Review Board Statement

Not applicable.

Informed Consent Statement

Not applicable.

Data Availability Statement

The datasets generated during the current study are available from the corresponding author on reasonable request.

Acknowledgments

We thank all staff and students responsible for the maintenance and data collection from this field trial. We would like to thank the Conselho Nacional de Desenvolvimento Científico e Tecnológico (CNPq), Fundação de Amparo à Pesquisa do Estado do Rio Grande do Sul (FAPERGS), and Vinícola Família Salton for the scholarship granted to the first author.

Conflicts of Interest

The authors declare no financial or other competing conflicts of interest.

References

  1. Metay, A.; Magnier, J.; Guilpart, N.; Christophe, A. Nitrogen supply controls vegetative growth, biomass and nitrogen allocation for grapevine (cv. Shiraz) grown in pots. Funct. Plant Biol. 2015, 42, 105–114. [Google Scholar] [CrossRef]
  2. García-Díaz, A.; Bienes, R.; Sastre, B.; Novara, A.; Gristina, L.; Cerdà, A. Nitrogen losses in vineyards under different types of soil groundcover. A field runoff simulator approach in central Spain. Agric. Ecosyst. Environ. 2017, 236, 256–267. [Google Scholar] [CrossRef]
  3. Lorensini, F.; Ceretta, C.A.; Brunetto, G.; Cerini, J.B.; Lourenzi, C.R.; De Conti, L.; Tiecher, T.L.; Schapanski, D.E. Disponibilidade de nitrogênio de fontes minerais e orgânicas aplicadas em um Argissolo cultivado com videira. Rev. Ceres 2014, 61, 241–247. [Google Scholar] [CrossRef] [Green Version]
  4. Tecchio, M.A.; Paioli-pires, E.J.; Terra, M.M.; Moura, M.F. Yield and nutrients levels of Niagara grapevine in Jundiai and Louveira. Biosci. J. 2007, 23, 48–58. [Google Scholar]
  5. Brunetto, G.; Bongiorno, C.L.; Mattias, J.L.; Deon, M.; De Melo, G.W.; Kaminski, J.; Ceretta, C.A. Produção, composição da uva e teores de nitrogênio na folha e no pecíolo em videiras submetidas à adubação nitrogenada. Cienc. Rural 2008, 38, 2622–2625. [Google Scholar] [CrossRef]
  6. Picariello, L.; Rinaldi, A.; Forino, M.; Petracca, F.; Moio, L.; Gambuti, A. Modification of the organic acid profile of grapes due to climate changes alters the stability of red wine phenolics during controlled oxidation. Vitis J. Grapevine Res. 2019, 58, 127–133. [Google Scholar] [CrossRef]
  7. Piccardo, D.; González-Neves, G.; Favre, G.; Pascual, O.; Canals, J.M.; Zamora, F. Impact of must replacement and hot pre-fermentative maceration on the color of uruguayan tannat red wines. Fermentation 2019, 5, 80. [Google Scholar] [CrossRef] [Green Version]
  8. Schelezki, O.J.; Antalick, G.; Šuklje, K.; Jeffery, D.W. Pre-fermentation approaches to producing lower alcohol wines from Cabernet Sauvignon and Shiraz: Implications for wine quality based on chemical and sensory analysis. Food Chem. 2020, 309, 125698. [Google Scholar] [CrossRef] [PubMed]
  9. Comuzzo, P.; Battistutta, F. Chapter 2—Acidification and pH Control in Red Wines. In Red Wine Technology; Morata, A., Ed.; Elsevier Inc.: Amsterdam, The Netherlands, 2018; ISBN 9780128144008. [Google Scholar]
  10. Bruwer, F.A.; du Toit, W.; Buica, A. Nitrogen and sulphur foliar fertilisation. S. Afr. J. Enol. Vitic. 2019, 40, 1–16. [Google Scholar] [CrossRef]
  11. Gago, P.; Conejero, G.; Martínez, M.C.; This, P.; Verdeil, J.L. Comparative anatomy and morphology of the leaves of grenache Noir and Syrah grapevine cultivars. S. Afr. J. Enol. Vitic. 2019, 40, 132–140. [Google Scholar] [CrossRef]
  12. Long, S.P. Making our plant modelling community more than the sum of its parts: A personal perspective. In Silico Plants 2019, 1, diy002. [Google Scholar] [CrossRef] [Green Version]
  13. Moran, E.V.; Clark, J.S. Estimating seed and pollen movement in a monoecious plant: A hierarchical Bayesian approach integrating genetic and ecological data. Mol. Ecol. 2011, 20, 1248–1262. [Google Scholar] [CrossRef]
  14. Liang, Z.; Liu, Y.; Xu, Y.; Wagner, T. Bayesian change point quantile regression approach to enhance the understanding of shifting phytoplankton-dimethyl sulfide relationships in aquatic ecosystems. Water Res. 2021, 201, 117287. [Google Scholar] [CrossRef] [PubMed]
  15. Yu, K.; Moyeed, R.A. Bayesian quantile regression. Stat. Probab. Lett. 2001, 54, 437–447. [Google Scholar] [CrossRef]
  16. Ekbic, H.B.; Ozdemir, G.; Sabir, A.; Tangolar, S. The effects of different nitrogen doses on yield, quality and leaf nitrogen content of some early grape cultivars (V. vinifera L.) grown in greenhouse. Afr. J. Biotechnol. 2010, 9, 5108–5112. [Google Scholar]
  17. Stefanello, L.O.; Schwalbert, R.; Schwalbert, R.A.; Drescher, G.L.; De Conti, L.; Pott, L.P.; Tassinari, A.; Kulmann, M.S.S.; da Silva, I.C.B.; Brunetto, G.; et al. Ideal nitrogen concentration in leaves for the production of high-quality grapes cv ‘Alicante Bouschet’ (Vitis vinifera L.) subjected to modes of application and nitrogen doses. Eur. J. Agron. 2021, 123, 126200. [Google Scholar] [CrossRef]
  18. USDA—Soil Survey Staff. Keys to Soil Taxonomy; United States Department of Agriculture Natural Resources Conservation Service: Washington, DC, USA, 2014.
  19. Alvares, C.A.; Stape, J.L.; Sentelhas, P.C.; De Moraes Gonçalves, J.L.; Sparovek, G. Köppen’s climate classification map for Brazil. Meteorol. Z. 2013, 22, 711–728. [Google Scholar] [CrossRef]
  20. Tedesco, M.; Gianello, C.; Bissani, C. Análises de Solo, Plantas e Outros Materiais; UFRGS: Porto Alegre, Brazil, 1995; p. 174.
  21. Stefanello, L.O.; Schwalbert, R.; Schwalbert, R.A.; De Conti, L.; Kulmann, M.S.S.; Garlet, L.P.; Silveira, M.L.R.; Sautter, C.K.; de Melo, G.W.B.; Rozane, D.E.; et al. Nitrogen supply method affects growth, yield and must composition of young grape vines (Vitis vinifera L. cv Alicante Bouschet) in southern Brazil. Sci. Hortic. 2020, 261, 108910. [Google Scholar] [CrossRef]
  22. Long, Q. varComp: Variance Component Models. R Package Version 0.1-396. 2015. Available online: https://cran.r-project.org/web/packages/VCA/vignettes/VCA_package_vignette.html (accessed on 13 March 2020).
  23. R Core Team. Language and Environment for Statistical Computing; R Foundation for Statistical Computing: Vienna, Austria, 2020; Available online: https://www.r-project.org/ (accessed on 13 March 2020).
  24. Kyveryga, P.M.; Caragea, P.C.; Kaiser, M.S.; Blackmer, T.M. Predicting risk from reducing nitrogen fertilization using hierarchical models and on-farm data. Agron. J. 2013, 105, 85–94. [Google Scholar] [CrossRef] [Green Version]
  25. Gelman, A.; Hill, J. Data Analysis Using Regression and Multilevel Models. In Data Analysis Using Regression and Multilevel/Hierarchical Models; Cambridge University Press: New York, NY, USA, 2007; p. 625. [Google Scholar]
  26. Plummer, M. rjags: Bayesian Graphical Models Using MCMC; R Package Version 3–13; R Foundation for Statistical Computing: Vienna, Austria, 2016; pp. 1–19. [Google Scholar]
  27. Kassambara, A.; Mundt, F. Factoextra: Extract and Visualize the Results of Multivariate Data Analyses; R Package Version 1.0.4; R Foundation for Statistical Computing: Vienna, Austria, 2017; Available online: https://cran.r-project.org/package=factoextra (accessed on 13 March 2020).
  28. Moriwaki, T.; Falcioni, R.; Tanaka, F.A.O.; Cardoso, K.A.K.; Souza, L.A.; Benedito, E.; Nanni, M.R.; Bonato, C.M.; Antunes, W.C. Nitrogen-improved photosynthesis quantum yield is driven by increased thylakoid density, enhancing green light absorption. Plant Sci. 2019, 278, 1–11. [Google Scholar] [CrossRef]
  29. Bascuñán-Godoy, L.; Franck, N.; Zamorano, D.; Sanhueza, C.; Carvajal, D.E.; Ibacache, A. Rootstock effect on irrigated grapevine yield under arid climate conditions are explained by changes in traits related to light absorption of the scion. Sci. Hortic. 2017, 218, 284–292. [Google Scholar] [CrossRef]
  30. Arrizabalaga, M.; Morales, F.; Oyarzun, M.; Delrot, S.; Gomès, E.; Irigoyen, J.J.; Hilbert, G.; Pascual, I. Tempranillo clones differ in the response of berry sugar and anthocyanin accumulation to elevated temperature. Plant Sci. 2018, 267, 74–83. [Google Scholar] [CrossRef]
  31. Mori, K.; Goto-Yamamoto, N.; Kitayama, M.; Hashizume, K. Loss of anthocyanins in red-wine grape under high temperature. J. Exp. Bot. 2007, 58, 1935–1945. [Google Scholar] [CrossRef] [PubMed]
  32. Carbonell-Bejerano, P.; Santa María, E.; Torres-Pérez, R.; Royo, C.; Lijavetzky, D.; Bravo, G.; Aguirreolea, J.; Sánchez-Díaz, M.; Antolín, M.C.; Martínez-Zapater, J.M. Thermotolerance responses in ripening berries of Vitis vinifera L. cv muscat hamburg. Plant Cell Physiol. 2013, 54, 1200–1216. [Google Scholar] [CrossRef] [PubMed] [Green Version]
  33. Chen, W.K.; He, F.; Wang, Y.X.; Liu, X.; Duan, C.Q.; Wang, J. Influences of Berry Size on Fruit Composition and Wine Quality of Vitis vinifera L. cv. ‘Cabernet Sauvignon’ Grapes. S. Afr. J. Enol. Vitic. 2018, 39, 67–76. [Google Scholar] [CrossRef] [Green Version]
  34. De Souza Kulmann, M.S.; Sete, P.B.; de Paula, B.V.; Stefanello, L.O.; Schwalbert, R.; Schwalbert, R.A.; Arruda, W.S.; Sans, G.A.; Parcianello, C.F.; Nicoloso, F.T.; et al. Kinetic parameters govern of the uptake of nitrogen forms in ‘Paulsen’ and ‘Magnolia’ grapevine rootstocks. Sci. Hortic. 2020, 264, 109174. [Google Scholar] [CrossRef]
  35. Schmitt, D.E.; Borghezan, M.; Ambrosini, V.G.; Comin, J.J.; Trapp, T.; Brunetto, G. Yield and must composition of grapevines subjected to phosphate fertilization in Southern Brazil. Pesq. Agropec. Bras. 2020, 55, e01167. [Google Scholar] [CrossRef]
  36. Brunetto, G.; Stefanello, L.O.S.; Ceretta, C.A.; Couto, R.R.; Ferreira, P.A.A.; Ambrosini, V.G.; Borghezan, M.; Comin, J.J.; De Melo, G.W.; Baldi, E.; et al. Nitrogen fertilization of ‘Chardonnay’ grapevines: Yield, must composition and their relationship with temperature and rainfall. Acta Hortic. 2018, 1228, 451–456. [Google Scholar] [CrossRef]
  37. Brunetto, G.; Ceretta, C.A.; Kaminski, J.; de Melo, G.W.; Girotto, E.; Trentin, E.E.; Lourenzi, C.R.; Vieira, R.C.B.; Gatiboni, L.C. Produção e composição química da uva de videiras Cabernet Sauvignon submetidas à adubação nitrogenada. Ciênc. Rural 2009, 39, 2035–2041. [Google Scholar] [CrossRef] [Green Version]
  38. Rossouw, G.C.; Smith, J.P.; Barril, C.; Deloire, A.; Holzapfel, B.P. Carbohydrate distribution during berry ripening of potted grapevines: Impact of water availability and leaf-to-fruit ratio. Sci. Hortic. 2017, 216, 215–225. [Google Scholar] [CrossRef]
  39. Sadras, V.O.; Moran, M.A. Elevated temperature decouples anthocyanins and sugars in berries of Shiraz and Cabernet Franc. Aust. J. Grape Wine Res. 2012, 18, 115–122. [Google Scholar] [CrossRef]
  40. Sofo, A.; Nuzzo, V.; Tataranni, G.; Manfra, M.; De Nisco, M.; Scopa, A. Berry morphology and composition in irrigated and non-irrigated grapevine (Vitis vinifera L.). J. Plant Physiol. 2012, 169, 1023–1031. [Google Scholar] [CrossRef]
  41. Yu, X.; Wang, B.; Zhang, C.; Xu, W.; He, J.; Zhu, L.; Wang, S. Effect of root restriction on nitrogen levels and glutamine synthetase activity in “Kyoho” grapevines. Sci. Hortic. 2012, 137, 156–163. [Google Scholar] [CrossRef]
  42. García, J.; Zheng, W.; Balda, P.; Martinez De Toda, F. Varietal differences in the sugar content of red grapes at the onset of anthocyanin synthesis. Vitis J. Grapevine Res. 2017, 56, 15–18. [Google Scholar] [CrossRef]
  43. Salazar-Parra, C.; Aranjuelo, I.; Pascual, I.; Aguirreolea, J.; Sánchez-Díaz, M.; Irigoyen, J.J.; Araus, J.L.; Morales, F. Is vegetative area, photosynthesis, or grape C uploading involved in the climate change-related grape sugar/anthocyanin decoupling in Tempranillo? Photosynth. Res. 2018, 138, 115–128. [Google Scholar] [CrossRef] [PubMed]
  44. Ju, Y.L.; Yang, B.H.; He, S.; Tu, T.Y.; Min, Z.; Fang, Y.L.; Sun, X.Y. Anthocyanin accumulation and biosynthesis are modulated by regulated deficit irrigation in Cabernet Sauvignon (Vitis Vinifera L.) grapes and wines. Plant Physiol. Biochem. 2019, 135, 469–479. [Google Scholar] [CrossRef] [PubMed]
  45. Li, H. Wine Chemistry, 3rd ed.; Science Press: Beijing, China, 2006. [Google Scholar]
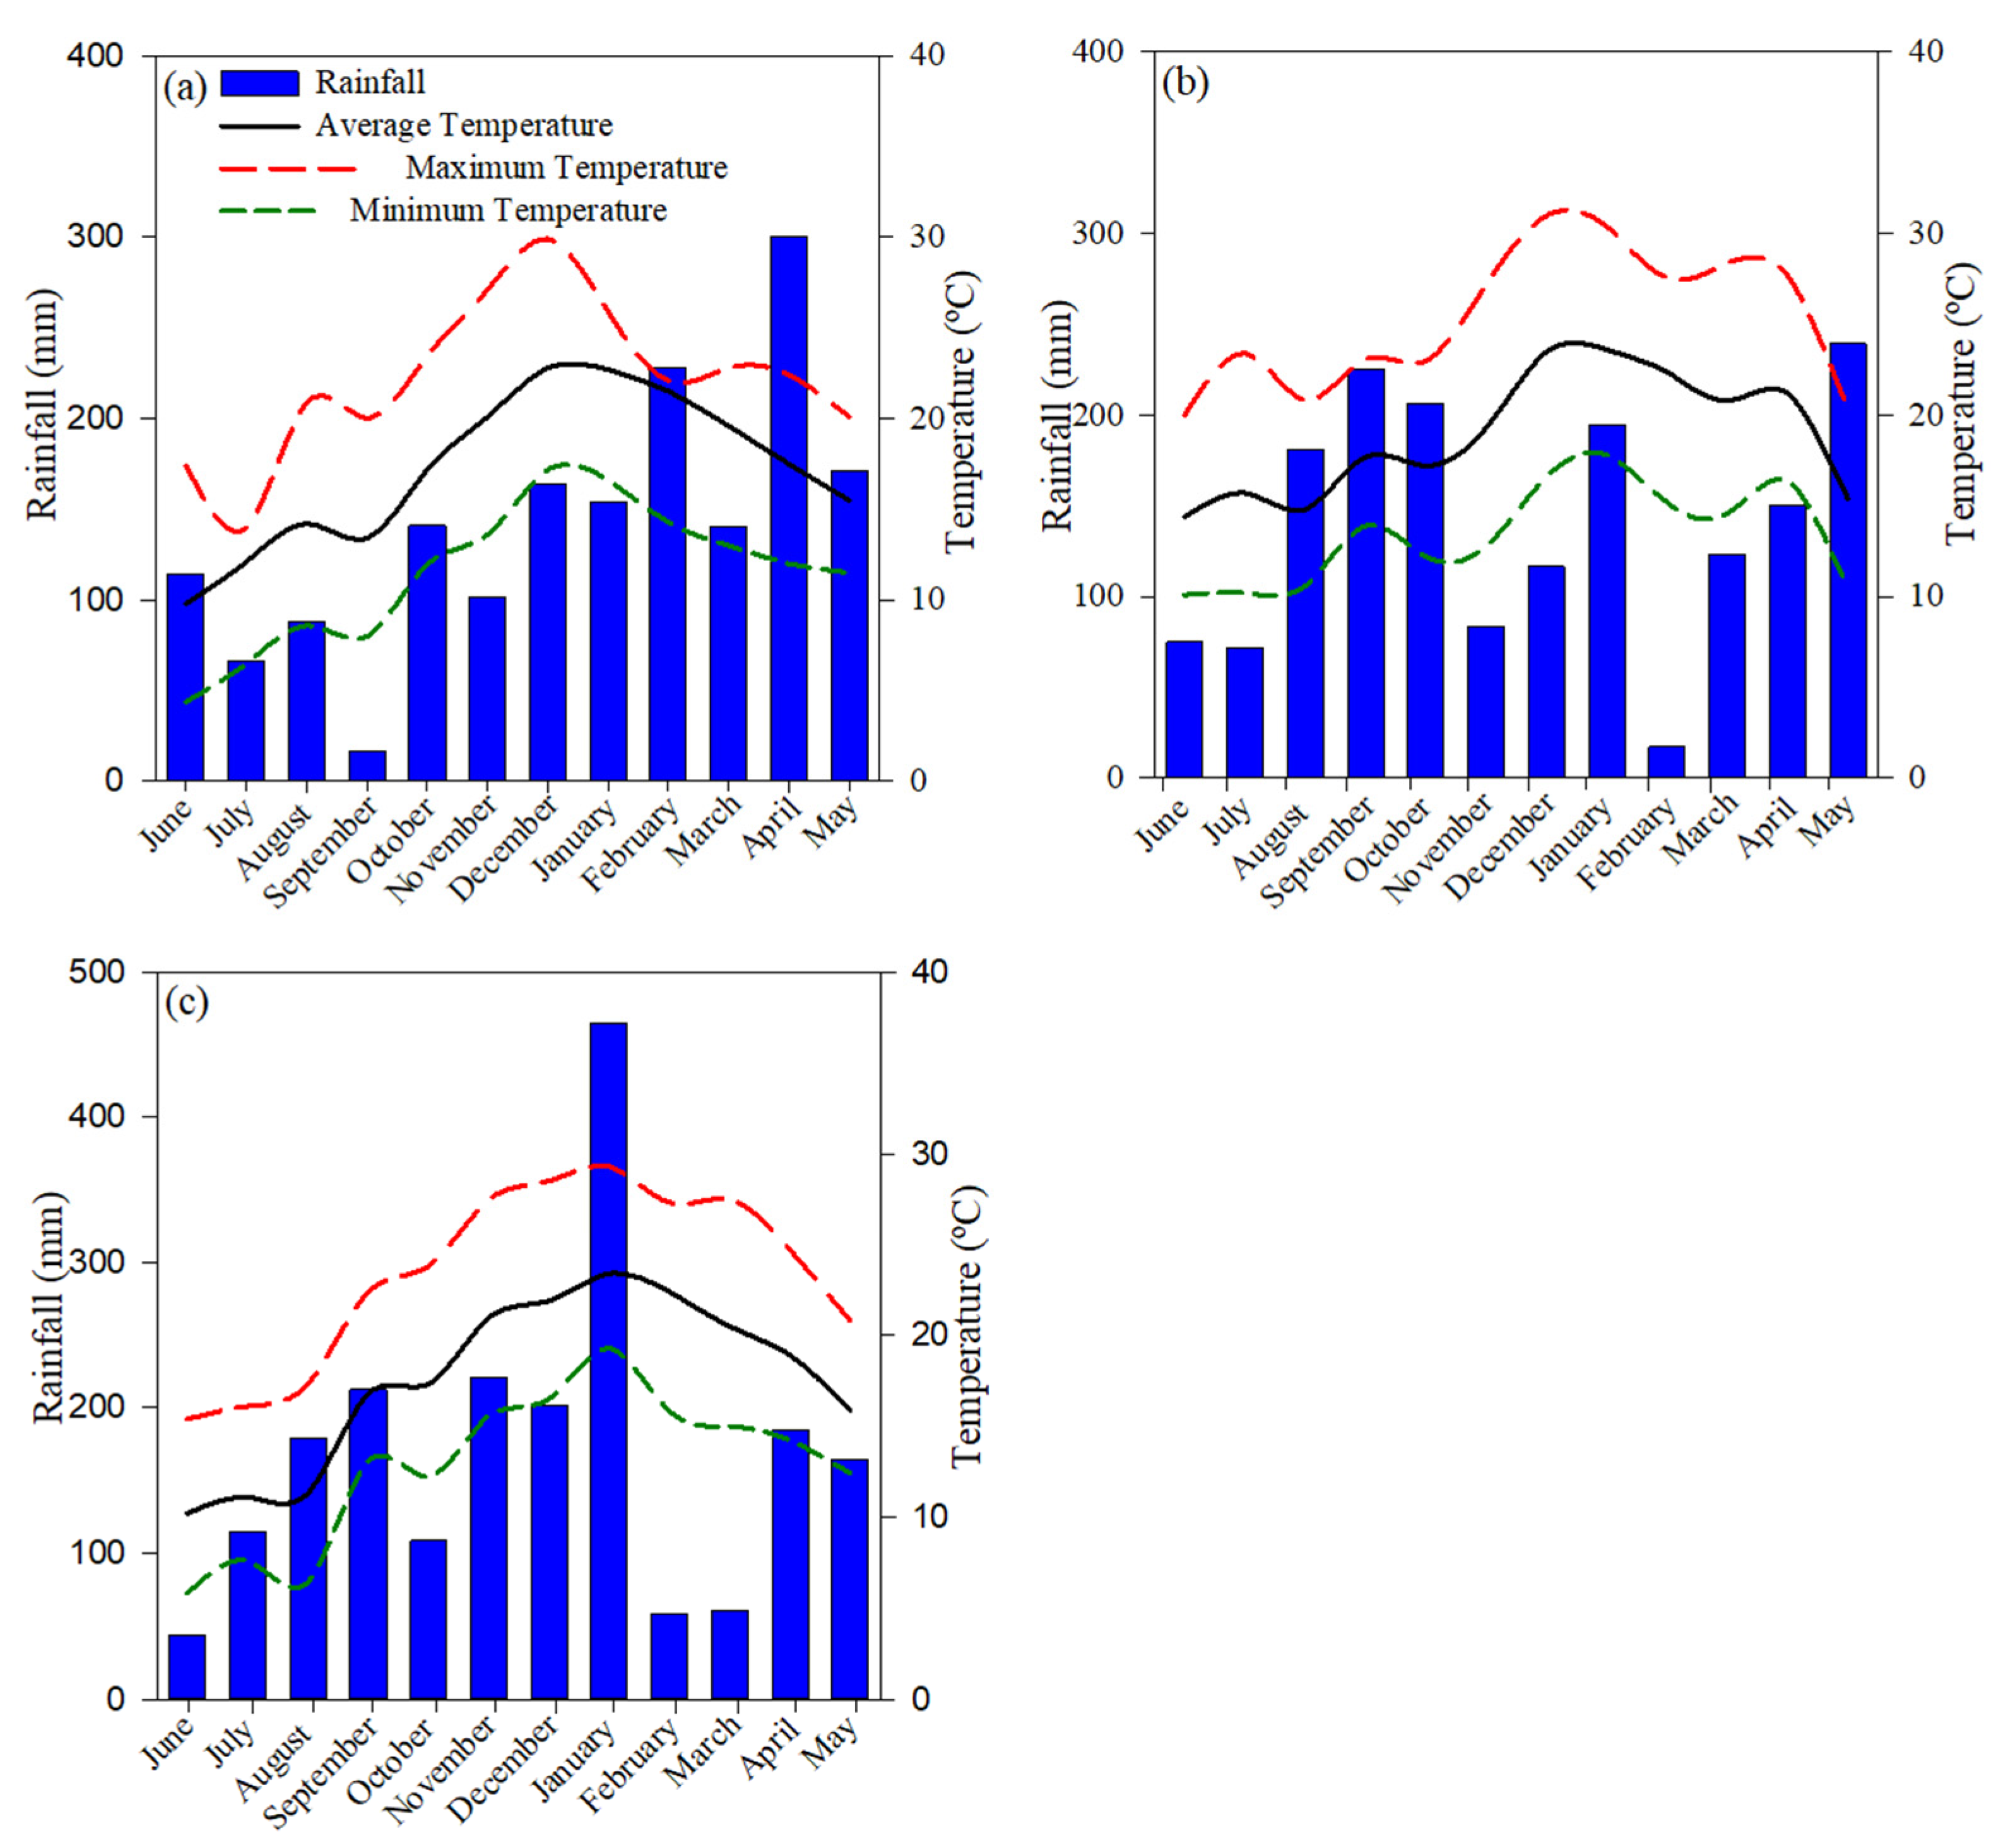
Figure 1. Monthly accumulated rainfall; minimum, average, and maximum air temperatures in the 2016/17 (a), 2017/18 (b), and 2018/19 (c) growing seasons, in the experimental vineyard, Santana do Livramento, Rio Grande do Sul state, Brazil.
Agronomy 12 01132 g001
Figure 2. Visual representation of variance components. The colors represent the source of variation (treatment, cultivar, year, interactions, and residual). Response variables (plant tissue, grape yield, and composition) are shown on the X-axis. The variation proportion explained by each source of variation for each response variable is observed on the Y-axis (percentage).
Agronomy 12 01132 g002
Figure 3. Nitrogen critical levels in leaves at flowering and veraison for ‘Chardonnay’ (a,e) and ‘Pinot Noir’ (b,f), respectively. Nitrogen sufficiency range in leaves at flowering (c) and veraison (g) of the grapevine cultivars. Histogram of frequency of the high-density interval of the critical N concentration in leaves at flowering (d) and veraison (h) between the ‘Chardonnay’ and ‘Pinot Noir’ cultivars subjected to N fertilization in the soil, during 2016/17, 2017/18, and 2018/19.
Agronomy 12 01132 g003
Figure 4. Maximum technical efficiency (MTE) doses of N fertilizer to ‘Chardonnay’ (a,c,e) and ‘Pinot Noir’ (b,d,f) cultivars grown in sandy soil during 2016/17, 2017/18, and 2018/19.
Agronomy 12 01132 g004
Figure 5. Relationship between N concentration in leaves at flowering and veraison and the total soluble solids (a,b), and the total titratable acidity (c,d) of ‘Chardonnay’ grape must during 2016/17, 2017/18, and 2018/19. Blue dashed lines represent the proposed N sufficiency ranges based on maximum grape yield.
Agronomy 12 01132 g005
Figure 6. Relationship between N concentration in leaves at flowering and veraison and the total soluble solids (a,b), and the total titratable acidity (c,d), and total anthocyanins (e,f) of ‘Pinot Noir’ grape must during 2016/17, 2017/18, and 2018/19. Blue dashed lines represent the proposed N sufficiency ranges based on maximum grape yield.
Agronomy 12 01132 g006
Figure 7. Relationship between principal component 1 (PC1) and principal component 2 (PC2) for response variables analyzed in field experiments with ‘Chardonnay’ (a) and ‘Pinot Noir’ (b) cultivars subjected to N fertilization in the soil, during 2016/17, 2017/18, and 2018/19.
Agronomy 12 01132 g007
Publisher’s Note: MDPI stays neutral with regard to jurisdictional claims in published maps and institutional affiliations.