Article

Comparative Transcriptional Analysis of Two Contrasting Rice Genotypes in Response to Salt Stress

1
Sanya Research Institute of Chinese Academy of Tropical Agricultural Sciences, Yumin Road 7, Sanya 572025, China
2
Hainan Key Laboratory for Biosafety Monitoring and Molecular Breeding in Off-Season Reproduction Regions, Institute of Tropical Bioscience and Biotechnology, Chinese Academy of Tropical Agricultural Sciences, Xueyuan Road 4, Haikou 571101, China
3
Hainan Key Laboratory for Protection and Utilization of Tropical Bioresources, Hainan Institute for Tropical Agricultural Resources, Chinese Academy of Tropical Agricultural Sciences, Xueyuan Road 4, Haikou 571101, China
4
Institute of Crop Sciences, Chinese Academy of Agricultural Sciences, Beijing 100081, China
*
Authors to whom correspondence should be addressed.
These authors contributed equally to this work.
Agronomy 2022, 12(5), 1163; https://doi.org/10.3390/agronomy12051163
Submission received: 22 March 2022 / Revised: 6 May 2022 / Accepted: 10 May 2022 / Published: 11 May 2022
(This article belongs to the Collection Crop Breeding for Stress Tolerance)

Abstract

:
Improving rice salt-tolerance is an effective way to deal with the increasing food demand caused by soil salinization and population growth. Nevertheless, the molecular mechanisms of rice salt-tolerance remain elusive. In this study, comparative transcriptomic analyses were performed to identify salt-tolerance genes that were either specifically regulated or more changed in salt-tolerant cultivar FL478 relative to salt-sensitive cultivar 93-11. In total, 1423, 175, and 224 salt-tolerance genes were identified under 200 mM NaCl treatment for 6 h, 24 h, and 72 h, respectively. These genes were commonly enriched in transport and peroxidase/oxidoreductase activity across all timepoints, but specially enriched in transcription regulator activity at 6 h under salt stress. Further analysis revealed that 53 transporters, 38 transcription factors (TFs), and 23 reactive oxygen species (ROS) scavenging enzymes were involved in salt adaptation of FL478, and that overall, these salt-tolerance genes showed a faster transcriptional expression response in FL478 than in 93-11. Finally, a gene co-expression network was constructed to highlight the regulatory relationships of transporters, TFs, and ROS scavenging genes under salt-stress conditions. This work provides an overview of genome-wide transcriptional analysis of two contrasting rice genotypes in response to salt stress. These findings imply a crucial contribution of quickly transcriptional changes to salt tolerance and provide useful genes for genetic improvement of salt tolerance in rice.

1. Introduction

Rice (Oryza sativa) is a staple food crop and provides major calories for half of the world’s population. With soil salinization threatening more than 800 million hectares of land, salinity stress becomes a major environmental stressor that affects rice growth and production worldwide [1]. The global growing human population will increase the demands for agricultural crop production by 70–110% in 2050 [2]. Therefore, improving rice salt-tolerance is one of the most important strategies to boost land utilization and agricultural economy.
Salt can cause serious damage to plants when it reaches a certain level. The excessive Na+ in soil leads to ion toxicity in plants and inhibits enzyme activities, cell division and dilatation, membrane disintegration, and osmotic imbalance [3,4]. External Na+ negatively affects intracellular K+ uptake, thereby disrupting intracellular ion balance and producing osmotic stress [5]. Moreover, excessive reactive oxygen species (ROS) induced by salt stress is harmful to plants, although ROS acts as a stress sensor in the early stage of stresses [6].
Plants have evolved a series of complicated mechanisms to cope with salt stress so that they can survive and complete their life cycle [3,7]. Membrane transporters of Na+ and K+ play important roles in salt tolerance, and they have been used to enhance biotic and abiotic stress resistance [8]. Additionally, the production of Ca2+ and ROS is a sensory mechanism of plants in response to salt stress [3,7]. Moreover, transcription factors (TFs) act as a regulatory hub within various signaling pathways by regulating the expression of downstream genes under salt conditions [4,9,10]. A novel MYB coiled-coil type TF, OsMYBc, was found to regulate the high-affinity K+ transporter (OsHKT1;1) which has a key role in controlling Na+ concentration and preventing sodium toxicity in leaves [9]. The basic helix–loop–helix (bHLH) type TF bHLH123 acted with NADPH oxidase to improve tobacco salt tolerance [10]. Compared with the control, transgenic plants overexpressing GmNAC085 displayed higher activities of antioxidant enzymes responsible for scavenging hydrogen peroxide or superoxide radicals [11].
Rice is very sensitive to salt in the early seedling stage, which eventually influences grain yield. However, the molecular mechanisms underlying salt tolerance in rice are still elusive. Salt-induced transcript profiles have been documented by microarrays in both shoots and roots in rice [12,13,14]. However, array-based technologies often have limitations in the accuracy of expression measurements, especially for the genes with low expression abundance [15]. With the rapid development of sequencing technology, RNA-seq has been widely used to detect the genome-wide gene expression changes and to identify candidate genes resistant to salt stress [16,17,18,19,20]. Similar studies were also performed in rice [21,22], but very few salt-treated timepoints were included. FL478 is a salt-tolerant cultivar that has the ability to tiller well and maintains low Na+/K+ ratio under salt conditions [14,23], while 93-11 is an elite indica variety sensitive to salt [24]. In this study, these two contrasting rice genotypes were used to explore the candidate genes and molecular mechanisms in response to salt by comparative RNA-seq analysis during four timepoints. These findings will pave the way for further understanding the regulatory networks of salt response in crops and help to mine candidate genes for genetic improvement of salt tolerance.

2. Materials and Methods

2.1. Plant Materials and Salt Treatment

Rice cultivars 93-11 (salt sensitive) and FL478 (salt tolerant) were used in this study, of which FL478 was derived from the Institute of Crop Sciences, Chinese Academy of Agricultural Sciences. Germinated seeds were grown on a 96-well plate and planted in the greenhouse at 30 °C for 14 h in the light and at 20 °C for 10 h in the dark. The relative humidity was 60% and the light intensity was 300 μmol·m−2·s−1. The Hoagland hydroponic solution was refreshed at 3-day intervals, and 7-day-old seedlings were transferred to 200 mM NaCl-containing Hoagland solution for salt treatment.

2.2. cDNA Library Preparation and Sequencing

Shoots were sampled from five independent plants at 0 h, 6 h, 24 h, and 72 h, respectively, after salt treatment for each biological replicate. A total of three biological replicates were performed. The samples were frozen in liquid nitrogen and stored at −80 °C until use for transcriptome sequencing. Total RNA was isolated by using a RNA extraction kit (DP432, TIANGEN, Beijing, China) according to the manufacturer’s instructions. Twenty-four cDNA libraries were constructed and subsequently sequenced with the Illumina Hiseq 4000 platform.

2.3. RNA-Seq Data Analysis

Adaptor sequences and low-quality reads were removed using Trimmomatic v0.32 [25]. The high-quality 150 bp paired-end reads were mapped on the Nipponbare reference genome [26] with HISAT2 v2.1.0 and StringTie v1.3.4 [27] with default parameters (e.g., --threads = 6). Gene expression levels were represented by the FPKM (Fragments Per Kb per Million reads) values.
Differentially expressed genes (DEGs) were identified in FL478 or 93-11 at 6 h, 24 h, and 72 h upon salt compared with 0 h (the control), respectively. The DEGs were determined by DEseq2 [28] based on a threshold of two-fold expression change and false discovery rate (FDR) < 0.05. The DEGs that were unique to FL478 or those whose expression was higher (≥two-fold) in FL478 in comparison to 93-11 were defined as salt tolerance genes [29]. The expression profiles of DEGs were clustered using the c-means method [30]. DEGs were annotated using the MSU Rice Genome Annotation Project Release 7 [26] and then subjected to Gene Ontology (GO) enrichment analysis by GOATOOLS [31] using hypergeometric tests with the Benjamini–Hochberg correction. Enriched GO terms were visualized using R package ggplot2 [32]. Transcription factors (TFs) was annotated by the PlantTFDB v5.0 database [33].

2.4. Co-Expressed Gene Network Analysis

Co-expressed gene modules were identified using Weighted Gene Co-expression Network Analysis (WGCNA) v1.63 [34] with an unsigned type of topological overlap matrix (TOM), a soft-thresholding power of 22, a minimal module size of 20, and a branch merge cut height of 0.2. The similarity of the co-expression network was calculated by the Pearson correlation. Gene expression was visualized using the R package pheatmap (https://cran.r-project.org/web/packages/pheatmap/index.html, accessed on 22 January 2022). Gene regulatory relationship was displayed by Cytoscape v3.9.0 [35].

2.5. qRT-PCR Analysis

To confirm the transcriptional levels of RNA-seq, eleven salt-tolerant genes were selected to perform a qRT-PCR assay as previously described [36]. The primer pairs were listed in Table S1. Three biological replicates of each sample were analyzed. The relative expression levels of genes were calculated by the 2−ΔΔCt method [37].

3. Results

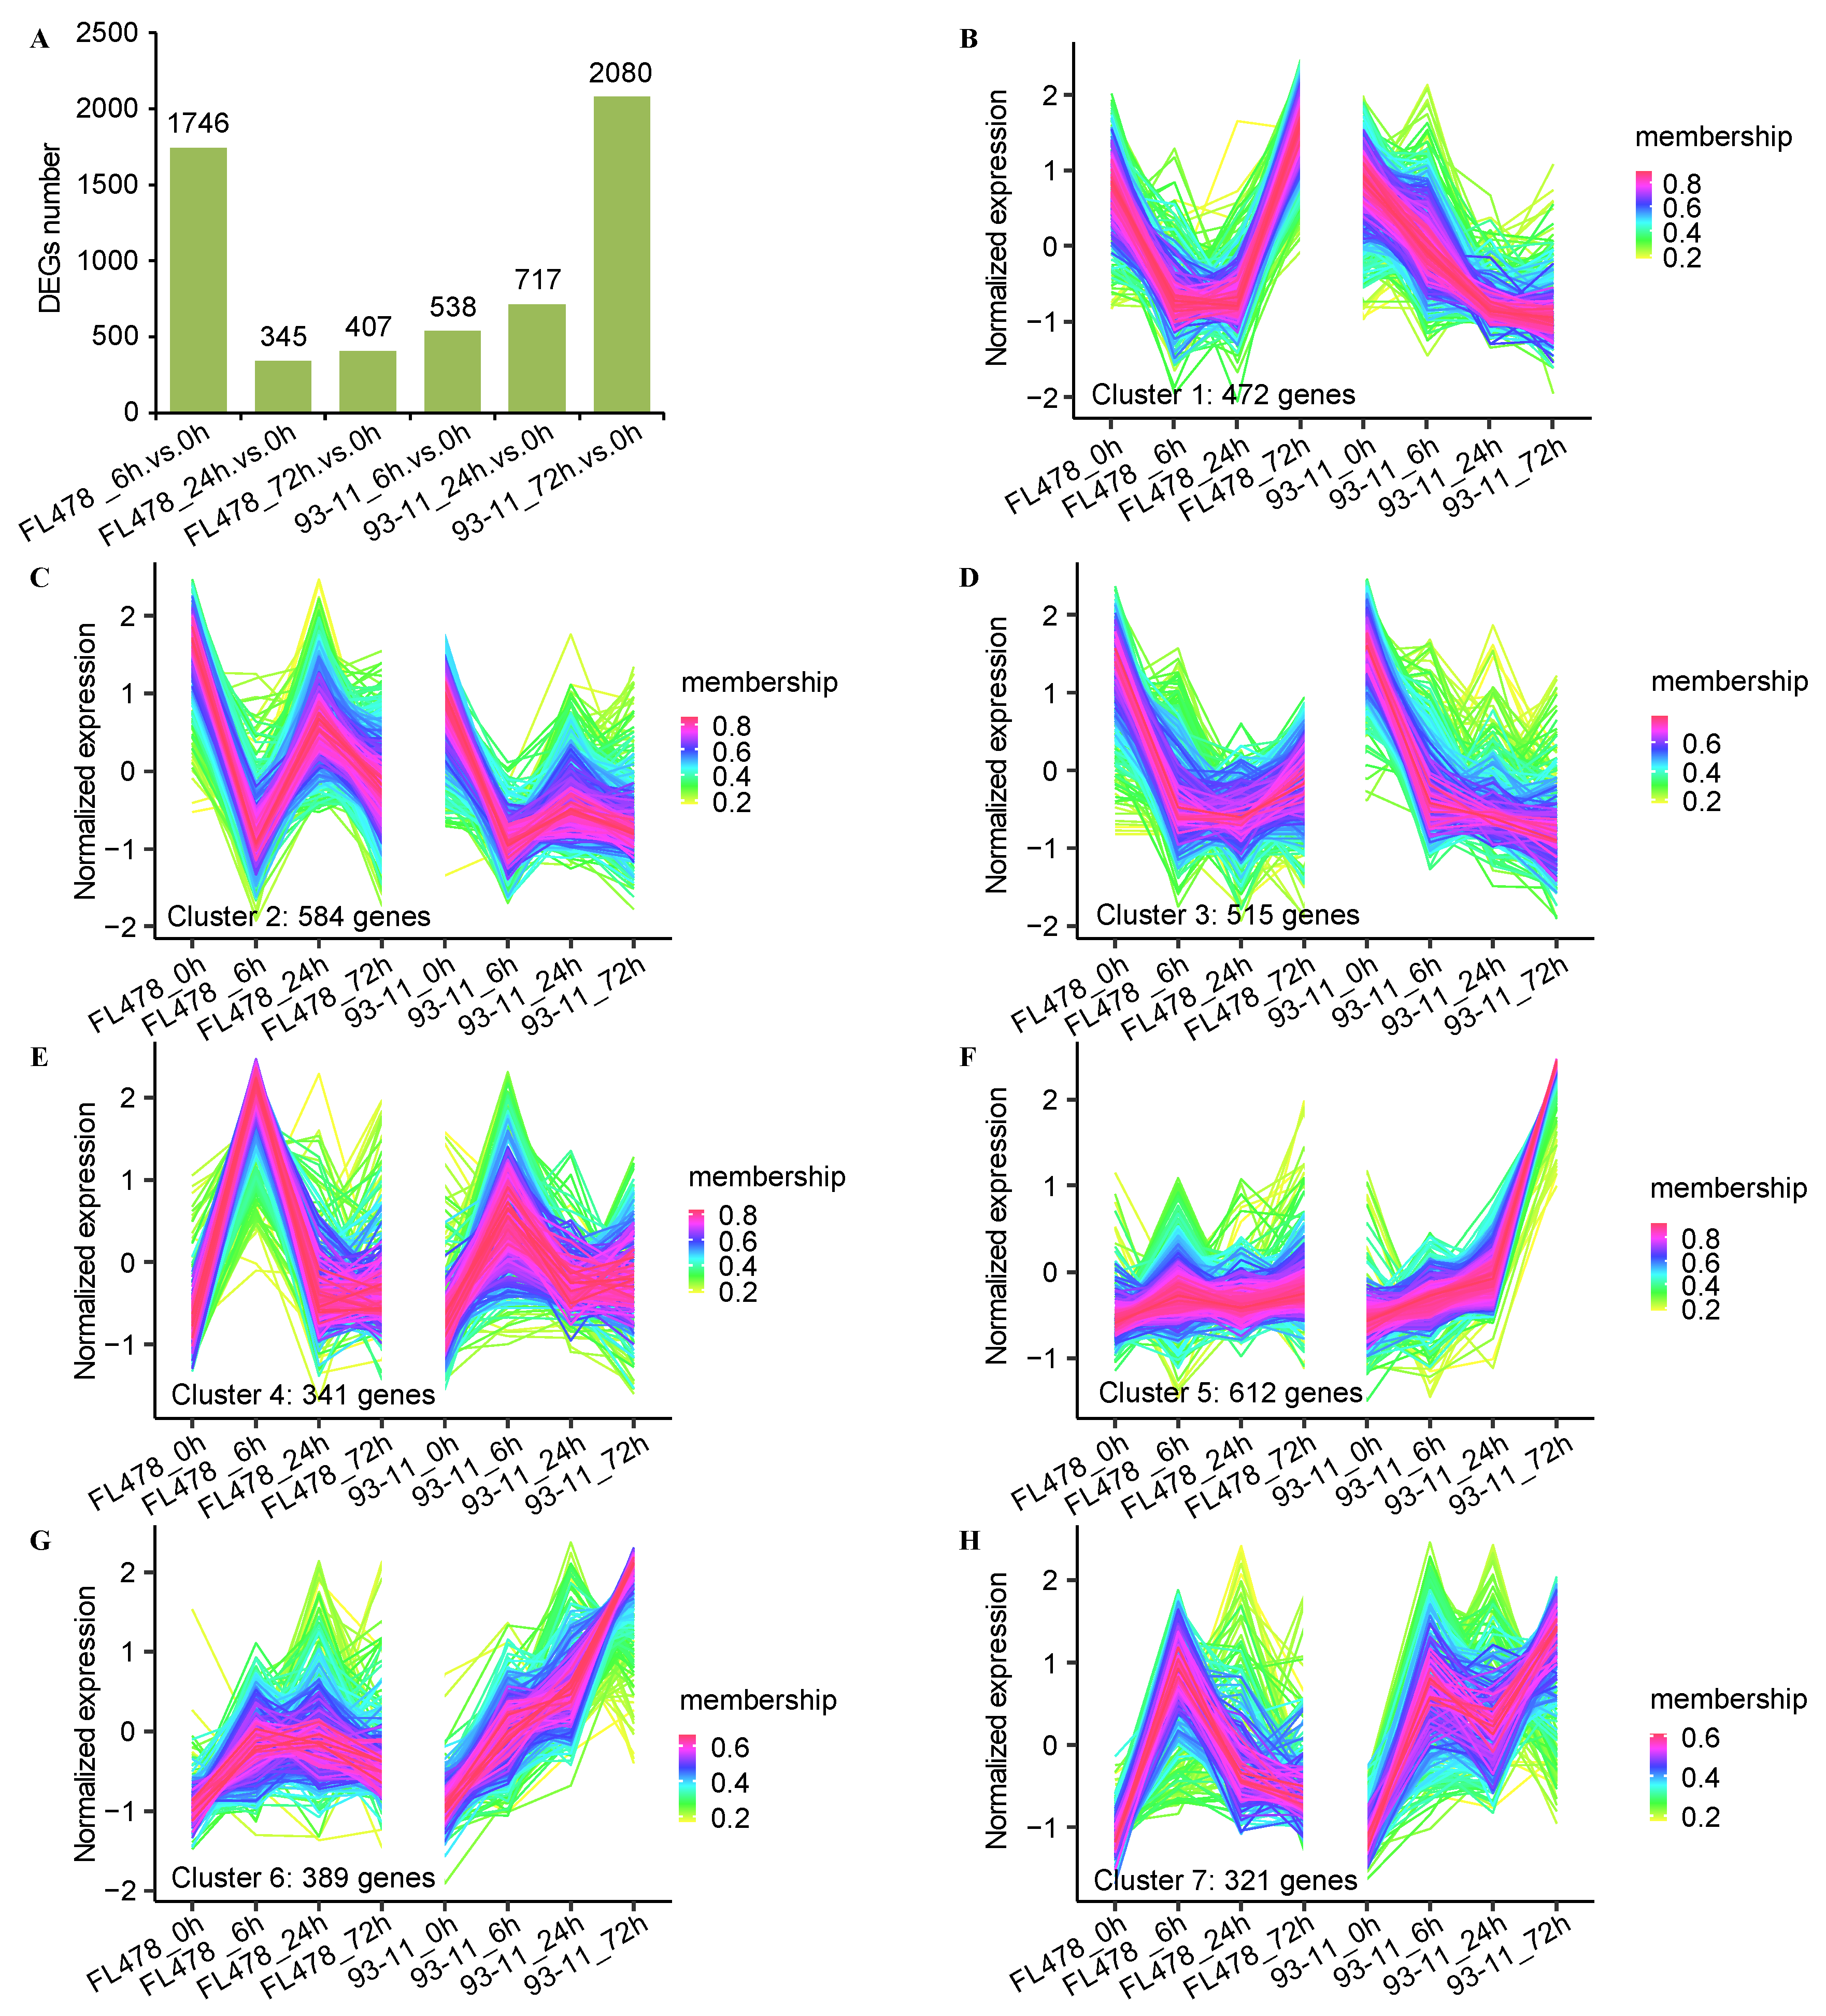
3.1. DEGs Identification and Cluster Analysis

Compared with the salt-tolerant cultivar FL478, the leaves were curved at 24 h and the tips of leaves were necrotic at 72 h in the salt-sensitive cultivar 93-11 under 200 mM NaCl treatment (Figure S1). RNA-seq was performed using these two rice cultivars to gain a comprehensive overview of transcriptomic changes in response to salt. A total of 24 individual libraries were sequenced at 0 h (the control), 6 h, 24 h, and 72 h after salt treatment, respectively. The clean reads were mapped to the reference genome and the expression levels of 55,801 genes were obtained. Of these, 2306 and 2017 DEGs were identified in 93-11 and FL478, respectively (Figure 1A and Table S2). In FL478, a higher number (1746) of DEGs were found after exposure to salinity stress at 6 h, while fewer were found at 24 h (345) and 72 h (407) treatment compared with 0 h, respectively. In contrast, an opposite trend was observed in 93-11 with 538 DEGs at 6 h, 717 DEGs at 24 h, and 2080 DEGs at 72 h after salt treatment. These results indicated a quicker transcriptional response of FL478 than 93-11 under salt condition.
Cluster analysis was carried out to reveal the expression patterns of DEGs under salinity in 93-11 and FL478 (Figure 1B–H and Table S3). The DEGs were roughly grouped into seven clusters. Cluster one included 472 DEGs that were preferentially expressed at a high level in FL478 at 72 h after salt treatment but were downregulated across all timepoints in 93-11. Cluster two included 584 genes which were downregulated at 6 h after salt stress in the two rice cultivars and then upregulated at 24 h and 72 h. The 515 DEGs from cluster three were downregulated in both 93-11 and FL478 during the whole salt treatment. On the contrary, the 341 DEGs from cluster four were upregulated at 6 h but then downregulated at 24 h and 72 h in the two cultivars. Clusters five and six, with 612 and 389 DEGs, respectively, were expressed highest in 93-11 at 72 h after salt stress, in accordance with the greatest number of DEGs found at this timepoint in 93-11. Cluster seven included 321 DEGs that were upregulated by salt at 6 h but then downregulated at 24 h in 93-11 and FL478. However, these two cultivars showed distinct expression responses at 72 h. Collectively, the results suggest discrepant and similar transcriptional responses of FL478 and 93-11 under salt conditions, which inspires us to further identify salt tolerance genes uniquely or more changed in FL478 compared with 93-11.

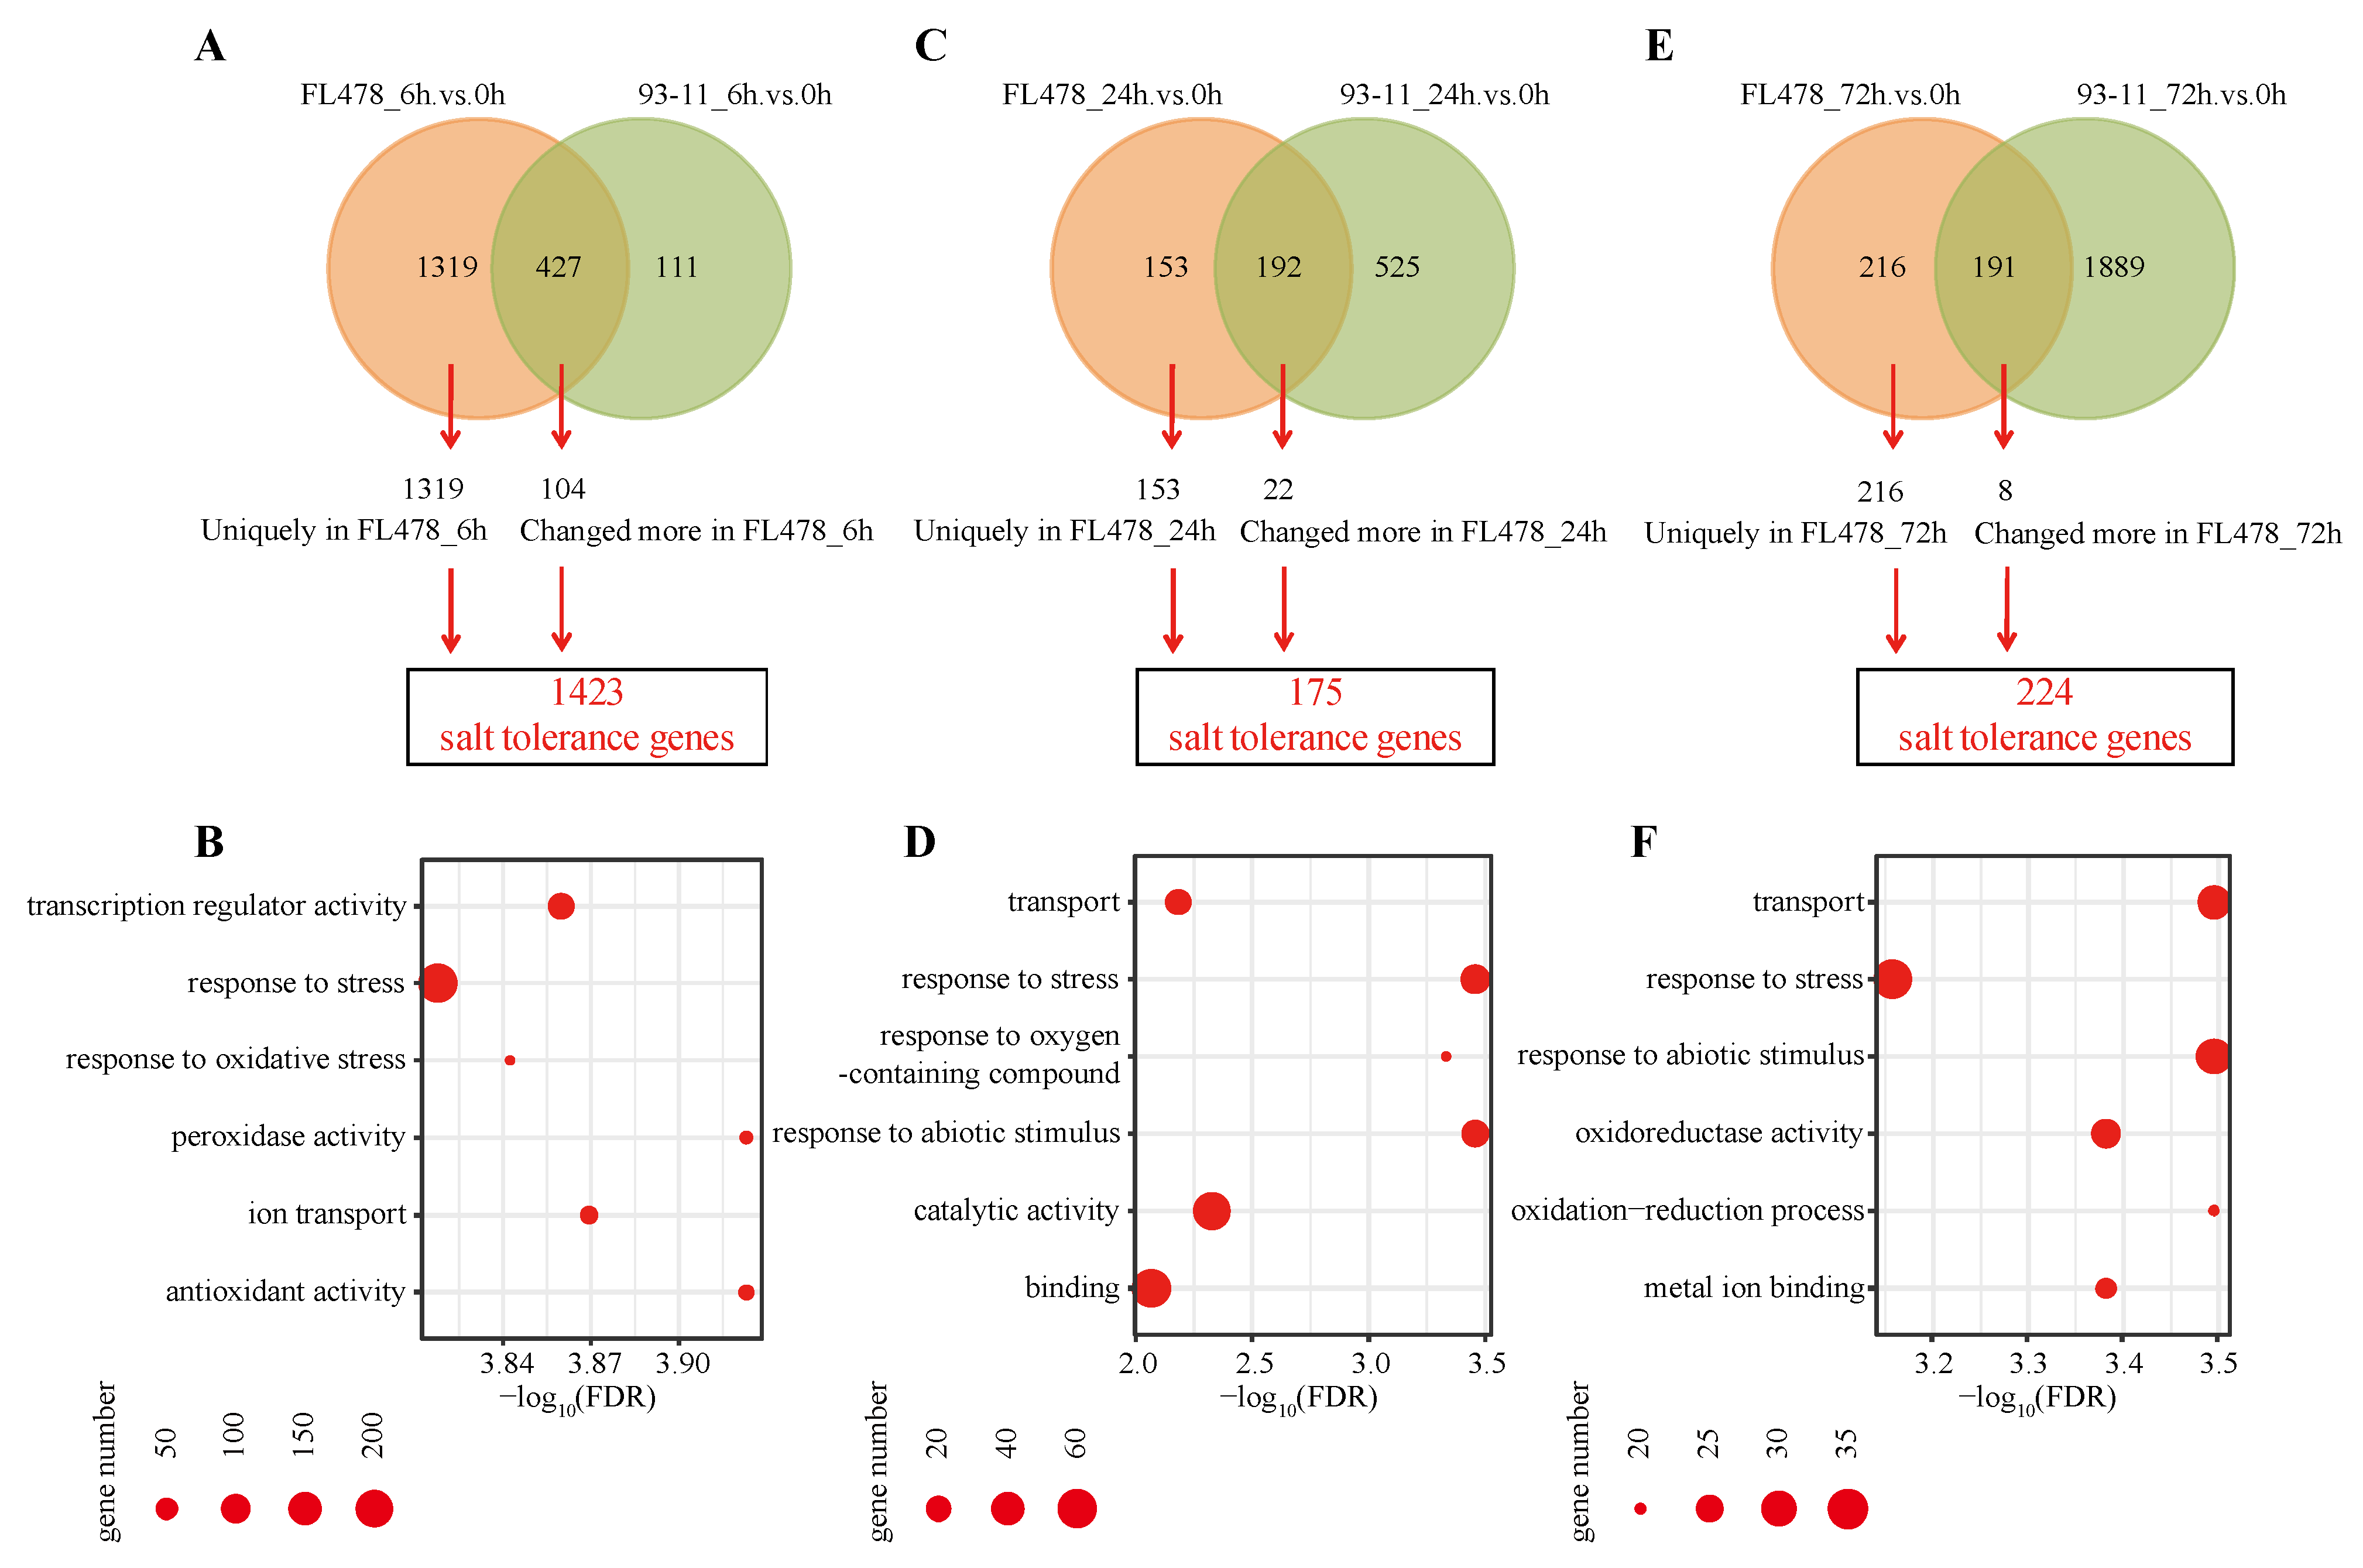
3.2. Salt Tolerance Genes Play Pivotal Roles in FL478 Compared with 93-11

To get a better understanding of the mechanism underlying the salt tolerance in rice, comparative transcriptome analysis was performed between 93-11 and FL478 at 6 h, 24 h, and 72 h after salt treatment, respectively.
After 6 h salt treatment, 1319 DEGs were exclusively identified in FL478, 111 DEGs were uniquely found in 93-11, and 427 DEGs were commonly regulated in both FL478 and 93-11 (Figure 2A). Of the 427 commonly regulated DEGs, 104 were changed more in FL478 than in 93-11. Thus, a total of 1423 DEGs were identified as salt-tolerance genes in FL478 relative to 93-11 at 6 h after salt treatment (Table S4). GO enrichment analyses showed that these DEGs were enriched in transcription regulator activity, response to stress, response to oxidative stress, peroxidase activity, ion transport, and antioxidant activity (Figure 2B and Table S5).
Similarly, after 24 h salt stress, 153 and 525 DEGs were uniquely changed in FL478 and 93-11, respectively (Figure 2C). Among the 192 commonly identified DEGs, 22 were changed more in FL478 than in 93-11. In total, 175 DEGs were identified as salt-tolerance genes at 24 h after salt treatment (Table S4). These genes were enriched in transport, response to stress, response to oxygen-containing compound, response to abiotic stimulus, catalytic activity, and binding (Figure 2D and Table S5).
After exposure to salt stress at 72 h, a total of 224 DEGs were identified as salt-tolerance genes, including 216 DEGs specifically detected in FL478 and eight DEGs with more expression changes in FL478 than in 93-11 (Figure 2E). The GO enrichment included transport, response to stress, response to abiotic stimulus, oxidoreductase activity, oxidation-reduction process, and metal ion binding (Figure 2F and Table S5).
Interestingly, by comparing the enriched categories among the three timepoints, DEGs were shared in related functions such as transport and peroxidase/oxidoreductase activity, suggesting that these DEGs play a pivotal role during the whole salt treatment. Moreover, DEGs were also enriched in a time-specific manner (such as transcription regulator activity at 6 h), suggesting a major contribution of transcription factor regulation to the early response of salt stress. In the following, we will focus on the DEGs enriched in the shared and specific GO terms.

3.3. Enhanced Transport Ability Is Important for the Adaption to Salt Stress

The maintenance of ion homeostasis at the cellular level is a key factor in determining whether plants can overcome the damaging effects of salt-induced ion stress [38]. As described above, salt tolerance genes were commonly enriched in transport function at 6 h, 24 h, and 72 h upon salt stress (Figure 2B,D,F). Therefore, the transporters were further investigated to demonstrate their roles in salt tolerance. A total of 53 transporter-related salt-tolerance genes were found. More than half of them were specifically or more upregulated in FL478 than in 93-11 at 6 h, although a few were also highly expressed in 93-11 after prolonged (72 h) salt stress (Figure 3). These genes included three ATP-binding cassette (ABC) transporters, two aquaporin proteins, one cation/H+ exchanger, one high-affinity K+ transporter, and one vacuolar ATPase (Table S6). Additionally, eleven lipid-transfer protein (LTP) genes were more upregulated in FL478 than in 93-11 at 6 h or 72 h after salt stress. Together, these results suggested that the enhanced transport ability (as indicated by the upregulated expression levels of transporters) contributes to the salt tolerance in FL478 compared with 93-11.

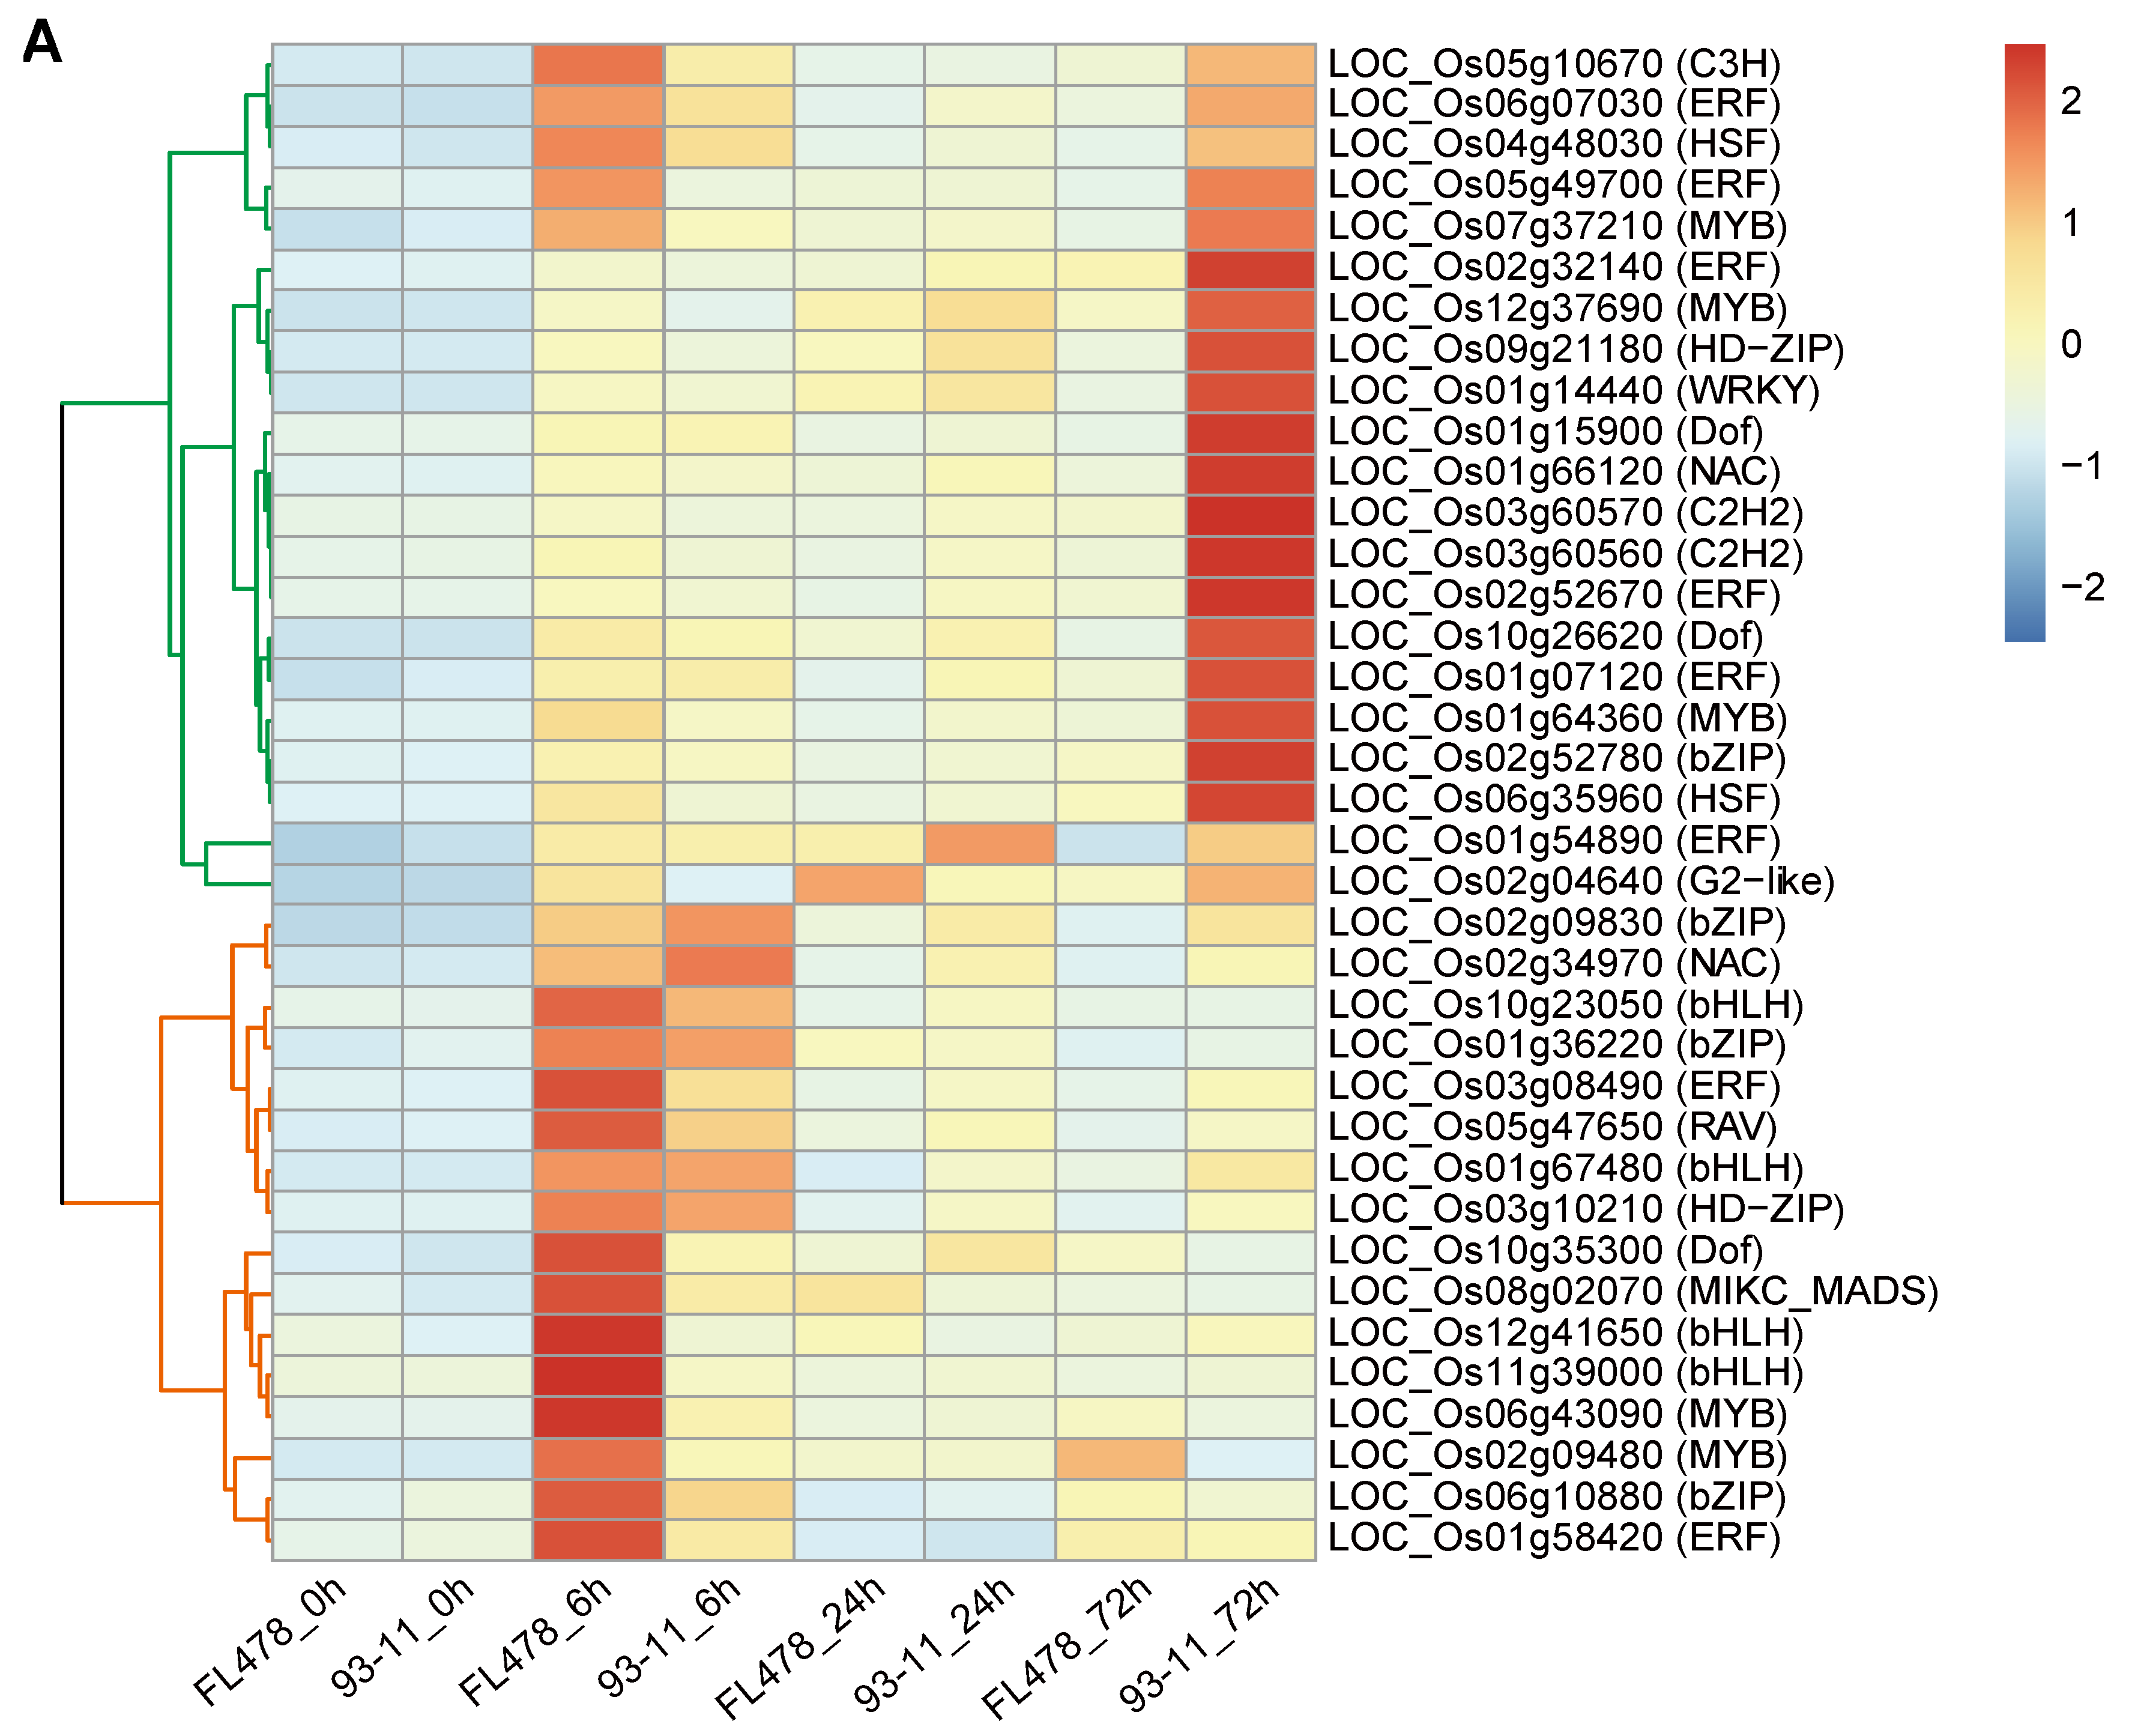
3.4. Differential Expression of Transcription Factors and ROS Scavenging Genes Is Correlated to Salt Tolerance

Transcription factors play an important role in salt stress regulation, since a particular TF affects the expression of a group of salt tolerance genes [38]. As shown in Figure 2B, salt tolerance genes were enriched in transcription regulator activity especially under 6 h salt stress. Further analysis revealed a total of 38 TFs that were more upregulated by short-term salt stress in FL478 than in 93-11 (Figure 4A and Table S7). These TFs belonged to the ERF, MYB, bHLH, bZIP, Dof, HD-ZIP, HSF, NAC, C3H, G2-like, MADS, RAV, SRS, and WRKY families. Notably, these genes were roughly divided into two groups according to their expression levels at 72 h: the genes from the first group expressed lower in FL478 than in 93-11, while those from the second group showed comparable expression levels between FL478 and 93-11 (Figure 4A). This result suggests that these transcription factors play an important regulatory role in rice responding to salt stress and re-emphasizes that the salt-tolerant cultivar FL478 responds faster than the salt-sensitive cultivar 93-11 under salt conditions.
The higher activity of antioxidant enzymes is responsible for the better tolerance conferred by the tolerant varieties [18,39]. Consistently, the salt-tolerance genes were enriched in oxidative-related metabolisms at 6 h, 24 h, and 72 h in this work (Figure 2). In total, 23 ROS scavenging genes were identified (Figure 4B and Table S8). Of these, 13 genes were expressed higher in FL478 than in 93-11 at 6 h under salt, while only two and eight genes were identified at 24 h and 72 h, respectively. The higher number of DEGs detected at 6 h than 24 h and 72 h indicated a requirement of more genes to scavenge oxidative damages at the early stage, and also suggested a quicker transcriptional response of FL478 than 93-11 under salt conditions.
Figure 4. The expression profiles of salt tolerance genes related to TFs (A) and oxidoreductases (B). Normalized FPKM was used to create the heatmap.
Agronomy 12 01163 g004aAgronomy 12 01163 g004b

3.5. Interaction Network of Key Genes Relevant to Salt Tolerance

To better understand the interactions of salt-tolerance genes in rice, the weighted gene co-expression networks were investigated using all DEGs detected in FL478 and 93-11 under salt conditions (Figure 5A). In total, eleven co-expressed gene modules were identified (Figure 5B). Because FL478 had a quicker response than 93-11 under salt stress and transcription regulator was specifically enriched at 6 h (Figure 2B), we mainly focused on analyzing the interaction network of genes in the pink module, which was significantly associated with the higher expression levels of FL478 at 6 h (Figure 5B). In total, 274 genes were included in the pink module, of which 46 were salt-tolerance genes. Expression profiles of the pink module showed a high expression of FL478 at 6 h under salt treatment (Figure 5C,D), confirming the accuracy of gene module classification. Further analysis found that nine TFs were highly interacted with 14 transporters and three anti-oxidases in a co-expression network (Figure 5E and Table S9), providing a potential regulatory relationship of salt tolerance genes in rice. However, the function of these genes needs to be further validated by experiments.

3.6. Validation of the DEGs by qRT-PCR

Eleven salt-tolerance genes related to TFs, hormones, transporters, and anti-oxidases were selected to examine their expression levels by qRT-PCR. The Pearson correlations between RNA-seq and qRT-PCR ranged from 0.86 to 0.99 with an average of 0.93 (Table S1), supporting a reliable of expression profiles detected by RNA-seq in this work.

4. Discussion

The increasing soil salinization and global population growth have increased human demand for crop production [1,2]. Improving rice adaptation on saline soil is an effective strategy to increase food production on limited land resources. For this purpose, a comparative transcriptome analysis was performed to investigate the molecular mechanisms in a salt-tolerant cultivar FL478 relative to a salt-sensitive cultivar 93-11. These findings will uncover salt-tolerance genes and the underlying molecular mechanisms in rice.
Identification of salt tolerance genes is the first priority of this work. DEGs specifically/more upregulated in tolerant cultivars than in sensitive cultivars were identified as salt tolerance genes [29]. Here, a total of 1423, 175, and 224 salt-tolerance genes were identified in FL478 relative to 93-11 at 6 h, 24 h, and 72 h after salt stress, respectively (Figure 2). Further analysis found that transport-related molecular functions were enriched in all three timepoints along salt stress. Among the salt-tolerant transporters identified, a large number of known salt-resistance genes were reported, including one cation/H+ exchanger (CHX), one high-affinity K+ transporter (HKT1), one vacuolar ATPase, and eleven lipid-transfer protein (LTP) genes (Figure 3 and Table S6). The CHX genes have been demonstrated to operate as a K+/H+ antiporter to control K+ acquisition and homeostasis [40]. The HKT genes functioned as high-affinity K+-Na+ cotransporters to maintain intracellular K+ and Na+ homeostasis for sodium tolerance [41] and controlled root-to-shoot Na+ transfer in rice [12]. Additionally, the V-type proton ATPase participated in the response of plants to external salt stress and played a key role in Na+/H+ transport [42,43]. In addition, LTP genes were reported to improve plants resistance under salt stress conditions [44,45,46]. Together, these results suggested that FL478 has a more efficient transport mechanism, which contributes to its strong tolerance under salt stress.
Significant ROS accumulation under salt stress will cause oxidative damage and eventually result in cell death [3,6,7]. Low ROS concentrations function as a signal to activate salt-stress responses [6], while high ROS concentrations damage proteins, lipids, DNA, and carbohydrates [47]. ROS is a secondary stress induced by salt stress, and accordingly, the ROS scavenge enzymes are activated. Our functional enrichment showed that the genes related to peroxidase activities and oxidoreductase activities were significantly enriched at 6 h and 72 h after salt stress, respectively. Specifically, two thioredoxin, seven peroxidases, ten oxidoreductases, one glutaredoxin (Grx), one slender and crinklyleaf (SLC), and two glutathione peroxidases (GPXs) were more upregulated in FL478 than in 93-11 (Figure 4B). The results indicate that FL478 uses a more efficient antioxidant system to maintain its strong tolerance to salt stress.
TFs play crucial roles in regulating the expression of various salt tolerance genes in plants [3,7]. In the present study, salt-tolerance genes were enriched in transcription regulator activity, especially at 6 h after salt treatment. A total of 38 salt-tolerance TFs were found, and they were classified into the ERF, MYB, bHLH, bZIP, Dof, HD-ZIP, HSF, NAC, C3H, G2-like, MADS, RAV, SRS, and WRKY families (Figure 4A). Many such kinds of TFs have previously been demonstrated to regulate salt tolerance in rice [12,14,21]. NAC transcription factors OsNAC3 and OsNAC45 played vital roles in rice salt tolerance via abscisic acid (ABA) signaling [48,49]. bZIP transcription factors such as ABF2 and ABF4 were salt- and ABA-inducible [50]. In this work, the salt tolerance TFs NAC002 and NAC104 were co-expressed with ABF4 and ABF2, respectively, suggesting a major role of these TFs in rice salt tolerance through a coordinated expression regulation of ABA signaling pathways. Four MYB-type salt tolerance TFs were also included in this work, of which OsMYB102 has been demonstrated to be involved in salt and drought stresses [51]. In addition, one homolog of GhWRKY6 acting as a negative regulator during drought and salt stresses [52] was identified as a salt tolerance TF (Table S7). This evidence suggested a crucial role of these TFs in improving FL478 tolerance to salt stress.
Interestingly, most salt-tolerance genes responded to salt stress at 6 h in FL478, while a few proportion highly expressed at 72 h in 93-11 (Figure 3 and Figure 4). These results imply that FL478 has a quicker response to salt stress relative to 93-11, which may be an important reason for its salt resistance [53,54]. The co-expression network of these salt-tolerance genes was further investigated (Figure 5E). Moreover, these genes can be regarded as key regulators and functional genes for genetic improvement of salt tolerance in rice.

5. Conclusions

In this work, a comparative transcriptome analysis was performed to identify salt-tolerance genes using two contrasting rice cultivars with different salt responses. In total, 1423, 175, and 224 salt-tolerance genes were identified at 6 h, 24 h, and 72 h under salt treatment, respectively. These genes were commonly enriched in transport and peroxidase/oxidoreductase activity across all timepoints, but specially enriched in transcription regulator activity at 6 h under salt stress. The expression profiles of these related genes were subsequently investigated, revealing a faster transcriptional response in FL478 than in 93-11 under salt. A gene co-expression network was also constructed to demonstrate the regulatory relationship of transporters, TFs, and ROS scavenging genes in response to salt conditions. These findings will improve our understanding of the molecular mechanism of salt tolerance in rice, and the identified salt tolerance genes are useful candidates for the genetic improvement of salt-tolerant rice.

Supplementary Materials

The following supporting information can be downloaded at: https://www.mdpi.com/article/10.3390/agronomy12051163/s1. Figure S1. Phenotype of FL478 and 93-11 seedlings at 0, 6, 24, and 72 h after salt stress. Table S1. The primers used for qRT-PCR and the expression correlations between RNA-seq and qRT-PCR. Table S2. The DEGs identified in 93-11 and FL478 at 6 h, 24 h, and 72 h compared with the control (0 h) upon salt stress. Table S3. Cluster classification of all the DEGs. Table S4. Salt-tolerance genes identified in FL478 relative to 93-11. Table S5. GO enrichment of salt-tolerance genes identified at 6 h, 24 h, and 72 h upon salt stress, respectively. Table S6. The list of salt-tolerance genes related to transporters. Table S7. The list of salt tolerance genes related to transcriptional factors. Table S8. The list of salt-tolerance genes related to ROS. Table S9. The list of co-expression genes presented in Figure 5E.

Author Contributions

Z.D. and W.H. contributed to the conception and design of this work. X.Y. performed the dry analysis. W.T. performed the wet experiments. J.X. provided the materials and participated in discussion. X.Y. wrote the draft and Z.D. polished the manuscript. All authors have read and agreed to the published version of the manuscript.

Funding

This work was supported by the 2020 Research Program of Sanya Yazhou Bay Science and Technology City (No. SKJC-2020-02-002) and the Key Science and Technology Program of Hainan Province (No. ZDKJ202001).

Institutional Review Board Statement

Not applicable.

Informed Consent Statement

Not applicable.

Data Availability Statement

RNA-Seq data in this study have been deposited in NCBI under the accession of PRJNA812391.

Conflicts of Interest

The authors declare no conflict of interest.

References

  1. Rengasamy, P. Soil processes affecting crop production in salt-affected soils. Funct. Plant Biol. 2010, 37, 613–620. [Google Scholar] [CrossRef]
  2. Tilman, D.; Balzer, C.; Hill, J.; Befort, B.L. Global food demand and the sustainable intensification of agriculture. Proc. Natl. Acad. Sci. USA 2011, 108, 20260–20264. [Google Scholar] [CrossRef] [PubMed] [Green Version]
  3. Deinlein, U.; Stephan, A.B.; Horie, T.; Luo, W.; Xu, G.; Schroeder, J.I. Plant salt-tolerance mechanisms. Trends Plant Sci. 2014, 19, 371–379. [Google Scholar] [CrossRef] [PubMed] [Green Version]
  4. Zhu, J. Salt and drought stress signal transduction in plants. Annu. Rev. Plant Biol. 2002, 53, 247–273. [Google Scholar] [CrossRef] [Green Version]
  5. Zhu, J. Abiotic Stress Signaling and Responses in Plants. Cell 2016, 167, 313–324. [Google Scholar] [CrossRef] [Green Version]
  6. Mittler, R.; Vanderauwera, S.; Gollery, M.; Van Breusegem, F. Reactive oxygen gene network of plants. Trends Plant Sci. 2004, 9, 490–498. [Google Scholar] [CrossRef]
  7. Van Zelm, E.; Zhang, Y.; Testerink, C. Salt tolerance mechanisms of plants. Annu. Rev. Plant Biol. 2020, 29, 403–433. [Google Scholar]
  8. Schroeder, J.I.; Delhaize, E.; Frommer, W.B.; Guerinot, M.L.; Harrison, M.J.; Herrera-Estrella, L.; Horie, T.; Kochian, L.V.; Munns, R.; Nishizawa, N.K.; et al. Using membrane transporters to improve crops for sustainable food production. Nature 2013, 497, 60–66. [Google Scholar] [CrossRef] [Green Version]
  9. Wang, R.; Jing, W.; Xiao, L.; Jin, Y.; Shen, L.; Zhang, W. The Rice High-Affinity Potassium Transporter1;1 Is Involved in Salt Tolerance and Regulated by an MYB-Type Transcription Factor. Plant Physiol. 2015, 168, 1076–1090. [Google Scholar] [CrossRef] [Green Version]
  10. Liu, D.; Li, Y.; Zhou, Z.; Xiang, X.; Liu, X.; Wang, J.; Hu, Z.; Xiang, S.; Li, W.; Xiao, Q.; et al. Tobacco transcription factor bHLH123 improves salt tolerance by activating NADPH oxidase NtRbohE expression. Plant Physiol. 2021, 186, 1706–1720. [Google Scholar] [CrossRef]
  11. He, L.; Bian, J.; Xu, J.; Yang, K. Novel Maize NAC Transcriptional Repressor ZmNAC071 Confers Enhanced Sensitivity to ABA and Osmotic Stress by Downregulating Stress-Responsive Genes in Transgenic Arabidopsis. J. Agric. Food Chem. 2019, 67, 8905–8918. [Google Scholar] [CrossRef]
  12. Cotsaftis, O.; Plett, D.; Johnson, A.A.; Walia, H.; Wilson, C.; Ismail, A.M.; Close, T.J.; Tester, M.; Baumann, U. Root-Specific Transcript Profiling of Contrasting Rice Genotypes in Response to Salinity Stress. Mol. Plant 2011, 4, 25–41. [Google Scholar] [CrossRef] [Green Version]
  13. Senadheera, P.; Singh, R.K.; Maathuis, F.J.M. Differentially expressed membrane transporters in rice roots may contribute to cultivar dependent salt tolerance. J. Exp. Bot. 2009, 60, 2553–2563. [Google Scholar] [CrossRef] [Green Version]
  14. Walia, H.; Wilson, C.; Condamine, P.; Liu, X.; Ismail, A.M.; Zeng, L.; Wanamaker, S.I.; Mandal, J.; Xu, J.; Cui, X.; et al. Comparative Transcriptional Profiling of Two Contrasting Rice Genotypes under Salinity Stress during the Vegetative Growth Stage. Plant Physiol. 2005, 139, 822–835. [Google Scholar] [CrossRef] [Green Version]
  15. Zhao, S.; Fung-Leung, W.-P.; Bittner, A.; Ngo, K.; Liu, X. Comparison of RNA-Seq and Microarray in Transcriptome Profiling of Activated T Cells. PLoS ONE 2014, 9, e78644. [Google Scholar] [CrossRef]
  16. Chen, J.; Li, X.; Ye, X.; Guo, P.; Hu, Z.; Qi, G.; Cui, F.; Liu, S. An S-ribonuclease binding protein EBS1 and brassinolide signaling are specifically required for Arabidopsis tolerance to bicarbonate. J. Exp. Bot. 2021, 72, 1449–1459. [Google Scholar] [CrossRef]
  17. Ye, X.; Zhao, X.; Sun, Y.; Zhang, M.; Feng, S.; Zhou, A.; Wu, W.; Ma, S.; Liu, S. The underlying molecular conservation and diversification of dioecious flower and leaf buds provide insights into the development, dormancy breaking, flowering, and sex association of willows. Plant Physiol. Biochem. 2021, 167, 651–664. [Google Scholar] [CrossRef]
  18. Ye, X.; Wang, H.; Cao, X.; Jin, X.; Cui, F.; Bu, Y.; Liu, H.; Wu, W.; Takano, T.; Liu, S. Transcriptome profiling of Puccinellia tenuiflora during seed germination under a long-term saline-alkali stress. BMC Genom. 2019, 20, 589. [Google Scholar] [CrossRef]
  19. Jahan, N.; Lv, Y.; Song, M.; Zhang, Y.; Shang, L.; Lu, Y.; Ye, G.; Qian, Q.; Gao, Z.; Guo, L. Transcriptomic Analysis of Short-Term Salt-Stress Response in Mega Hybrid Rice Seedlings. Agronomy 2021, 11, 1328. [Google Scholar] [CrossRef]
  20. Zhou, X.; Dou, Y.; Huang, X.; Li, G.; Zhang, H.; Jiang, D.; Fan, J.; Condori-Apfata, J.; Liu, X.; Condori-Pacsi, S.; et al. Using Principal Component Analysis and RNA-Seq to Identify Candidate Genes That Control Salt Tolerance in Garlic (Allium sativum L.). Agronomy 2021, 11, 691. [Google Scholar] [CrossRef]
  21. Mansuri, R.M.; Shobbar, Z.-S.; Jelodar, N.B.; Ghaffari, M.R.; Nematzadeh, G.; Asari, S. Dissecting molecular mechanisms underlying salt tolerance in rice: A comparative transcriptional profiling of the contrasting genotypes. Rice 2019, 12, 13. [Google Scholar] [CrossRef]
  22. Cartagena, J.A.; Yao, Y.; Mitsuya, S.; Tsuge, T. Comparative transcriptome analysis of root types in salt tolerant and sensitive rice varieties in response to salinity stress. Physiol. Plant. 2021, 173, 1629–1642. [Google Scholar] [CrossRef]
  23. Gregorio, G.; Senadhir, D.; Mendoza, R. Screening Rice for Salinity Tolerance; IRRI Discussion Paper Series; IRRI: Los Baños, Philippines, 1997; Volume 22. [Google Scholar]
  24. Zhao, L.; Lin, J.; Meng, J.; Ming-Li, G.; Ying-Hao, C.; Li-Juan, L.; Zhen-Wei, C.; Li-Yun, L.; Guo-Zhen, L. Expression on profiling of rice PP2Ac type phosphatase proteins in seedlings under salt-stressed conditions. Sci. Agric. Sin. 2012, 45, 2339–2345. [Google Scholar]
  25. Bolger, A.M.; Lohse, M.; Usadel, B. Trimmomatic: A flexible trimmer for Illumina sequence data. Bioinformatics 2014, 30, 2114–2120. [Google Scholar] [CrossRef] [Green Version]
  26. Kawahara, Y.; de la Bastide, M.; Hamilton, J.P.; Kanamori, H.; McCombie, W.R.; Ouyang, S.; Schwartz, D.C.; Tanaka, T.; Wu, J.; Zhou, S.; et al. Improvement of the Oryza sativa Nipponbare reference genome using next generation sequence and optical map data. Rice 2013, 6, 4. [Google Scholar] [CrossRef] [Green Version]
  27. Pertea, M.; Kim, D.; Pertea, G.M.; Leek, J.T.; Salzberg, S.L. Transcript-level expression analysis of RNA-seq experiments with HISAT, StringTie and Ballgown. Nat. Protoc. 2016, 11, 1650–1667. [Google Scholar] [CrossRef]
  28. Love, M.I.; Huber, W.; Anders, S. Moderated estimation of fold change and dispersion for RNA-seq data with DESeq2. Genome Biol. 2014, 15, 550. [Google Scholar] [CrossRef] [Green Version]
  29. Hu, W.; Ding, Z.; Tie, W.; Yan, Y.; Liu, Y.; Wu, C.; Liu, J.; Wang, J.; Peng, M.; Xu, B.; et al. Comparative physiological and transcriptomic analyses provide integrated insight into osmotic, cold, and salt stress tolerance mechanisms in banana. Sci. Rep. 2017, 7, 43007. [Google Scholar] [CrossRef]
  30. Wu, M.; Gu, L. TCseq: Time Course Sequencing Data Analysis. R Package Version 1.16.0. 2021. Available online: http://bioconductor.riken.jp/packages/release/bioc/html/TCseq.html (accessed on 25 January 2022).
  31. Klopfenstein, D.V.; Zhang, L.; Pedersen, B.S.; Ramírez, F.; Vesztrocy, A.W.; Naldi, A.; Mungall, C.J.; Yunes, J.M.; Botvinnik, O.; Weigel, M.; et al. GOATOOLS: A Python library for Gene Ontology analyses. Sci. Rep. 2018, 8, 10872. [Google Scholar] [CrossRef]
  32. Wickham, H. ggplot2: Elegant Graphics for Data Analysis; Springer: New York, NY, USA, 2016. [Google Scholar]
  33. Tian, F.; Yang, D.C.; Meng, Y.Q.; Jin, J.; Gao, G. PlantRegMap: Charting functional regulatory maps in plants. Nucleic Acids Res. 2020, 48, D1104–D1113. [Google Scholar] [CrossRef]
  34. Langfelder, P.; Horvath, S. WGCNA: An R package for weighted correlation network analysis. BMC Bioinform. 2008, 9, 559. [Google Scholar] [CrossRef] [PubMed] [Green Version]
  35. Shannon, P.; Markiel, A.; Ozier, O.; Baliga, N.S.; Wang, J.T.; Ramage, D.; Amin, N.; Schwikowski, B.; Ideker, T. Cytoscape: A software environment for integrated models of Biomolecular Interaction Networks. Genome Res. 2003, 13, 2498–2504. [Google Scholar] [CrossRef] [PubMed]
  36. Fu, L.; Ding, Z.; Han, B.; Hu, W.; Li, Y.; Zhang, J. Physiological Investigation and Transcriptome Analysis of Polyethylene Glycol (PEG)-Induced Dehydration Stress in Cassava. Int. J. Mol. Sci. 2016, 17, 283. [Google Scholar] [CrossRef] [PubMed] [Green Version]
  37. Livak, K.J.; Schmittgen, T.D. Analysis of relative gene expression data using real-time quantitative PCR and the 2−ΔΔCT Method. Methods 2001, 25, 402–408. [Google Scholar] [CrossRef] [PubMed]
  38. Ganie, S.A.; Molla, K.A.; Henry, R.J.; Bhat, K.V.; Mondal, T.K. Advances in understanding salt tolerance in rice. Theor. Appl. Genet. 2019, 132, 851–870. [Google Scholar] [CrossRef] [PubMed]
  39. Caverzan, A.; Casassola, A.; Brammer, S.P. Antioxidant responses of wheat plants under stress. Genet. Mol. Biol. 2016, 39, 1–6. [Google Scholar] [CrossRef] [Green Version]
  40. Cellier, F.; Conejero, G.; Ricaud, L.; Luu, D.T.; Lepetit, M.; Gosti, F.; Casse, F. Characterization of AtCHX17, a member of the cation/H+ exchangers, CHX family, from Arabidopsis thaliana suggests a role in K+ homeostasis. Plant J. 2004, 39, 834–846. [Google Scholar] [CrossRef]
  41. Rubio, F.; Gassmann, W.; Schroeder, J.I. Sodium-Driven Potassium Uptake by the Plant Potassium Transporter HKT1 and Mutations Conferring Salt Tolerance. Science 1995, 270, 1660–1663. [Google Scholar] [CrossRef]
  42. Wang, P.; Guo, Y.; Wang, Y.; Gao, C. Vacuolar membrane H+-ATPase c subunit gene (ThVHAc 1) from Tamarix hispida Willd improves salt stress tolerance. Plant Physiol. Biochem. 2020, 157, 370–378. [Google Scholar] [CrossRef]
  43. Kabała, K.; Janicka-Russak, M.; Reda, M.; Migocka, M. Transcriptional regulation of the V-ATPase subunit c and V-PPase isoforms in Cucumis sativus under heavy metal stress. Physiol. Plantarum. 2014, 150, 32–45. [Google Scholar] [CrossRef]
  44. Xu, Y.; Zheng, X.; Song, Y.; Zhu, L.; Yu, Z.; Gan, L.; Zhou, S.; Liu, H.; Wen, F.; Zhu, C. NtLTP4, a lipid transfer protein that enhances salt and drought stresses tolerance in Nicotiana tabacum. Sci. Rep. 2018, 8, 8873. [Google Scholar] [CrossRef] [Green Version]
  45. Dhar, N.; Caruana, J.; Erdem, I.; Raina, R. An Arabidopsis disease related nonspecific lipid transfer protein 1 is required for resistance against various phytopathogens and tolerance to salt stress. Gene 2020, 753, 144802. [Google Scholar] [CrossRef]
  46. Lee, S.B.; Suh, M.-C. Disruption of glycosylphosphatidylinositol-anchored lipid transfer protein 15 affects seed coat permeability in Arabidopsis. Plant J. 2018, 96, 1206–1217. [Google Scholar] [CrossRef]
  47. Miller, G.; Suzuki, N.; Ciftci-Yilmaz, S.; Mittler, R. Reactive oxygen species homeostasis and signalling during drought and salinity stresses. Plant Cell Environ. 2010, 33, 453–467. [Google Scholar] [CrossRef]
  48. Zhang, X.; Long, Y.; Chen, X.; Zhang, B.; Xin, Y.; Li, L.; Cao, S.; Liu, F.; Wang, Z.; Huang, H.; et al. A NAC transcription factor OsNAC3 positively regulates ABA response and salt tolerance in rice. BMC Plant Biol. 2021, 21, 54. [Google Scholar] [CrossRef]
  49. Zhang, X.; Long, Y.; Huang, J.; Xia, J. OsNAC45 is Involved in ABA Response and Salt Tolerance in Rice. Rice 2020, 13, 79. [Google Scholar] [CrossRef]
  50. Kim, S.Y. The role of ABF family bZIP class transcription factors in stress response. Physiol. Plant. 2006, 126, 519–527. [Google Scholar] [CrossRef]
  51. Piao, W.; Sakuraba, Y.; Paek, N.C. Transgenic expression of rice MYB102 (OsMYB102) delays leaf senescence and decreases abiotic stress tolerance in Arabidopsis thaliana. BMB Rep. 2019, 52, 653–658. [Google Scholar] [CrossRef] [Green Version]
  52. Li, Z.; Li, L.; Zhou, K.; Zhang, Y.; Han, X.; Din, Y.; Ge, X.; Qin, W.; Wang, P.; Li, F.; et al. GhWRKY6 Acts as a Negative Regulator in Both Transgenic Arabidopsis and Cotton during Drought and Salt Stress. Front. Genet. 2019, 10, 392. [Google Scholar] [CrossRef]
  53. Wang, X.; Liu, H.; Yu, F.; Hu, B.; Jia, Y.; Sha, H.; Zhao, H. Differential activity of the antioxidant defence system and alterations in the accumulation of osmolyte and reactive oxygen species under drought stress and recovery in rice (Oryza sativa L.) tillering. Sci. Rep. 2019, 9, 8543. [Google Scholar] [CrossRef]
  54. Moradi, F.; Ismail, A.M. Responses of Photosynthesis, Chlorophyll Fluorescence and ROS-Scavenging Systems to Salt Stress During Seedling and Reproductive Stages in Rice. Ann. Bot. 2007, 99, 1161–1173. [Google Scholar] [CrossRef] [Green Version]
Figure 1. The DEGs identified in FL478 and 93-11 upon salt treatment. (A) The number of DEGs detected in FL478 and 93-11 under salt conditions. (BH) Seven gene clusters of all the DEGs. Membership values indicate the degree of genes belonging to the clusters.
Agronomy 12 01163 g001
Figure 2. The salt-tolerance genes identified in FL478 relative to 93-11. (A,C,E) Venn diagrams of DEGs identified at 6 h, 24 h, and 72 h, respectively. The salt tolerance genes were defined as those DEGs specifically regulated or more (i.e., >two-fold) changed in FL478 relative to 93-11. (B,D,F) GO enrichment of salt tolerance genes at 6 h, 24 h, and 72 h after salt treatment.
Agronomy 12 01163 g002
Figure 3. The heatmap of salt tolerance genes related to transporters. The fold-change was centered and scaled in the row direction.
Agronomy 12 01163 g003
Figure 5. The weighted gene co-expression network analysis. (A) The hierarchical cluster tree constructed with a total of 3234 DEGs. The eleven co-expression modules are indicated by the corresponding colors. (B) The pink module significantly related to the gene expression of FL478 at 6 h upon salt stress. (C) Expression profiles of 274 DEGs in the pink module. (D) The average expression of 274 DEGs in the pink module. (E) Co-expression networks of salt-tolerance genes related to TFs, transporters, and ROS scavenging. The shape and color represent gene types, and the graph size represents fold-change of genes at 6 h compared with 0 h in FL478 upon salt treatment.
Agronomy 12 01163 g005
Publisher’s Note: MDPI stays neutral with regard to jurisdictional claims in published maps and institutional affiliations.

