Article

Temporal and Spatial Dynamics of Carbon Storage in Qinghai Grasslands

1
Key Laboratory of Adaptation and Evolution of Plateau Biota, Northwest Institute of Plateau Biology, Chinese Academy of Sciences, Xining 810008, China
2
State Key Laboratory of Plateau Ecology and Agriculture, Qinghai University, Xining 810016, China
3
State Key Laboratory of Desert and Oasis Ecology, Xinjiang Institute of Ecology and Geography, Chinese Academy of Sciences, Urumqi 830011, China
4
Key Laboratory of Restoration Ecology for Cold Regions Laboratory in Qinghai, Northwest Institute of Plateau Biology, Chinese Academy of Sciences, Xining 810008, China
5
University of the Chinese Academy of Sciences, Beijing 100049, China
*
Author to whom correspondence should be addressed.
Agronomy 2022, 12(5), 1201; https://doi.org/10.3390/agronomy12051201
Submission received: 13 April 2022 / Revised: 5 May 2022 / Accepted: 13 May 2022 / Published: 17 May 2022

Abstract

:
Accurate quantification of ecosystem carbon storage dynamics is very important in regional ecological management. However, the dynamics of grassland carbon storage in Qinghai, China, are still unexplored. We investigated the temporal and spatial dynamics of carbon storage in the Qinghai grasslands from 1979 to 2018, using the spatially explicit Biome-BGCMuSo model. The average annual value of vegetation carbon density (VCD) was 52.71 gC·m−2. After 2000, VCD showed an overall increasing trend, with an average rate of 2.14 gC·m−2. The VCD was relatively high in the eastern and southeastern regions of Qinghai compared with that in the western and central areas. The increasing trend in VCD was mainly observed in the eastern and southeastern regions, while a decreasing trend was evident in western and central Qinghai. Annual soil organic carbon density (SOCD) in Qinghai grasslands generally increased from 1979 to 2018. After 2001, the SOCD increased by an average rate of 7.07 gC·m−2. The SOCD was relatively high in eastern and southeastern Qinghai compared with that in western and central Qinghai. The pronounced increasing trend of SOCD was mainly distributed in the southeast and northeast parts of Qinghai, while the decreasing trend was mainly distributed in the area between southeast and northeast Qinghai, and in the central and western regions. This study deepened our understanding of carbon dynamics in the Qinghai grasslands and provided data for guiding the ecological restoration and carbon management of local grasslands.

1. Introduction

Annual CO2 emissions from natural and human-made sources are estimated at approximately 250 Pg worldwide, while the global ecosystem absorbs approximately 230 Pg per year [1,2]. Thus, the global carbon cycle is imbalanced. Terrestrial ecosystems play an important role in the global carbon cycle that has attracted extensive attention from the international community [3,4]. Terrestrial ecosystems can continuously absorb CO2 from the atmosphere through photosynthesis in plants and can fix carbon in plant biomass and soil through a series of biophysical and chemical actions (sequestration), which slows down the global climate change caused by the build-up of greenhouse gases [5,6,7]. Carbon sequestration not only affects the global climate change, it is also closely related to the political and economic development of various countries [1,4].
As the most important part of the terrestrial ecosystem, grassland ecosystems are widely distributed on Earth [8], and form an important component of the terrestrial ecosystem carbon cycle [8,9]. Grassland ecosystems are a huge carbon pool, accounting for one-third of the global terrestrial ecosystem carbon pools, second only to forest ecosystems [1,10]. They play a very important role in regional carbon fixation. Understanding carbon fixation in grassland ecosystems can help us accurately evaluate the contribution of these ecosystems to the carbon budget and their response to climate change. These data are urgently needed to ensure that grassland resources are sustainably utilized and protected. The accurate estimation of grassland carbon storage not only aids the systematic evaluation of the ecological value of grasslands as it provides data for mitigating global climate change scientifically, but also lays a solid foundation for the study of global climate change.
Recent studies focused on grassland carbon storage using different methods at the regional or national scales [11,12]. However, due to the differences in grassland distribution range, grassland area, time period of assessment, and estimation methods, previous studies showed wide variations in the grassland carbon pool. Qinghai, located in the northeast part of the Qinghai–Tibet Plateau, is the birthplace of the Yellow River, Yangtze River, and Lancang River. Because ecological degradation can lead to serious water and soil erosion, it then influences the river water quality and dynamics [3,5,6]. The ecological health of this region has relevance for sustainable development in China and even the entire northern hemisphere [13,14,15]. Moreover, this regional ecosystem differs from other regional ecosystems in terms of biogeochemical processes, due to its high altitude and low temperature [16,17,18]. The vegetation and soil in this region are extremely sensitive to climate change and play an important role in global change [16,19]. Grass is the vegetation with the widest distribution in Qinghai. Grasslands are the most important ecosystem for maintaining the balance of the greater alpine ecosystem in this region [5,11].
Previous studies focused on carbon storage in the grassland ecosystem in Qinghai at the site scale through sample surveys, or in different regions through multi-source data modeling [20,21,22]. Various estimation methods and research scales have resulted in huge differences in the results of different studies, making comprehensive comparison difficult. For example, Li et al. [23] investigated the soil carbon pools in natural alpine grassland using field data from Gangcha County, Qinghai Province, China. They found that the average soil organic carbon (SOC) value was 96.0 Mg C·ha−1. Du et al. [24] investigated the SOC in the Qinghai grasslands using field data from 41 paired soil profiles. They reported that the average SOC values of nondegraded and degraded grasslands were 3.4 ± 0.3% and 2.4 ± 0.4%, respectively. Wang et al. [25] modeled the spatial distribution of SOC for a complex terrain based on geographically weighted regression in the eastern Qinghai–Tibetan Plateau. They found that the soil organic carbon density (SOCD) ranged from 1.08 to 18.32 kg·m−2 for the upper 50 cm of the soil, with higher values on the mountain slopes and lower values in the mountain valleys and basins.
Despite these efforts, the temporal and spatial patterns of the grassland ecosystem carbon pool in Qinghai remain unclear, restricting our understanding of the dynamics of carbon storage in the Qinghai grasslands and their response to climate change. In recent years, temperature in an area covered with grassland in Qinghai has generally tended to be higher [18,26,27]. However, the impact of climate change on carbon storage in the Qinghai grasslands was not clarified, which limits our ability to sustainably use the grassland resources in Qinghai.
An ecosystem is a complex system composed of linked biological communities and their environment. The structure and functions of an ecosystem are complex and changeable [28,29]. Process-based ecological models are considered powerful tools for studying complex ecosystems [22,30]. These models attempt to explain ecosystem function by modeling the mechanisms within plants that cause them to grow, breathe, die, and decay. They can be targeted to analyze the potential impact of climate change and other factors on natural ecosystems [31,32]. Therefore, researchers are increasingly using the process-based model, and its application in ecological research is almost essential. To date, many process-based models can simulate the dynamics of ecosystem carbon storage on a long time series and a large spatial scale [22,33,34]. Among these models, the Biome-BGCMuSo model was proved to be highly applicable in the Qinghai grasslands [35,36]. In addition, the spatial simulation function of this model was realized in our previous study [36].
In the present study, we used the spatially explicit Biome-BGCMuSo model to evaluate carbon storage dynamics over a large area. We aimed to quantify the spatiotemporal dynamics of vegetation carbon (VC) (total of aboveground and belowground) and SOC in the Qinghai grasslands from 1979 to 2018.

2. Materials and Methods
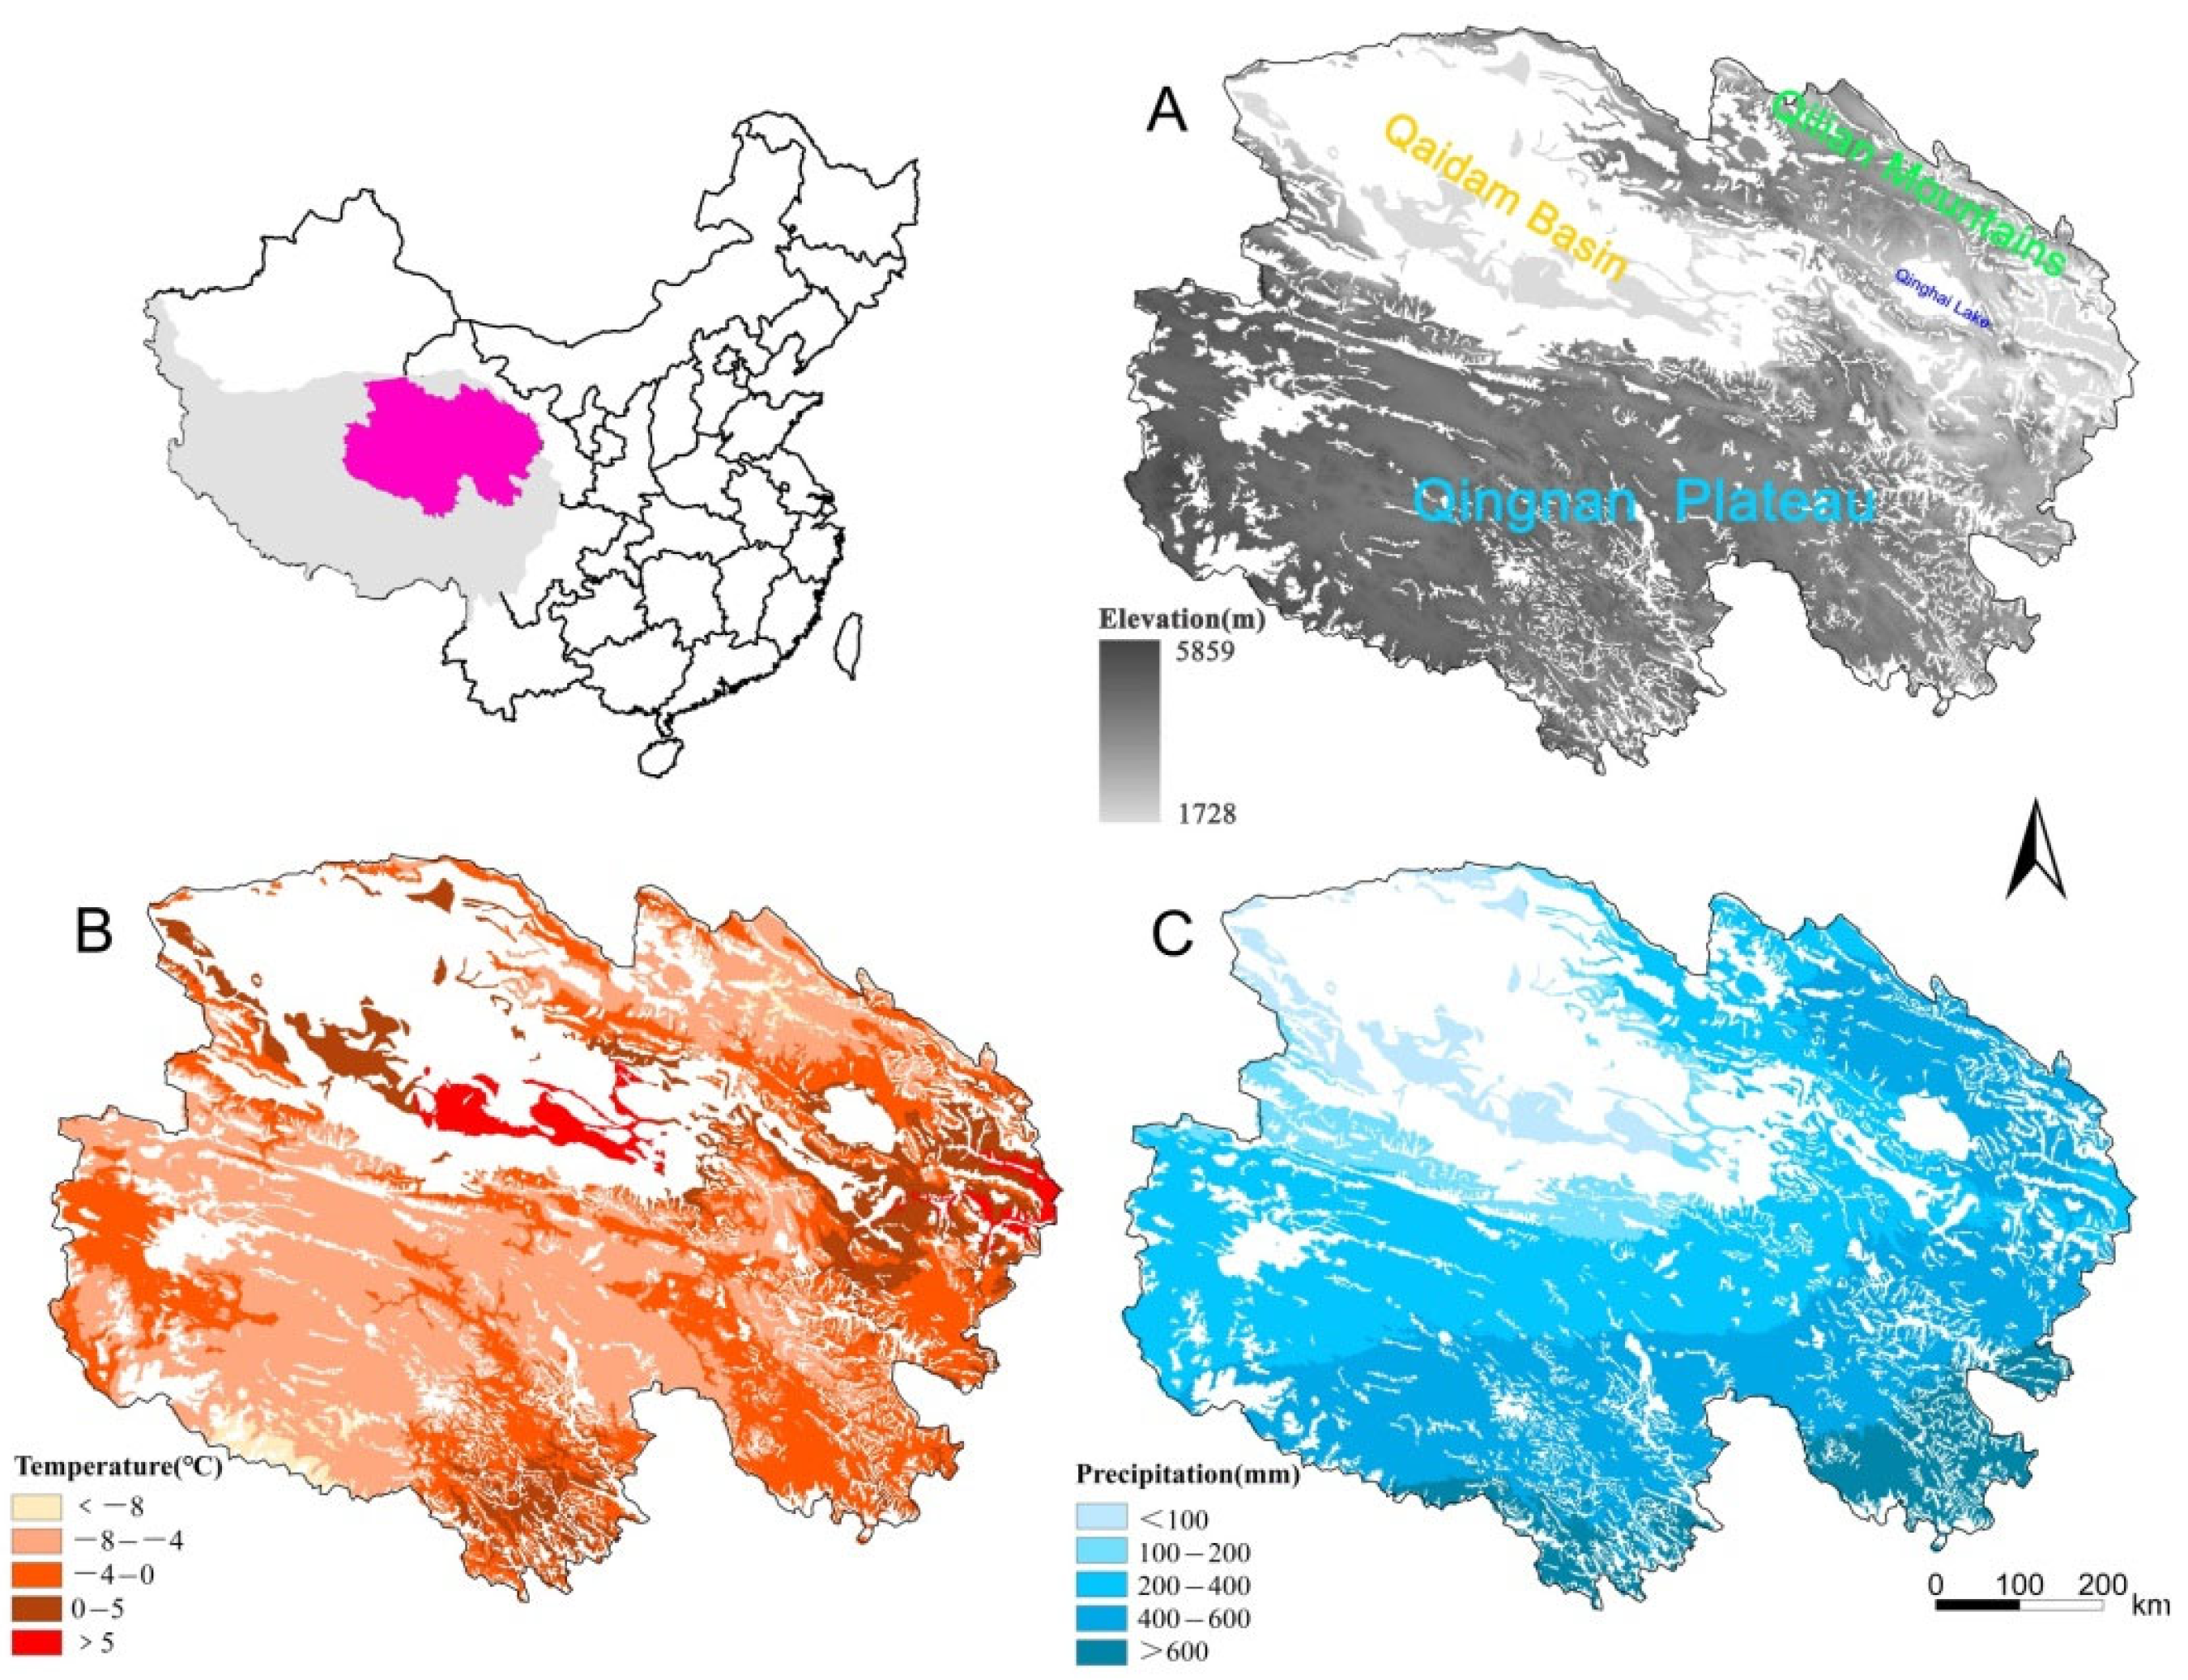
2.1. Study Area

Qinghai—located in the northwest part of China and the northeast region of the Qinghai–Tibet Plateau—is home to two cities and encompasses six states (geographical coordinates: 89°35′~103°04′ E, 31°39′~39°19′ N). The region is known for its towering mountains, complex and diverse landforms, harsh climactic conditions, and fragile ecological environment. The average altitude is more than 3000 m. Qinghai has a plateau continental climate, with short summers and a frost-free period of only 100–200 days. The annual average temperature is 6–9 °C. The average annual precipitation is 250–550 mm (concentrated from June to August). The region receives an average of 2770.43 h of sunshine annually. Most soils are coarse in texture, low in fertility, vulnerable to erosion, and still in the young stage of development due to the influence of alpine conditions. The main soil types are alpine desert soil, alpine meadow soil, alpine grassland soil, mountainous meadow soil, chestnut soil, gray cinnamon soil, swamp soil, and aeolian sand soil. The soil water regime varies due to the influence of climate conditions and topography [15,18,24]. Natural grasslands in Qinghai cover an area of 4.19 × 10⁷ hm2, accounting for 58.11% of the total area of Qinghai, and approximately 10.72% of the total grassland area of China [37]. Natural grasslands in Qinghai are mainly distributed in areas with an altitude of more than 3000 m, including the southern Qinghai Plateau, Qilian Mountains, and Qaidam basin (Figure 1). There are various types of grassland, in which alpine meadow and alpine grassland are the main body, accounting for 80.88% of the grassland area in Qinghai. Alpine meadows were dominated by Kobresia humilis, Saussurea superba, Potentilla saudersiana, Leontopodium nanum, and Lancea tibetica. The alpine steppes were primarily dominated by Stipa purpurea, Ptilagrostis dichotoma, Ajania tenuifolia, Leontopodium hastioides, Aster flaccidus, and Iris tectorum [24], and vegetation coverage varies greatly in the different subregions. In general, the vegetation coverage is higher in the east than in the west. Grassland resources in Qinghai are not only the material basis for the sustainable development of the local economy, but are also an important environmental factor for human survival. They have an irreplaceable role in maintaining the ecological balance and protecting the human living environment [21,37]. However, grassland degradation is widespread, due to unreasonable grazing management. To protect grassland ecology the local government implemented grazing prohibition in key protected areas in recent years.

2.2. Model Description

The biogeochemical model Biome-BGCMuSo was developed based on the widely used Biome-BGC model to better simulate the storage and flux of carbon between the terrestrial ecosystem and the atmosphere; modifications included a multi-layer soil module, consideration of drought-related plant senescence, and improved model phenology. A detailed description of the improvements in the Biome-BGCMuSo can be found in Hidy et al. [35].
Biome-BGCMuSo operates on a daily time step and describes the carbon dynamics in a defined grassland ecosystem. The model uses at least four input files at each execution. The first input file, i.e., the initialization file, provides general information about the simulation, including the time-frame for the simulation, the names of the output files that will be generated, and lists of variables to store in the output files. The second input file, i.e., the meteorological data file, contains daily values for air temperature, precipitation, humidity, radiation, and day length at the simulation site. The third input file, i.e., the eco-physiological constants file, describes the vegetation at the simulation site, including parameters, such as the leaf carbon: nitrogen (C:N) ratio, maximum stomatal conductance, allocation ratios, and canopy average specific leaf area. The fourth input file, i.e., the soil properties file, contains a detailed description of the soil at the simulation site, including parameters such as soil texture and soil water content.
In the Biome-BGCMuSo model, the most important blocks are the carbon flux block, the phenological block, and the soil flux block. In the carbon flux block, gross primary productivity is calculated using Farquhar’s photosynthesis routine [38]. Autotrophic respiration includes maintenance and growth respiration. Maintenance respiration is a function of the nitrogen content of living material, while growth respiration is proportional to the carbon allocated to the different plant components. Subtracting maintenance respiration and growth respiration from the gross primary productivity value provides the net primary productivity of the ecosystem. The carbon balance of the ecosystem is maintained by net primary productivity and heterotrophic respiration. Heterotrophic respiration is regulated by decomposition [39]. The phenological block is a calculation of foliage development, which affects carbon accumulation in vegetation. The soil block describes the decomposition of dead plant material and the contribution to soil carbon pools [40].
Simulation was divided into three stages. The first stage was the spin-up run, during which the model ran under the conditions of low soil carbon and nitrogen content until it reached a stable state. The second stage was transient simulation, which provided a smooth transition in environmental conditions between the spin-up and normal phases. The third stage was the normal simulation. A normal run was performed to output the carbon dynamics of the defined grassland ecosystem.
The output files for Biome-BGCMuSo were provided in the ASCII format. In order to display the results on a spatial map, we designed programs in R and Python to convert the outputs from ASCII to raster.

2.3. Model Inputs

The inputs of the Biome-BGCMuSo model included meteorological data, soil data, physiological and ecological parameters, and site information.
Meteorological data included the daily maximum temperature (°C), daily minimum temperature (°C), average temperature during the day (°C), daily total precipitation (cm), average partial pressure of water vapor during the day (Pa), average shortwave radiant flux density during the day (W·m2), and day length (s). All of these data were derived from the China Meteorological Forcing Dataset (CMFD), a gridded dataset with a spatial resolution of 10 km × 10 km, from January 1979 to December 2018. The accuracy of the data was verified by observation data (including observation data sampled in Qinghai), which showed that the accuracy was between the observation data and the remote sensing data, and in fact showed better accuracy than the existing reanalysis data for the world [41]. These data are appropriate for simulations of land surface processes in China. All CMFD data are stored in Network Common Data Form (NetCDF) files. We designed a program to convert the data from NetCDF to the model inputs (ASCII files).
The required soil input data included soil texture, soil water content, and soil pH. These data were derived from the Harmonized World Soil database version 1.1, overseen by the Food and Agriculture Organization of the United Nations in collaboration with the International Institute for Applied Systems Analysis. In this database, data from China included the 1:1 million soil data obtained through the second national land survey provided by the Institute of Soil Science, Chinese Academy of Sciences. The data are in a grid format. We designed a program to convert the data from grid to model inputs (ASCII files) and smoothed these data to 10 km × 10 km grids.
The required physiological and ecological parameters included the C:N ratio of leaves, C:Nratio of leaf litter after re-translocation, C:N ratio of fine roots, maximum stomatal conductance, allocation ratios, average specific leaf area in the canopy, maximum depth of rooting zone, root weight corresponding to max root depth, day of the year to start new growth, and day of the year to end litterfall, etc. Most of these data derived from the default parameterizations of C3 grass in the model [42]. Some of the parameters were derived from local surveys (Appendix A).
Site information included site elevation, site latitude, site shortwave albedo, mean annual air temperature, and mean annual air temperature range. Site elevation and latitude were obtained from the Geospatial data cloud (http://www.gscloud.cn/sources/ (accessed on 12 January 2021)). Site shortwave albedo data were obtained from the National Earth System Science Data Center (http://www.geodata.cn/ (accessed on 5 January 2021)), and mean annual air temperature and mean annual air temperature range were obtained from CMFD.

3. Results

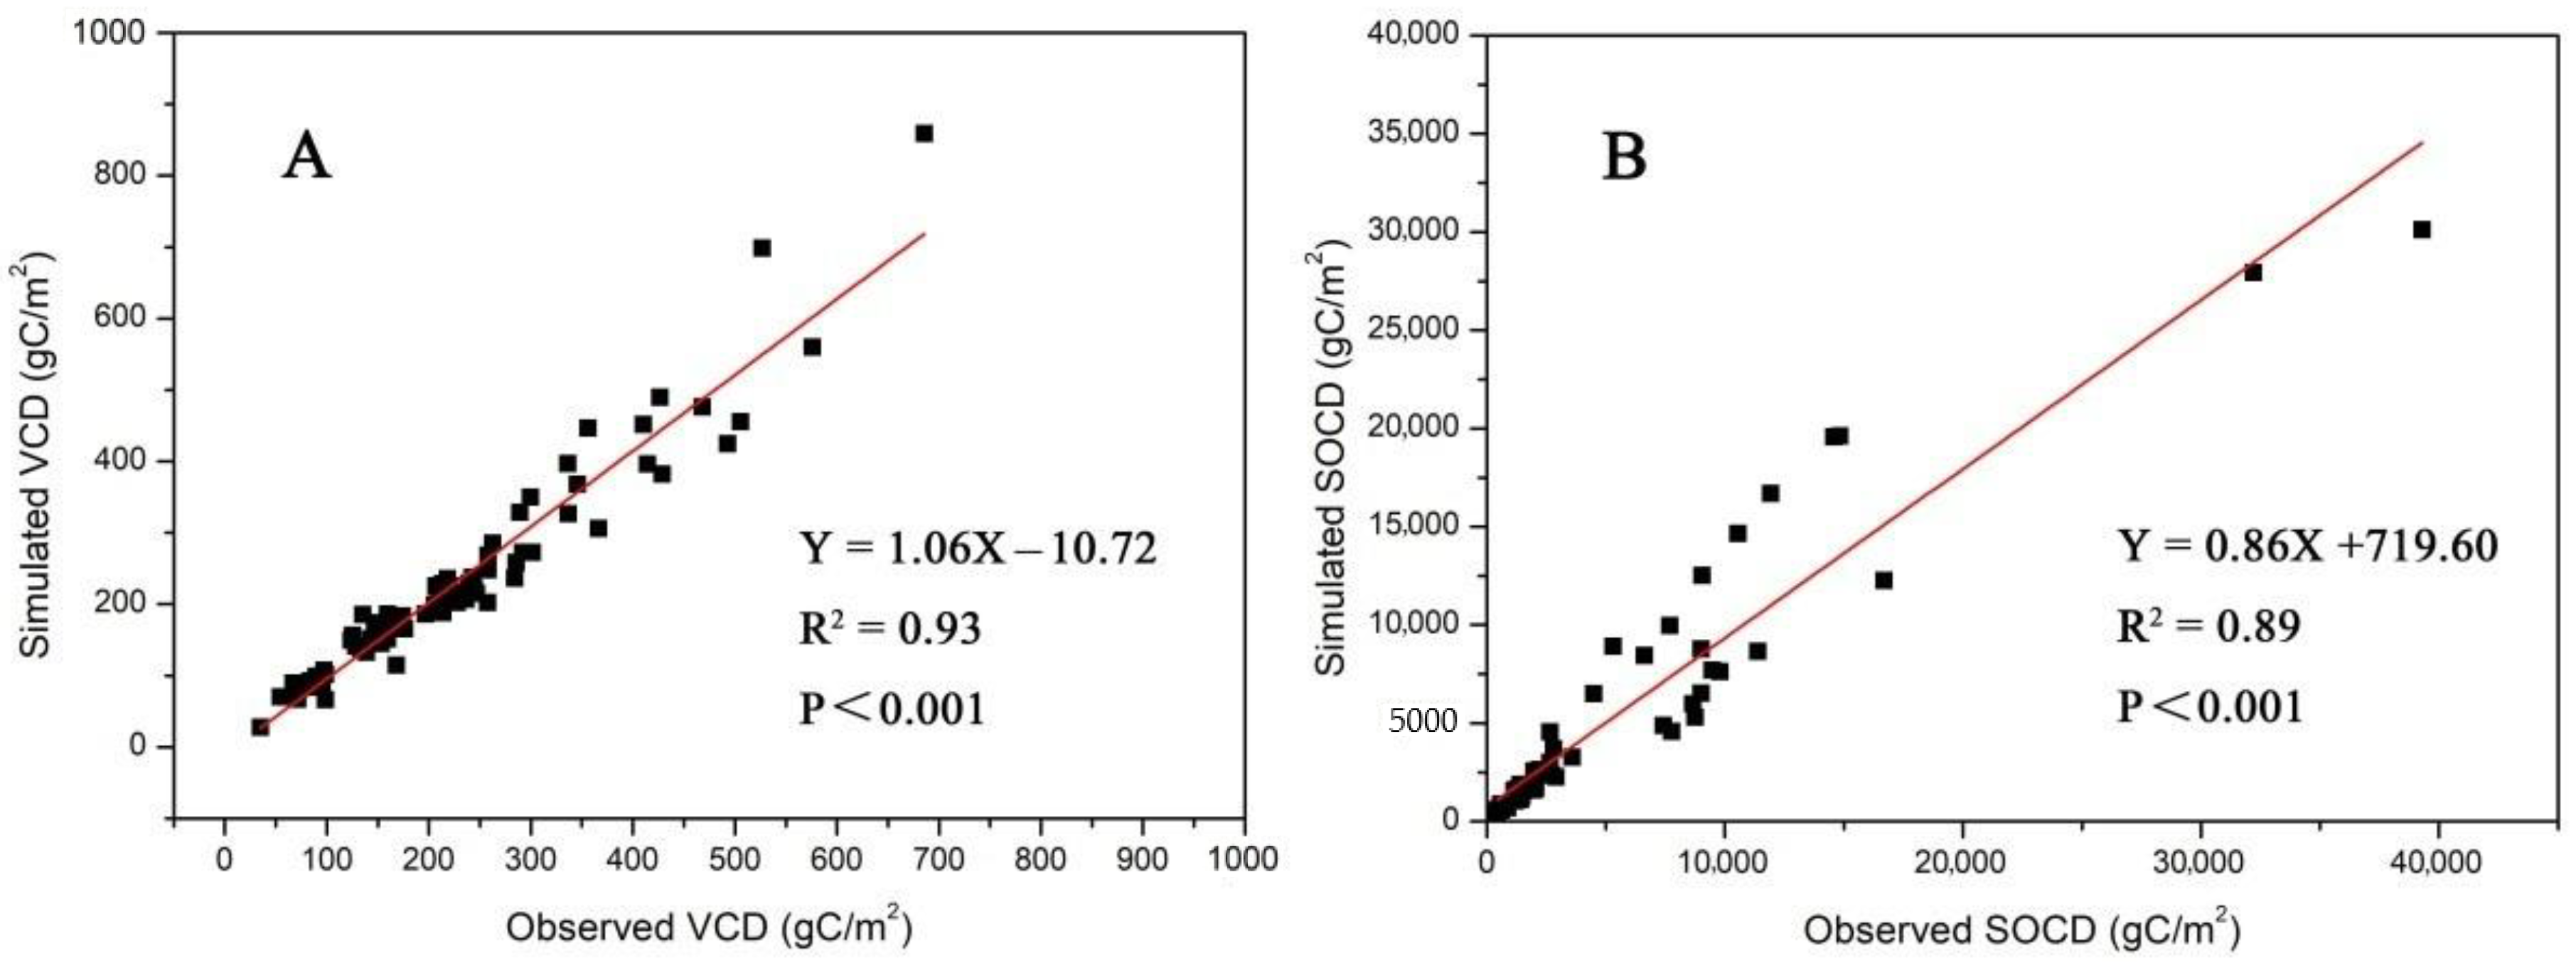
3.1. Model Validation

In order to accurately describe the dynamics of SOC and VC in Qinghai grasslands, we collected VC and SOC data corresponding to this region from field surveys and from published literatures [20,36,43] to validate the reliability of the model outputs. Observed VCD were calculated, based on vegetation biomass and vegetation carbon content. Observed SOCD were measured using a dry oxidation method with a TOC 5000A analyzer (Shimadzu corporation, Kyoto, Japan) (Appendix B). We used 41 VC and 35 SOC (including the upper 20 cm, upper 30 cm, upper 40 cm, and upper 100 cm) sampling plots in different subregions, including 10 VC plots and 26 SOC plots recently obtained through field surveys. The comparisons between the observed data and simulated data showed that Biome-BGCMuSo provided good predictions for both VC (R2 = 0.93, p < 0.001) and SOC (R2 = 0.89, p < 0.001) (Figure 2).

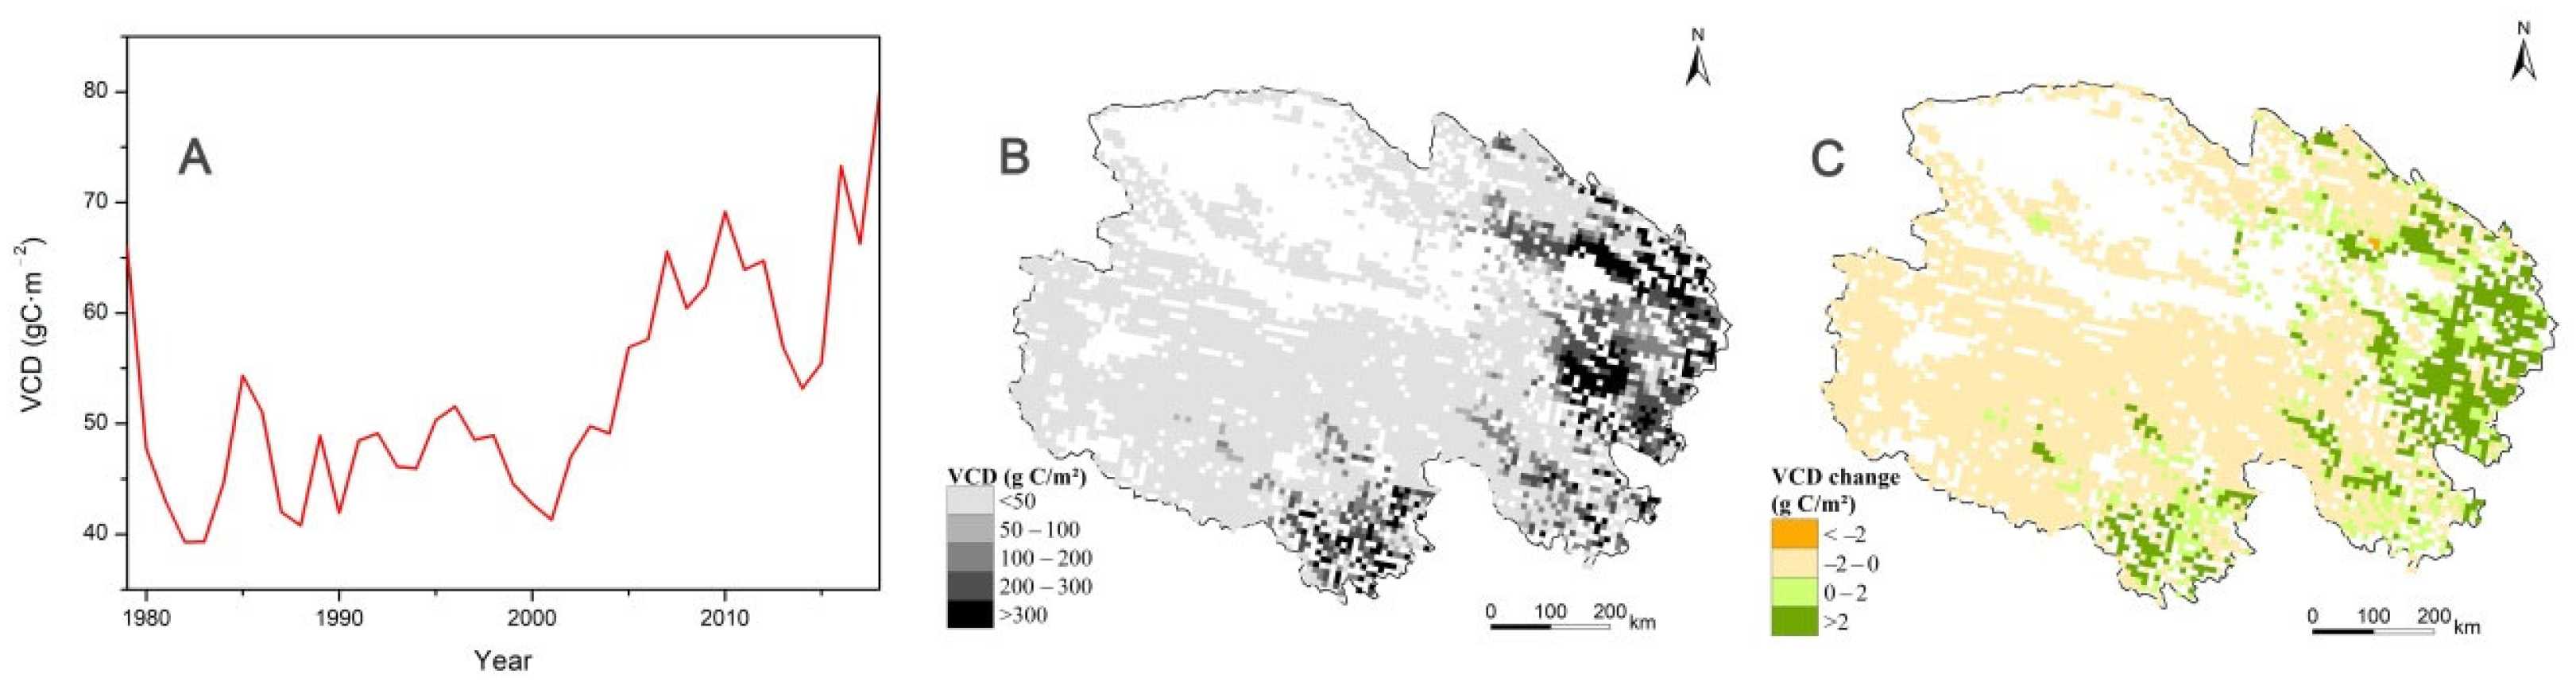
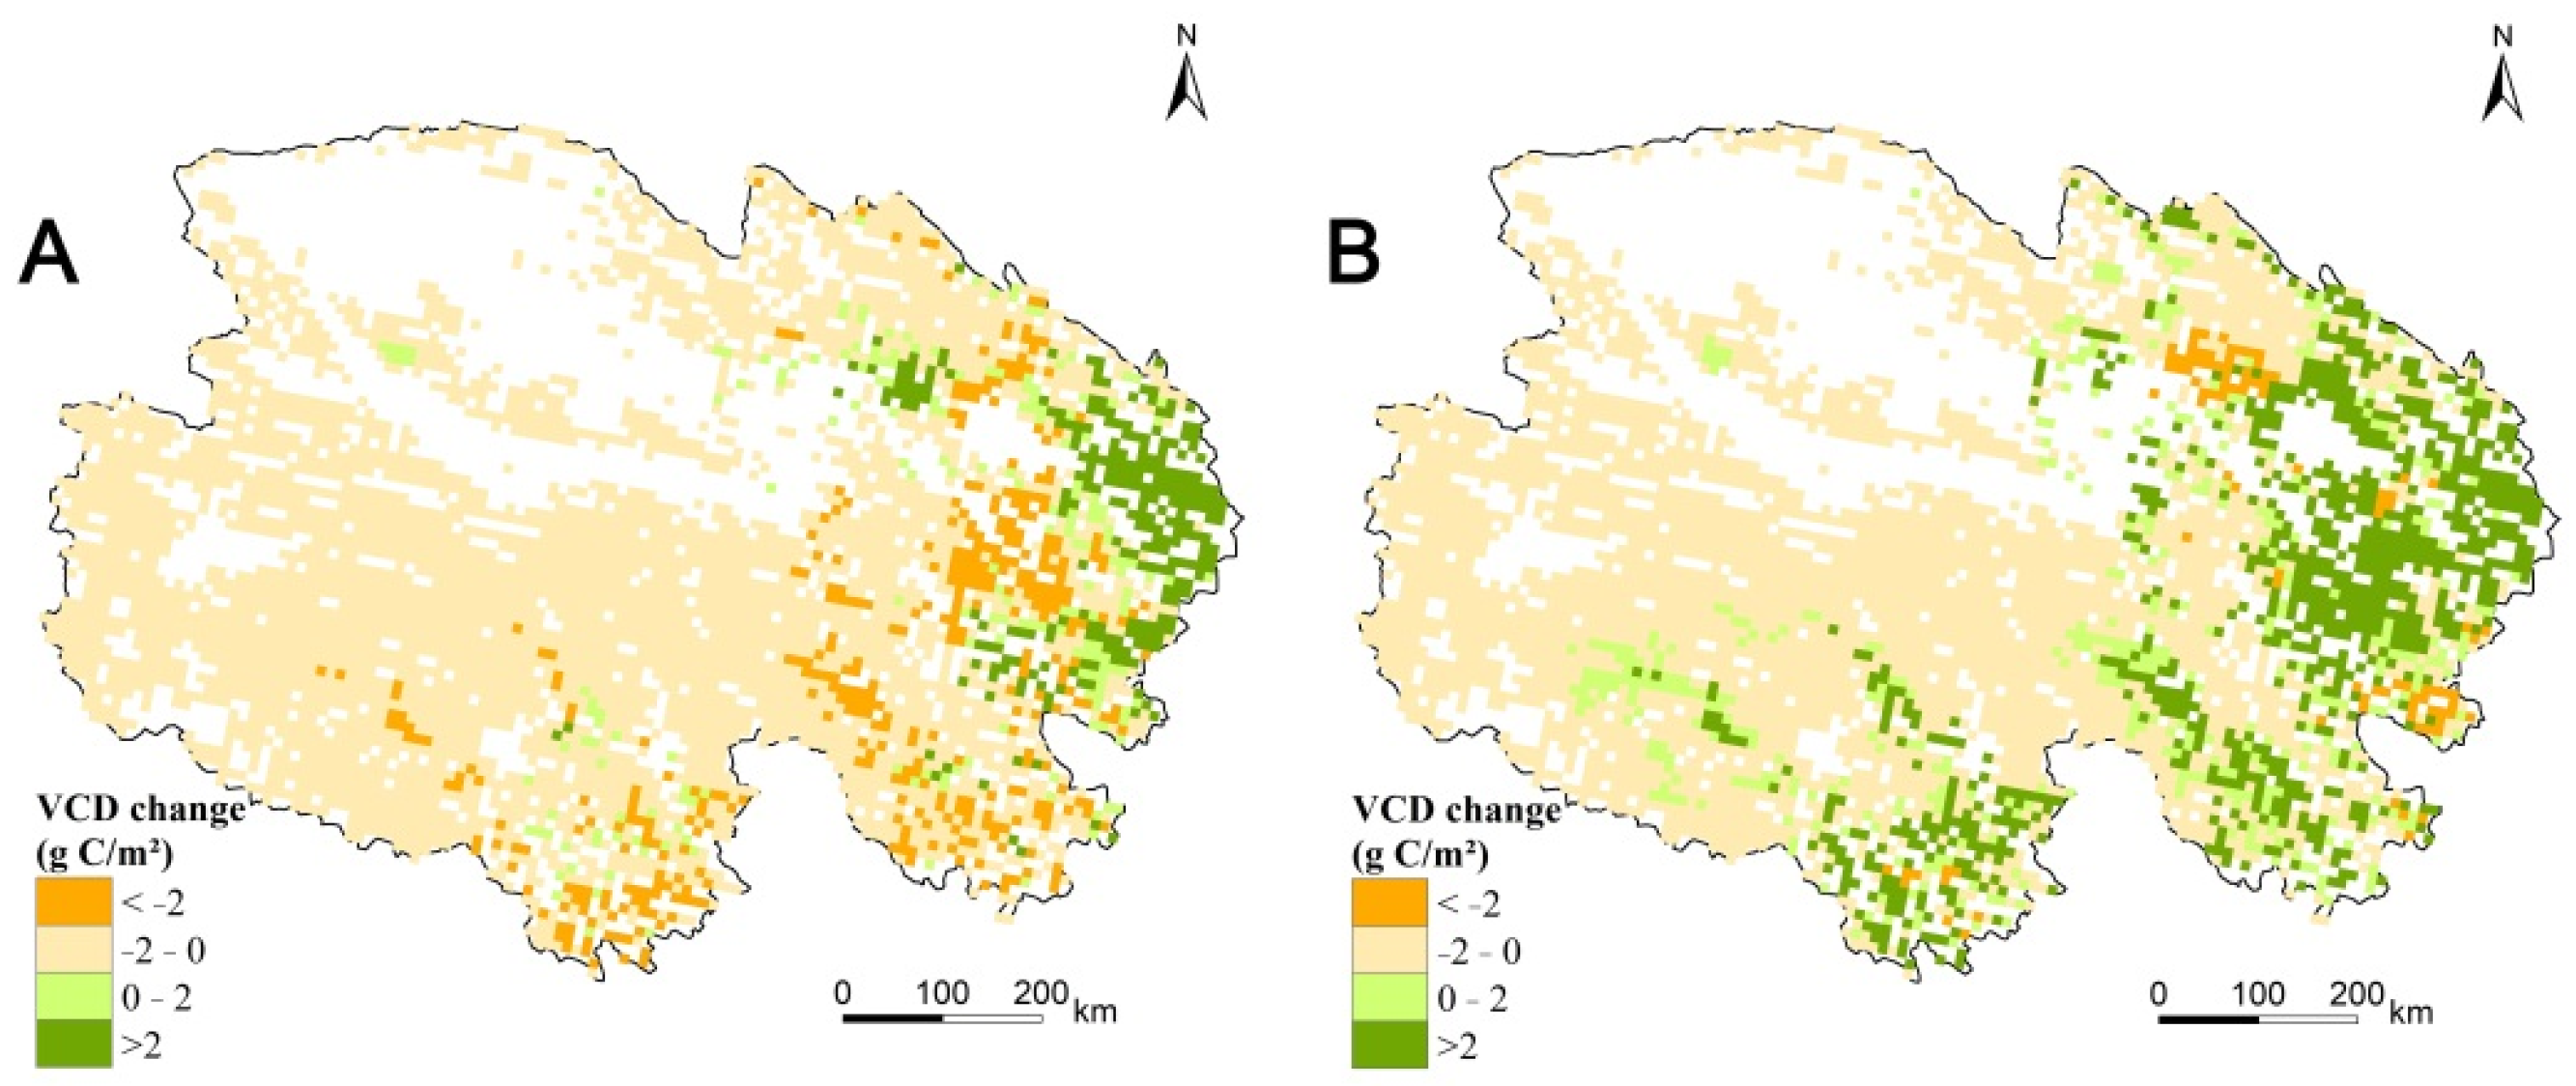
3.2. Vegetation Carbon

Annual VCD in the Qinghai grasslands fluctuated, with an average annual value of 52.71 gC·m−2. After 2000, VCD showed an overall increasing trend with an average rate of 2.14 gC·m−2 (Figure 3A). There were strong spatial heterogeneities in the average annual VCD from 1979 to 2018, and VCD was relatively high in the eastern and southeastern parts of Qinghai, compared with that in the western and central regions (Figure 3B). There were strong spatial heterogeneities in the VCD change from 1979 to 2018. Its spatial distribution was similar to the distribution of the average annual VCD. The increasing trend for VCD was mainly distributed in the eastern and southeastern parts of Qinghai, and VCD generally showed a decreasing trend in western and central Qinghai (Figure 3C). VCD decreased over 75.63% of the grassland area, while it increased in 24.37% of the grassland area.
As shown in Figure 4, from 1979 to 2000, VCD notably decreased in parts of southern and eastern Qinghai, while VCD notably increased in parts of eastern Qinghai. From 2001 to 2018, VCD notably increased in southern and eastern Qinghai.

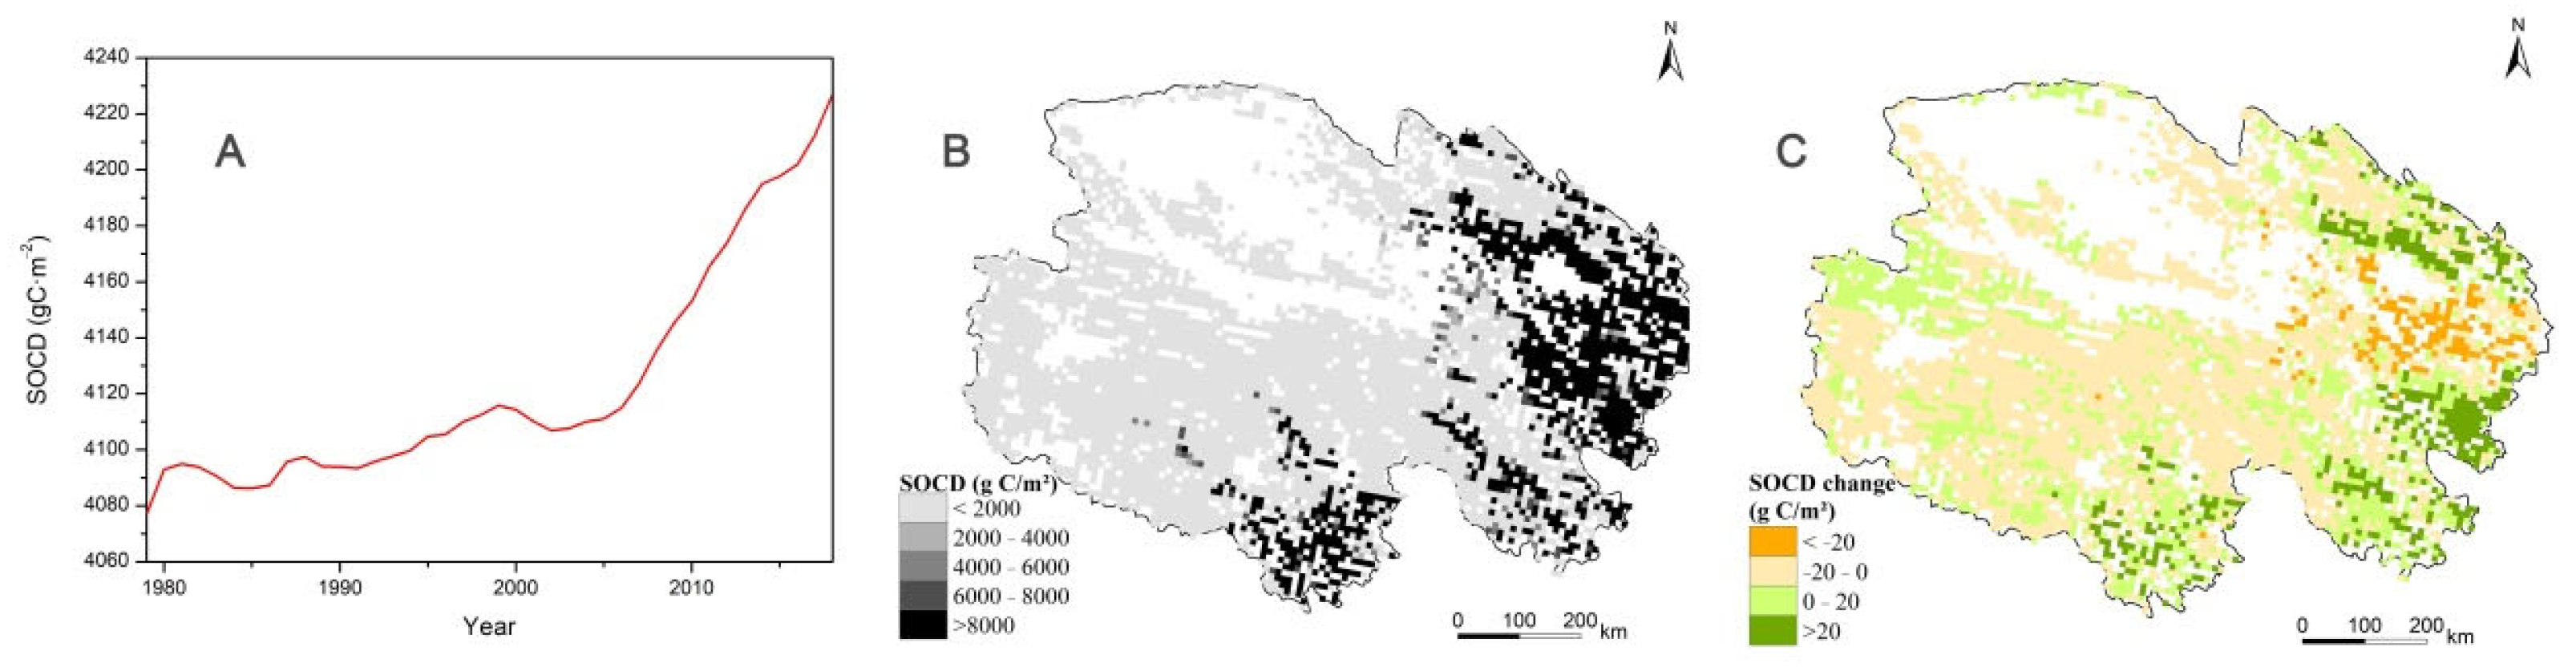
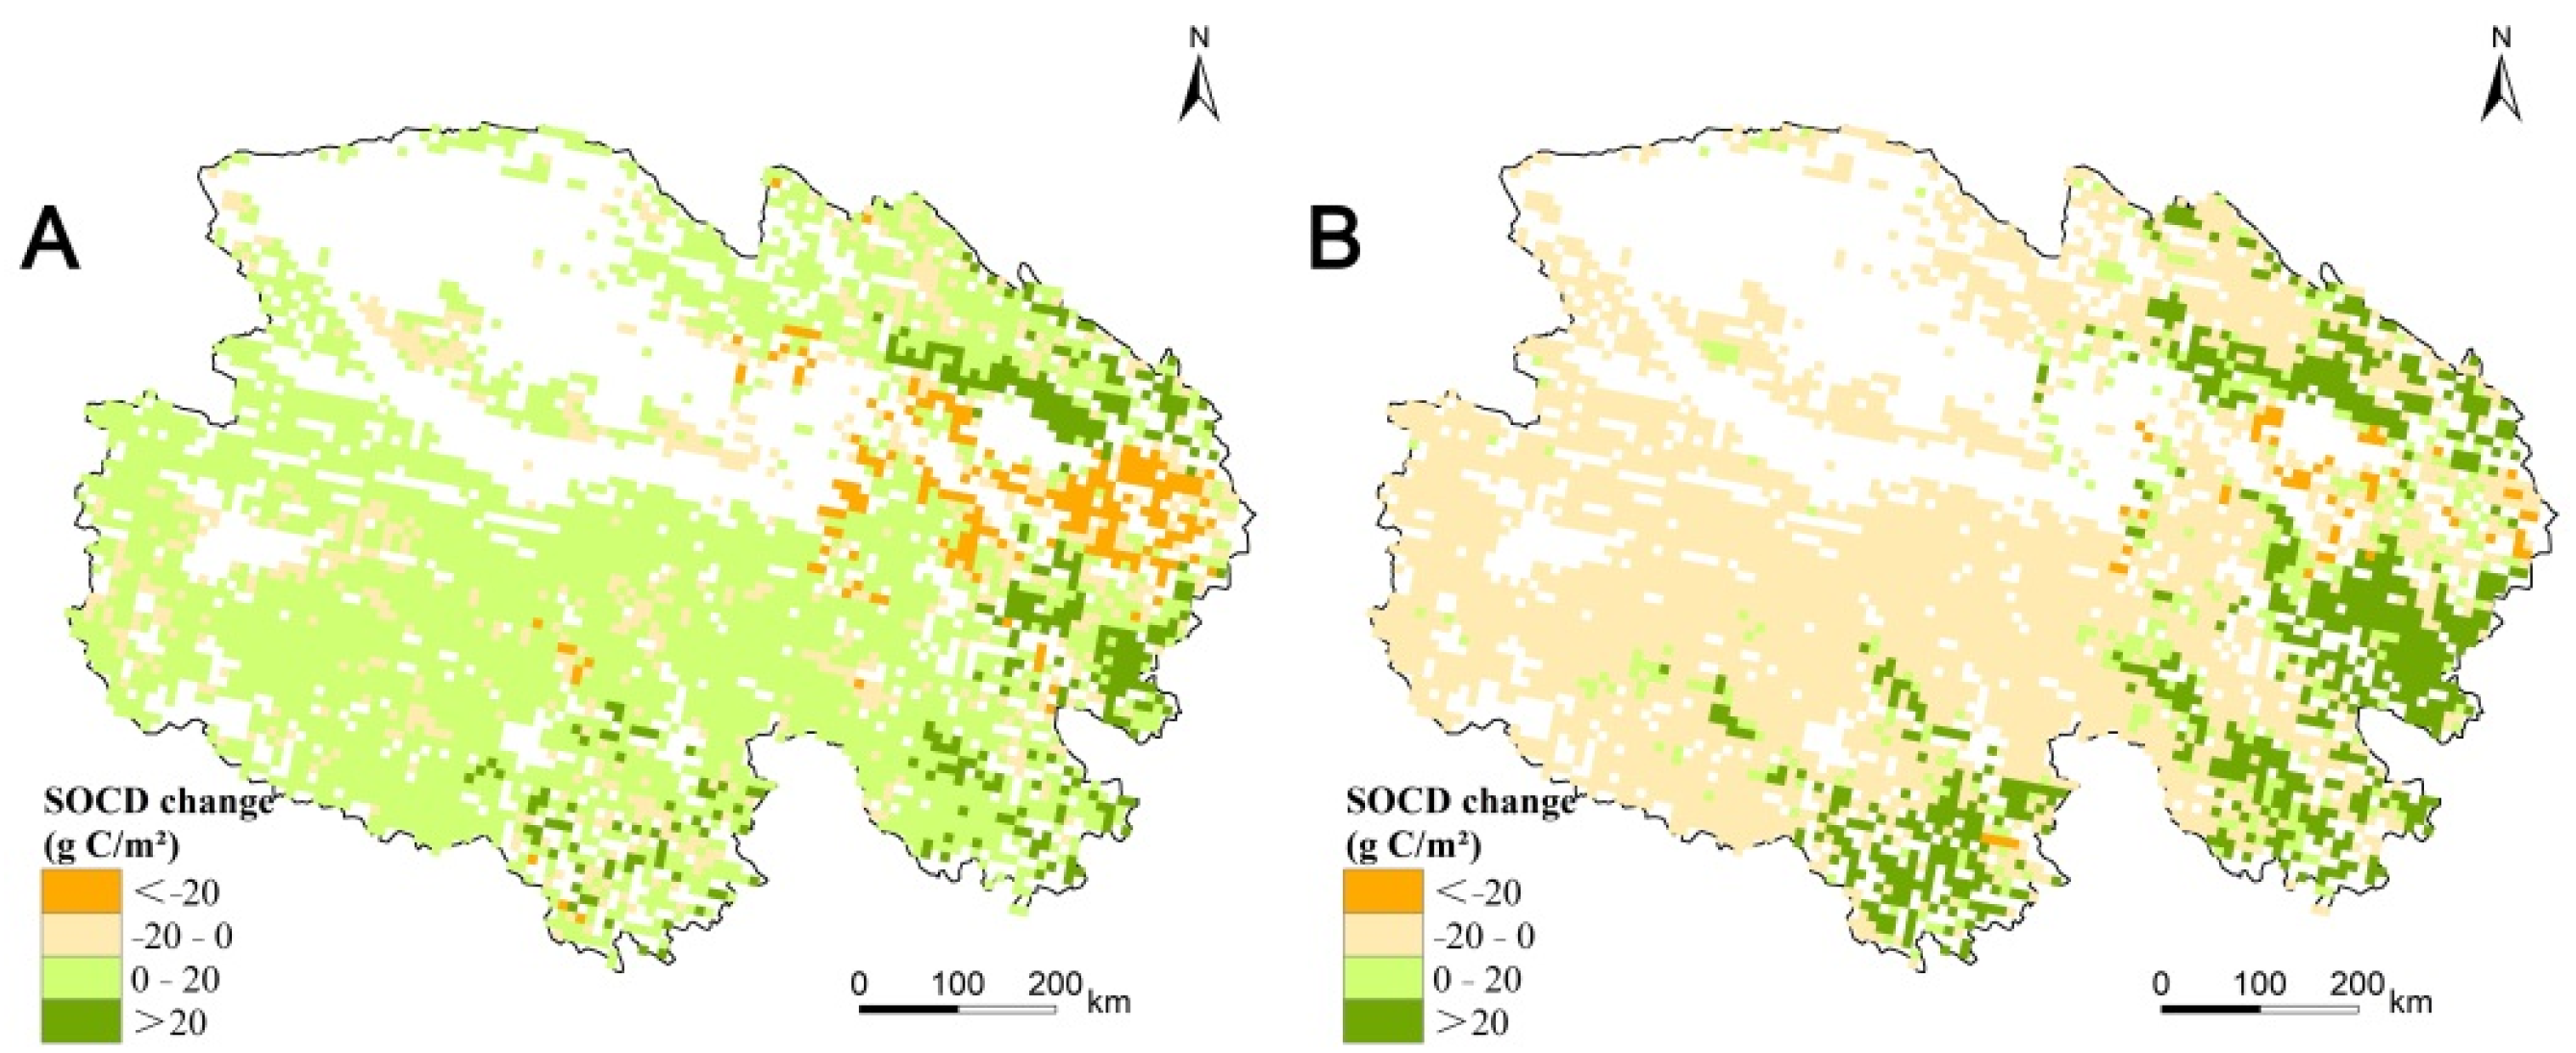
3.3. Soil Organic Carbon

Annual SOCD in Qinghai grasslands generally increased from 1979 to 2018. After 2001, SOCD notably increased, with an average rate of 7.07 gC·m−2. Average annual SOCD was 4122.92 gC·m−2 for the upper 100 cm, which was 78.22 times higher than VCD (Figure 5A). There were strong spatial heterogeneities in the average annual SOCD in the Qinghai grasslands from 1979 to 2018. SOCD was relatively high in eastern and southeastern Qinghai, compared with western and central Qinghai (Figure 5B). There were strong spatial heterogeneities in the SOCD change from 1979 to 2018. The pronounced increasing trend of SOCD was mainly distributed in the southeastern and northeastern parts of Qinghai, while the decreasing trend was mainly distributed in the area between southeastern and northeastern Qinghai, and in central and western Qinghai (Figure 5C). The SOCD decreased over 73.91% of the grassland area, while it increased in 36.09% of the grassland area.
As shown in Figure 6, from 1979 to 2000, SOCD notably increased in parts of southern and eastern Qinghai, while SOCD notably decreased in the area between southeastern and northeastern Qinghai. SOCD showed a slight increased trend in central and western Qinghai. From 2001 to 2018, VCD notably increased in the southern and eastern Qinghai.

4. Discussion

4.1. Uncertainties in Results

The Biome-BGCMuSo model exhibits a good performance with respect to simulating VC and SOC in the Qinghai grasslands. However, uncertainties remain inevitable, similar to those in many other studies based on models [34,44].
First, the model structure itself introduces uncertainty. The Biome-BGCMuSo model could not fully account for the complexities of the carbon cycle, because the model itself is a simplified representation of the real world. For example, the freezing–thawing cycle in the Qinghai grasslands substantially influences plant growth. However, the Biome-BGCMuSo model could not fully account for this process because few studies have examined the strategies to effectively quantify this process, resulting in an uncertainty in the results [34,35].
Secondly, the input data used in the model introduced uncertainty. To achieve high accuracy in the model outputs, it is necessary to use highly accurate data for the model inputs. The meteorological data from CMFD were the most important inputs that influenced the accuracy of the model outputs [35]. These data were validated with observational data from different stations (including observational data in Qinghai), which showed that they had higher accuracy than other data that were available for analysis [41]. However, the accuracy of these data was still lower than that of the observed data, i.e., uncertainty was produced in the results.

4.2. Spatiotemporal Dynamics of Vegetation Carbon and Soil Organic Carbon

In general, VC and SOC increased in the Qinghai grasslands in recent years (especially after 2000), indicating that the carbon sequestration in this region was increasing due to climate change. However, the area where the VCD and SOCD increased was smaller than the area where the VCD and SOCD decreased in the Qinghai grasslands. The spatial distribution of VCD was closely related to hydrothermal conditions, which mainly included temperature and precipitation. There were relatively good hydrothermal conditions (conducive to vegetation growth) in east and southeast Qinghai; thus, VCD was high in these regions. In contrast, there were relatively bad hydrothermal conditions (inconducive to vegetation growth) in western and central Qinghai, resulting in low VCD. In general, climate change increased VCD in areas with high average annual VCD, indicating that hydrothermal conditions were getting better in these regions, while it decreased VCD in areas with low average annual VCD, indicating that the hydrothermal conditions were getting worse in the corresponding regions. This effect may be associated with the difference in temperature increase in recent years. A moderate increase in temperature may increase VCD, while a high increase in temperature leads to greater water evaporation than precipitation, offsetting the effects of precipitation [33,45]. Finally, the temperature limited the increase in VCD. The Qaidam Basin (located in northwest Qinghai) received only rare precipitation during the study period. Warming exacerbated the drought, which led to a decrease in VCD. From 1979 to 2000, VCD notably decreased in parts of southern and eastern Qinghai. However, from 2001 to 2018, VCD notably increased in these regions. From 1979 to 2000, the decrease in precipitation and increase in temperature mainly occurred in these regions, which may result in a VCD decrease in the corresponding regions. However, from 2001 to 2018, the increase in precipitation and temperature mainly occurred in these regions, which may result in a VCD increase in the corresponding regions (Appendix C). Spatial distribution of SOCD was generally similar to the distribution of VCD, indicating that its spatial distribution was also closely related to hydrothermal conditions. High SOCD was associated with good hydrothermal conditions, while low SOCD was associated with bad hydrothermal conditions. SOCD generally increased in the southeastern and northeastern parts of Qinghai, where the hydrothermal conditions were good, and generally decreased in western and central Qinghai, where hydrothermal conditions were bad. It notably decreased in the area between southeastern and northeastern Qinghai, while VCD generally increased in this region. This phenomenon may be related to the rapid decomposition of SOC caused by the relatively high temperature in this area [8,44]. The obvious increase in SOCD occurred in more regions from 2001 to 2018 than from 1979 to 2000, which may be associated with the VCD change [8,44,46].

4.3. Comparison of Results with Those from Other Studies

Many recent studies have examined carbon storage, and some relevant research was conducted in the Qinghai grasslands. However, the studies vary a great deal in the site scale or subregion of study [11,12]. For instance, Li et al. [43] investigated carbon sequestration in artificial grasslands during restoration and native grasslands with different levels of degradation using field data from Dawu village, Maqin County, Qinghai Province, China. Li et al. [23] examined the effects of land use on organic carbon sequestration in the topsoil around Qinghai Lake basin in Qinghai Province, using field data. Dai et al. [46] reported that long-term grazing exclusion greatly improved the carbon storage in an alpine meadow in the northern Qinghai–Tibet Plateau, using field data from the Haibei National Field Research Station, Qinghai, China. Wang et al. [25] estimated and analyzed the spatial distribution of SOC in a complex terrain in Wenquan District, Qinghai Province, based on geographically weighted regression. Individually, such studies cannot effectively reflect the overall carbon storage of Qinghai grasslands due to the large surface heterogeneity in this region.
Zhang et al. [21] modeled the impacts of climate change and grazing on plant biomass and SOC in the Qinghai grasslands using the DeNitrification–DeComposition model. They found that climate change might be the major factor that led to fluctuations in the grassland biomass and SOC. However, in their study, grassland biomass and SOC generally decreased under conditions of climate change, which was inconsistent with the results of the present study. In addition, they reported only overall estimates by county, rather than using detailed spatial distributions. Most recent studies indicated that climate change was generally conducive to the growth of vegetation in Qinghai in recent years [47,48], a conclusion that our results also support. Some studies showed that the ecological environment was improved in recent years in Qinghai, especially in the southwestern area of Qinghai. However, in the present study, carbon storage was generally decreased in the southwestern part of Qinghai under the climate scenario. In recent years, the local government has strengthened ecological protection through measures such as grazing prohibition, especially in southwestern Qinghai, which accounts for the difference in our results compared with those of previous studies. Our work has deepened our understanding of the temporal and spatial dynamics of carbon storage in the Qinghai grasslands and provided reliable and detailed data to support local grassland management. Nevertheless, we hope to produce data with higher precision and resolution to support local development in the future.

5. Conclusions

We estimated and analyzed the spatiotemporal dynamics of carbon storage in the Qinghai grasslands from 1979 to 2018, using the spatially explicit Biome-BGCMuSo model. The VCD and SOCD in the Qinghai grasslands generally increased. After 2000, VCD notably increased, with an average rate of 2.14 gC·m−2. After 2001, SOCD notably increased, with an average rate of 7.07 gC·m−2. High VCD and SOCD values generally occurred in the subregions where hydrothermal conditions were relatively good. Climate change resulted in increased VCD in the subregions with high average annual VCD, indicating that the hydrothermal conditions were getting better in these subregions. Meanwhile, climate change decreased VCD in the areas with low average annual VCD, indicating that the hydrothermal conditions were getting worse in the corresponding subregions. The SOCD generally increased in the southeastern and northeastern parts of Qinghai and generally decreased in western and central Qinghai. This study deepened our understanding of the mechanisms driving variation in carbon storage in the alpine grasslands and provided data to aid local grassland management.

Author Contributions

Conceptualization, X.H.; methodology, X.H. and C.C.; software, X.H. and C.C.; validation, X.H. and X.L.; formal analysis, X.H.; investigation, X.H.; resources, X.H.; data curation, X.H. and C.C.; writing—original draft, X.H.; writing—review and editing, X.H. and X.L.; visualization, X.H. and C.C.; supervision, X.H.; project administration, X.H. and C.C.; funding acquisition, X.H. and B.Y. All authors have read and agreed to the published version of the manuscript.

Funding

This research was funded by the Chinese Academy of Science (CAS) “Light of West China” Program (2018), “The effect of grazing on grassland productivity in the basin of Qinghai Lake”, National Natural Science Foundation of China (U21A20185), the State Key Laboratory of Desert and Oasis Ecology (G2022-02-02) and State Key Laboratory of Plateau Ecology and Agriculture (2021-KF-08).

Institutional Review Board Statement

Not applicable.

Informed Consent Statement

Not applicable.

Data Availability Statement

Not applicable.

Acknowledgments

We would like to thank Hongfei Zhao for technical assistance.

Conflicts of Interest

The authors declare no conflict of interest.

Appendix A

Table A1. The required physiological and ecological parameters.
Parameters<2500 m2500–3500 m3500–4500 m>4500 m
Yearday to start new growth85 *110 *132 *154 *
Yearday to end litterfall317 *290 *271 *252 *
Transfer growth period as fraction of growing season1111
Litterfall as fraction of growing season1111
Base temperature0000
Annual leaf and fine root turnover fraction1111
Whole-plant mortality fraction in vegetation period0.10.10.10.1
C:N of leaves12.47 *12.47 *12.47 *12.47 *
C:N of leaf litter, after re-translocation45.0 *45.0 *45.0 *45.0 *
C:N of fine roots37.29 *37.29 *37.29 *37.29 *
Dry matter carbon content of leaves0.40.40.40.4
Dry matter carbon content of leaf litter0.40.40.40.4
Dry matter carbon content of fine roots0.40.40.40.4
Dry matter carbon content of soft stem0.40.40.40.4
All-sided to projected leaf area ratio2.02.02.02.0
Ratio of shaded SLA: sunlit SLA2.02.02.02.0
Maximum stomatal conductance (projected area basis)0.2 m/s0.2 m/s0.2 m/s0.2 m/s
Boundary layer conductance (projected area basis)0.039 m/s0.039 m/s0.039 m/s0.039 m/s
Maximum depth of rooting zone1 m1 m1 m1 m
Root weight corresponding to max root depth0.4 kgC0.4 kgC0.4 kgC0.4 kgC
Root weight to root length conversion factor1000 m/kg1000 m/kg1000 m/kg1000 m/kg
Leaf allocation0.30.30.30.3
Fine root allocation0.520.520.520.52
Soft stem allocation0.180.180.180.18
Canopy average specific leaf area (projected area basis)24 m2/kgC *24 m2/kgC *24 m2/kgC *24 m2/kgC *
* The parameters derived from local surveys.

Appendix B

Table A2. The sources of the observed VC and SOC.
Observed DataSelecting LocationsSampling DatesMethodsSample Sizes
VCMaqin County,2008–2015,
2018–2021
Literature search,
field sampling and laboratory analysis
100 cm × 100 cm,
50 cm × 50 cm
Gonghe County,
Menyuan County,
Maduo County,
Guinan County,
Chengduo County
SOCMaqin County,2010, 2012,
2018–2021
Literature search,
field sampling and laboratory analysis
100 cm × 100 cm,
50 cm × 50 cm
Gonghe County,
Menyuan County,
Maduo County,
Guinan County,
Yushu County,
Chengduo County,
Zhiduo County,
Dari County,
Gande County,
Qumalai County,
Qilian County,
Tongde County,
Zeku County,
Gangcha County

Appendix C

Figure A1. Annual temperature change in the Qinghai grasslands from 1979 to 2000 (A) and from 2001 to 2018 (B).
Agronomy 12 01201 g0a1
Figure A2. Annual precipitation change in the Qinghai grasslands from 1979 to 2000 (A) and from 2001 to 2018 (B).
Agronomy 12 01201 g0a2

References

  1. Schuman, G.E.; Janzen, H.H.; Herrick, J.E. Soil carbon dynamics and potential carbon sequestration by rangelands. Environ. Pollut. 2002, 116, 391–396. [Google Scholar] [CrossRef]
  2. Li, C.; Fultz, L.M.; Moore-Kucera, J.; Acosta-Martinez, V.; Horita, J.; Strauss, R.; Zak, J.; Calderon, F.; Weindorf, D. Soil carbon sequestration potential in semi-arid grasslands in the Conservation Reserve Program. Geoderma 2017, 294, 80–90. [Google Scholar] [CrossRef] [Green Version]
  3. Wiesmeier, M.; Huebner, R.; Spoerlein, P.; Geuss, U.; Hangen, E.; Reischl, A.; Schilling, B.; von Luetzow, M.; Koegel-Knabner, I. Carbon sequestration potential of soils in southeast Germany derived from stable soil organic carbon saturation. Glob. Chang. Biol. 2014, 20, 653–665. [Google Scholar] [CrossRef] [PubMed]
  4. Chen, S.; Arrouays, D.; Angers, D.A.; Martin, M.P.; Walter, C. Soil carbon stocks under different land uses and the applicability of the soil carbon saturation concept. Soil Tillage Res. 2019, 188, 53–58. [Google Scholar] [CrossRef]
  5. Webb, J.R.; Santos, I.R.; Maher, D.T.; Finlay, K. The Importance of Aquatic Carbon Fluxes in Net Ecosystem Carbon Budgets: A Catchment-Scale Review. Ecosystems 2019, 22, 508–527. [Google Scholar] [CrossRef]
  6. Kristensen, J.A.; Svenning, J.-C.; Georgiou, K.; Malhi, Y. Can large herbivores enhance ecosystem carbon persistence? Trends Ecol. Evol. 2021, 37, 117–128. [Google Scholar] [CrossRef]
  7. Volkova, L.; Roxburgh, S.H.; Weston, C.J. Effects of prescribed fire frequency on wildfire emissions and carbon sequestration in a fire adapted ecosystem using a comprehensive carbon model. J. Environ. Manag. 2021, 290, 112673. [Google Scholar] [CrossRef]
  8. Chang, J.; Ciais, P.; Gasser, T.; Smith, P.; Herrero, M.; Havlik, P.; Obersteiner, M.; Guenet, B.; Goll, D.S.; Li, W.; et al. Climate warming from managed grasslands cancels the cooling effect of carbon sinks in sparsely grazed and natural grasslands. Nat. Commun. 2021, 12, 118. [Google Scholar] [CrossRef]
  9. Legesse, T.G.; Dong, G.; Jiang, S.; Chen, J.; Dong, X.; Daba, N.A.; Sorecha, E.M.; Qu, L.; Tian, L.; Shao, C. Small precipitation events enhance the Eurasian grassland carbon sink. Ecol. Indic. 2021, 131, 108242. [Google Scholar] [CrossRef]
  10. Lin, B.; Ge, J. Does institutional freedom matter for global forest carbon sinks in the face of economic development disparity? China Econ. Rev. 2021, 65, 101563. [Google Scholar] [CrossRef]
  11. Wang, J.; Li, Y.; Bork, E.W.; Richter, G.M.; Chen, C.; Shah, S.H.H.; Mezbahuddin, S. Effects of grazing management on spatio-temporal heterogeneity of soil carbon and greenhouse gas emissions of grasslands and rangelands: Monitoring, assessment and scaling-up. J. Clean. Prod. 2021, 288, 125737. [Google Scholar] [CrossRef]
  12. Madigan, A.P.; Zimmermann, J.; Krol, D.J.; Williams, M.; Jones, M.B. Full Inversion Tillage (FIT) during pasture renewal as a potential management strategy for enhanced carbon sequestration and storage in Irish grassland soils. Sci. Total Environ. 2022, 805, 150342. [Google Scholar] [CrossRef] [PubMed]
  13. Li, S.; Liu, M.; Adam, J.C.; Pi, H.; Su, F.; Li, D.; Liu, Z.; Yao, Z. Contribution of Snow-Melt Water to the Streamflow over the Three-River Headwater Region, China. Remote Sens. 2021, 13, 1585. [Google Scholar] [CrossRef]
  14. Li, Z.; Li, Z.; Feng, Q.; Wang, X.; Mu, Y.; Xin, H.; Song, L.-L.; Gui, J.; Zhang, B.; Gao, W.; et al. Hydrological effects of multiphase water transformation in Three-River Headwaters Region, China. J. Hydrol. 2021, 601, 126662. [Google Scholar] [CrossRef]
  15. Zhou, W.; Yang, H.; Xie, L.; Li, H.; Huang, L.; Zhao, Y.; Yue, T. Hyperspectral inversion of soil heavy metals in Three-River Source Region based on random forest model. Catena 2021, 202, 105222. [Google Scholar] [CrossRef]
  16. Li, S.; Dong, S.; Shen, H.; Han, Y.; Zhang, J.; Xu, Y.; Gao, X.; Yang, M.; Li, Y.; Zhao, Z.; et al. Different responses of multifaceted plant diversities of alpine meadow and alpine steppe to nitrogen addition gradients on Qinghai-Tibetan Plateau. Sci. Total Environ. 2019, 688, 1405–1412. [Google Scholar] [CrossRef]
  17. Dong, S.; Li, Y.; Ganjurjav, H.; Gao, Q.; Gao, X.; Zhang, J.; Yan, Y.; Zhang, Y.; Liu, S.; Hu, G.; et al. Grazing promoted soil microbial functional genes for regulating C and N cycling in alpine meadow of the Qinghai-Tibetan Plateau. Agric. Ecosyst. Environ. 2020, 303, 107111. [Google Scholar] [CrossRef]
  18. Zhou, B.-R.; Wu, L.; Song, M.-H.; Zhou, H.-K.; Li, Y.-K.; Wang, M.; Zhang, T.-J.; Yan, Y.-Q.; Ji, H.-J. Distinct climate driven spatial patterns of frozen soil and vegetation that reflect plant sensitivities across the Tibetan Plateau. Land Degrad. Dev. 2021, 32, 4227–4240. [Google Scholar] [CrossRef]
  19. Dong, S.; Zhang, J.; Li, Y.; Liu, S.; Dong, Q.; Zhou, H.; Yeomans, J.; Li, Y.; Li, S.; Gao, X. Effect of grassland degradation on aggregate-associated soil organic carbon of alpine grassland ecosystems in the Qinghai-Tibetan Plateau. Eur. J. Soil Sci. 2020, 71, 69–79. [Google Scholar] [CrossRef]
  20. Li, Y.; Dong, S.; Wen, L.; Wang, X.; Wu, Y. The effects of fencing on carbon stocks in the degraded alpine grasslands of the Qinghai-Tibetan Plateau. J. Environ. Manag. 2013, 128, 393–399. [Google Scholar] [CrossRef]
  21. Zhang, W.; Zhang, F.; Qi, J.; Hou, F. Modeling impacts of climate change and grazing effects on plant biomass and soil organic carbon in the Qinghai-Tibetan grasslands. Biogeosciences 2017, 14, 5455–5470. [Google Scholar] [CrossRef] [Green Version]
  22. Tian, H.; Xu, R.; Canadell, J.G.; Thompson, R.L.; Winiwarter, W.; Suntharalingam, P.; Davidson, E.A.; Ciais, P.; Jackson, R.B.; Janssens-Maenhout, G.; et al. A comprehensive quantification of global nitrous oxide sources and sinks. Nature 2020, 586, 248–256. [Google Scholar] [CrossRef] [PubMed]
  23. Li, C.; Li, Q.; Zhao, L.; Ge, S.; Chen, D.; Dong, Q.; Zhao, X. Land-use effects on organic and inorganic carbon patterns in the topsoil around Qinghai Lake basin, Qinghai-Tibetan Plateau. Catena 2016, 147, 345–355. [Google Scholar] [CrossRef]
  24. Du, Y.; Zhou, G.; Guo, X.; Cao, G. Spatial distribution of grassland soil organic carbon and potential carbon storage on the Qinghai Plateau. Grassl. Sci. 2019, 65, 141–146. [Google Scholar] [CrossRef]
  25. Wang, D.; Li, X.; Zou, D.; Wu, T.; Xu, H.; Hu, G.; Li, R.; Ding, Y.; Zhao, L.; Li, W.; et al. Modeling soil organic carbon spatial distribution for a complex terrain based on geographically weighted regression in the eastern Qinghai-Tibetan Plateau. Catena 2020, 187, 104399. [Google Scholar] [CrossRef]
  26. Zhang, G.; Nan, Z.; Zhao, L.; Liang, Y.; Cheng, G. Qinghai-Tibet Plateau wetting reduces permafrost thermal responses to climate warming. Earth Planet. Sci. Lett. 2021, 562, 116858. [Google Scholar] [CrossRef]
  27. Zhang, M.; Cheng, Y.; Bao, Y.; Zhao, C.; Wang, G.; Zhang, Y.; Song, Z.; Wu, Z.; Qiao, F. Seasonal to decadal spatiotemporal variations of the global ocean carbon sink. Glob. Chang. Biol. 2021, 28, 1786–1797. [Google Scholar] [CrossRef]
  28. Abdalla, K.; Mutema, M.; Chivenge, P.; Everson, C.; Chaplot, V. Grassland degradation significantly enhances soil CO2 emission. Catena 2018, 167, 284–292. [Google Scholar] [CrossRef]
  29. Bardgett, R.D.; Bullock, J.M.; Lavorel, S.; Manning, P.; Schaffner, U.; Ostle, N.; Chomel, M.; Durigan, G.; Fry, E.L.; Johnson, D.; et al. Combatting global grassland degradation. Nat. Rev. Earth Environ. 2021, 2, 720–735. [Google Scholar] [CrossRef]
  30. Buermann, W.; Forkel, M.; O’Sullivan, M.; Sitch, S.; Friedlingstein, P.; Haverd, V.; Jain, A.K.; Kato, E.; Kautz, M.; Lienert, S.; et al. Widespread seasonal compensation effects of spring warming on northern plant productivity. Nature 2018, 562, 110–114. [Google Scholar] [CrossRef] [Green Version]
  31. Hoglind, M.; Van Oijen, M.; Cameron, D.; Persson, T. Process-based simulation of growth and overwintering of grassland using the BASGRA model. Ecol. Model. 2016, 335, 1–15. [Google Scholar] [CrossRef] [Green Version]
  32. Moring, A.; Vieno, M.; Doherty, R.M.; Milford, C.; Nemitz, E.; Twigg, M.M.; Horvath, L.; Sutton, M.A. Process-based modelling of NH3 exchange with grazed grasslands. Biogeosciences 2017, 14, 4161–4193. [Google Scholar] [CrossRef] [Green Version]
  33. Li, C.; Zhang, C.; Luo, G.; Chen, X.; Maisupova, B.; Madaminov, A.A.; Han, Q.; Djenbaev, B.M. Carbon stock and its responses to climate change in Central Asia. Glob. Chang. Biol. 2015, 21, 1951–1967. [Google Scholar] [CrossRef] [PubMed]
  34. Huang, X.; Luo, G.; Han, Q. Temporospatial patterns of human appropriation of net primary production in Central Asia grasslands. Ecol. Indic. 2018, 91, 555–561. [Google Scholar] [CrossRef]
  35. Hidy, D.; Barcza, Z.; Marjanovic, H.; Sever, M.Z.O.; Dobor, L.; Gelybo, G.; Fodor, N.; Pinter, K.; Churkina, G.; Running, S.; et al. Terrestrial ecosystem process model Biome-BGCMuSo v4.0: Summary of improvements and new modeling possibilities. Geosci. Model Dev. 2016, 9, 4405–4437. [Google Scholar] [CrossRef] [Green Version]
  36. Huang, X.; Chen, C.; Yao, B.; Ma, Z.; Zhou, H. Spatiotemporal Dynamics of the Carbon Budget and the Response to Grazing in Qinghai Grasslands. Front. Plant Sci. 2022, 12, 775015. [Google Scholar] [CrossRef]
  37. Huang, X.; Liu, J.; Shen, K.; Liu, Y.; Wang, L. Grassland yield change in Qinghai Province based on MODIS data. Arid Land Geogr. 2020, 43, 715–725. [Google Scholar]
  38. Farquhar, G.D.; Caemmerer, S.V.; Berry, J.A. A biochemical-model of photosynthetic CO2 assimilation in leaves of C-3 species. Planta 1980, 149, 78–90. [Google Scholar] [CrossRef] [Green Version]
  39. Thornton, P.E.; Rosenbloom, N.A. Ecosystem model spin-up: Estimating steady state conditions in a coupled terrestrial carbon and nitrogen cycle model. Ecol. Model. 2005, 189, 25–48. [Google Scholar] [CrossRef]
  40. Running, S.W.; Coughlan, J.C. A general-model of forest ecosystem processes for regional applications.1. hydrologic balance, canopy gas-exchange and primary production process. Ecol. Model. 1988, 42, 125–154. [Google Scholar] [CrossRef]
  41. He, J.; Yang, K.; Tang, W.; Lu, H.; Qin, J.; Chen, Y.; Li, X. The first high-resolution meteorological forcing dataset for land process studies over China. Sci. Data 2020, 7, 25. [Google Scholar] [CrossRef] [PubMed] [Green Version]
  42. White, M.; Thornton, P.E.; Running, S.W.; Nemani, R.R. Parameterization and sensitivity analysis of the BIOME–BGC terrestrial ecosystem model: Net primary production controls. Earth Interact. 2000, 4, 1–85. [Google Scholar] [CrossRef]
  43. Li, Y.-Y.; Dong, S.-K.; Wen, L.; Wang, X.-X.; Wu, Y. Soil carbon and nitrogen pools and their relationship to plant and soil dynamics of degraded and artificially restored grasslands of the Qinghai-Tibetan Plateau. Geoderma 2014, 213, 178–184. [Google Scholar] [CrossRef]
  44. Laub, M.; Ali, R.S.; Demyan, M.S.; Nkwain, Y.F.; Poll, C.; Hogy, P.; Poyda, A.; Ingwersen, J.; Blagodatsky, S.; Kandeler, E.; et al. Modeling temperature sensitivity of soil organic matter decomposition: Splitting the pools. Soil Biol. Biochem. 2021, 153. [Google Scholar] [CrossRef]
  45. Zhang, Y.; Zhang, C.; Wang, Z.; Yang, Y.; Zhang, Y.; Li, J.; An, R. Quantitative assessment of relative roles of climate change and human activities on grassland net primary productivity in the Three-River Source Region, China. Acta Prataculturae Sin. 2017, 26, 1–14. [Google Scholar]
  46. Dai, L.; Fu, R.; Guo, X.; Du, Y.; Lin, L.; Zhang, F.; Li, Y.; Cao, G. Long-term grazing exclusion greatly improve carbon and nitrogen store in an alpine meadow on the northern Qinghai-Tibet Plateau. Catena 2021, 197, 108108. [Google Scholar] [CrossRef]
  47. Gao, X.; Dong, S.; Li, S.; Xu, Y.; Liu, S.; Zhao, H.; Yeomans, J.; Li, Y.; Shen, H.; Wu, S.; et al. Using the random forest model and validated MODIS with the field spectrometer measurement promote the accuracy of estimating aboveground biomass and coverage of alpine grasslands on the Qinghai-Tibetan Plateau. Ecol. Indic. 2020, 112, 106114. [Google Scholar] [CrossRef]
  48. Xiong, Q.; Xiao, Y.; Liang, P.; Li, L.; Zhang, L.; Li, T.; Pan, K.; Liu, C. Trends in climate change and human interventions indicate grassland productivity on the Qinghai-Tibetan Plateau from 1980 to 2015. Ecol. Indic. 2021, 129, 108010. [Google Scholar] [CrossRef]
Figure 1. Elevation (A); average annual temperature (B); and average annual precipitation (C) in the Qinghai grasslands from 1979 to 2018.
Agronomy 12 01201 g001
Figure 2. Comparison of vegetation carbon density (VCD) values based on simulated and observational data (A) and soil organic carbon density (SOCD) values at different depths (including the upper 20 cm, upper 30 cm, upper 40 cm and upper 100 cm) (B).
Agronomy 12 01201 g002
Figure 3. Temporal (A) and spatial (B) dynamics of vegetation carbon density (VCD) and a map showing this trend (C) in the Qinghai grasslands from 1979 to 2018.
Agronomy 12 01201 g003
Figure 4. Vegetation carbon density (VCD) change in the Qinghai grasslands from 1979 to 2000 (A) and from 2001 to 2018 (B).
Agronomy 12 01201 g004
Figure 5. Temporal (A) and spatial (B) dynamics of soil organic carbon density (SOCD) for the upper 100 cm and a map showing this trend (C) in the Qinghai grasslands from 1979 to 2018.
Agronomy 12 01201 g005
Figure 6. Soil organic carbon density (SOCD) change in the Qinghai grasslands from 1979 to 2000 (A) and from 2001 to 2018 (B).
Agronomy 12 01201 g006
Publisher’s Note: MDPI stays neutral with regard to jurisdictional claims in published maps and institutional affiliations.

