Article

Spatiotemporal Patterns of Multiscale Drought and Its Impact on Winter Wheat Yield over North China Plain

1
Key Laboratory of Agricultural Soil and Water Engineering in Arid and Semiarid Areas, Ministry of Education, Northwest A&F University, 22 Xinong Road, Xianyang 712100, China
2
Institute of Water-Saving Agriculture in Arid Areas of China, Northwest A&F University, 22 Xinong Road, Xianyang 712100, China
3
College of Water Resources and Architectural Engineering, Northwest A&F University, 22 Xinong Road, Xianyang 712100, China
*
Author to whom correspondence should be addressed.
Agronomy 2022, 12(5), 1209; https://doi.org/10.3390/agronomy12051209
Submission received: 24 April 2022 / Revised: 14 May 2022 / Accepted: 15 May 2022 / Published: 18 May 2022

Abstract

:
Drought has a significant impact on agricultural production, but the evolution of drought in the North China Plain (NCP) and its impact on winter wheat yield remain unclear. In this paper, we used the Standardized Precipitation Evapotranspiration Index (SPEI) and combined with the Standardized Yield Residual Series (SYRS) and the Vegetation Condition Index (VCI) to study the spatiotemporal distribution of drought at different time scales and its impact on winter wheat yield. We found that: (1) The southern NCP was dominated by mild drought at the 1-month scale. In the northern NCP, mild drought was observed at the short-time scale and moderate drought at the medium- and long-time scales; (2) the frequency of mild drought was high and the frequency of moderate drought was a step lower. Moreover, drought risks were increasing in the north-central, eastern, and northeastern NCP, while the southern, west-central, southeastern, and northwestern NCP were becoming wetter (at the 6- and 9-month scales); (3) the maximum correlation coefficients were concentrated in the seedling to the greening stages. (4) Drought affected winter wheat with a lag of approximately 3 months, and the VCI was the most sensitive to the short-term SPEI.

1. Introduction

Drought is disastrous; it can cause enormous social and economic harms [1,2] and is a serious threat to regional ecosystems and agricultural production [3,4,5]. China’s total cultivated land accounts for 7.5% of that of the world [6], and global warming may exacerbate the scale of drought in northern China [7,8] and thus hinder agricultural production and sustainable development [9]. Winter wheat is one of three major crops in China (the other two are rice and maize), and its total output accounts for approximately one-sixth of world production. The North China Plain (NCP) has the largest planting area and output of winter wheat in China [10]. Because drought has a strong correlation with crop growth [11], understanding the spatial and temporal distribution of drought in the NCP and its dynamic effects on winter wheat yield can help improve crop adaptability to environmental changes and optimize agricultural water resource management to ensure regional food security.
Studies have used field experiments to simulate the changes in soil moisture during drought by limiting irrigation to uncover the relationship between drought and crop growth and thereby assist irrigation decisions [12,13,14]. However, drought is a complex meteorological disaster that also influences air temperature, humidity, and CO2 fixation [15,16,17,18], and drought at different elevations has different effects on crops [19]. Although drought simulation experiments at point scale can explain the physiological mechanism of crops to an extent, they cannot represent regional drought phenomena. Drought indices based on meteorology were closely correlated with agricultural production and spatially related to biophysical drought [20]. Thus, several drought indices, such as the Standardized Precipitation Index (SPI), Palmer Drought Severity index, Palmer Z-index, and Standardized Precipitation Evapotranspiration Index (SPEI) have been widely used in the assessment of regional drought and its relationship with crop yield [21,22,23,24]. In many studies, the SPEI was a reliable indicator to explain the correlation between drought and crop yield [25,26,27]. The SPEI is flexible on different time scales and enables understanding of the relationship between climate and yield due to its accounting for both precipitation and potential evapotranspiration [28,29]. Prabnakorn et al. [30] reported that the 1-month SPEI and the rice Standardized Yield Residual Series (SYRS) presented a positive correlation in all except the extremely wet months in Thailand. Potopova et al. [31] indicated that the SPEI with a short-time scale explained crop growth, and the SPEI and SYRS had a stronger correlation in the critical stages of crop growth than in other stages. Lu et al. [32] also proved that most crops were sensitive to drought in the early growth period and reach the maximum sensitivity in the growth boom period; they also demonstrated that the SPEI was more reliable than the SPI in monitoring the response relationship of drought to crops. However, the correlations between the SYRS of different crop types and the SPEI of different time scales varied between geospatial and climatic environments [33,34,35], and their responses to drought also differed [36].
The NCP is a major grain producing area in China with frequent droughts, but the evolution of drought in this area and its impact on winter wheat yield remain unclear. In this paper, we analyzed the spatial and temporal distribution characteristics of drought at different time scales and its effects on winter wheat yield in the NCP. The main objectives were: (1) evaluating the evolution of drought at different timescales and its inter-annual and intra-annual variations at different SPEI time scales; (2) analyzing the correlation of various lags of the SPEI with the SYRS; and (3) evaluating the response of winter wheat vegetation index (VCI) to SPEI.

2. Materials and Methods

2.1. Study Area

The study area is located in the east of China (32–40° N, 114–120° E), mainly in THE Beijing, Tianjin, Henan, Hebei, Shandong, Anhui, and Jiangsu provinces. It is the second largest plain in China, with an elevation of less than 50 m in most places and a total area of approximately 30 × 104 km2. The sown area of winter wheat is 16.2 × 10² km2. The area is an impact plain formed by the large amount of sediment deposited by the Yellow River, Huaihe River, Haihe River, and Luanhe River. It is the main winter wheat planting area in China, and winter wheat and summer maize are rotated as the main crops. Climatically, the NCP has a temperate to subtropical monsoon climate. The average annual precipitation is 403.9–1192.8 mm, falling mainly from June to September and inter-annual variation is large, and the average daily temperature is 9.9–16.4 °C; both decrease from south to north with increasing latitude. Winter wheat is a cross-year growing crop, which is usually sown in October of the first year and harvested in late May or early June of the following year. We used ENVI 5.3 software to classify the land type and to extract the planting area of winter wheat by using a support vector machine. In addition, the actual distribution points of winter wheat were used to verify, the classification accuracy was 95.9%, and the Kappa coefficient was 0.93 (Figure 1).

2.2. Dataset

Meteorological data were obtained from the China Meteorological Information Center (http://data.cma.cn/ (accessed on 30 June 2021)), including daily minimum and maximum, average temperature, and precipitation data from 68 meteorological stations from 2001 to 2015 for the calculation of the SPEI. Previous studies had used similar years to study drought [37,38,39].
The yield data of each city from 2002 to 2015 were obtained from the statistical yearbooks of each province (http://www.stats.gov.cn/ (accessed on 30 June 2021)). To avoid the error caused by changes in planting area each year, unit yield was selected for calculation and analysis (winter wheat is a cross-year growing crop, and its growth period is from September or October of the previous harvest year to May or June of the current harvest year).
The remote sensing data were derived from the MOD09A1 product in Google Earth Engine (https://developers.google.com/earth-engine/datasets/catalog/MODIS_006_MOD09A1?hl=en (accessed on 30 June 2021)) with a spatial resolution of 500 m for calculating VCI, which eliminates part of the cloud interference through the maximum synthesis method to generate the best observation data for 8d synthesis, including the estimated surface spectral reflectance in bands 1–7.

2.3. Methods

The methodological framework in this paper was shown in Figure 2. We first preprocessed meteorological data, yield data and remote sensing data, then calculated the basic indicators, and finally analyzed the results.

2.3.1. Meteorological Data Processing

First, the fishnet tool of ArcGIS 10.6 software was used to create grids covering the study area, with a spatial resolution of 25 km2 × 25 km2 (a total of 1001 grids). Then, the ordinary Kriging interpolation method was used to interpolate the daily meteorological data of 68 meteorological stations into all grids to obtain daily temperature and precipitation grid spatial distribution data from 2001 to 2015 in the study area. Finally, the grid covering the winter wheat area was extracted in each city (if one grid was not enough, the grid was calculated according to one grid, because it is possible that only part of a grid is in a city). The resulting raster data were averaged to represent the winter wheat meteorological data for each city.

2.3.2. Calculating the SPEI

In this paper, the SPEI was used to represent the drought level. It was a more realistic representation of actual drought in a region than the SPI because it takes into account potential evapotranspiration [37,38,40]. The SPEI calculates water balance (Equation (1)) based on the difference between monthly precipitation and potential evapotranspiration. The specific calculation steps were described by Vicente-Serrano et al. [22]. In addition, the slope of unary linear regression was used to estimate the trend in this paper (Equation (2)).
D i = P i P E T i
S P E I j , k = T × y e a r j , k + b
where P i and P E T i are precipitation and potential evapotranspiration in month i, respectively. SPEIj,k and yearj,k are SPEI value and year of grid k in year j, respectively. T and b are slope and intercept, respectively, and slope (T) was defined as trend in this study.
In this paper, the modified Hargreaves method for the NCP was selected to calculate potential evapotranspiration [41]. Although the P-M method is the standard method recommended by the FAO to calculate potential evapotranspiration, it requires too many parameters and cannot be used in regions where meteorological data are lacking. Moreover, Mavromatis [21] reported that simple and complex methods for calculating potential evapotranspiration yield similar results when calculating a drought index. In this study, monthly precipitation, daily maximum and minimum, and average temperatures were input into a Python-based SPEI package (https://www.drought.gov/data-maps-tools/climate-and-drought-indices-python-spi-spei-pet (accessed on 30 June 2021)) to calculate the 1-, 3-, 6-, and 9-month SPEI (SPEI-1, SPEI-3, SPEI-6, and SPEI-9) during the winter wheat growth period from 2001 to 2015; studies had shown that crops may be affected by drought at different time scales with space changes [36]. The classification of drought levels was provided in Table 1.

2.3.3. Calculating the SYRS

Observed yield is composed mainly of trend yield, climate yield, and random yield. Trend yield reflects the impact of productivity development on crop yield, including the renewal of species, optimization of management technology, reasonable and efficient application of fertilizer. Therefore, we must de-trend the observed yield to extract the climate yield, which we care about. We first used the quadratic function to fit the actual yield to obtain the trend yield, and then the residual of the de-trended series of crop yield (yi) was obtained by subtracting the observed yield from the trend yield, and yi was used for analysis. To compare crop yield variability between different mean values and standard deviations, Z-score transformation was used to standardize the yield of the de-trended crop yield time series.
S Y R S = y i μ σ
where SYRS is Standardized Yield Residual Series, y i is the yield residual, μ is the mean of the yield residual, and σ is the standard deviation of the yield residual.

2.3.4. Calculating VCI

VCI was defined as the ratio of the current NDVI to the maximum and minimum value of NDVI in the same period over many years, which reflected the growth status of vegetation in the same physiological period [42] (Equations (4) and (5)). The difference between the maximum and minimum values in the denominator represent the habitat of the local vegetation, wherein the smaller the difference between the molecular NDVI value and the minimum value in a certain period, the worse the growth. VCI values range from 0 to 100, with VCI < 30, 30 < VCI < 70, and VCI > 70 indicates poor, moderate, and good growth, respectively. We took the average of the VCI over a month due to the step size of the SPEI being 1 month.
Although the MOD09A1 product underwent cloud monitoring and radiometric correction, noise introduced by clouds and the atmosphere was still present. The Savitzky–Golay filtering method was used for de-noising and smoothing (Equation (6)).
N D V I = ρ n i r + ρ r e d ρ n i r ρ r e d
V C I i , j = N D V I i , j N D V I i , min N D V I i , max N D V I i , min
Y j * = i = m i = m C i Y j + 1 N
where ρ n i r and ρ r e d are the reflectivity values of near infrared and red channels, respectively; N D V I i , j is the NDVI value in month i and year j; N D V I i , min and N D V I i , max are the minimum and maximum values of month i during 2001–2015, respectively; Y is the VI before smoothing; Y * is the VI after smoothing; C i is the filtering coefficient of the ith VI in the smoothing window; N is the number of convolutions equal to the length of the sliding array (2m + 1); m is half the width of the sliding window; and C i was calculated using the formula proposed by Hannibal [43].

2.3.5. Correlation Analysis

The nonparametric Spearman’s Rho coefficient was used to evaluate the effects of drought on winter wheat yield in different months and at multiple time scales (Equation (7)). The Spearman correlation coefficient can be used to evaluate the correlation between two statistical variables by using monotone equations. For our sample data, correlation coefficients of 0.538 and 0.675 represented significance levels of 5% and 1%, respectively.
ρ = 1 6 × i = 1 n d i 2 n ( n 2 1 )
where n is the number of samples and d is the drought level difference between the two variables.

3. Results

3.1. Spatiotemporal Distribution of Drought

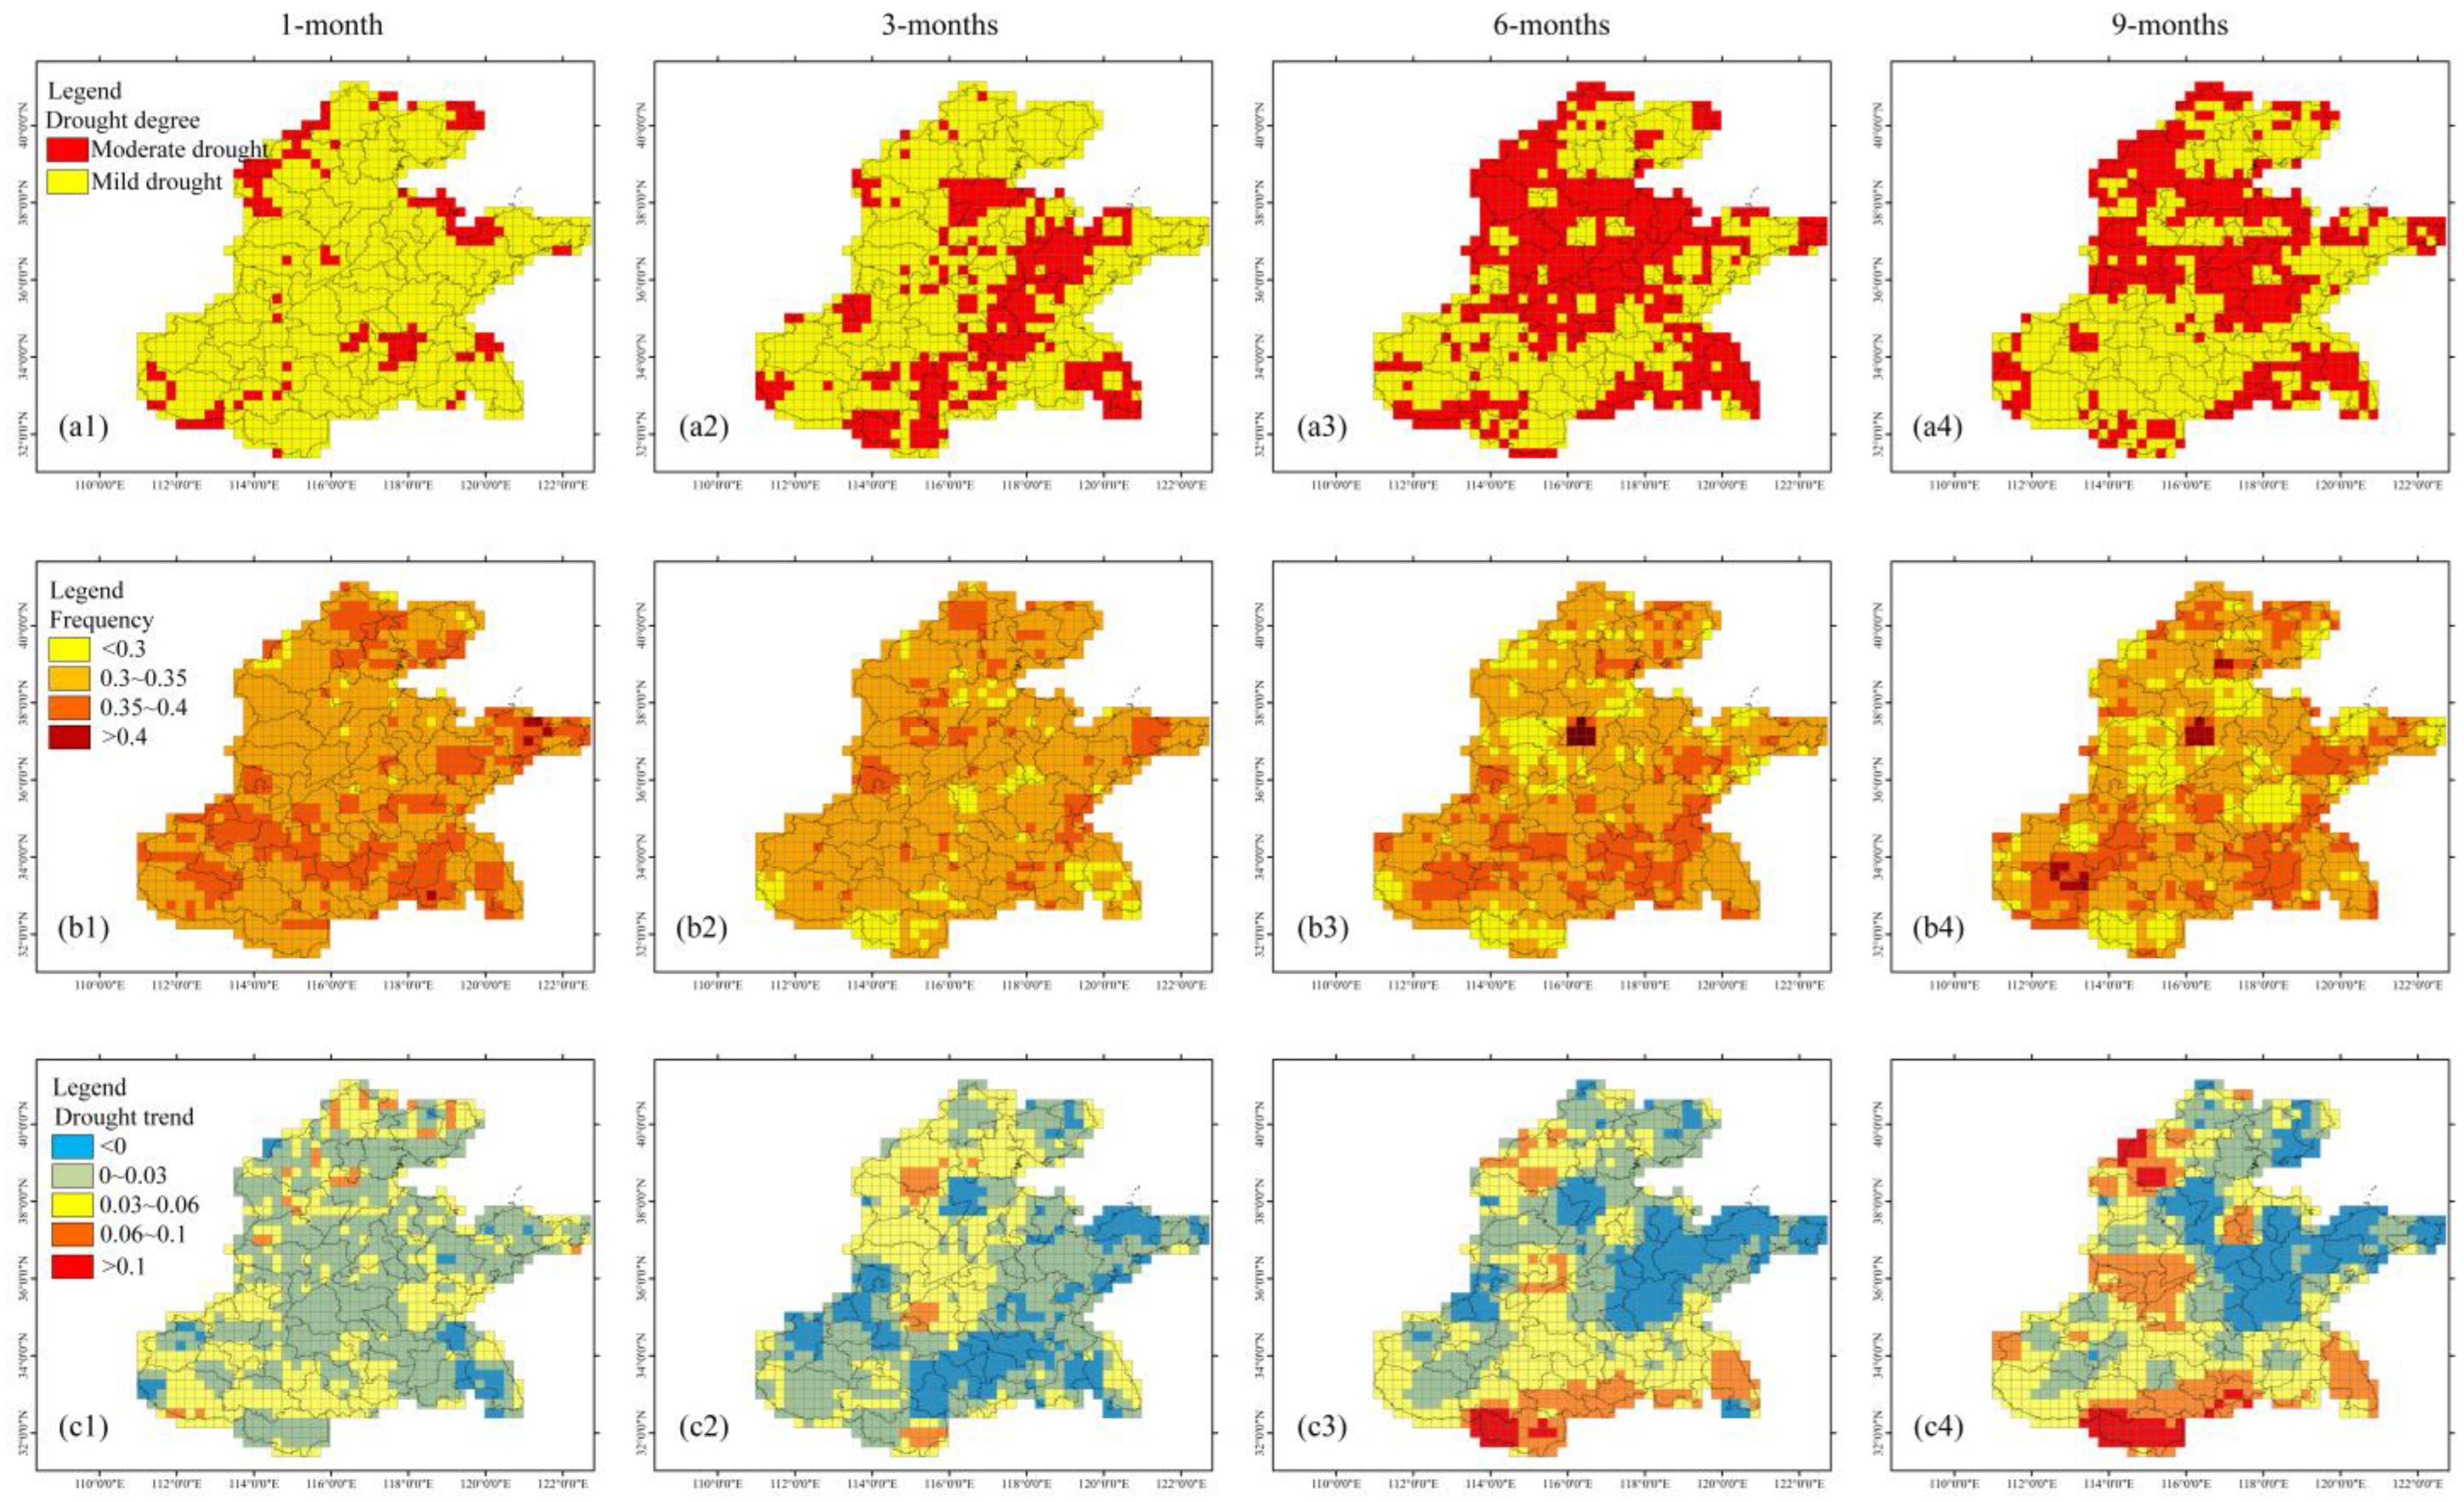
We used raster meteorological data to calculate the SPEI in the study area for 2001–2015 and observed that if drought occurs, the NCP was affected mainly by mild drought in SPEI-1, whereas the area with moderate drought gradually increased with an increase in the time scale (SPEI-6 was the largest affected area), distributed mainly in the center, northwest, and southeast areas of the NCP (Figure 3(a1–a4)), indicating that the NCP was affected mainly by moderate drought on a medium and long-time scale. SPEI-1 had the highest frequency during the winter wheat growth period with 3–5 months of drought each year, and the frequency of drought in the center and north exhibited a decreasing trend when the SPEI time scale was longer. However, the frequency of drought remained high in parts of the south and the east of the study area. The frequency in SPEI-1 was highest (Figure 3(a1–b4)), but it was dominated by mild drought; the areas with low frequency of drought in SPEI-9 were characterized by moderate drought; the areas with high frequency of drought generally corresponded to low drought level (except SPEI-3), indicating that the NCP did not suffer from severe droughts in general and that most droughts were dominated by short-time scale.
The variation trend of SPEI-1 indicates that the NCP was gradually becoming wetter; that is, drought in the short-time scale was alleviated and the risk of drought was reduced. The southern, west-central, southeastern, and northwestern NCP had a faster tendency to become wetter with the time scale increases. By contrast, the north-central, eastern, and northeastern NCP were becoming drier and the risk of drought was increasing. Thus, the NCP was becoming polarized between dry and wet.
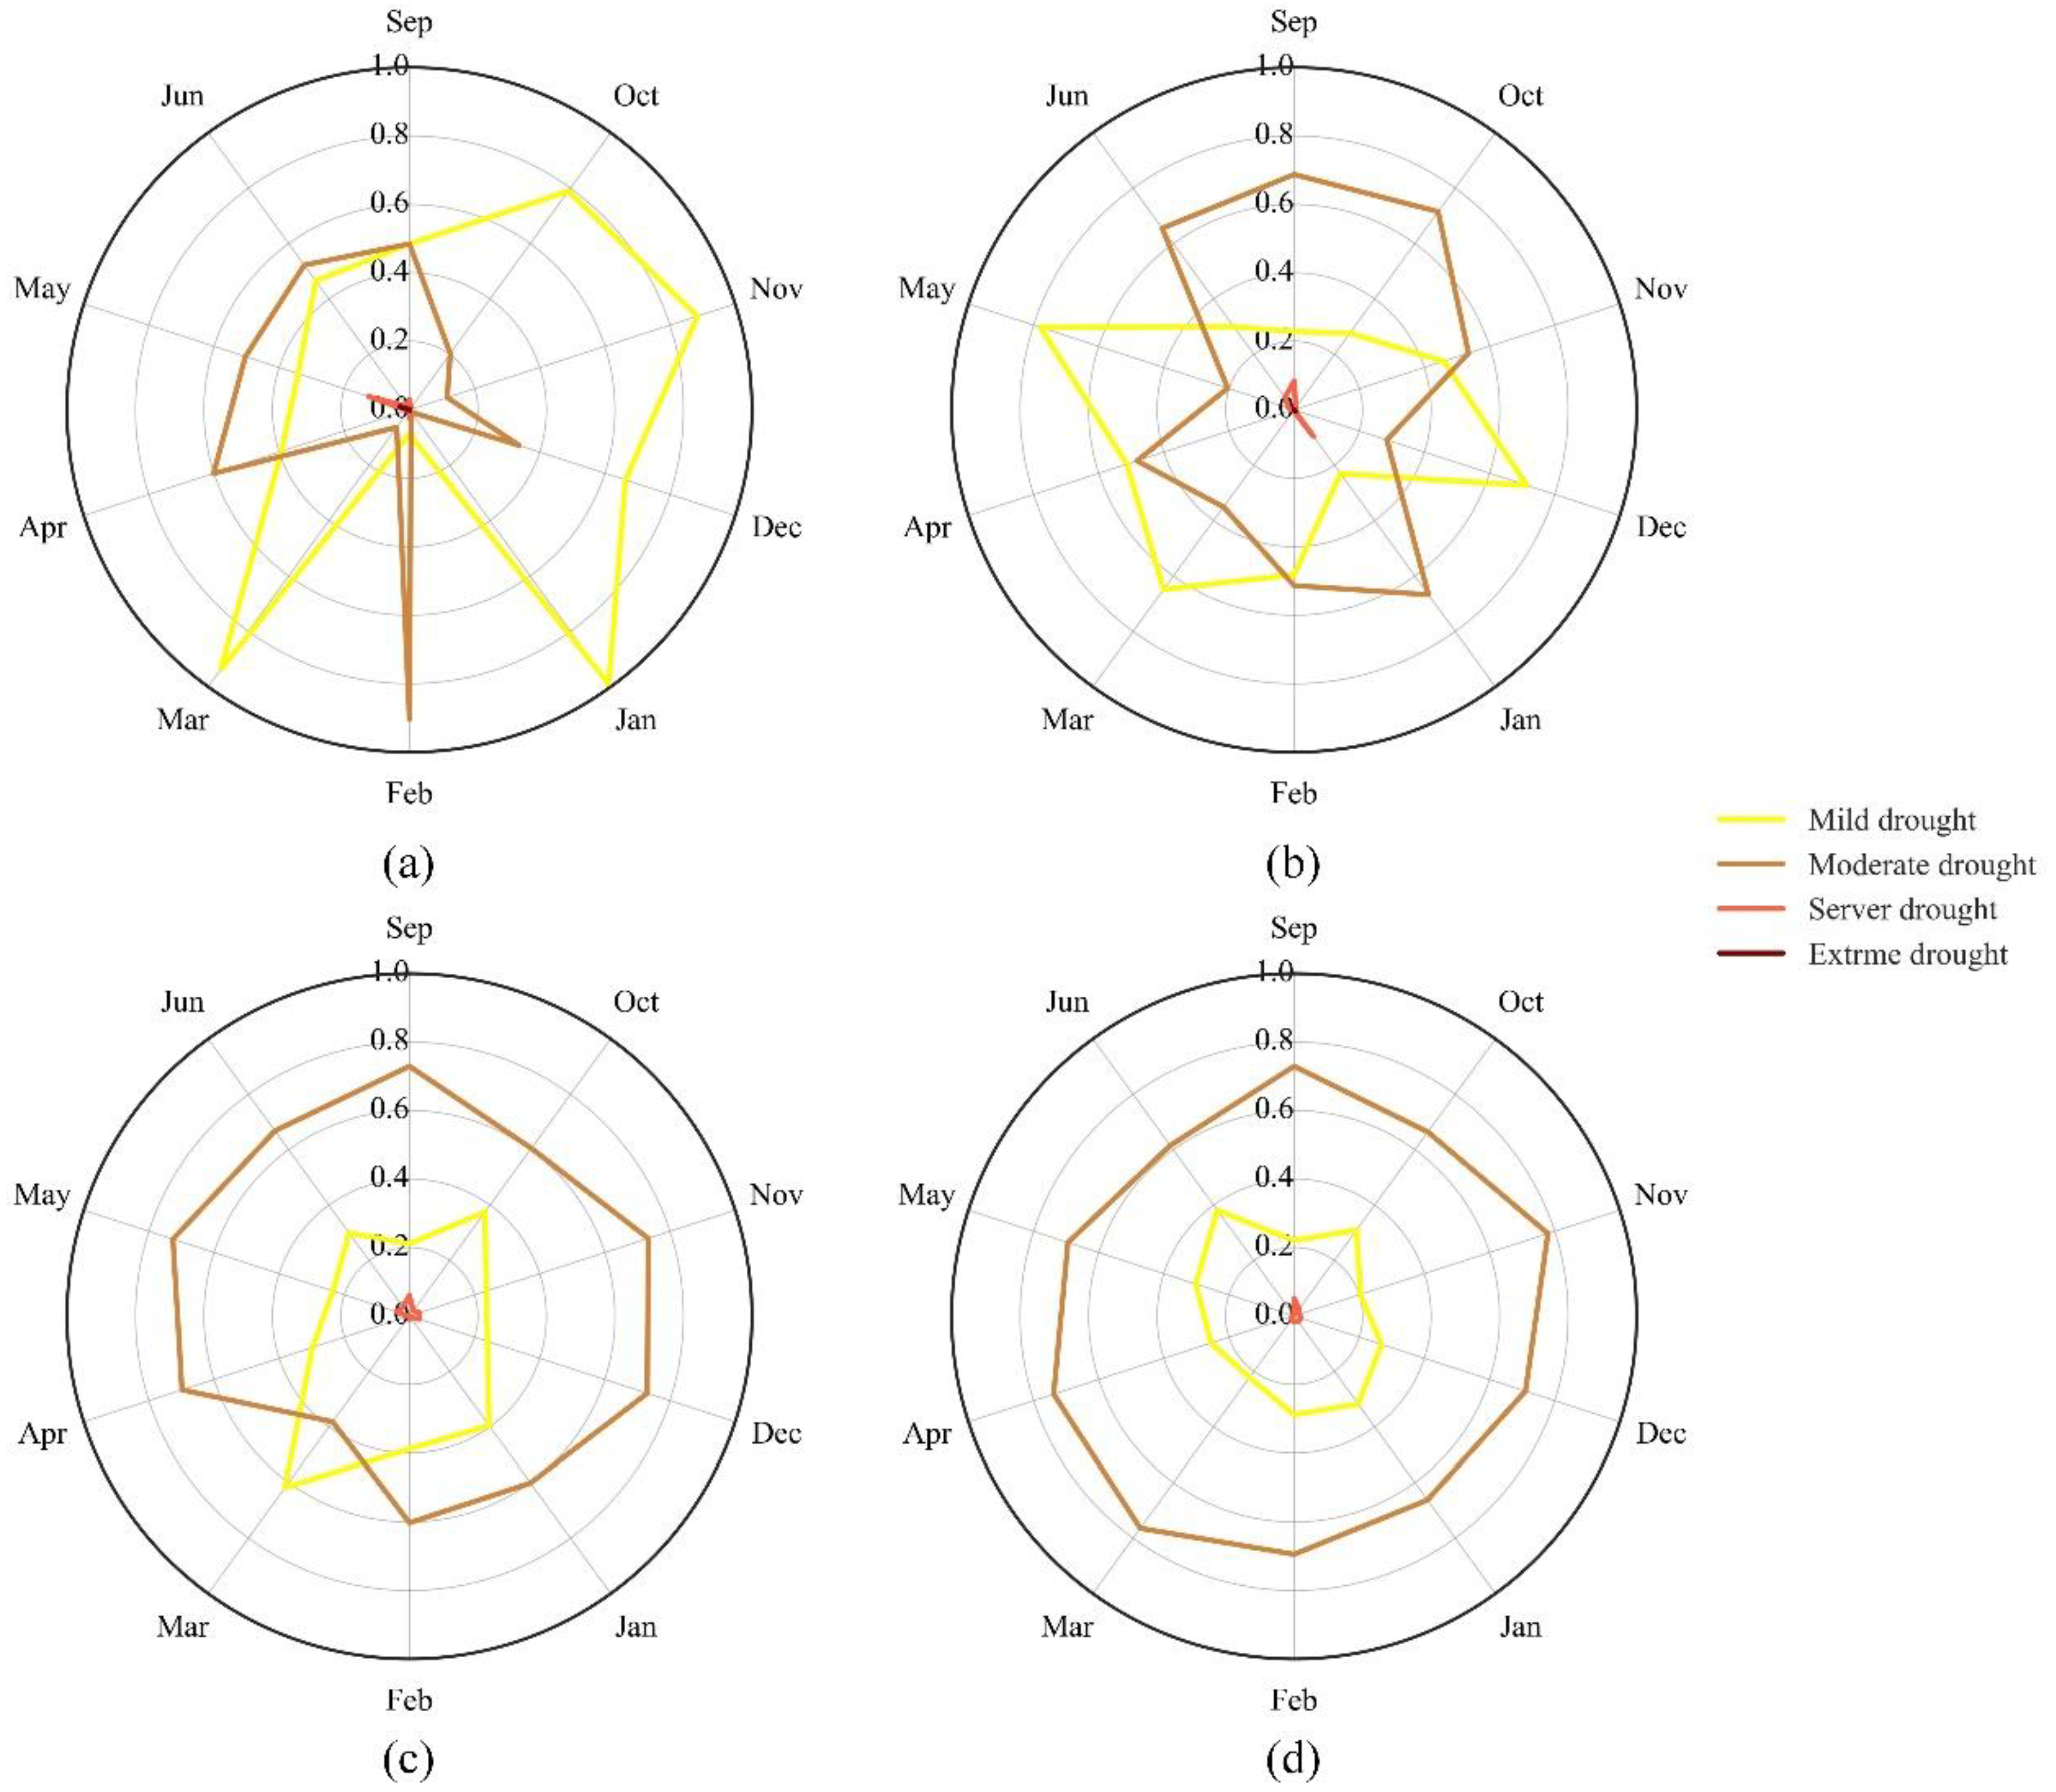
According to the annual variation, when drought occurred, it was mainly mild or moderate, and severe droughts were rare (SPEI-6 and SPEI-9 never experienced extreme droughts) (Figure 4). SPEI-1 was dominated by mild drought from October to January of the following year, followed by alternating mild and moderate drought, and then moderate drought gradually came to dominate. The frequency of moderate drought increased with an increase in the time scale, and the frequency of moderate drought in SPEI-9 was greater than 0.6 during the entire growth period of winter wheat. In addition, the jointing and heading stages of rapid growth of winter wheat were also dominated by moderate drought (except for SPEI-3), which had a greater impact on the final yield in rain-fed areas.

3.2. Correlation Analysis of the SPEI and SYRS

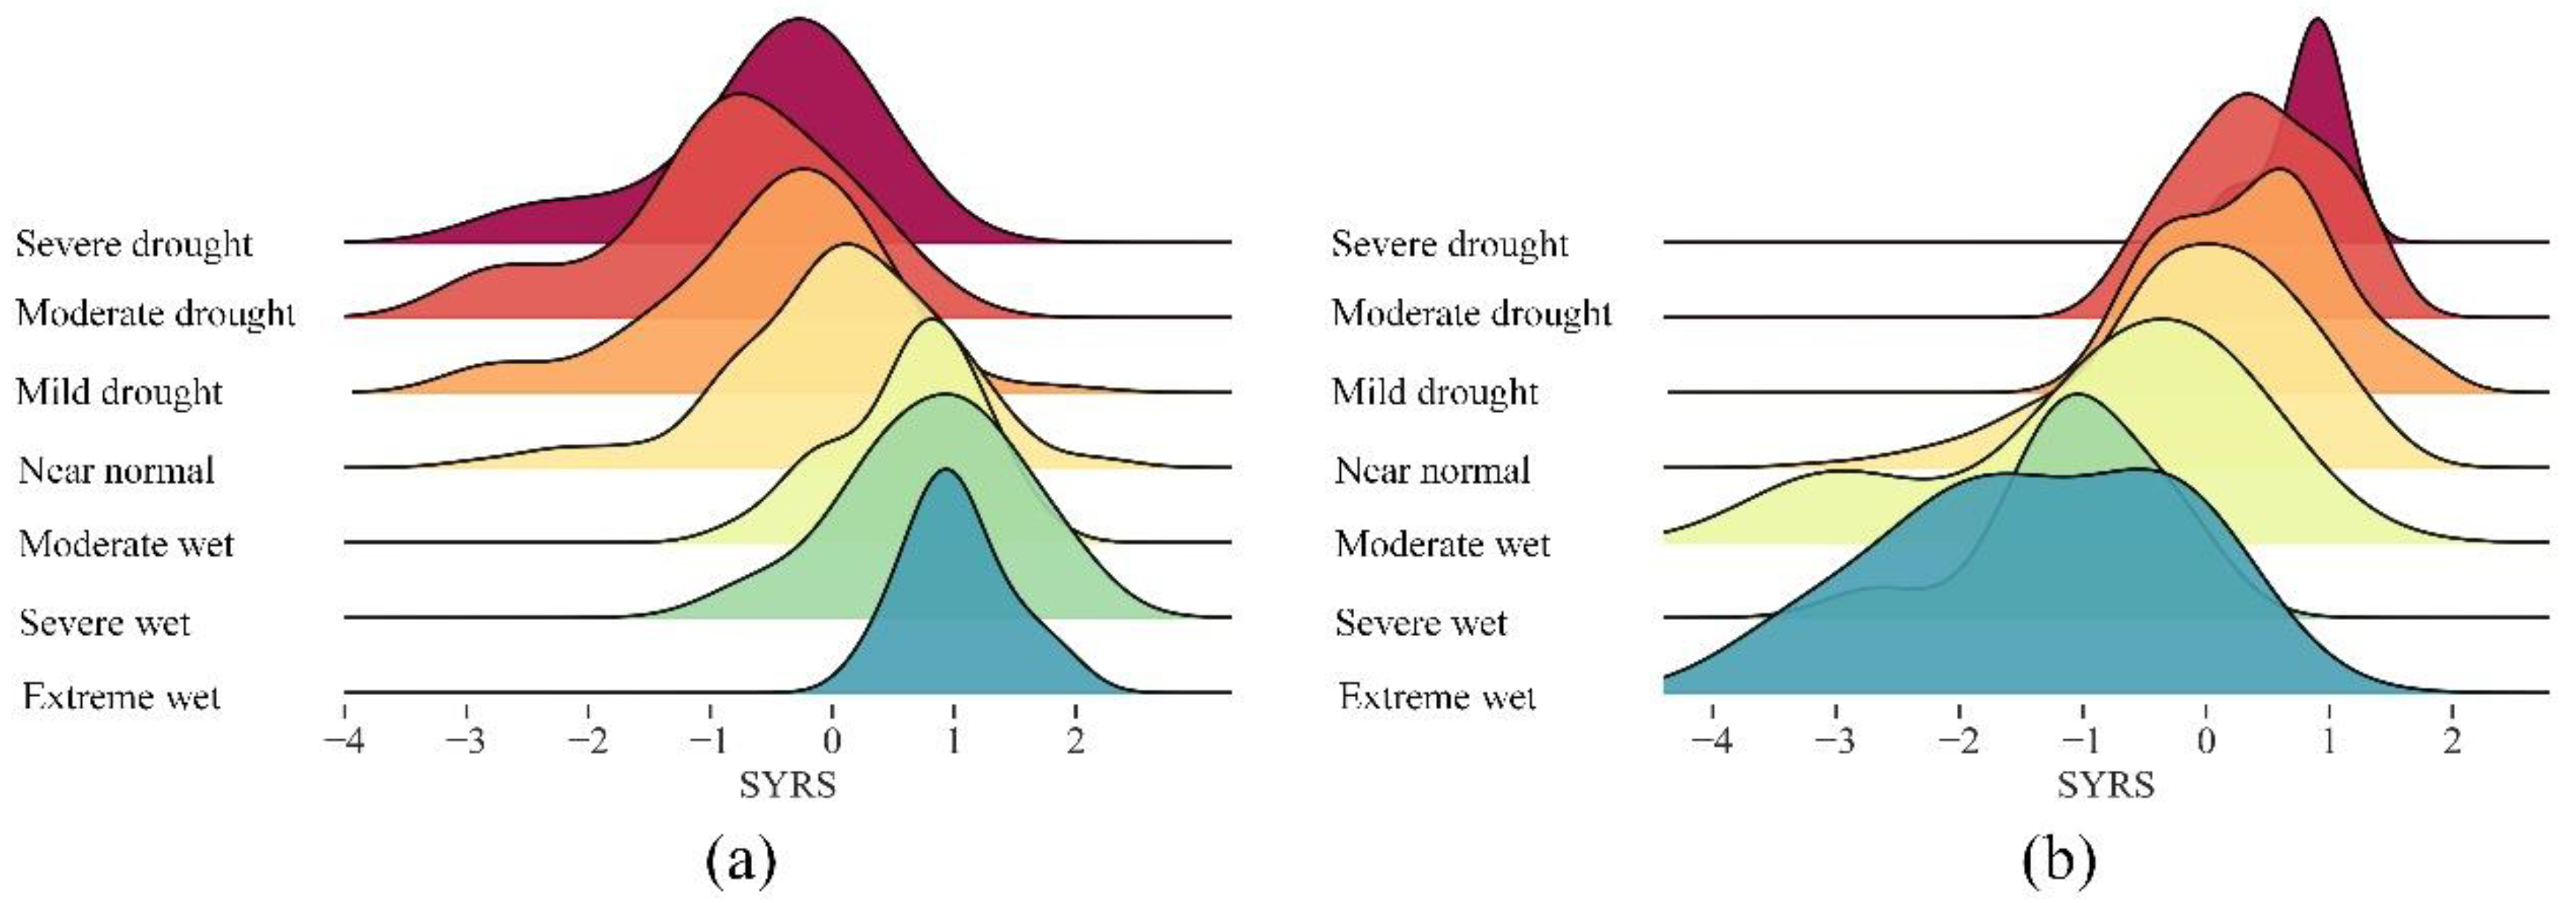
The sensitivity of crops to drought varied with geographic space, and the optimal correlation coefficient of the SPEI and the SYRS was positive or negative in the NCP (Figure 5). A negative correlation between SPEI and SYRS was present for the north-central, south-central, and southeastern NCP. In addition, the months and time scales with the maximum correlation coefficients were generally from October to February of the following year at short and medium-time scales (SPEI-1 and SPEI-3), indicating that drought at the short-time scale from seedling stage to greening stage had a promoting effect on the yield in these areas. The months with the highest positive correlation coefficient were mainly those of seedling to greening, but the time scales were mainly medium and long (SPEI-3, SPEI-6, and SPEI-9). The highest correlation coefficient was concentrated mainly in the seedling stage of winter wheat (over 80%), whereas the proportion of March and April with the highest correlation coefficient was small during the winter wheat growth period. We divided cities into two categories based on positive and negative correlation coefficients and evaluated the impact of drought on final yield (Figure 6). In cities with a positive correlation between the SPEI and the SYRS, the yield increased with the increase in precipitation and the wetness of the climate. By contrast, in the cities with a negative correlation coefficient, drought seems to have had a positive effect on the final yield.
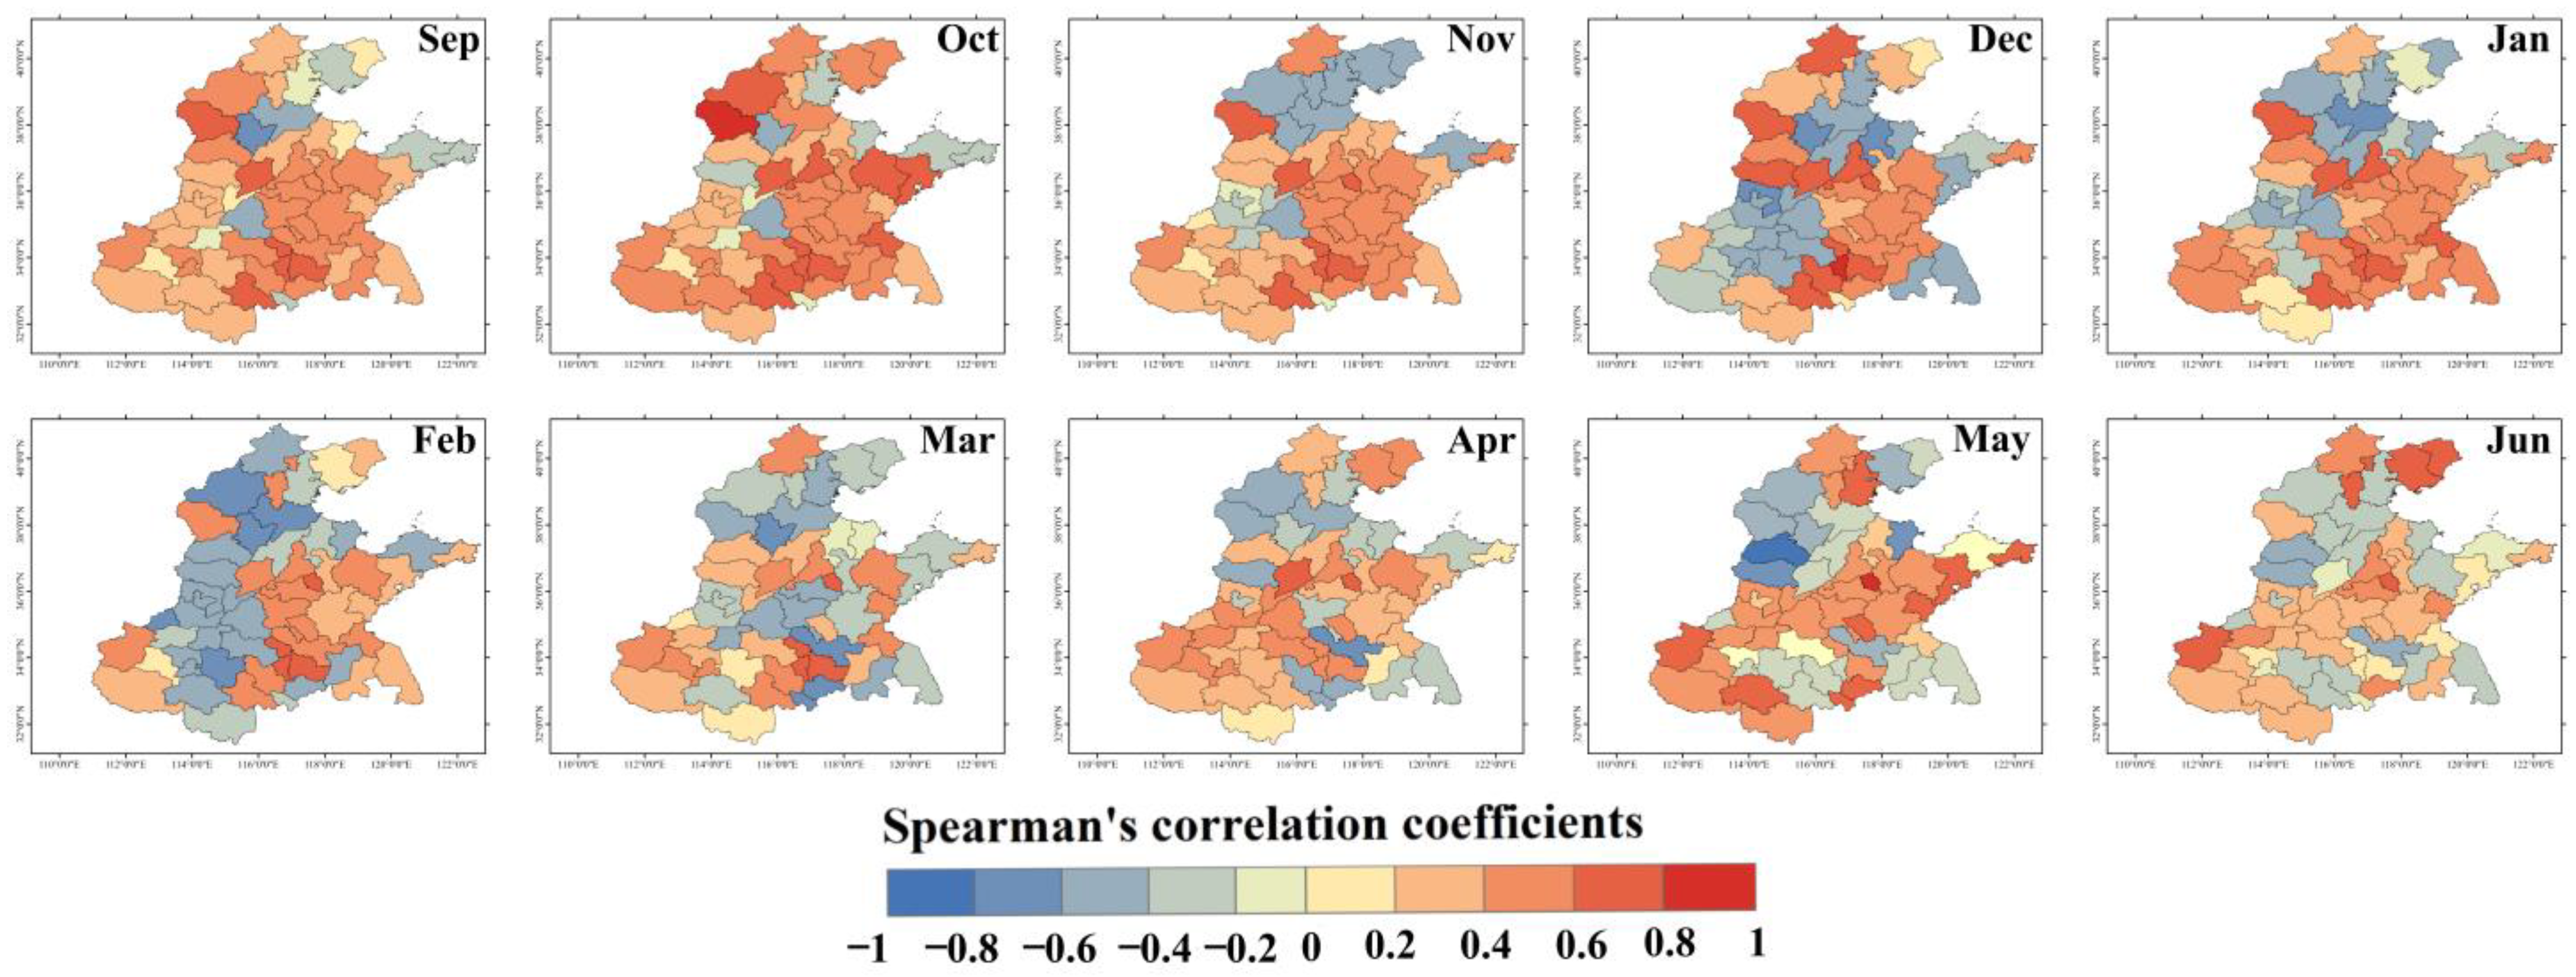
The growing cycle of crops was related to all stages. To further understand changes in the correlation between the SPEI and the SYRS over time, we continued to map the spatial distribution of the correlation with monthly steps during the growth period of winter wheat (Figure 7). Drought in September and October of the previous harvest year inhibited the final yield in more than 90% of areas, whereas drought in the north and southwest of the NCP from November of the previous harvest year to February of the harvest year had a positive effect on the yield. During March to June of the harvest year, the number of such active cities decreased, and they were mainly distributed in the northwestern, southern, and southeastern NCP. In addition, during the entire winter wheat growth period, drought in the east-central and southwestern NCP mainly inhibited growth, whereas drought in the north-central NCP had a positive effect on yield. Thus, the occurrence of drought did not cause production loss; indeed, timely drought was helpful in the growth of winter wheat, but the positive effect of drought on yield varied with the time and location of drought.

3.3. Effects of Drought on Winter Wheat Growth

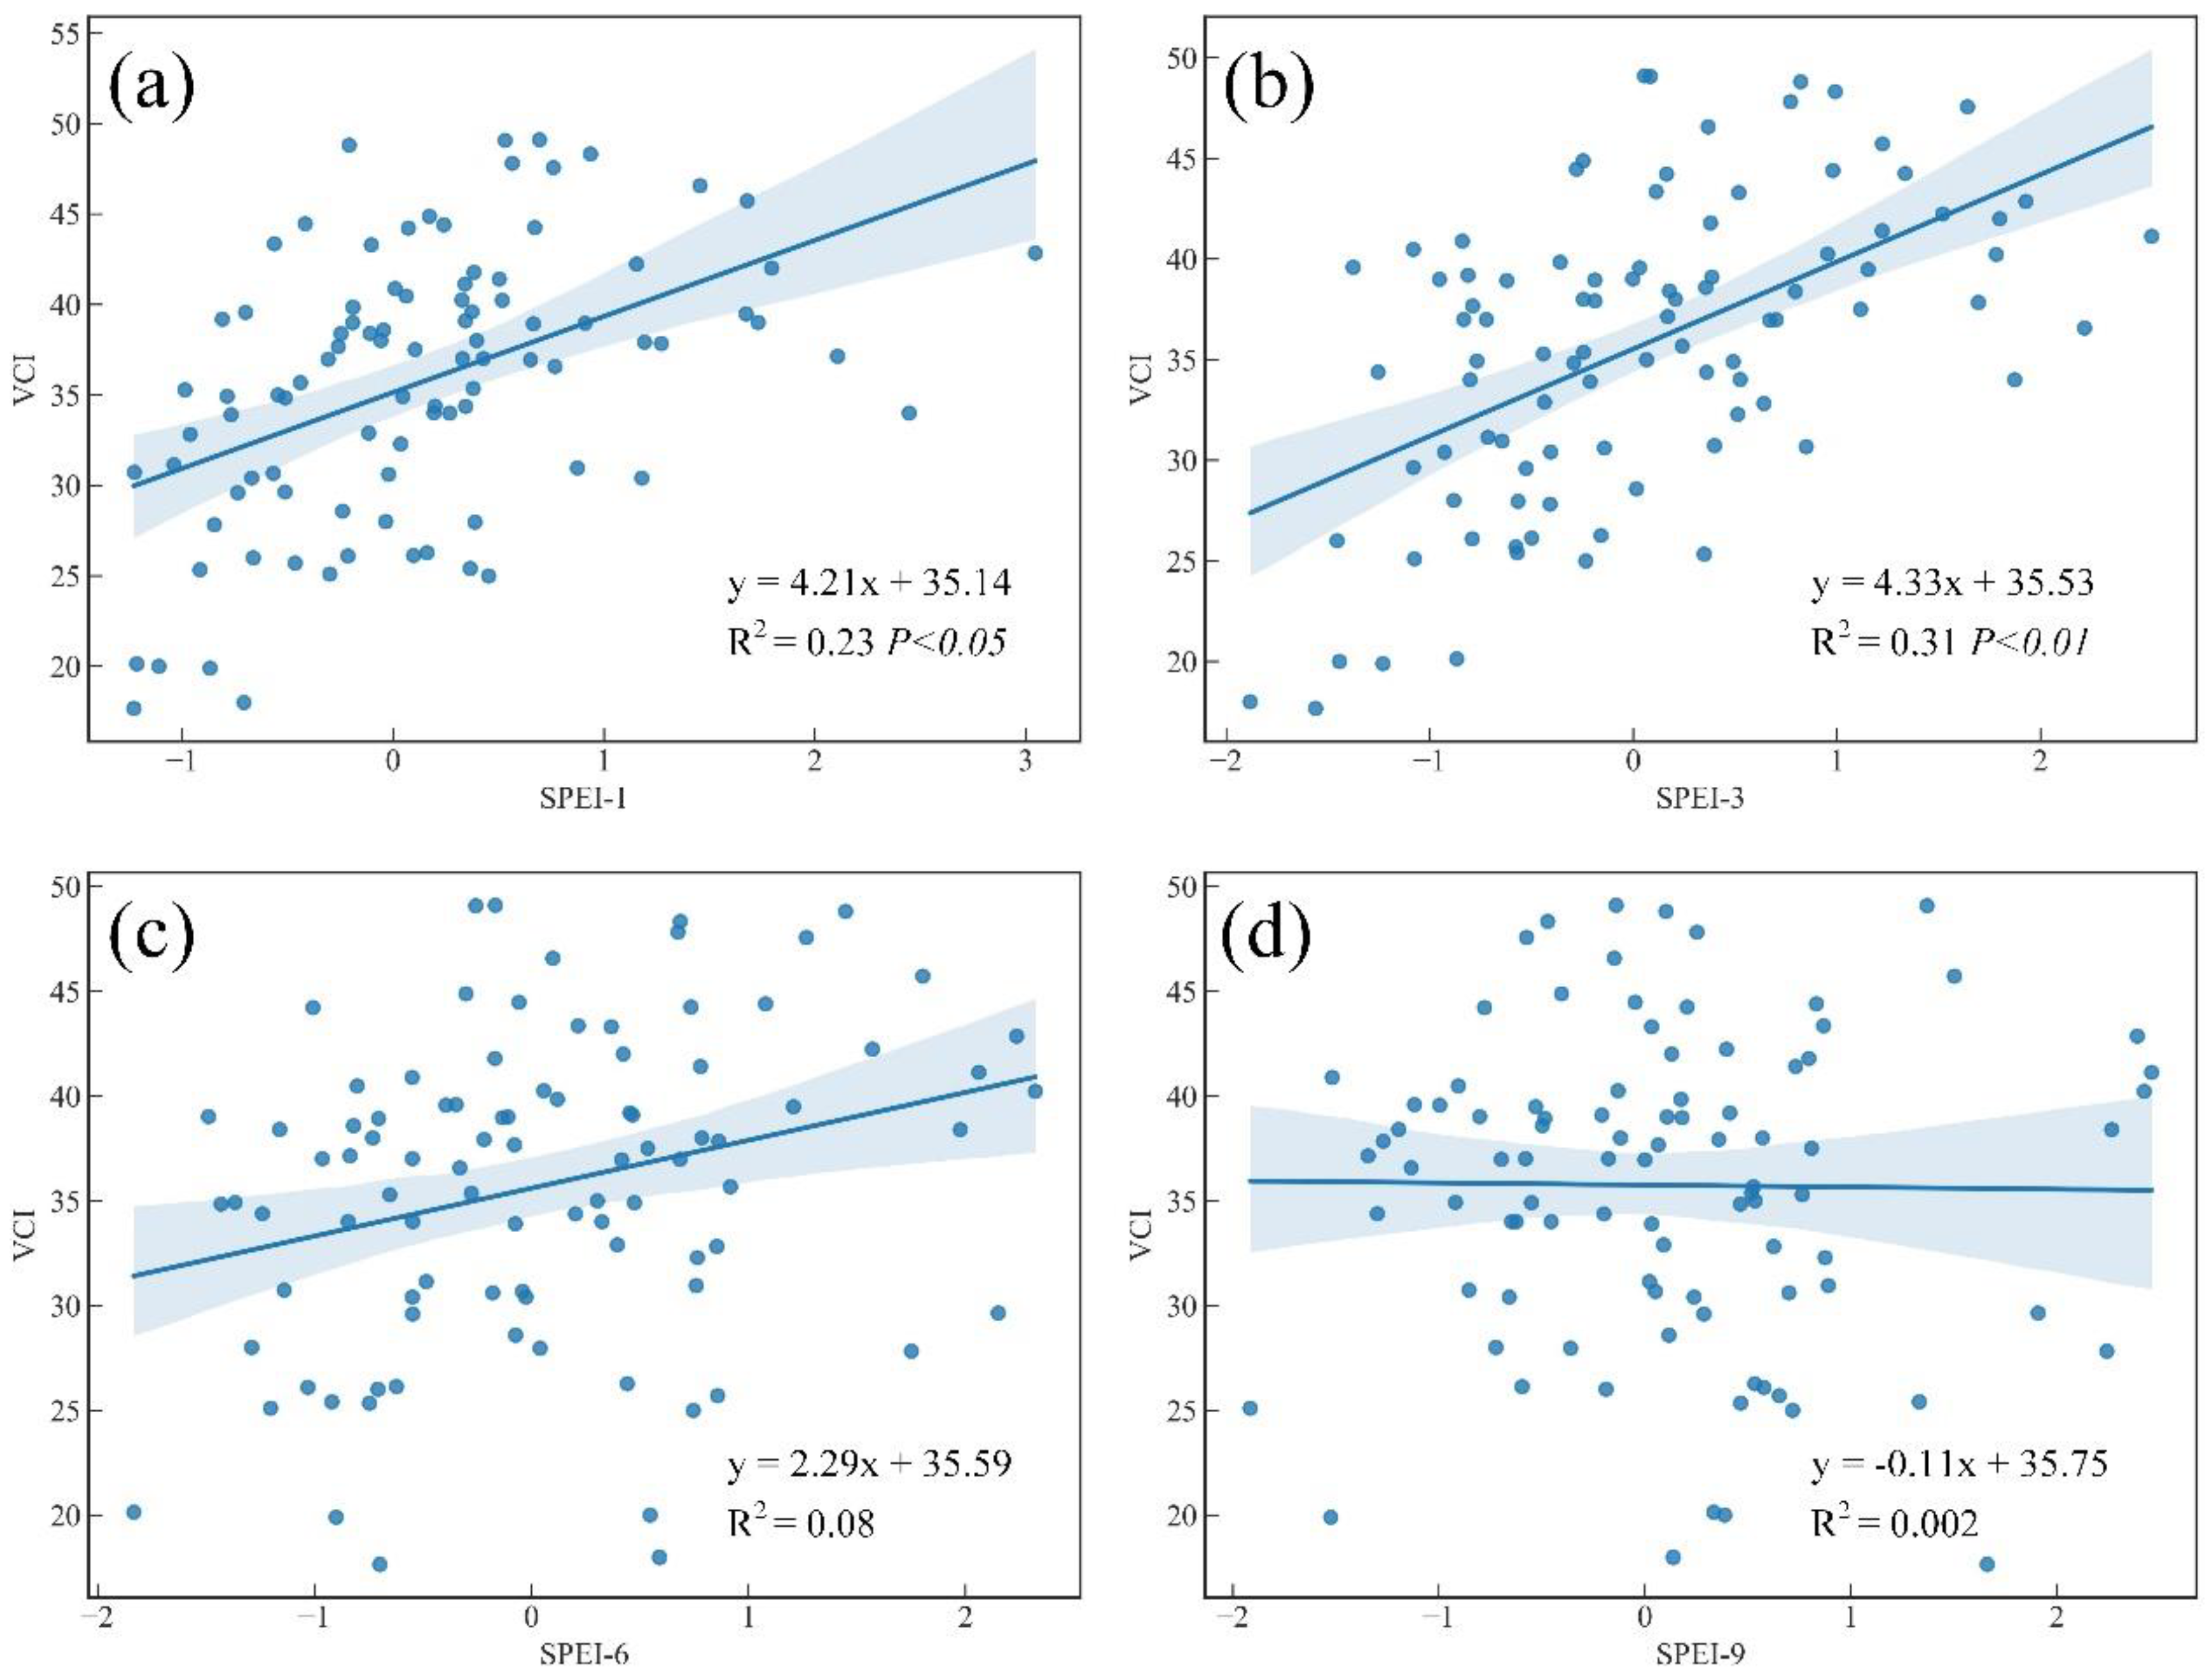
Taking Henan Province, which has the highest winter wheat planting area and yield, as an example, we analyzed the impact of drought on the growth of winter wheat during 2001–2015 (Figure 8 and Figure 9). The VCI was most sensitive to SPEI-1 and SPEI-3, whereas the sensitivity of the VCI to the long-term SPEI gradually decreased. This was because the short-term SPEI reflected a short-term water deficit and was sensitive to climate change. Restated, the short-term SPEI could show better effected on winter wheat growth than the long-term SPEI. Moreover, the correlation between SPEI-3 and VCI was greater than that between SPEI-1 and VCI, suggesting that the effect of drought on winter wheat lagged about 3 months. The VCI exhibited an obvious downward trend and was prone to growth stress according to the drought increase and continues. However, this trend was improved after 2012. Henan Province provided financial support for the construction of small irrigation and water conservancy facilities in 30 counties in 2012 according to inquiry data (http://czt.henan.gov.cn/2012/07-31/1059363.html (accessed on 30 June 2021)), and this policy substantially improved winter wheat growth; timely supplementary irrigation mitigated the negative effects of drought and reduced yield loss due to drought even if in high intensity and prolonged droughts.

4. Discussion

Precipitation and evapotranspiration were the main influencing factors of drought, and sometimes evapotranspiration was the larger factor [3]. Therefore, SPEI-1 in the NCP was mainly mild drought because rain and snow often occur in the northern NCP in winter (November to February), and evapotranspiration had a low value due to low temperatures and snow cover. In March and April, when winter wheat grows vigorously, the temperature rose slowly and a small amount of rainfall occurred; thus, severe drought was less likely to occur, and this was similar to Cheng’s results [44]. In the southern NCP, temperature and the frequency of precipitation were higher, so there was fewer severe or worse drought. However, with an increased time scale, reduced precipitation frequency and continuous evapotranspiration led to moderate drought in the northern NCP, and this was mainly driven by the rise in temperature [38]. In the southern and southwestern NCP, moderate drought phenomena were still detected at SPEI-6 and SPEI-9; this may be because snow rarely occurs in the south, and the average daily temperature stayed high for a long duration. Although the frequency of rain was higher than that in the north, rain was generally light (less than 10 mm during 24 h). Therefore, evapotranspiration was greater than rainfall, leading to the occurrence of moderate drought, Tirivarombo et al. [45] indicated that temperature played an important role in drought because it controlled evapotranspiration. Figure 3b supports this hypothesis to an extent, as drought frequency decreased more in the northern than in the southern NCP with an increased time scale. The drought was mainly mild or moderate during the winter wheat growth period, and the drought area decreased in the southern, west-central, southeastern, and northeastern NCP; field management strategies should be changed from drought to flood prevention. The risk of drought increased in the north-central, eastern, and northeastern NCP, and drought prevention should remain the main management decision. Thus, irrigation decisions should be made according to local conditions to ensure maximal irrigation efficiency.
A strong correlation existed between the SPEI and the SYRS, and the maximum correlation coefficient was concentrated from the seedling to the greening stage (October to February of the following year), which was similar to the results of Wang et al. [38] but different from those of Liu et al. [3]. Liu et al. [3] observed a strong correlation between the SPEI and the SYRS in the early growth stage of winter wheat, and the correlation reached its maximum during growth spurts. This difference may be caused by the different scales of the studies. Liu et al. [3] used the provincial level as the research scale, which ignored the spatial differences of crop environments and the fact that the phenology of winter wheat varies from the south to the north of the plain (by up to 1 month). Wang et al. [38] adopted stations as the research target, and the uniform distribution of stations explained the spatial differences to an extent. In addition, the optimal correlation coefficient of the SPEI and the SYRS in the NCP were positive and negative, which agreed with findings by Guo et al. [40] (irrigation was regarded as a precipitation event). This may be related to the distribution of rivers and irrigated areas in the study area (Figure 1c and Figure S1) [39] because continuous water deficit was the main cause of drought, and Lu et al. [32] proved that irrigation was an effective method to alleviate drought. Timely, effective irrigation can ensure the normal growth of crops even if drought occurs in these areas. Furthermore, appropriate drought was conducive to the growth of crops and even increased yield according to Fang et al. [46]. Previous studies have shown that climate had a lag effect on vegetation [47,48], while drought had a lag effect on winter wheat by about 3 months. In other words, soil water availability in the early stage was more important. Therefore, we suggest that irrigation decisions for drought should be made 3 months in advance.

5. Conclusions

This study used the SPEI as a drought index to discuss the spatiotemporal distribution characteristics of multiscale drought and its effect on winter wheat growth in the NCP. We observed that the NCP was dominated by mild drought at short-time scales and moderate drought at medium or long-time scales. Severe or worse drought rarely occurred in the NCP. Moderate drought often occurred in places with a low frequency of drought, whereas places with a high frequency of drought tended to have a low level of drought. The north-central, eastern, and northeastern NCP are becoming drier, while the risk of drought is decreasing in the southern, west-central, southeastern, and northwestern NCP. The strongest correlation between the SPEI and the SYRS was mainly negative in areas where the irrigation area was concentrated or in river basins. The strongest correlation between the SPEI and the SYRS was mainly positive elsewhere, and all correlation coefficients reached their maxima during the seedling to greening stages. The effects of drought on crops generally lagged by about 3 months and were most sensitive to short-term SPEI. Irrigation can alleviate the negative effects of drought to an extent and can ensure the normal growth of crops.

Supplementary Materials

The following supporting information can be downloaded at https://www.mdpi.com/article/10.3390/agronomy12051209/s1. Figure S1: Distribution of irrigated areas and rivers in the NCP (Yu et al. [39]).

Author Contributions

J.W.: Conceptualization, Methodology, Formal analysis, Writing—Original Draft. G.C.: Validation, Data Curation. H.S.: Visualization. N.W.: Resources. X.M.: Writing—Review and Editing, Funding acquisition. All authors have read and agreed to the published version of the manuscript.

Funding

This work was supported by the National Natural Science Foundation of China [grant numbers: 52179048].

Institutional Review Board Statement

Not applicable.

Informed Consent Statement

Not applicable.

Data Availability Statement

Meteorological data: China Meteorological Information Center (http://data.cma.cn/ (accessed on 30 June 2021)). Yield data: statistical yearbooks of each province (http://www.stats.gov.cn/ (accessed on 30 June 2021)). Remote sensing data: MOD09A1 were obtained from google earth engine (https://developers.google.com/earth-engine/datasets/catalog/MODIS_061_MOD09A1?hl=en (accessed on 30 June 2021)).

Conflicts of Interest

The authors declare no conflict of interest.

References

  1. Guo, M.; Li, J.; Wang, Y.; Long, Q.; Bai, P. Spatiotemporal Variations of Meteorological Droughts and the Assessments of Agricultural Drought Risk in a Typical Agricultural Province of China. Atmosphere 2019, 10, 542. [Google Scholar] [CrossRef] [Green Version]
  2. Zuo, D.; Cai, S.; Xu, Z.; Peng, D.; Kan, G.; Sun, W.; Pang, B.; Yang, H. Assessment of meteorological and agricultural droughts using in-situ observations and remote sensing data. Agric. Water Manag. 2019, 222, 125–138. [Google Scholar] [CrossRef]
  3. Liu, X.; Pan, Y.; Zhu, X.; Yang, T.; Bai, J.; Sun, Z. Drought evolution and its impact on the crop yield in the North China Plain. J. Hydrol. 2018, 564, 984–996. [Google Scholar] [CrossRef]
  4. Zhao, A.; Zhang, A.; Cao, S.; Liu, X.; Liu, J.; Cheng, D. Responses of vegetation productivity to multi-scale drought in Loess Plateau, China. CATENA 2018, 163, 165–171. [Google Scholar] [CrossRef]
  5. Lu, J.; Carbone, G.J.; Gao, P. Mapping the agricultural drought based on the long-term AVHRR NDVI and North American Regional Reanalysis (NARR) in the United States, 1981–2013. Appl. Geogr. 2019, 104, 10–20. [Google Scholar] [CrossRef]
  6. Kuang, B.; Lu, X.; Zhou, M.; Chen, D. Provincial cultivated land use efficiency in China: Empirical analysis based on the SBM-DEA model with carbon emissions considered. Technol. Forecast. Soc. Change 2020, 151, 119874. [Google Scholar] [CrossRef]
  7. Vicente-Serrano, S.M.; Gouveia, C.; Camarero, J.J.; Beguería, S.; Trigo, R.; Lopez-Moreno, J.I.; Azorin-Molina, C.; Pasho, E.; Lorenzo-Lacruz, J.; Revuelto, J.; et al. Response of vegetation to drought time-scales across global land biomes. Proc. Natl. Acad. Sci. USA 2013, 110, 52–57. [Google Scholar] [CrossRef] [Green Version]
  8. Potopová, V.; Trnka, M.; Hamouz, P.; Soukup, J.; Castraveț, T. Statistical modelling of drought-related yield losses using soil moisture-vegetation remote sensing and multiscalar indices in the south-eastern Europe. Agric. Water Manag. 2020, 236, 106168. [Google Scholar] [CrossRef]
  9. Xu, H.-J.; Wang, X.-P.; Zhao, C.-Y.; Zhang, X.-X. Responses of ecosystem water use efficiency to meteorological drought under different biomes and drought magnitudes in northern China. Agric. For. Meteorol. 2019, 278, 107660. [Google Scholar] [CrossRef]
  10. Ren, S.; Guo, B.; Wu, X.; Zhang, L.; Ji, M.; Wang, J. Winter wheat planted area monitoring and yield modeling using MODIS data in the Huang-Huai-Hai Plain, China. Comput. Electron. Agric. 2021, 182, 106049. [Google Scholar] [CrossRef]
  11. Zhou, Z.; Shi, H.; Fu, Q.; Li, T.; Gan, T.Y.; Liu, S. Assessing spatiotemporal characteristics of drought and its effects on climate-induced yield of maize in Northeast China. J. Hydrol. 2020, 588, 125097. [Google Scholar] [CrossRef]
  12. Mathobo, R.; Marais, D.; Steyn, M. The effect of drought stress on yield, leaf gaseous exchange and chlorophyll fluorescence of dry beans (Phaseolus vulgaris L.). Agric. Water Manag. 2017, 180, 118–125. [Google Scholar] [CrossRef] [Green Version]
  13. Wei, Y.; Jin, J.; Jiang, S.; Ning, S.; Liu, L. Quantitative Response of Soybean Development and Yield to Drought Stress during Different Growth Stages in the Huaibei Plain, China. Agronomy 2018, 8, 97. [Google Scholar] [CrossRef] [Green Version]
  14. Song, L.; Jin, J. Improving CERES-Maize for simulating maize growth and yield under water stress conditions. Eur. J. Agron. 2020, 117, 126072. [Google Scholar] [CrossRef]
  15. Berg, A.; Sheffield, J. Climate Change and Drought: The Soil Moisture Perspective. Curr. Clim. Chang. Rep. 2018, 4, 180–191. [Google Scholar] [CrossRef]
  16. Najafi, E.; Devineni, N.; Khanbilvardi, R.M.; Kogan, F. Understanding the Changes in Global Crop Yields Through Changes in Climate and Technology. Earth’s Futur. 2018, 6, 410–427. [Google Scholar] [CrossRef]
  17. Zuo, D.; Cai, S.; Xu, Z.; Li, F.; Sun, W.; Yang, X.; Kan, G.; Liu, P. Spatiotemporal patterns of drought at various time scales in Shandong Province of Eastern China. Arch. Meteorol. Geophys. Bioclimatol. Ser. B 2018, 131, 271–284. [Google Scholar] [CrossRef]
  18. Xu, B.; Arain, M.A.; Black, T.A.; Law, B.E.; Pastorello, G.Z.; Chu, H. Seasonal variability of forest sensitivity to heat and drought stresses: A synthesis based on carbon fluxes from North American forest ecosystems. Glob. Chang. Biol. 2020, 26, 901–918. [Google Scholar] [CrossRef] [Green Version]
  19. Bhatt, D.; Maskey, S.; Babel, M.S.; Uhlenbrook, S.; Prasad, K.C. Climate trends and impacts on crop production in the Koshi River basin of Nepal. Reg. Environ. Chang. 2014, 14, 1291–1301. [Google Scholar] [CrossRef] [Green Version]
  20. Bushra, N.; Rohli, R.V.; Lam, N.S.N.; Zou, L.; Bin Mostafiz, R.; Mihunov, V. The relationship between the Normalized Difference Vegetation Index and drought indices in the South Central United States. Nat. Hazards 2019, 96, 791–808. [Google Scholar] [CrossRef]
  21. Mavromatis, T. Drought index evaluation for assessing future wheat production in Greece. Int. J. Clim. 2007, 27, 911–924. [Google Scholar] [CrossRef]
  22. Vicente-Serrano, S.M.; Beguería, S.; López-Moreno, J.I. A Multiscalar Drought Index Sensitive to Global Warming: The Standardized Precipitation Evapotranspiration Index. J. Clim. 2010, 23, 1696–1718. [Google Scholar] [CrossRef] [Green Version]
  23. Lu, J.; Carbone, G.; Gao, P. Detrending crop yield data for spatial visualization of drought impacts in the United States, 1895–2014. Agric. For. Meteorol. 2017, 237–238, 196–208. [Google Scholar] [CrossRef]
  24. Leng, G.; Hall, J. Crop yield sensitivity of global major agricultural countries to droughts and the projected changes in the future. Sci. Total Environ. 2019, 654, 811–821. [Google Scholar] [CrossRef] [PubMed]
  25. Labudová, L.; Labuda, M.; Takáč, J. Comparison of SPI and SPEI applicability for drought impact assessment on crop production in the Danubian Lowland and the East Slovakian Lowland. Arch. Meteorol. Geophys. Bioclimatol. Ser. B 2017, 128, 491–506. [Google Scholar] [CrossRef]
  26. Tian, L.; Yuan, S.; Quiring, S.M. Evaluation of six indices for monitoring agricultural drought in the south-central United States. Agric. For. Meteorol. 2018, 249, 107–119. [Google Scholar] [CrossRef]
  27. Peña-Gallardo, M.; Vicente-Serrano, S.M.; Domínguez-Castro, F.; Beguería, S. The impact of drought on the productivity of two rainfed crops in Spain. Nat. Hazards Earth Syst. Sci. 2019, 19, 1215–1234. [Google Scholar] [CrossRef] [Green Version]
  28. Vicente-Serrano, S.M.; Beguería, S.; Lorenzo-Lacruz, J.; Camarero, J.J.; Lopez-Moreno, I.; Azorin-Molina, C.; Revuelto, J.; Morán-Tejeda, E.; Sanchez-Lorenzo, A. Performance of Drought Indices for Ecological, Agricultural, and Hydrological Applications. Earth Interact. 2012, 16, 1–27. [Google Scholar] [CrossRef] [Green Version]
  29. Hamal, K.; Sharma, S.; Khadka, N.; Haile, G.G.; Joshi, B.B.; Xu, T.; Dawadi, B. Assessment of drought impacts on crop yields across Nepal during 1987–2017. Meteorol. Appl. 2020, 27, e1950. [Google Scholar] [CrossRef]
  30. Prabnakorn, S.; Maskey, S.; Suryadi, F.X.; de Fraiture, C. Rice yield in response to climate trends and drought index in the Mun River Basin, Thailand. Sci. Total Environ. 2018, 621, 108–119. [Google Scholar] [CrossRef]
  31. Potopová, V.; Stepanek, P.; Možný, M.; Tűrkott, L.; Soukup, J. Performance of the standardised precipitation evapotranspiration index at various lags for agricultural drought risk assessment in the Czech Republic. Agric. For. Meteorol. 2015, 202, 26–38. [Google Scholar] [CrossRef]
  32. Lu, J.; Carbone, G.J.; Huang, X.; Lackstrom, K.; Gao, P. Mapping the sensitivity of agriculture to drought and estimating the effect of irrigation in the United States, 1950–2016. Agric. For. Meteorol. 2020, 292–293, 108124. [Google Scholar] [CrossRef]
  33. Potopová, V.; Boroneanţ, C.; Boincean, B.; Soukup, J. Impact of agricultural drought on main crop yields in the Republic of Moldova. Int. J. Clim. 2016, 36, 2063–2082. [Google Scholar] [CrossRef] [Green Version]
  34. Peña-Gallardo, M.; Vicente-Serrano, S.M.; Quiring, S.; Svoboda, M.; Hannaford, J.; Tomas-Burguera, M.; Martín-Hernández, N.; Domínguez-Castro, F.; Kenawy, A.E. Response of crop yield to different time-scales of drought in the United States: Spatio-temporal patterns and climatic and environmental drivers. Agric. For. Meteorol. 2019, 264, 40–55. [Google Scholar] [CrossRef] [Green Version]
  35. Yang, J.; Wu, J.; Liu, L.; Zhou, H.; Gong, A.; Han, X.; Zhao, W. Responses of Winter Wheat Yield to Drought in the North China Plain: Spatial–Temporal Patterns and Climatic Drivers. Water 2020, 12, 3094. [Google Scholar] [CrossRef]
  36. Xu, H.-J.; Wang, X.-P.; Zhao, C.-Y.; Yang, X.-M. Diverse responses of vegetation growth to meteorological drought across climate zones and land biomes in northern China from 1981 to 2014. Agric. For. Meteorol. 2018, 262, 1–13. [Google Scholar] [CrossRef]
  37. Liu, X.; Zhu, X.; Zhang, Q.; Yang, T.; Pan, Y.; Sun, P. A remote sensing and artificial neural network-based integrated agricultural drought index: Index development and applications. CATENA 2020, 186, 104394. [Google Scholar] [CrossRef]
  38. Wang, H.; Vicente-Serrano, S.M.; Tao, F.; Zhang, X.; Wang, P.; Zhang, C.; Chen, Y.; Zhu, D.; Kenawy, A.E. Monitoring winter wheat drought threat in Northern China using multiple climate-based drought indices and soil moisture during 2000–2013. Agric. For. Meteorol. 2016, 228–229, 1–12. [Google Scholar] [CrossRef]
  39. Yu, H.; Zhang, Q.; Sun, P.; Song, C. Impact of Droughts on Winter Wheat Yield in Different Growth Stages during 2001–2016 in Eastern China. Int. J. Disaster Risk Sci. 2018, 9, 376–391. [Google Scholar] [CrossRef] [Green Version]
  40. Guo, E.; Liu, X.; Zhang, J.; Wang, Y.; Wang, C.; Wang, R.; Li, D. Assessing spatiotemporal variation of drought and its impact on maize yield in Northeast China. J. Hydrol. 2017, 553, 231–247. [Google Scholar] [CrossRef]
  41. Tang, X.; Song, N.; Chen, Z.; Wang, J.; He, J. Estimating the potential yield and ETc of winter wheat across Huang-Huai-Hai Plain in the future with the modified DSSAT model. Sci. Rep. 2018, 8, 15370. [Google Scholar] [CrossRef] [PubMed] [Green Version]
  42. Kogan, F.N. Remote sensing of weather impacts on vegetation in non-homogeneous areas. Int. J. Remote Sens. 1990, 11, 1405–1419. [Google Scholar] [CrossRef]
  43. Madden, H.H. Comments on the Savitzky-Golay convolution method for least-squares-fit smoothing and differentiation of digital data. Anal. Chem. 1978, 50, 1383–1386. [Google Scholar] [CrossRef]
  44. Chen, X.; Li, Y.; Yao, N.; Liu, D.L.; Javed, T.; Liu, C.; Liu, F. Impacts of multi-timescale SPEI and SMDI variations on winter wheat yields. Agric. Syst. 2020, 185, 102955. [Google Scholar] [CrossRef]
  45. Tirivarombo, S.; Osupile, D.; Eliasson, P. Drought monitoring and analysis: Standardised Precipitation Evapotranspiration Index (SPEI) and Standardised Precipitation Index (SPI). Phys. Chem. Earth Parts A/B/C 2018, 106, 1–10. [Google Scholar] [CrossRef]
  46. Fang, Y.; Du, Y.; Wang, J.; Wu, A.; Qiao, S.; Xu, B.; Zhang, S.; Siddique, K.; Chen, Y. Moderate Drought Stress Affected Root Growth and Grain Yield in Old, Modern and Newly Released Cultivars of Winter Wheat. Front. Plant Sci. 2017, 8, 672. [Google Scholar] [CrossRef] [PubMed] [Green Version]
  47. Wang, S.S.; Mo, X.G.; Liu, Z.J.; Baig, M.H.A.; Chi, W.F. Understanding long-term (1982–2013) patterns and trends in winter wheat spring green-up date over the North China Plain. Int. J. Appl. Earth Obs. 2017, 57, 235–244. [Google Scholar] [CrossRef]
  48. Wu, D.H.; Zhao, X.; Liang, S.L.; Zhou, T.; Huang, K.C.; Tang, B.J.; Zhao, W.Q. Time-lag effects of global vegetation responses to climate change. Glob. Change Biol. 2015, 21, 3520–3531. [Google Scholar] [CrossRef]
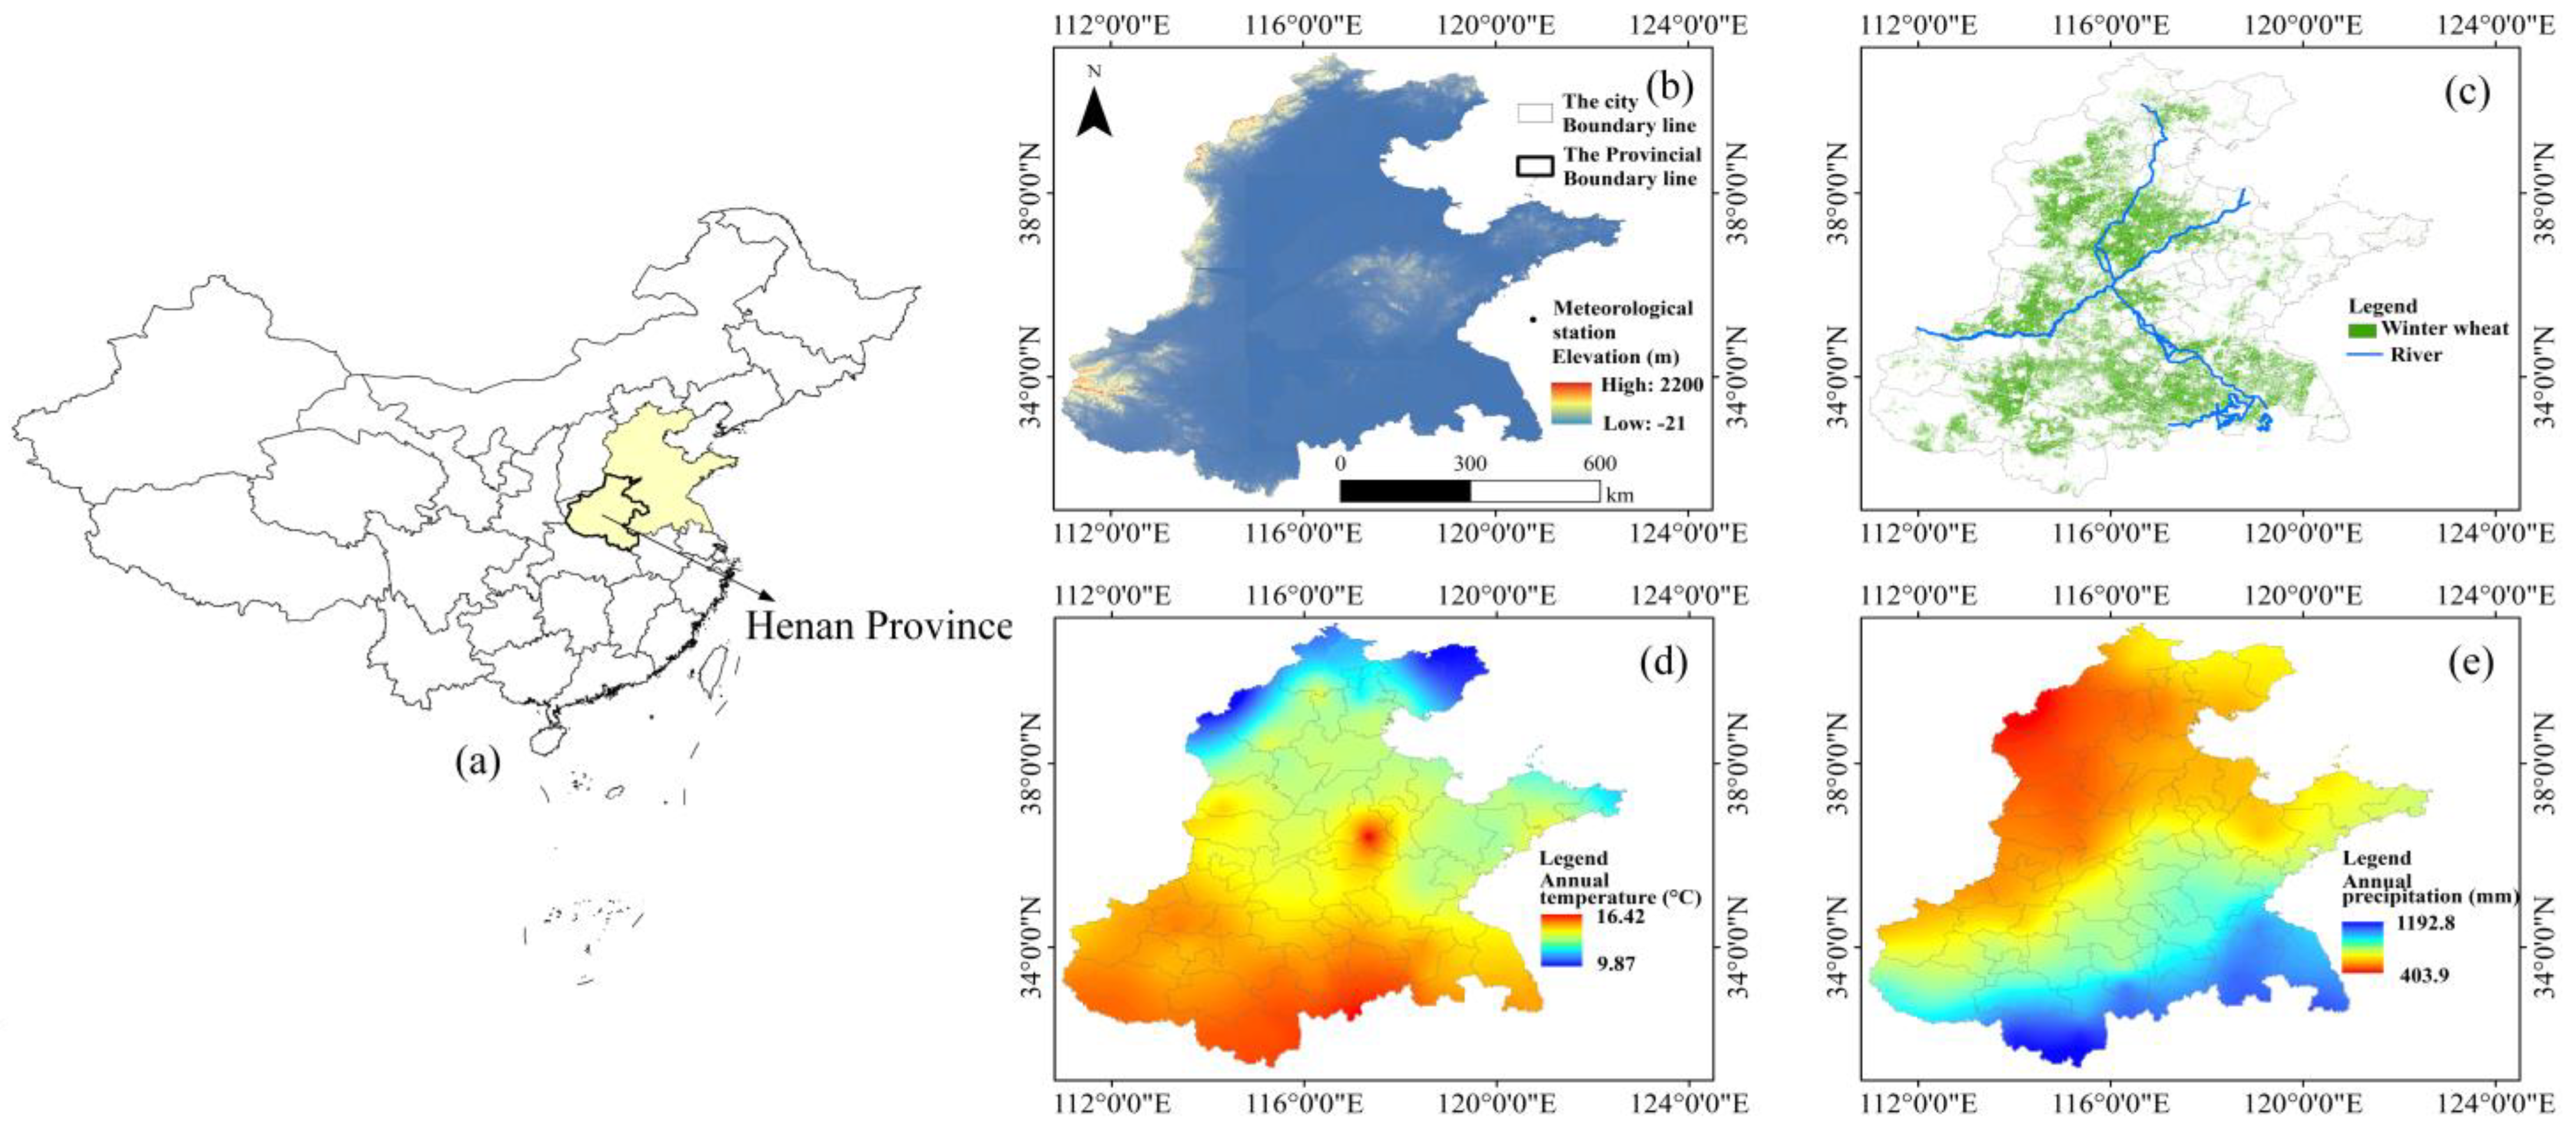
Figure 1. (a) Study area. (b) Distribution of meteorological stations. (c) Winter wheat planting areas and rivers. (d) Average daily temperature. (e) Average annual precipitation.
Agronomy 12 01209 g001
Figure 2. Methodological framework of this paper.
Agronomy 12 01209 g002
Figure 3. (a1a4) Mean SPEI values. (b1b4) Frequency of drought. (c1c4) Spatial distribution trend of the SPEI during winter wheat growth in the NCP from 2001 to 2015 at 1, 3, 6, and 9 months, respectively.
Agronomy 12 01209 g003
Figure 4. Frequency of different drought levels during winter wheat growth in the NCP from 2001 to 2015 if drought occurred at (a) 1, (b) 3, (c) 6, or (d) 9 months.
Agronomy 12 01209 g004
Figure 5. (a) Spatial distribution of the optimal correlation coefficient between the SPEI and the SYRS in 55 cities in the NCP. (b) Month and time scales corresponding to the maximum correlation coefficient, based on (a).
Agronomy 12 01209 g005
Figure 6. The optimal correlation coefficients of 55 cities were (a) negative or (b) positive for the SYRS distribution corresponding to different drought levels.
Agronomy 12 01209 g006
Figure 7. Spatial distribution of the mean correlation coefficients of the SPEI and SYRS in 55 cities during winter wheat growth in the NCP from 2001 to 2015.
Agronomy 12 01209 g007
Figure 8. VCI and SPEI during winter wheat growth in Henan Province from 2001 to 2015 at (a) 1, (b) 3, (c) 6, and (d) 9 months.
Agronomy 12 01209 g008
Figure 9. Correlation between VCI and SPEI during winter wheat growth in Henan Province from 2001 to 2015 at (a) 1, (b) 3, (c) 6, and (d) 9 months.
Agronomy 12 01209 g009
Table 1. Classifications of the SPEI and SYRS.
SPEI ValuesCategorySYRS ValuesCategory
2.0 Extreme wet 1.5 High yield increment
1.5–2.0Severe wet1.0–1.5Moderate yield increment
1.0–1.5Moderate wet0.5–1.0Low yield increment
0.5–1.0Mild wet−0.5–0.5Normal
−0.5–0.5Normal−1–−0.5Low yield losses
−1–−0.5Mild drought−1.5–−1Moderate yield losses
−1.5–−1Moderate drought 1.5 High yield losses
−2–−1.5Severe drought
2.0 Extreme drought
Publisher’s Note: MDPI stays neutral with regard to jurisdictional claims in published maps and institutional affiliations.