Article

A Technological Approach to Support Extensive Livestock Management in the Portuguese Montado Ecosystem

1
MED—Mediterranean Institute for Agriculture, Environment and Development and CHANGE—Global Change and Sustainability Institute, Institute for Advanced Studies and Research, Universidade de Évora, Pólo da Mitra, Ap. 94, 7006-554 Évora, Portugal
2
Escuela de Ingenierías Agrarias, Universidad de Extremadura, Avenida Adolfo Suárez, S/N, 06007 Badajoz, Spain
3
Departamento de Expresión Gráfica, Escuela de Ingenierías Industriales, Universidad de Extremadura, Avenida de Elvas, S/N, 06006 Badajoz, Spain
4
AgroInsider Lda., 7005-841 Évora, Portugal
*
Author to whom correspondence should be addressed.
Agronomy 2022, 12(5), 1212; https://doi.org/10.3390/agronomy12051212
Submission received: 7 April 2022 / Revised: 13 May 2022 / Accepted: 16 May 2022 / Published: 18 May 2022

Abstract

:
Extensive livestock production systems based on improved pastures under Montado of Holm oaks represent an approach in line with the challenges of sustainability and biodiversity. The increasing incorporation of technologies in the monitoring of this ecosystem allows for a better knowledge of the spatial and temporal variability and, consequently, a more economically profitable management. In this study, between July 2020 and June 2021, soil and pastures were monitored in a 20 ha Montado area located in Alentejo (Southern Portugal) and used for extensive grazing of cattle. The survey of soil apparent electrical conductivity (ECa), the application of algorithms for definition of homogeneous management zones (HMZ), the use of indices obtained from satellite imagery time series to characterize the evolution of pasture quality and the soil and pasture sampling, including the identification of bio-indicator botanical species, were the basis of this exploratory study, allowing a holistic approach to this complex soil-pasture-trees and animals ecosystem. In the near future, this knowledge could represent an important milestone in providing decision-making support systems to farm managers in terms of smart sampling, differential application of fertilizers, amendments or seeds, choosing the best spacing and density of trees in this ecosystem, promoting dynamic grazing, or identifying the animal feed supplementation needs in the critical periods of the year.

Graphical Abstract

1. Introduction

Precision agriculture (PA) is one of the pillars of the agriculture. Its application today assumes a decisive role in several crops and production systems. In Portugal, irrigated crops (namely vine or corn), with attractive gross margins, are the main recipients of technological developments and applications [1,2]. Until about a decade ago, the incorporation of PA technologies in extensive livestock production systems, based on improved pastures under Montado of Holm oaks, was low [3]. However, awareness of the high potential of extensive ecosystem services, in line with the challenges of sustainability and biodiversity, associated with the significant area they occupy on the edge of the Mediterranean region, has led to an increase in the incorporation of technologies for monitoring this complex ecosystem [4].
Montado is a Mediterranean agro-silvo-pastoral ecosystem, where soil, trees and pastures provide not only food, but also the necessary environment for the welfare of grazing animals [4]. Pastures and grasslands also make this ecosystem more resilient to environmental changes by preventing soil erosion and regularizing water regimes, particularly in semiarid regions [5]. Soil genesis, the presence of trees, the livestock grazing and the interaction with seasonality and inter-annual variability of the Mediterranean climate, are factors that determine a marked spatial variability [6]. A better knowledge of the soil and pasture spatial and temporal variability will allow more economically viable management [7]. These challenges and opportunities require the use of tools for expeditious monitoring of the soil apparent electrical conductivity, normally through electromagnetic induction sensors (for example, “EM38” or “DUALEM”) or contact sensors (for example, “VERIS”), mounted on mobile platforms (typically off-road vehicles), that allow a dense sampling at low cost [8].
Temporal stability of the soil apparent electrical conductivity [9,10] and the strong correlation with other temporal stable soil properties that determine crop productivity (namely texture; [8,11], establish the basis for the implementation of PA cycle, which can be provided as a service by small commercial enterprises, whose number is increasing daily [12]. The identification of areas with similar characteristics (Homogeneous Management Zones, HMZ) and similar production potential [13] from variables identified in the literature such as elevation, ECa or soil texture [9] is the first step towards PA, and the optimization of the application rates of production factors, such as fertilizers, amendments, or seeds [13]. In this second step, equipment with variable rate technology (VRT) are used, ensuring the implementation of georeferenced prescription maps that consider the variability of soil nutrient availability based on a small number of samples (smart sampling; [9,14]). The closing of the PA cycle through VRT strategies results in environmental and economic benefits by decreasing input application in the less-productive areas [15].
Knowledge of on-site and on-time information about soil properties and pasture biomass and its spatial distribution in pastoral ecosystems is needed for site-specific management and can help livestock managers, for example in terms of VRT fertilizer application [16]. Another aspect that determines the profitability of extensive animal production is related to dynamic management of grazing variables. According to Teague et al. [17], there are four factors that can be manipulated to achieve the desired management goals in rangelands: stocking rate, grazing season, livestock distribution, and frequency of grazing. These variables have impact on the availability and quality of pasture and, therefore, on the calculation of feed supplementation needs [18]. However, the vicious cycle of low profit margins leading to low investments, determines the little existing knowledge about the relationship between dynamic grazing and the response of pasture in extensive ecosystems (namely in beef cattle production).
In livestock production systems it is difficult to quantify the spatial variability of biomass production and quality since forage is usually harvested by animals [3]. Therefore, the use of yield maps or similar approaches is scarce in pasture systems [10], requiring in this case the exhaustive collection of pasture samples, their laboratory processing, and subsequent extrapolation and treatment for productivity maps [19]. An emerging possibility is indirect measurement of plant growth through vegetation indices [11]. In recent years, some studies have been carried out to evaluate the potential of NDVI (Normalized Difference Vegetation Index) or NDWI (Normalized Difference Water Index), obtained from satellite images (Sentinel-2), as low-cost tools, high temporal resolution (5 days) and acceptable spatial resolution (10 m × 10 m or 20 m × 20 m) to monitor pasture development (productivity) and vigor (quality) throughout the vegetative cycle [18,20,21,22,23,24]. NDVI could be used to support grazing management decisions, to manage animal nutrition, through paddock change, feed supplementation and, also, identify early warning indicators of poor animal performance [18]. Some limitations due to the presence of clouds or the existence of trees can be overcome with the complementary use of proximal sensors, for example capacitance probes (“Grassmaster II” or Grassmaster Pro”; [25,26]) for biomass estimation, or optical sensors (“OptRx”) for crude protein or fiber estimation [27].
In this ecosystem, it is also essential to assess the quality of the pasture in terms of biodiversity, evolution of the number of botanical species and families present, or the identification of species that are bio-indicators of areas (for example, areas under or outside tree canopy, areas of greater or lesser soil fertility, or areas with more or less intensive grazing) [28] or of management strategies The structure and composition of plant communities, and consequently the chemical composition of forages, are affected by the selective feeding of livestock, by stocking rate and grazing seasons [29]. Simultaneously, livestock grazing behavior responds to the phenological period of pasture vegetation as a result of variations in herbage mass, forage quality, and daylight duration [29]. This response in biodiverse pastures, of grasses, legumes, composites, and other species, which is the case of the Montado ecosystem pastures, is differential due to the inter-specific differences in the morphological root systems, habitat requirements or development rhythms [30].
The objective of this work was to demonstrate the potential of some PA technologies to monitor soil or pasture in extensive livestock production systems and support grazing management decisions, contributing to a holistic approach to the maintenance of Montado Mediterranean ecosystem.

2. Materials and Methods

Figure 1 is a graphical representation of the experimental approach proposed in this study. The marked seasonality and inter-annual irregularity of temperature and precipitation in the Montado Mediterranean ecosystem has as unpredictable effect on the pattern of pasture vegetative cycle. Therefore, PA technologies, proximal and remote sensing, are used to monitor soil and pasture in this extensive livestock production system and support management decisions.

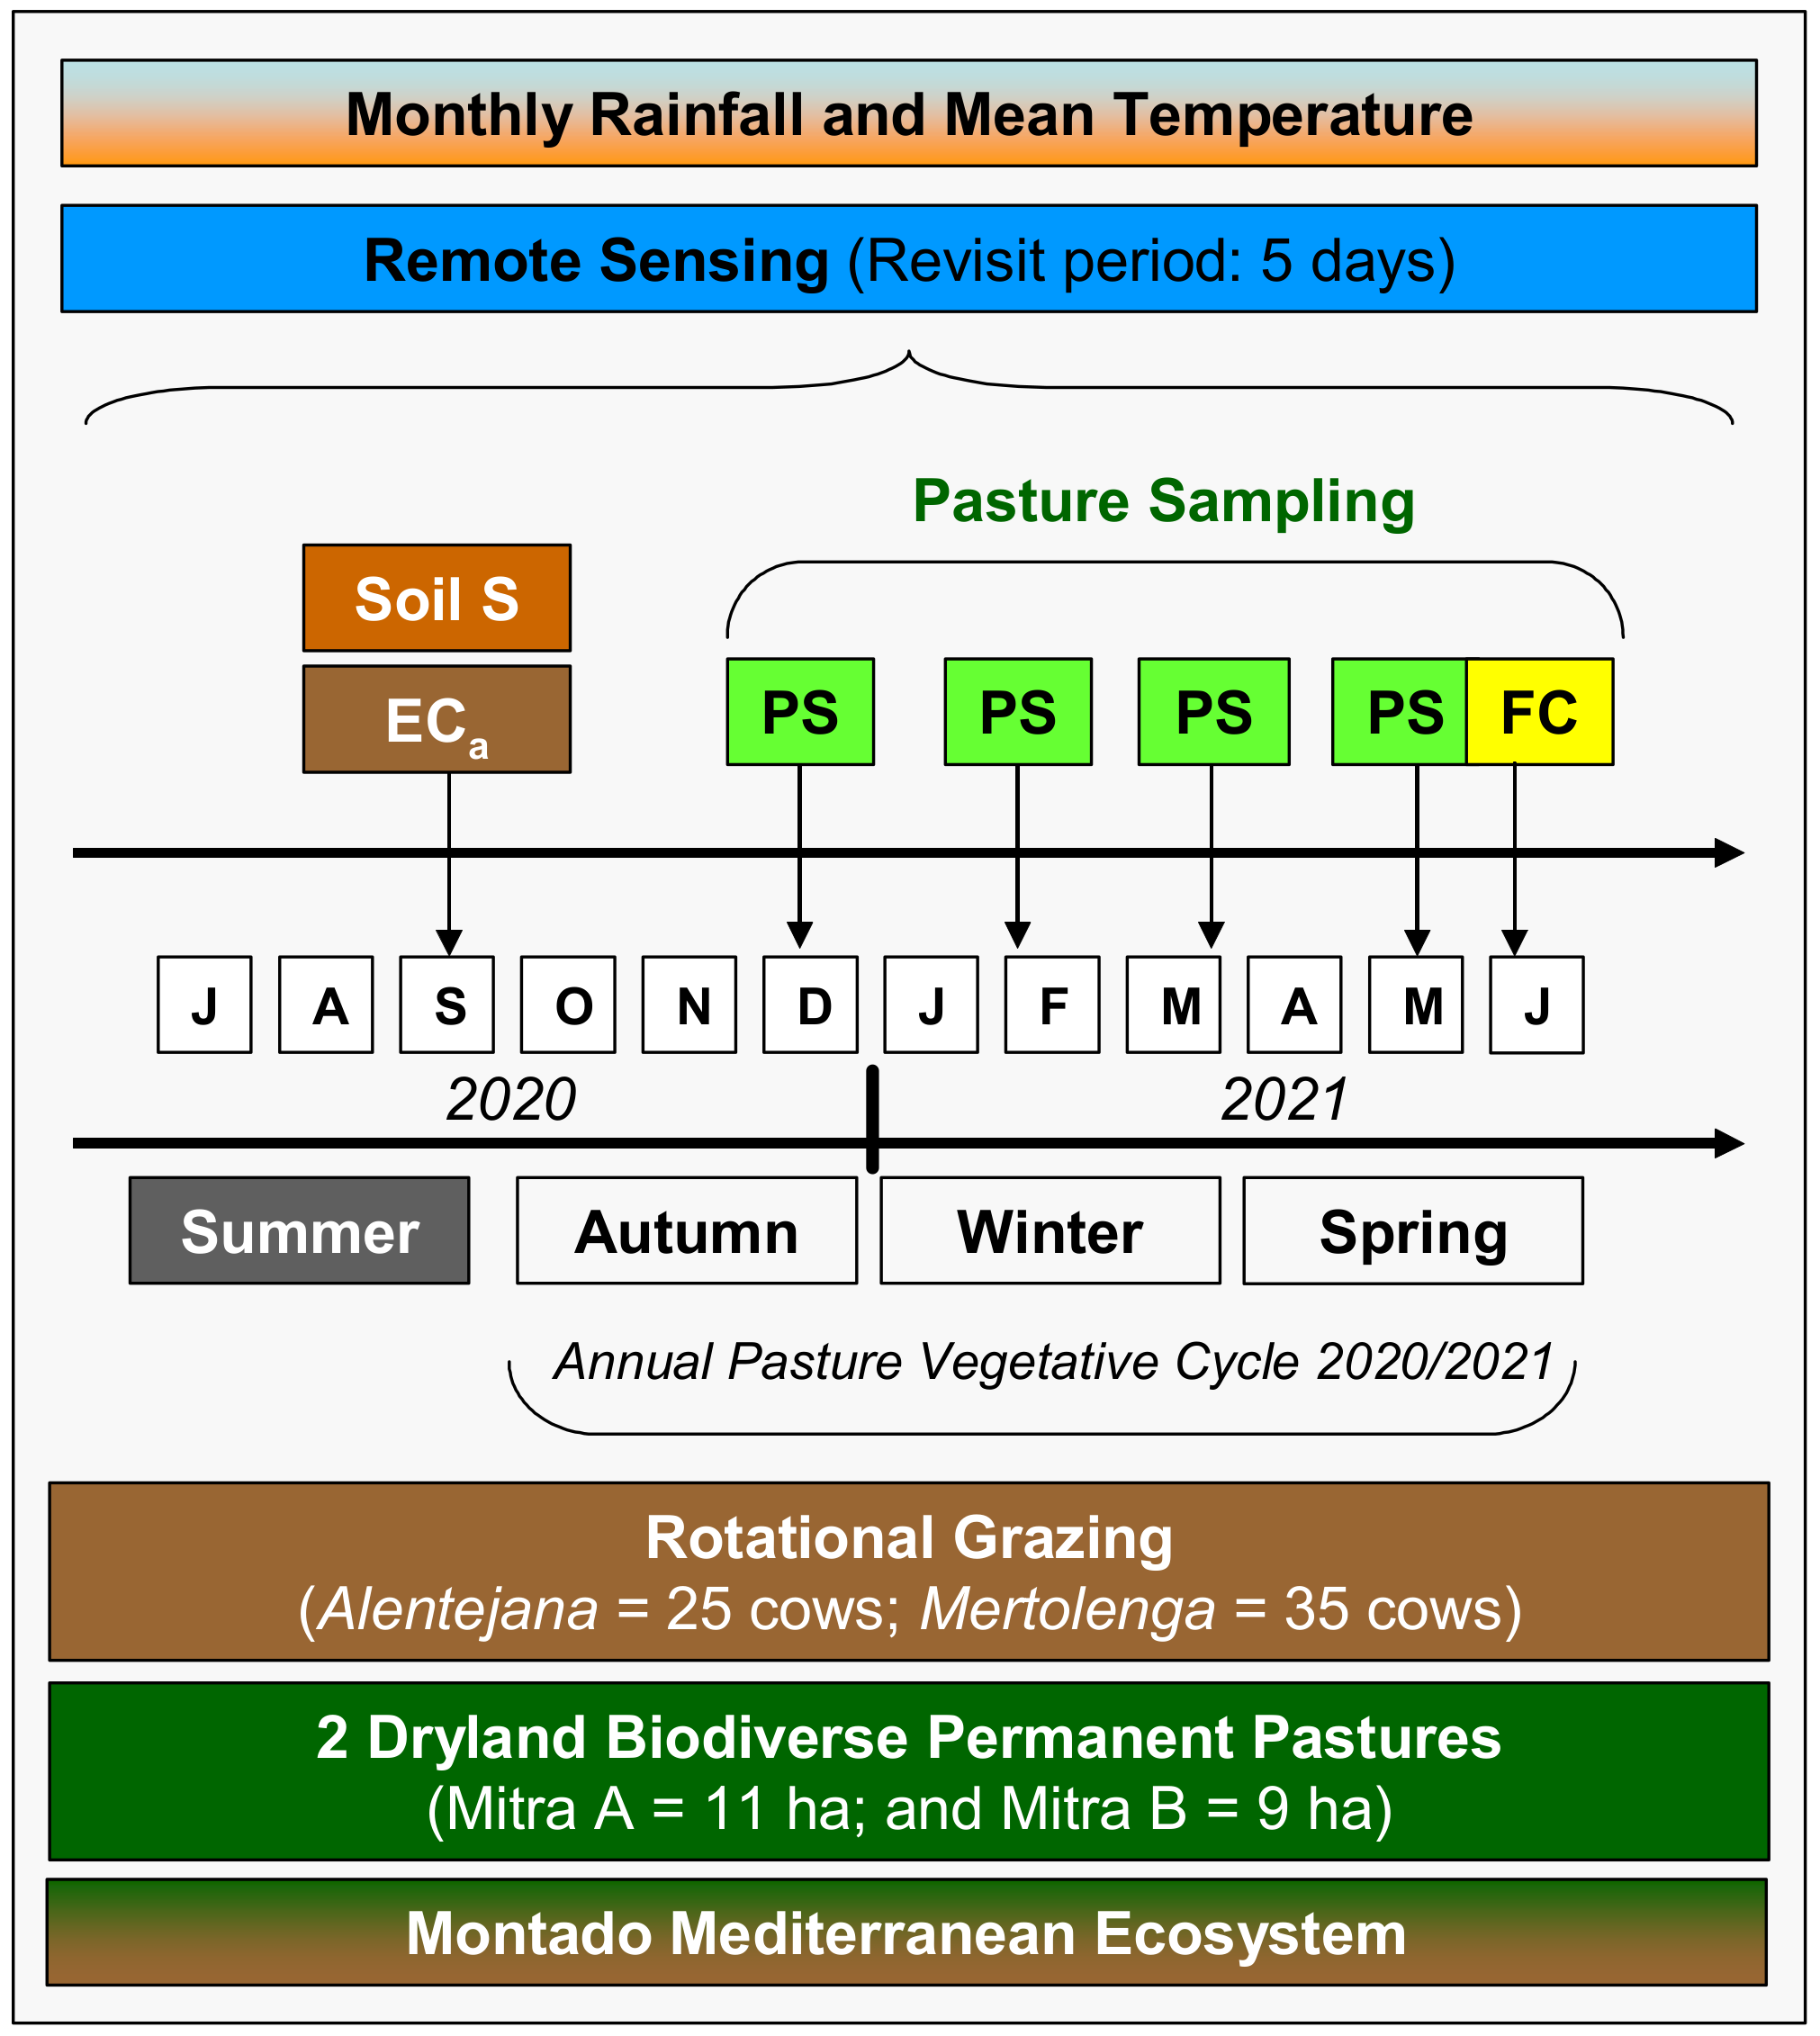
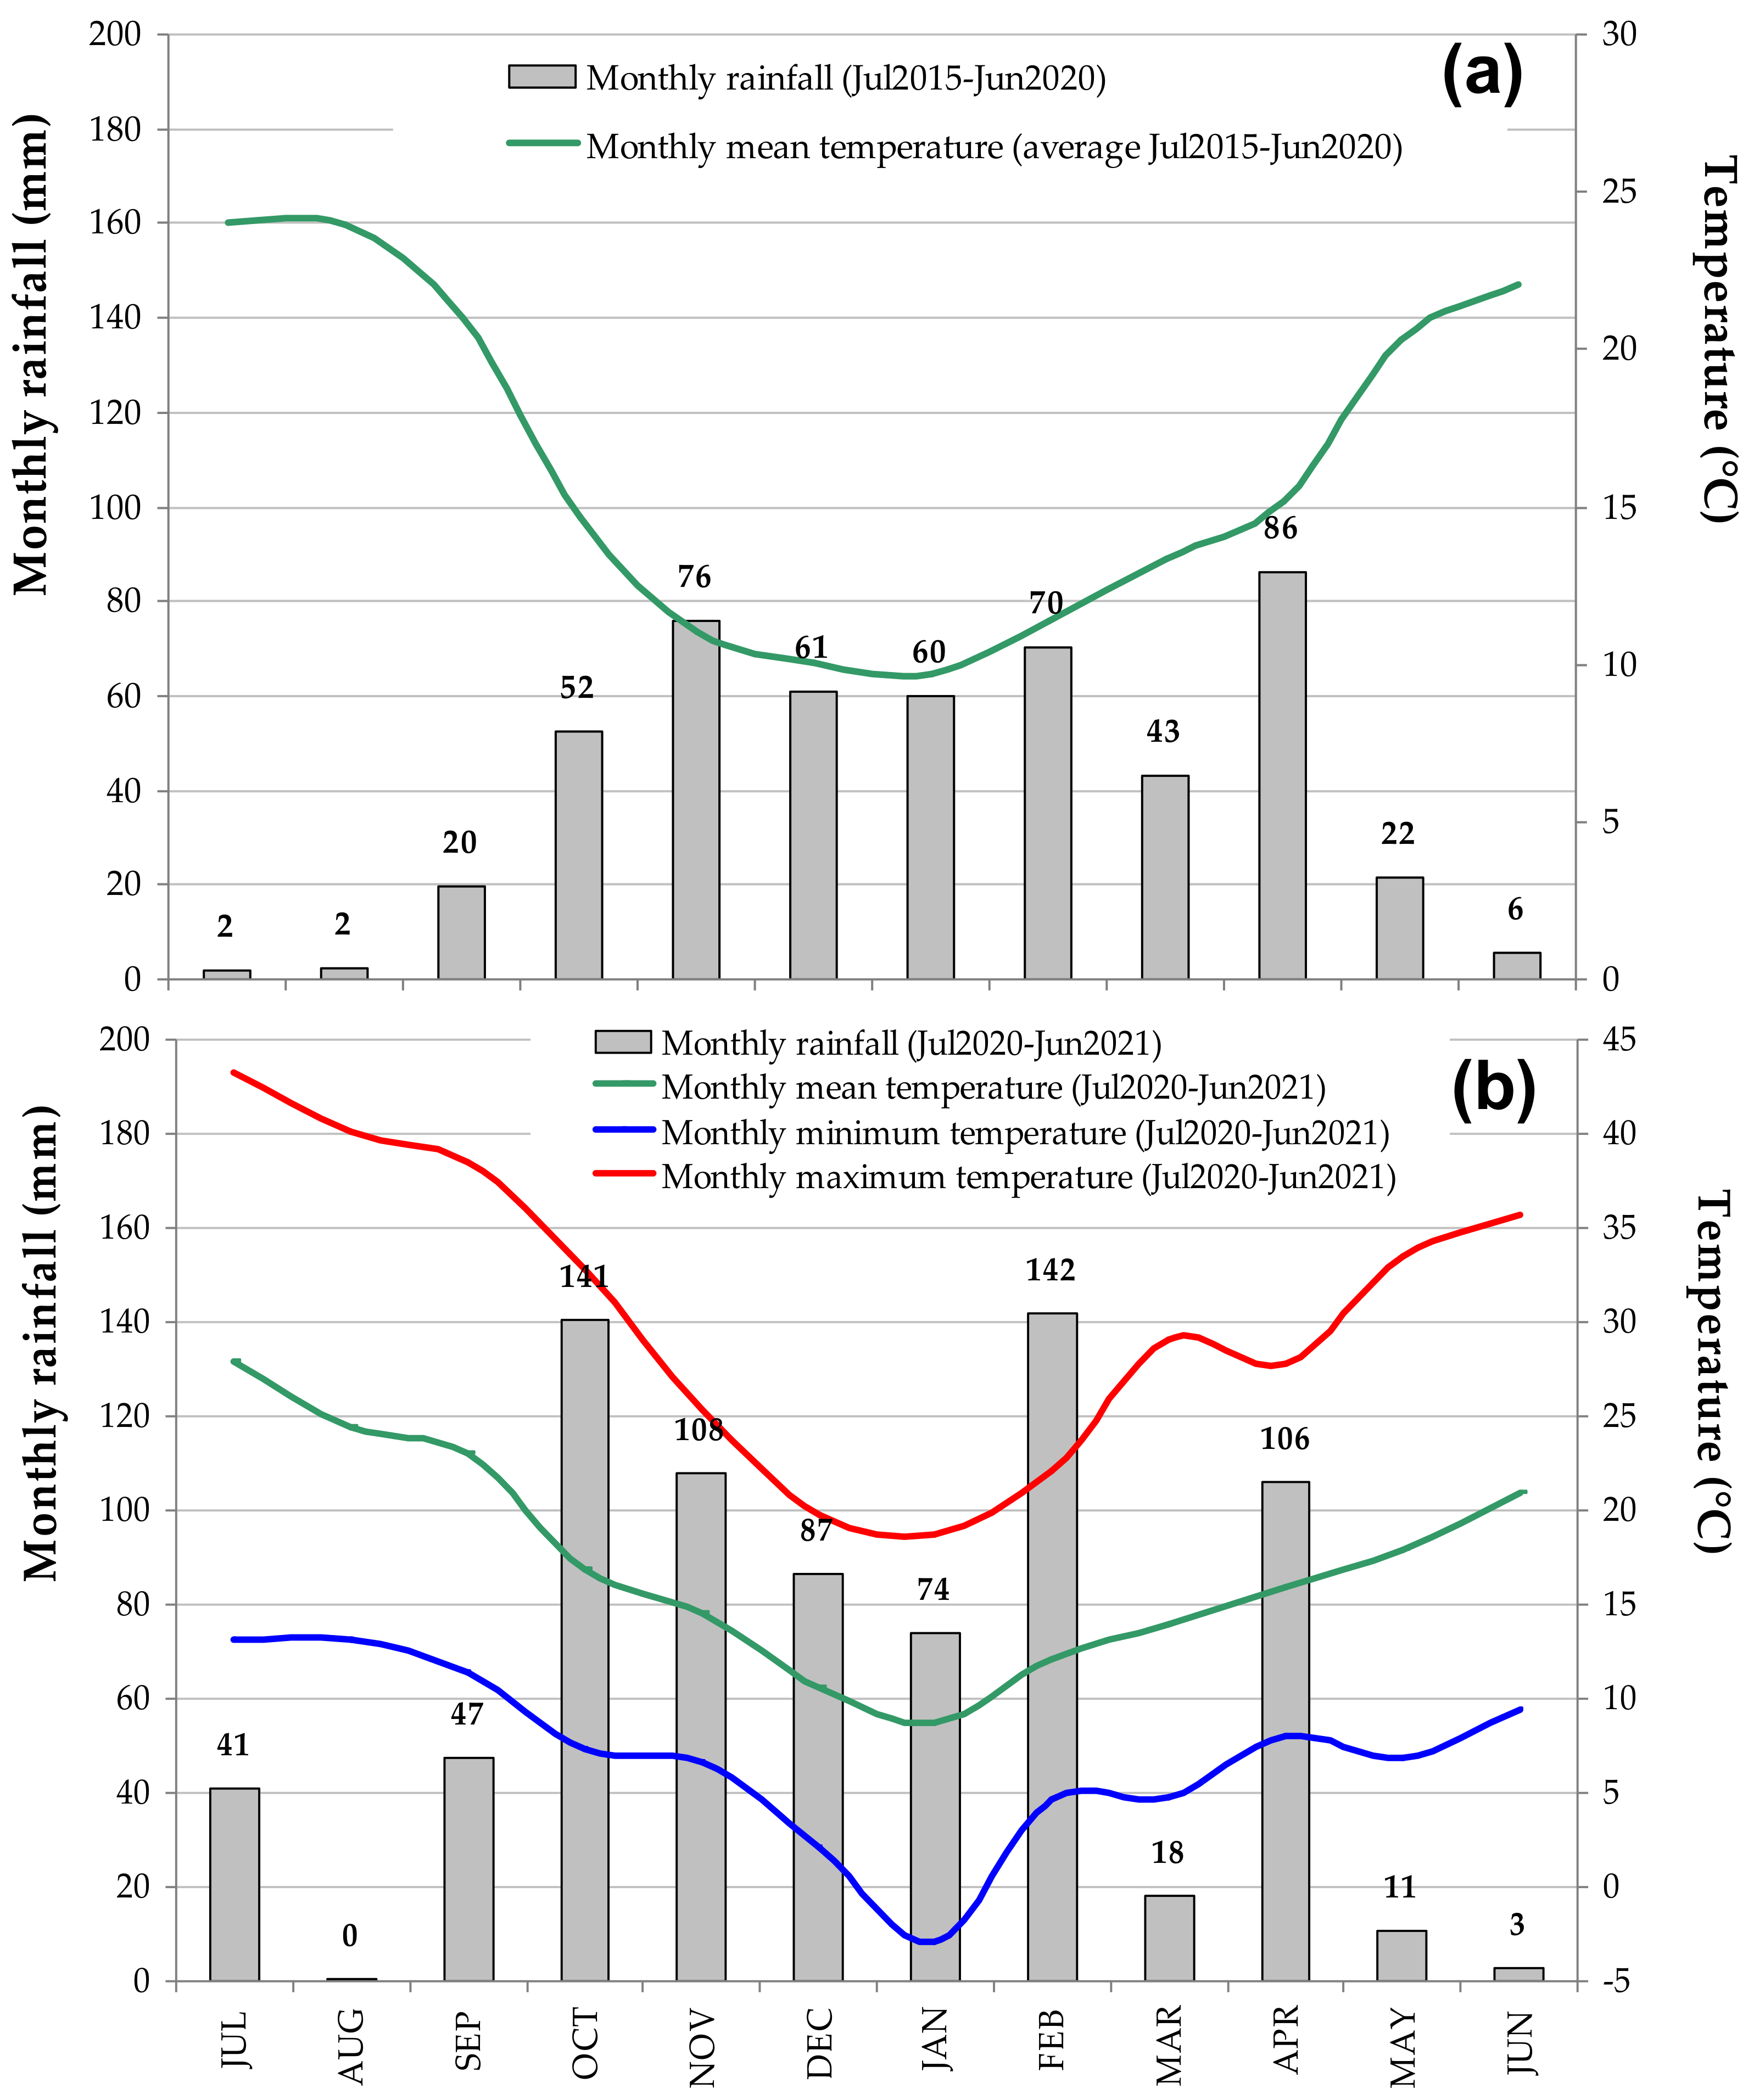
2.1. Site Description

The experimental field of the study (“MIT”) is located at the Montado region of southern Portugal (coordinates 38°32′10″ N; 7°59′80″ W; Figure 2) and is composed of two paddocks (A and B) with 100 ha of total area (56.7 ha + 43.3 ha, respectively), of which 20 ha were monitored (11 ha in “Field A” and 9 ha in “Filed B”). In each field 12 sampling points were georeferenced (24 in the total), half in areas without trees (sampling Sentinel-2 pixels “10 m × 10 m”, outside tree canopy, OTC) and half under tree canopy (UTC; area of canopy projection). This field of Quercus ilex ssp. rotundifolia Lam., with a density of approximately 8–10 trees ha−1, has been cultivated for more than 30 years with bio-diverse permanent pastures (grasses, legumes, and others) and used for extensive cattle grazing. The dominating soil type is Cambisol with a granite origin [31], characterized by slight or moderate weathering of parent material and by absence of appreciable quantities of illuviated clay and organic matter. These acid Cambisols are not very fertile and are mainly used for mixed agro-silvo-pastoral systems.
The climate of this area is Mediterranean. According to the Köppen-Geiger classification, it is a climate type Csa [32]. Temperature ranges between 0 °C, minimum in winter, and more than 40 °C, maximum in summer. Mean annual precipitation is less than 600 mm, mainly concentrated between October and April and practically non-existent during the summer, but its inter-annual variability is very high [4]. Figure 3 illustrates the average thermo-pluviometric diagram of the Évora meteorological station (monthly rainfall, monthly minimum, mean and maximum temperature) in a five-year period, between July 2015 and June 2020 (a), and in the year of this study, between July 2020 and June 2021 (b). In the five-years period the mean temperature fluctuated between 9 °C (January) and 24 °C (July), while in the year under study (2020/2021) the mean temperature showed greater amplitude (8 °C in January and 28 °C in July). In terms of the accumulated annual rainfall, the year 2020/2021 can be considered a "wet year" (778 mm) when compared to the average of the previous five-years (500 mm), in either case with a significant concentration in the months between October and April (representing 82% of the total in the five-year period and 87% in the year 2020/2021).

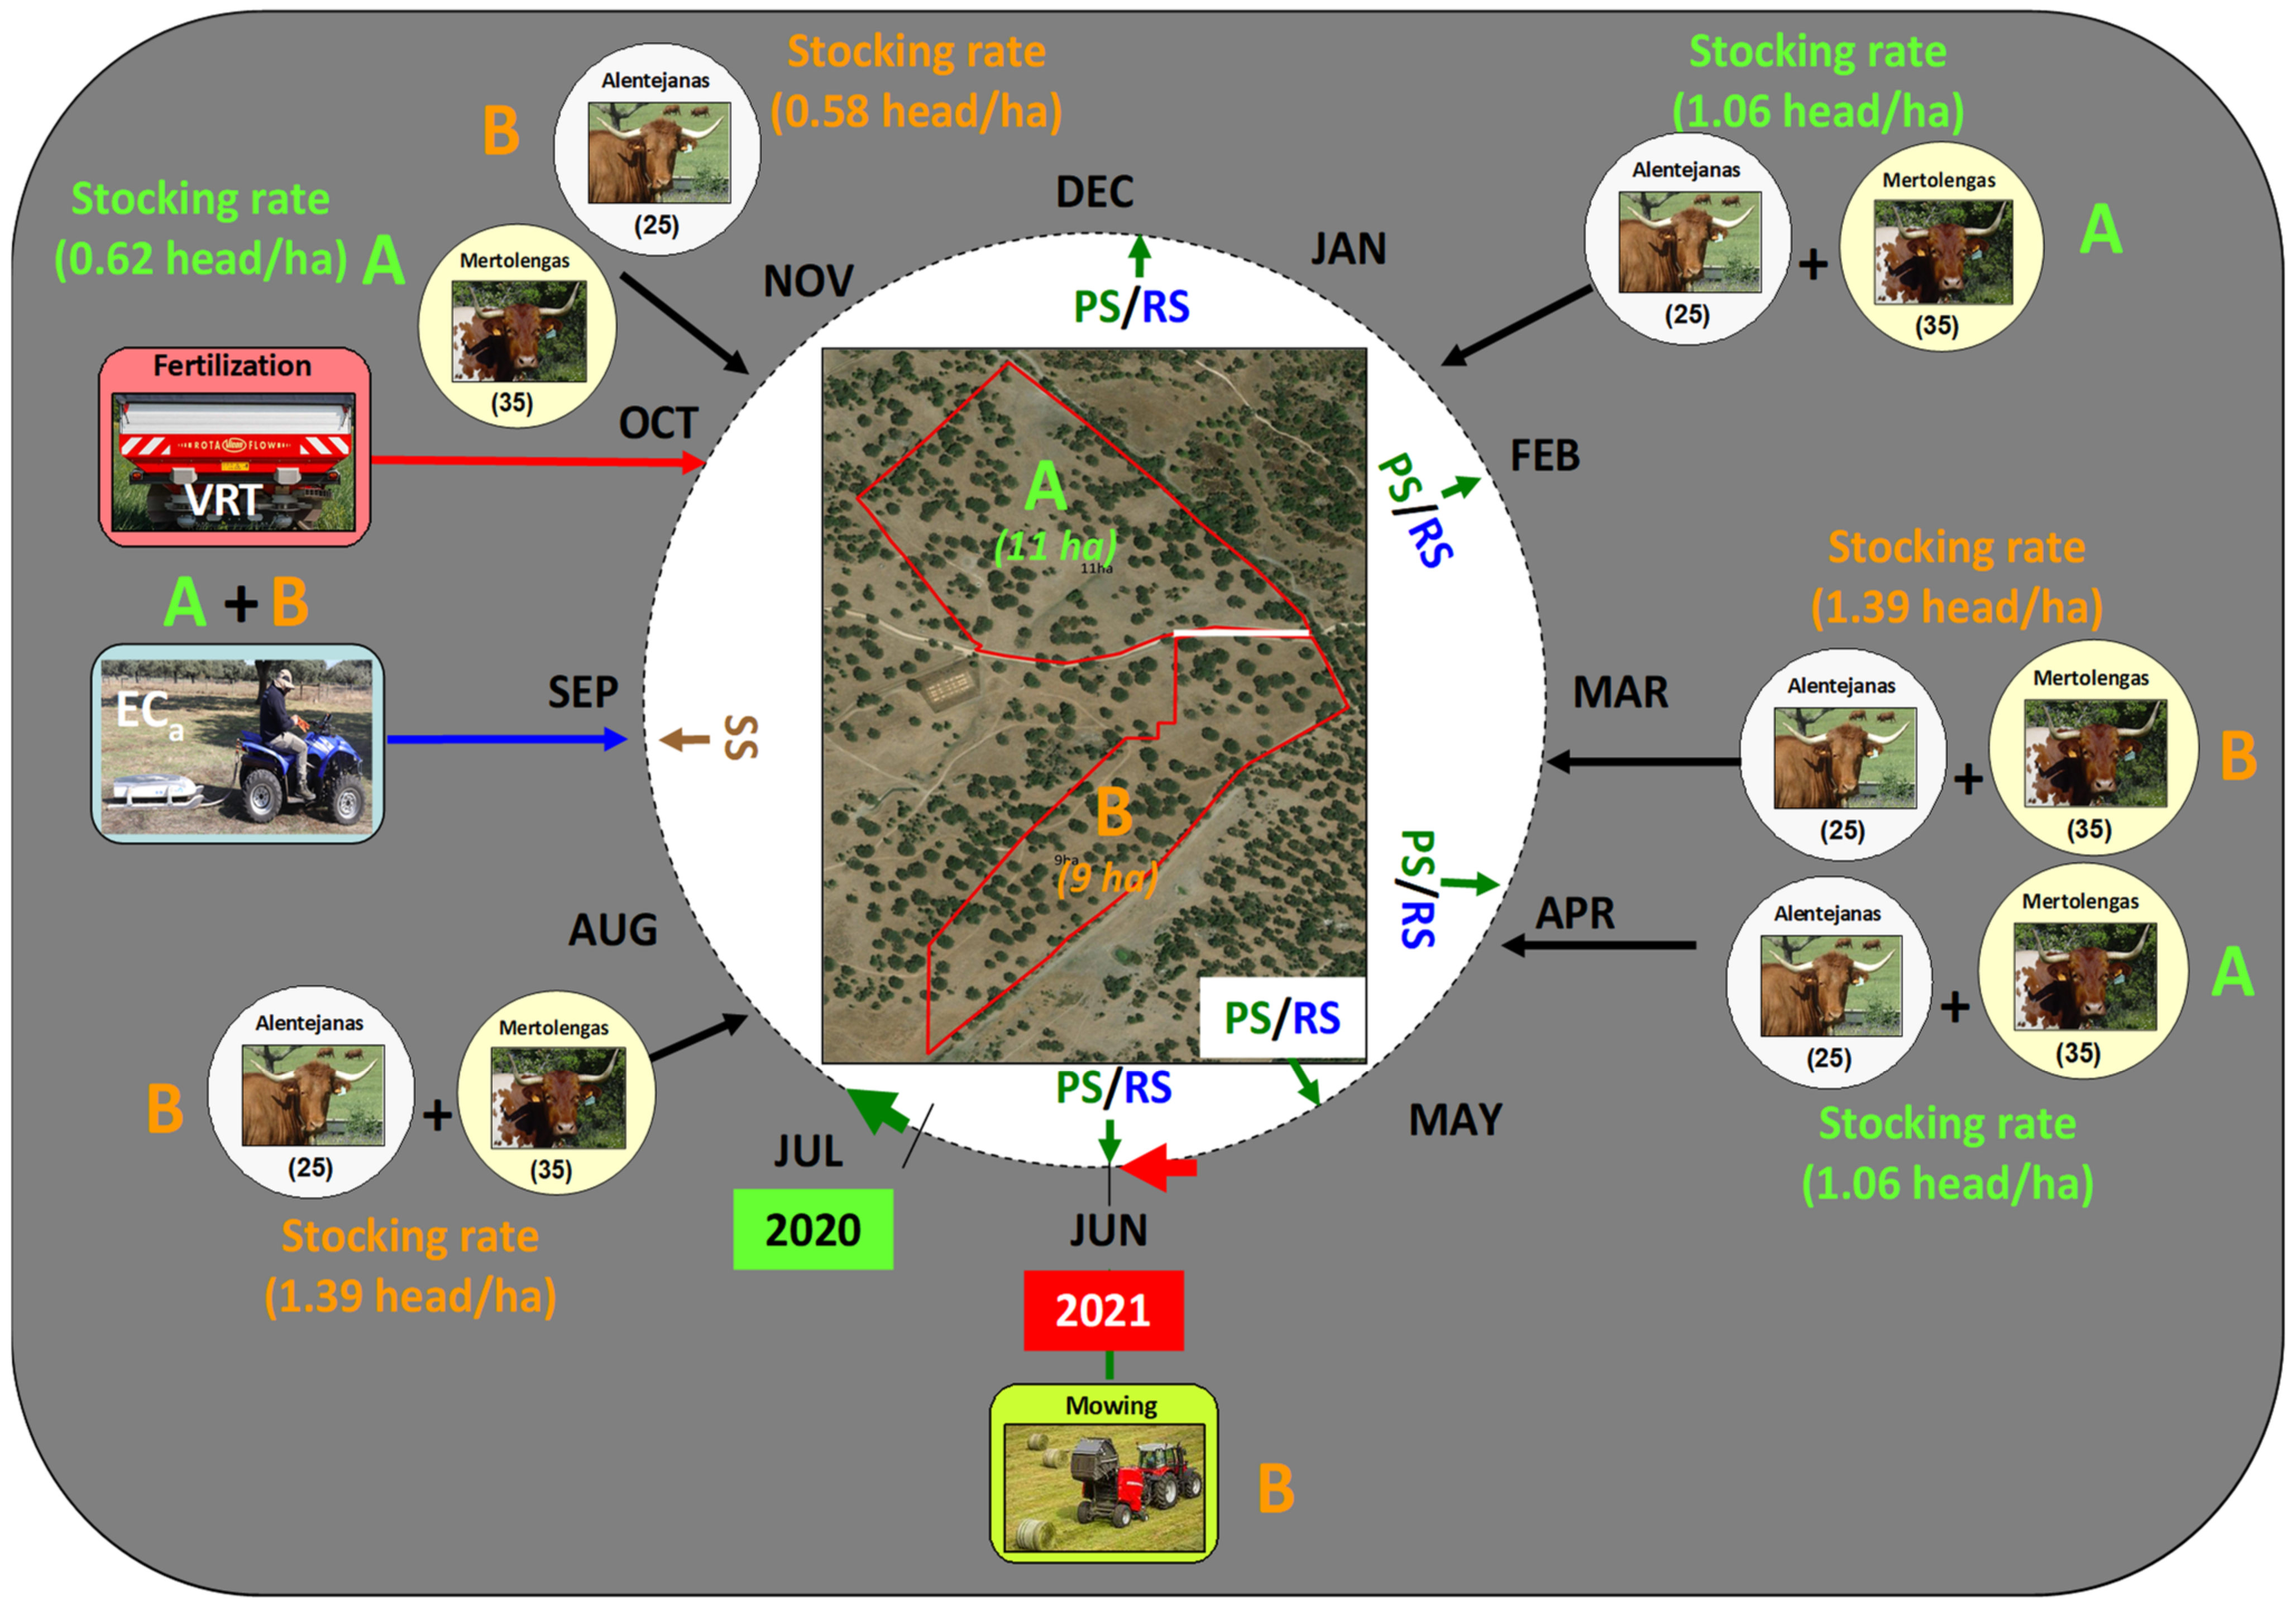
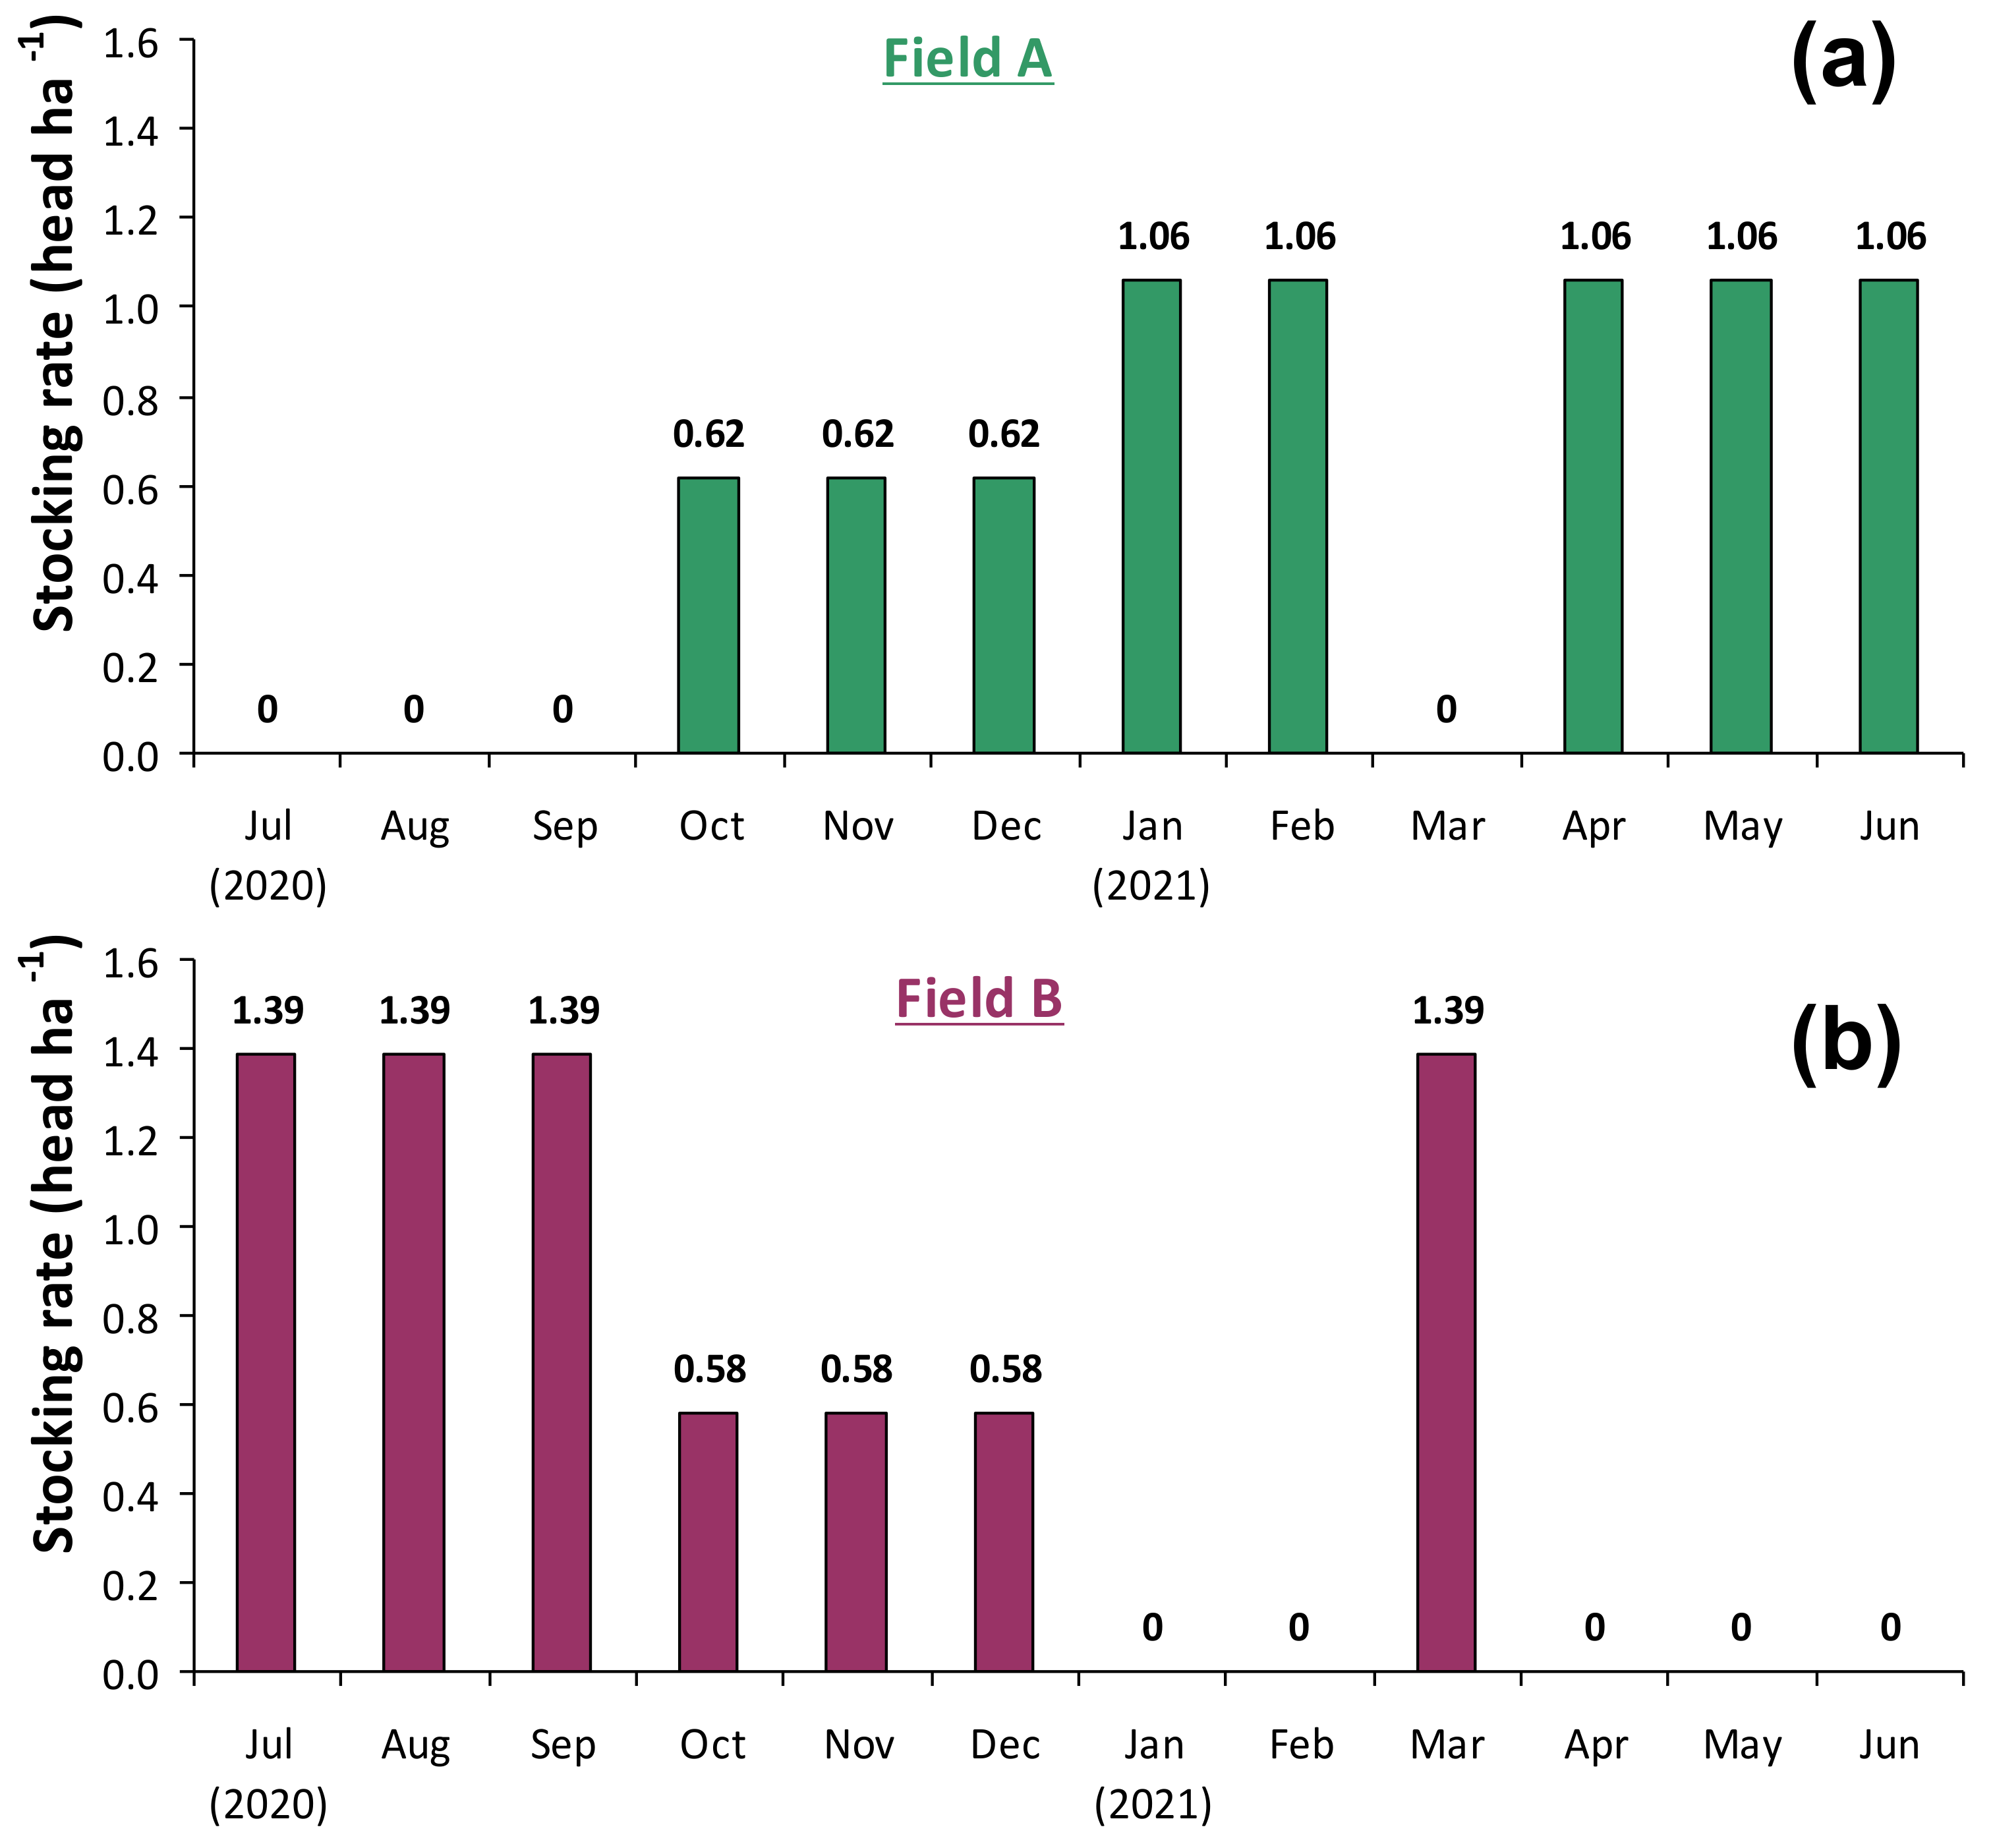
2.2. Field Management

Pastures of the two above mentioned fields (with 100 ha of total area) are the basis of the diet of about 60 adult cows of the “Alentejana” (25 animals) and “Mertolenga” (35 animals) breeds in extensive grazing. Mean stocking rate was 0.6 animals ha−1. However, throughout the year, grazing is rotational, with different objectives for each field: while “Field A” area provides pasture fundamentally for in-situ grazing, the green matter of “Field B” area is accumulated for cutting (mowing) and conservation, to be distributed to animals in the periods of greatest need, especially in summer. Figure 4 shows the scheme followed in grazing management in these two fields between July 2020 and June 2021. The sampling areas in these fields (11 ha in “Field A” and 9 ha in “Field B”) were subjected to soil apparent electrical conductivity (ECa) and topographic surveys at the end of September 2020, accompanied by soil sampling (SS). At the end of October 2020, a phosphate fertilizer (“Bio 0-25-0”) was applied with variable application technology (VRT). Throughout the pasture vegetative cycle, on five dates between December 2020 and June 2021, pasture samples (PS) were collected to determine pasture productivity and quality. Between May and June 2021, a pasture floristic composition survey (FC) of each sampling area was carried out. Temporal series of NDVI and NDWI obtained from satellite images (Sentinel-2) were also collected (RS) throughout the pasture vegetative cycle. Figure 5 shows the evolution of the stocking rate in each experimental field (A and B) between December 2020 and June 2021.

2.3. Soil Apparent Electrical Conductivity (ECa) and Topographic Measurements: Data Processing

Soil apparent electrical conductivity (ECa) survey was carried out with a “EM38” device (Geonics Ltd., Mississauga, ON, Canada). In this study the data referring to the topsoil 0-0.375 m were used. The sensor was mounted on a metal-free sledge, pulled behind an all-terrain vehicle equipped with a GNSS receiver and conducted according to the protocol described by Serrano et al. [12].
Estimating ECa at unsampled locations was carried out with the ordinary point kriging method. This produced rigged maps showing the spatial distribution of ECa in the experimental field based on the estimated values. Although there are many algorithms that can be used for interpolation, the advantages of using geostatistical techniques [33], are well recognized, considering the spatial variation of the studied variable, ECa in this case. The geostatistical analyses were carried out with the extension Geostatistical Analyst of ArcGIS Desktop software (v10.5, ESRI, Inc., Redlands, CA, USA) and the rigged map of ECa was produced with the ArcMap module of ArcGIS software.
Digital elevation model surface was generated using the triangulated irregular network (TIN) interpolation tool from the ArcGIS. The TIN algorithm uses sample points to create a surface formed by triangles based on nearest neighbor point information. Then, the vector layers were converted into grid surfaces with the Spatial Analyst Tools of ArcGIS.

2.4. Soil Sampling and Laboratory Reference Analysis

For characterization of the topsoil (0–0.30 m depth), simultaneously with the ECa survey (September 2020), 24 composite and georeferenced soil samples were collected in the experimental field using a gouge auger and a hammer. Each composite sample was the result of the combination of five sub-samples collected in sampling areas (OTC and UTC) (Figure 2). These soil samples were inserted in plastic bags and transported to the “MED- Soil Analysis Laboratory” at Évora University. The soil samples were analyzed for particle-size distribution (texture: sand, silt, and clay content) according to the standard protocols [34].

2.5. Pasture Sampling and Laboratory Reference Analysis

Pasture sampling in each experimental field was carried out at the same 24 sampling areas of soil sampling (Figure 2). In each of these areas, composite pasture samples were collected at five different times throughout the growth cycle (i.e., between December 2020 and June 2021 (Table 1)). The collected pasture samples were transported to the MED-Animal Nutrition and Metabolism Laboratory at the University of Évora for standard analysis of wet chemistry according to the Association of Official Analytical Chemists [35]. Once in the laboratory, the pasture samples were weighed immediately to obtain fresh mass (Biomass, in kg ha−1). After dehydrated (72 h at 65 °C) pasture samples were weighted again in order to obtain dry matter (DM, in kg ha−1) and pasture moisture content (PMC, %). The dehydrated samples were analyzed in order to determine the content of crude protein (CP; in % of DM) and fiber (NDF; in % of DM). Also, the CP in kg ha−1 was calculated as the product of DM (in kg ha−1) by CP (in %). On the last date (2 June 2021), due to logistical difficulties, only four composite samples were collected, two in each experimental field (A and B), one representative of UTC areas and other representative of OTC areas.

2.6. Evaluation of Pasture Floristic Composition

During the pasture flowering period of the 2020/2021 vegetative cycle (May/June 2021), a floristic inventory of species (FC) present in each sampling area was carried out visually by an expert in conservation biology based on the phytosociological method of Braun-Blanquet [36]. In each sampling area (1.0 m2), the percentage of coverage by each species was recorded (plant species composition and abundance) [37]. Plant nomenclature follows the New Flora of Portugal [38]. With the field data, pasture biodiversity was evaluated through the richness (describing the number of different species present) and total covered surface (TCS) and a comparative analysis of the alpha diversity of each treatment was carried out.

2.7. Vegetation Multispectral Measurements

Sentinel-2 optical images (freely available from the European Space Agency, ESA), were used through the electronic platform “http://agromap.agroinsider360.com (accessed on 6 April 2022)” from the “AgroInsider” enterprise (a spin-off from the University of Évora). For this work, Sentinel-2 band 4 (B4; 10 m spatial resolution; 665 nm), band 8 (B8; 10 m spatial resolution; 842 nm), band 8A (B8A; 20 m spatial resolution; 865 nm) and band 11 (B11; 20 m spatial resolution; 1610 nm), atmospherically corrected imagery, were extracted from Copernicus data hub and used to calculate NDVI (Equation (1)) and NDWI (Equation (2)). Images were processed with open-source ORG/GDAL Python libraries. This data was obtained for the 12 geo-referenced pixels (OTC areas of Figure 2). The spatial resolution of NDVI and NDWI is 10m. However, the latter is obtained through bilinear interpolation and resampling from the original 20m bands. In order to make the reconstruction of NDVI and NDWI trends, time series NDVI and NDWI records spanning between July 2020 and June 2021 were retrieved. A preliminary processing was carried out on these records to remove outliers due to the presence of clouds. Only the images without presence of clouds were used in the analysis.
NDVI = B 8 B 4 B 8 + B 4
NDWI = B 8 A B 11 B 8 A + B 11

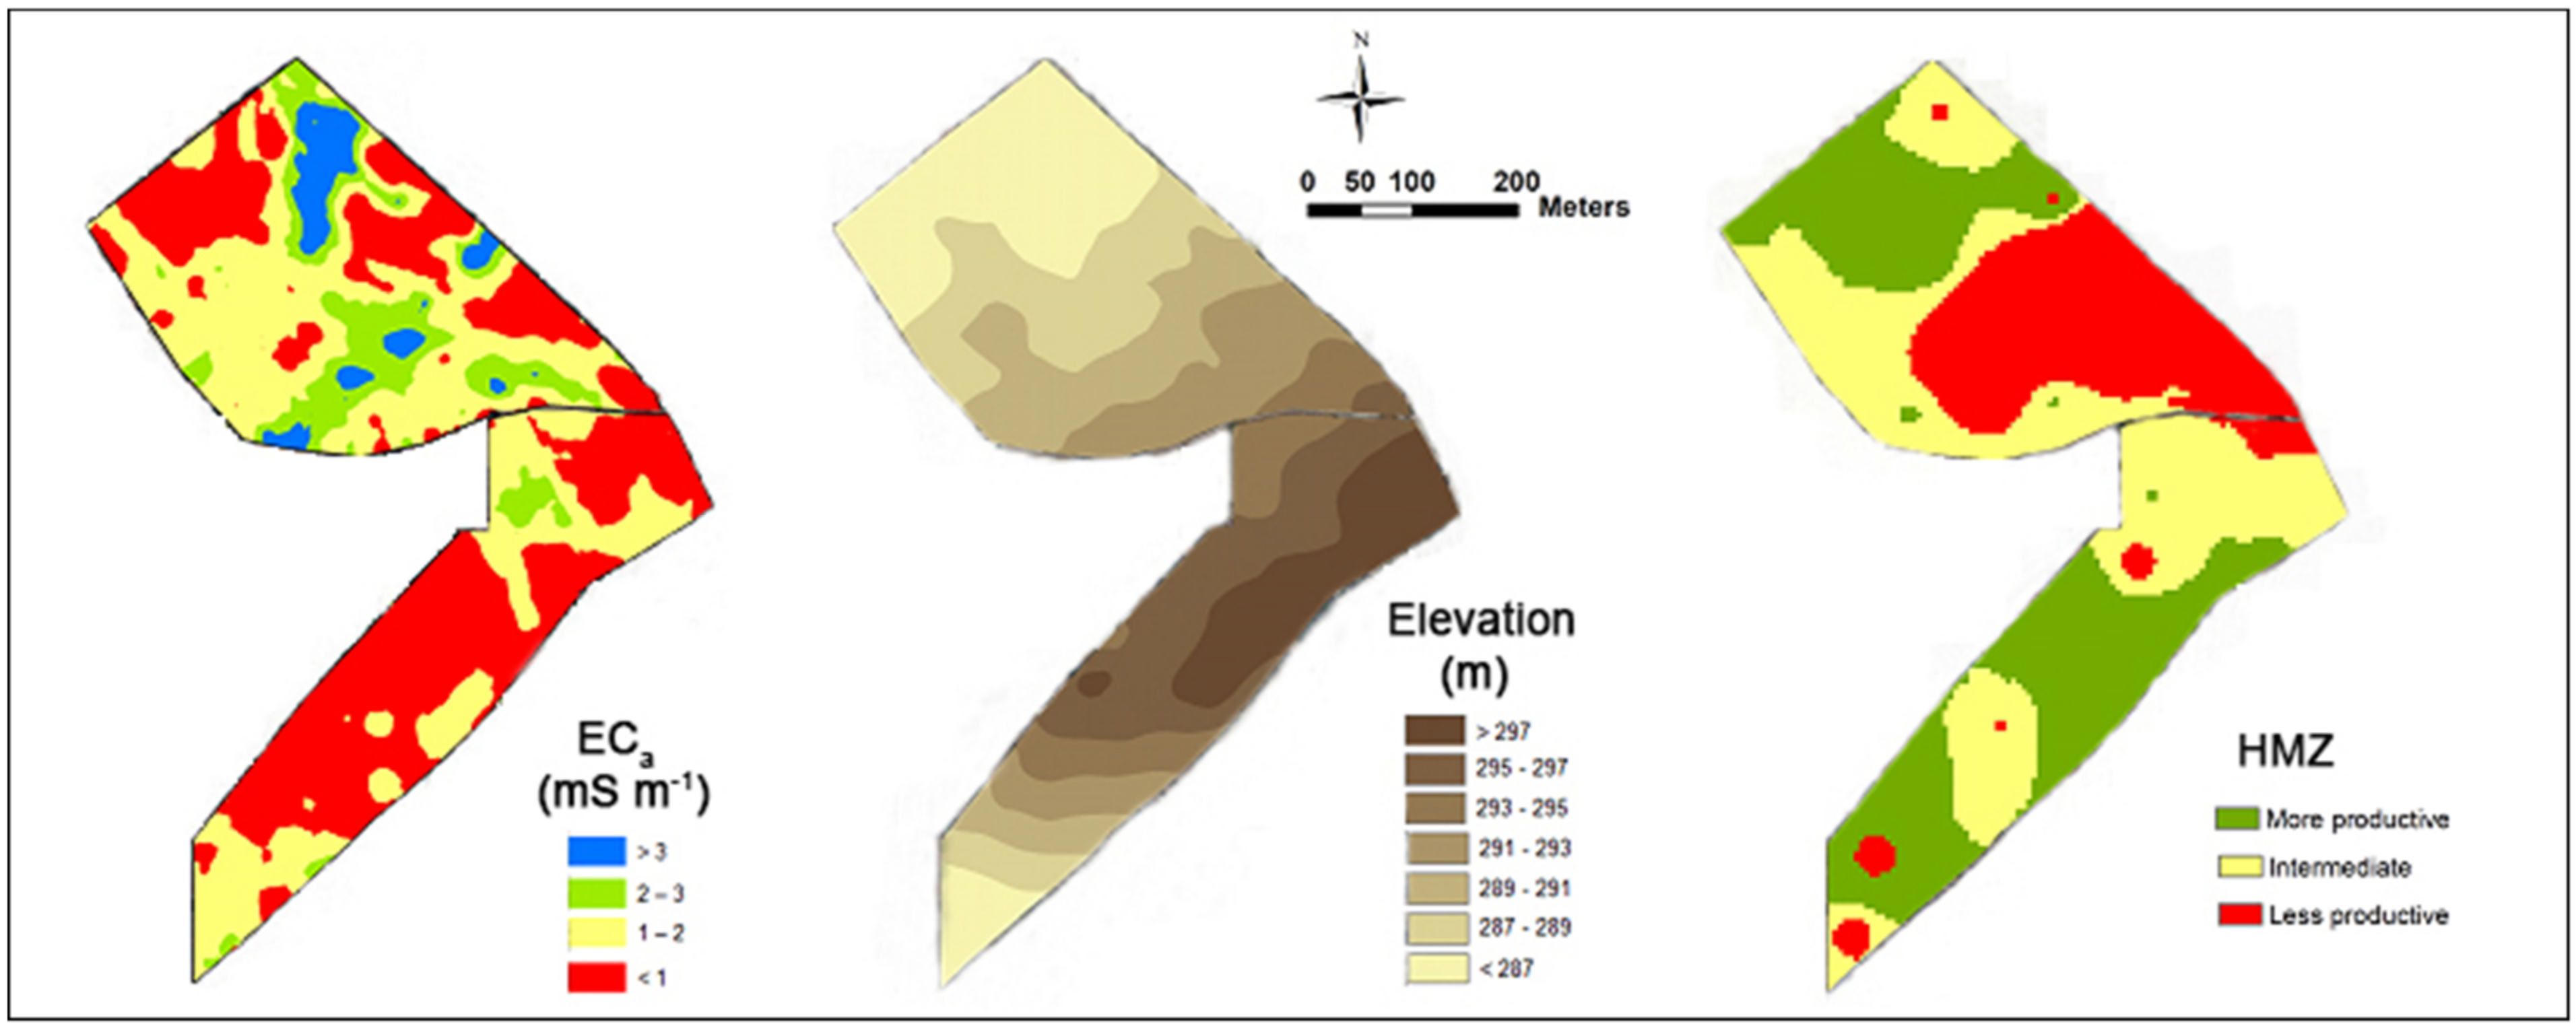
2.8. Definition and Validation of Homogeneous Management Zones (HMZ)

After obtaining the ECa map, homogeneous zones were delimited using a classification technique in ArcGIS. Since topography is an important factor that can affect the potential zones [13], it was also considered. Consequently, the final classified map was generated using an unsupervised classification technique applied to two sets of input data: the ECa and the topographic layers. The ISO Cluster approach in ArcGIS was used to perform the classification. This algorithm organizes the data in the input raster into a user-defined number of groups to produce signatures which are utilized to classify the data using the “Maximum Likelihood Classifier” (MLC) function. From a practical perspective, the number of groups was fixed at three in this study (less, intermediate and more potential). These three zones were the basis for the definition of the differentiated fertilizer prescription map.
Soil parameters (texture, pH, OM, P2O5, K2O, and CEC), and pasture biomass and vegetation index (NDVI) data at sampling locations were employed to check their differences. The delimitation of each zone was evaluated computing the differences in the mean values of these soil and pasture parameters. These parameters were treated using the Kruskal–Wallis nonparametric test and the Dunn test as a post hoc analysis in the IBM SPSS statistical package (version 24, IBM Corp, Armonk, NY, USA). These tests were chosen since the normality in the data cannot be assumed. The Kruskal-Wallis test is a rank-based non-parametric test that can be used to determine if there are statistically significant differences between two or more groups of an independent variable on a continuous or ordinal dependent variable. The Kruskal-Wallis test tells that at least two groups were different but cannot tell which specific groups of the independent variable are statistically significantly different from each other. Consequently, since more than two groups can be defined, determining which of these groups differ from each other were performed by means of the Dunn test as a post hoc non-parametric test.

2.9. Statistical Analysis of the Data

Descriptive statistical analysis (mean, standard variation, and range) was performed for all soil and pasture parameters. Then, ANOVA of the data was carried out using “MSTAT-C” software with a 95% significance level (p < 0.05). The “Fisher” (“Fisher’s least significant difference, LSD”) test was applied whenever the ANOVA results presented significant differences.
Data of pasture floristic composition (FC) were submitted to a multilevel pattern analysis (indicator species analysis; ISA), a specific package for “R” statistic software (St. Louis, MO, USA) [39]. ISA involves the calculation of an indicator value (IV) for species, corresponding to the product of the relative abundance (specificity) and relative frequency (fidelity), expressed as a degree (in percentage) [40]. In order to identify bio-indicator species, characteristic of each study area throughout the period under evaluation, three approaches were taken in this analysis: (i) tree canopy effect (UTC and OTC); (ii) grazing system effect (“Field A” and “Field B”); and (iii) fertilizer level effect.
Regression analysis (p < 0.05) was performed in ‘MSTAT-C’ software, based in mean values for each pixel, between (i) NDVI and NDWI; (ii) NDVI and pasture quality parameters (PMC, CP and NDF); (iii) NDWI and pasture quality parameters (PMC, CP, and NDF), using the proportion of explained variance as estimated by the coefficient of determination (R2). Table 1 shows the dates of pasture sampling and remote sensing capture. Gap corresponds to the number of days between RS data capture and pasture sampling.

3. Results

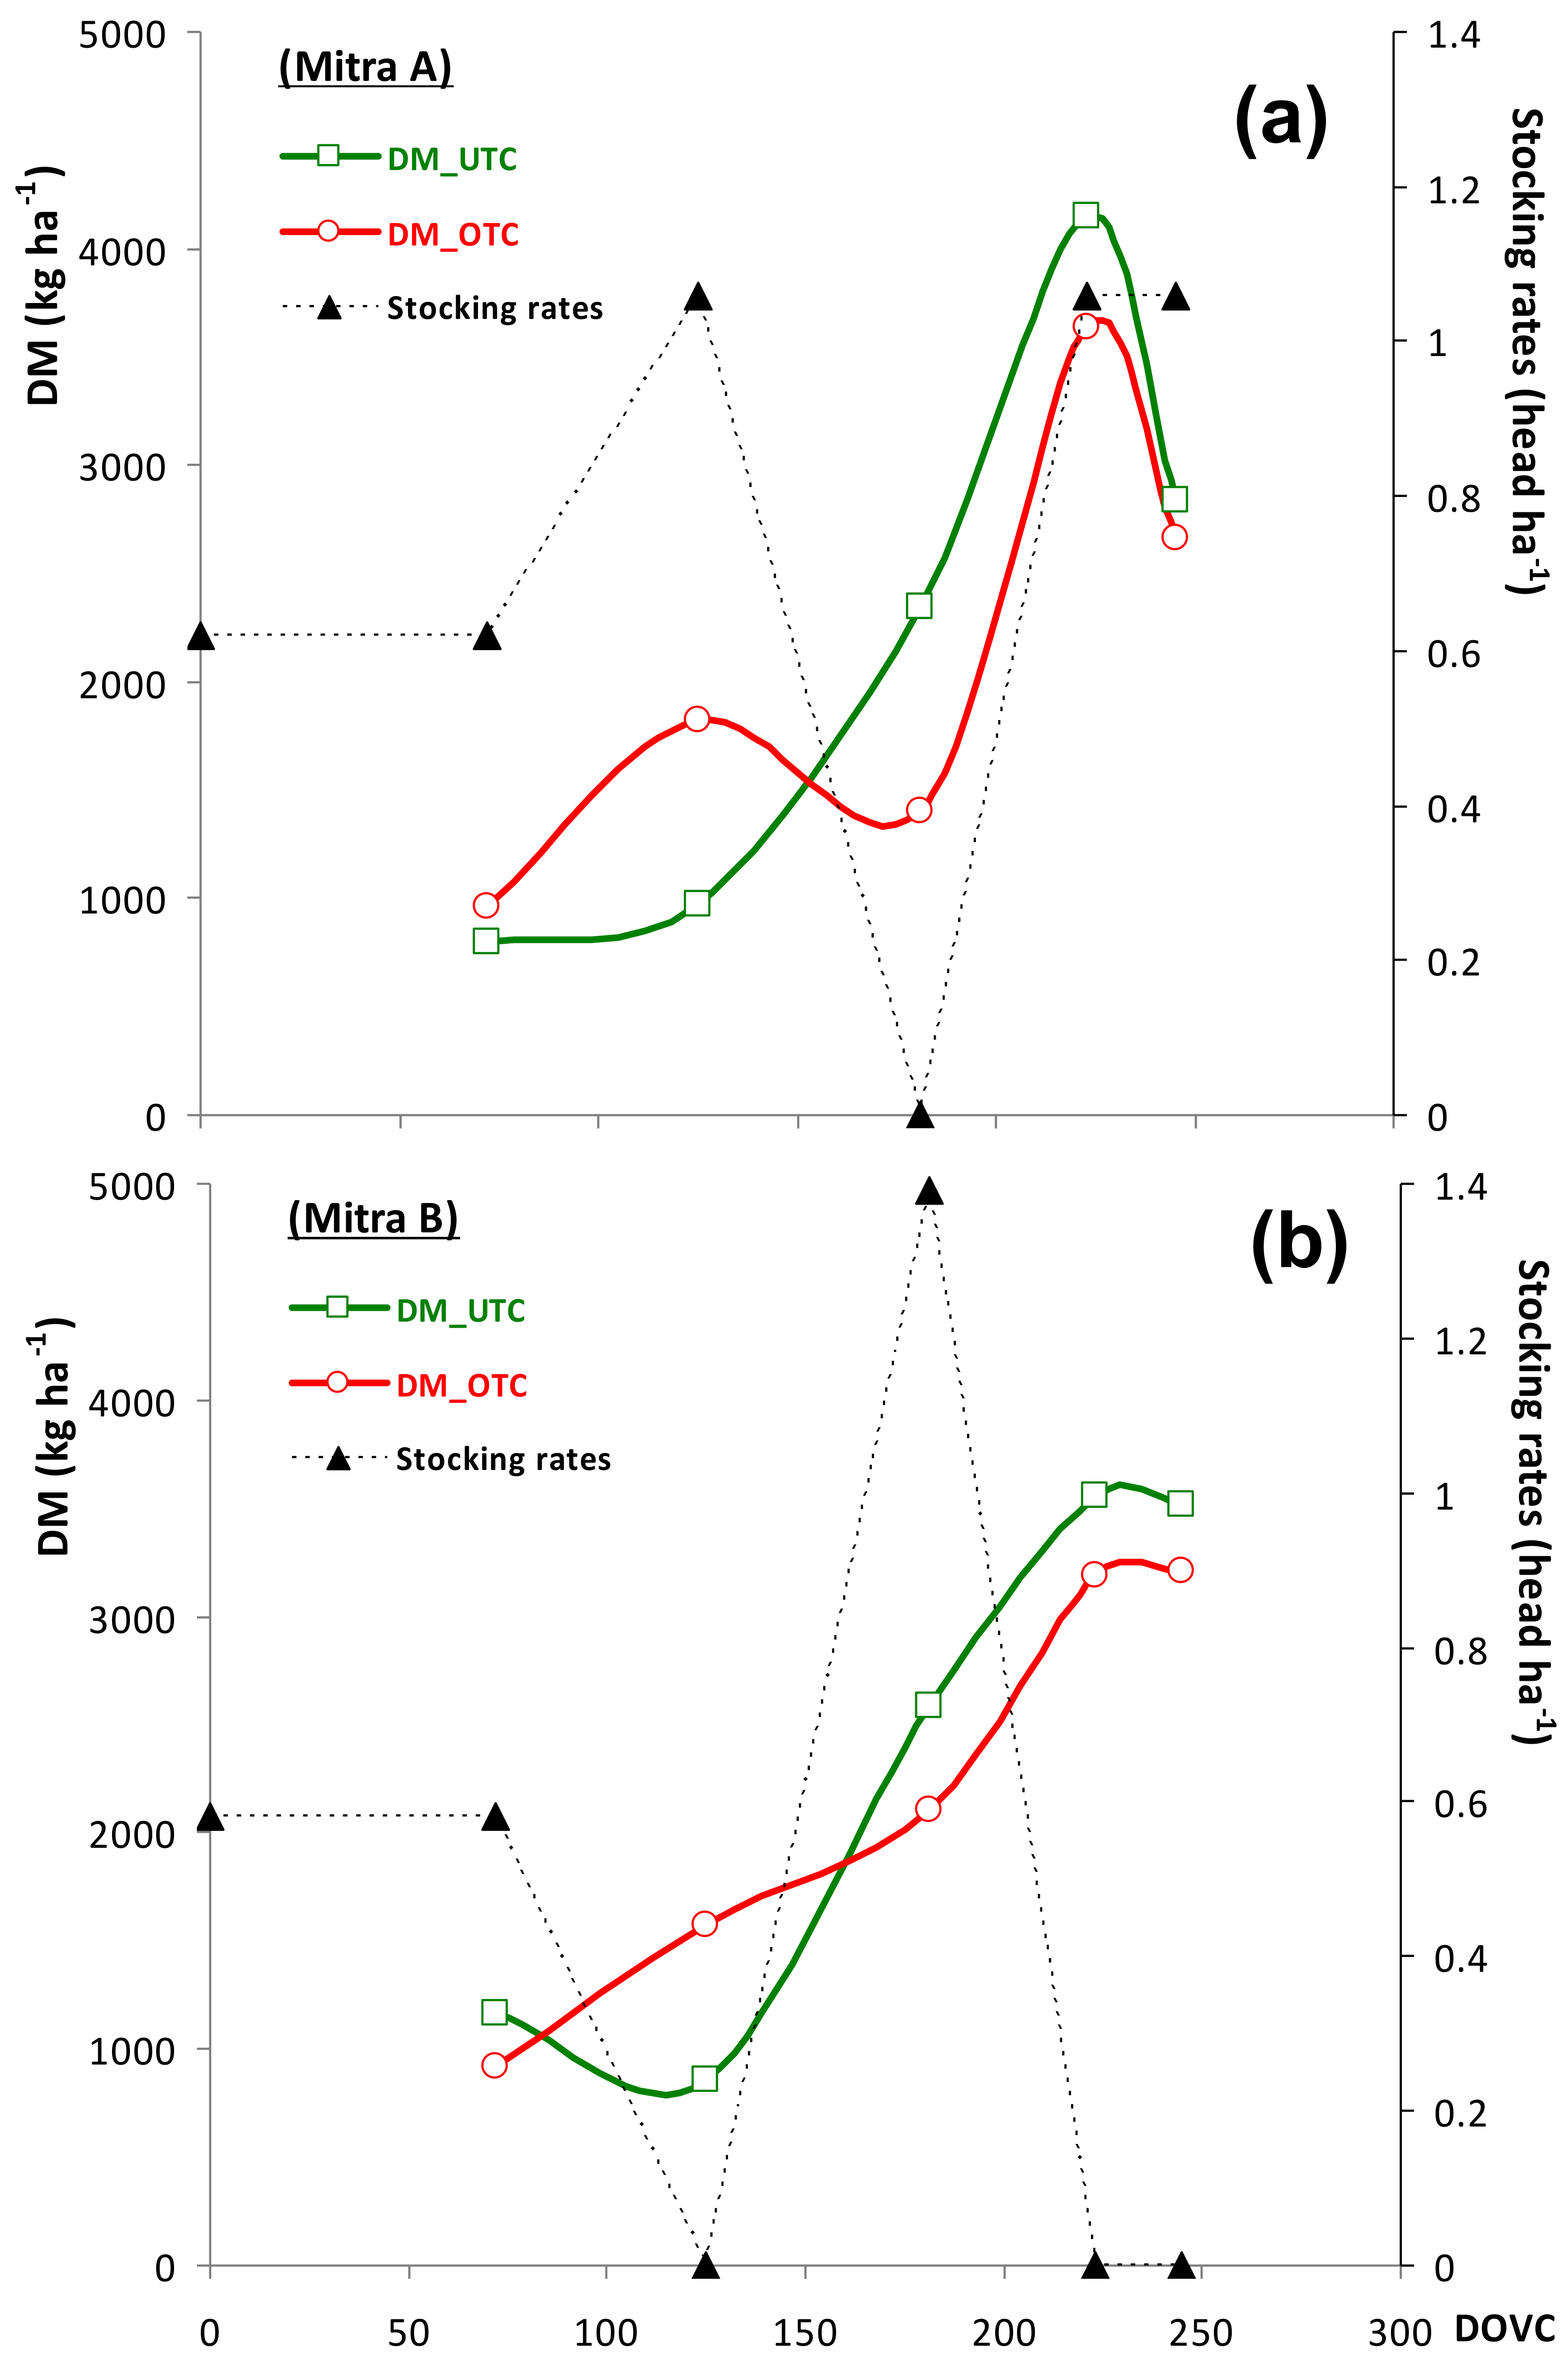
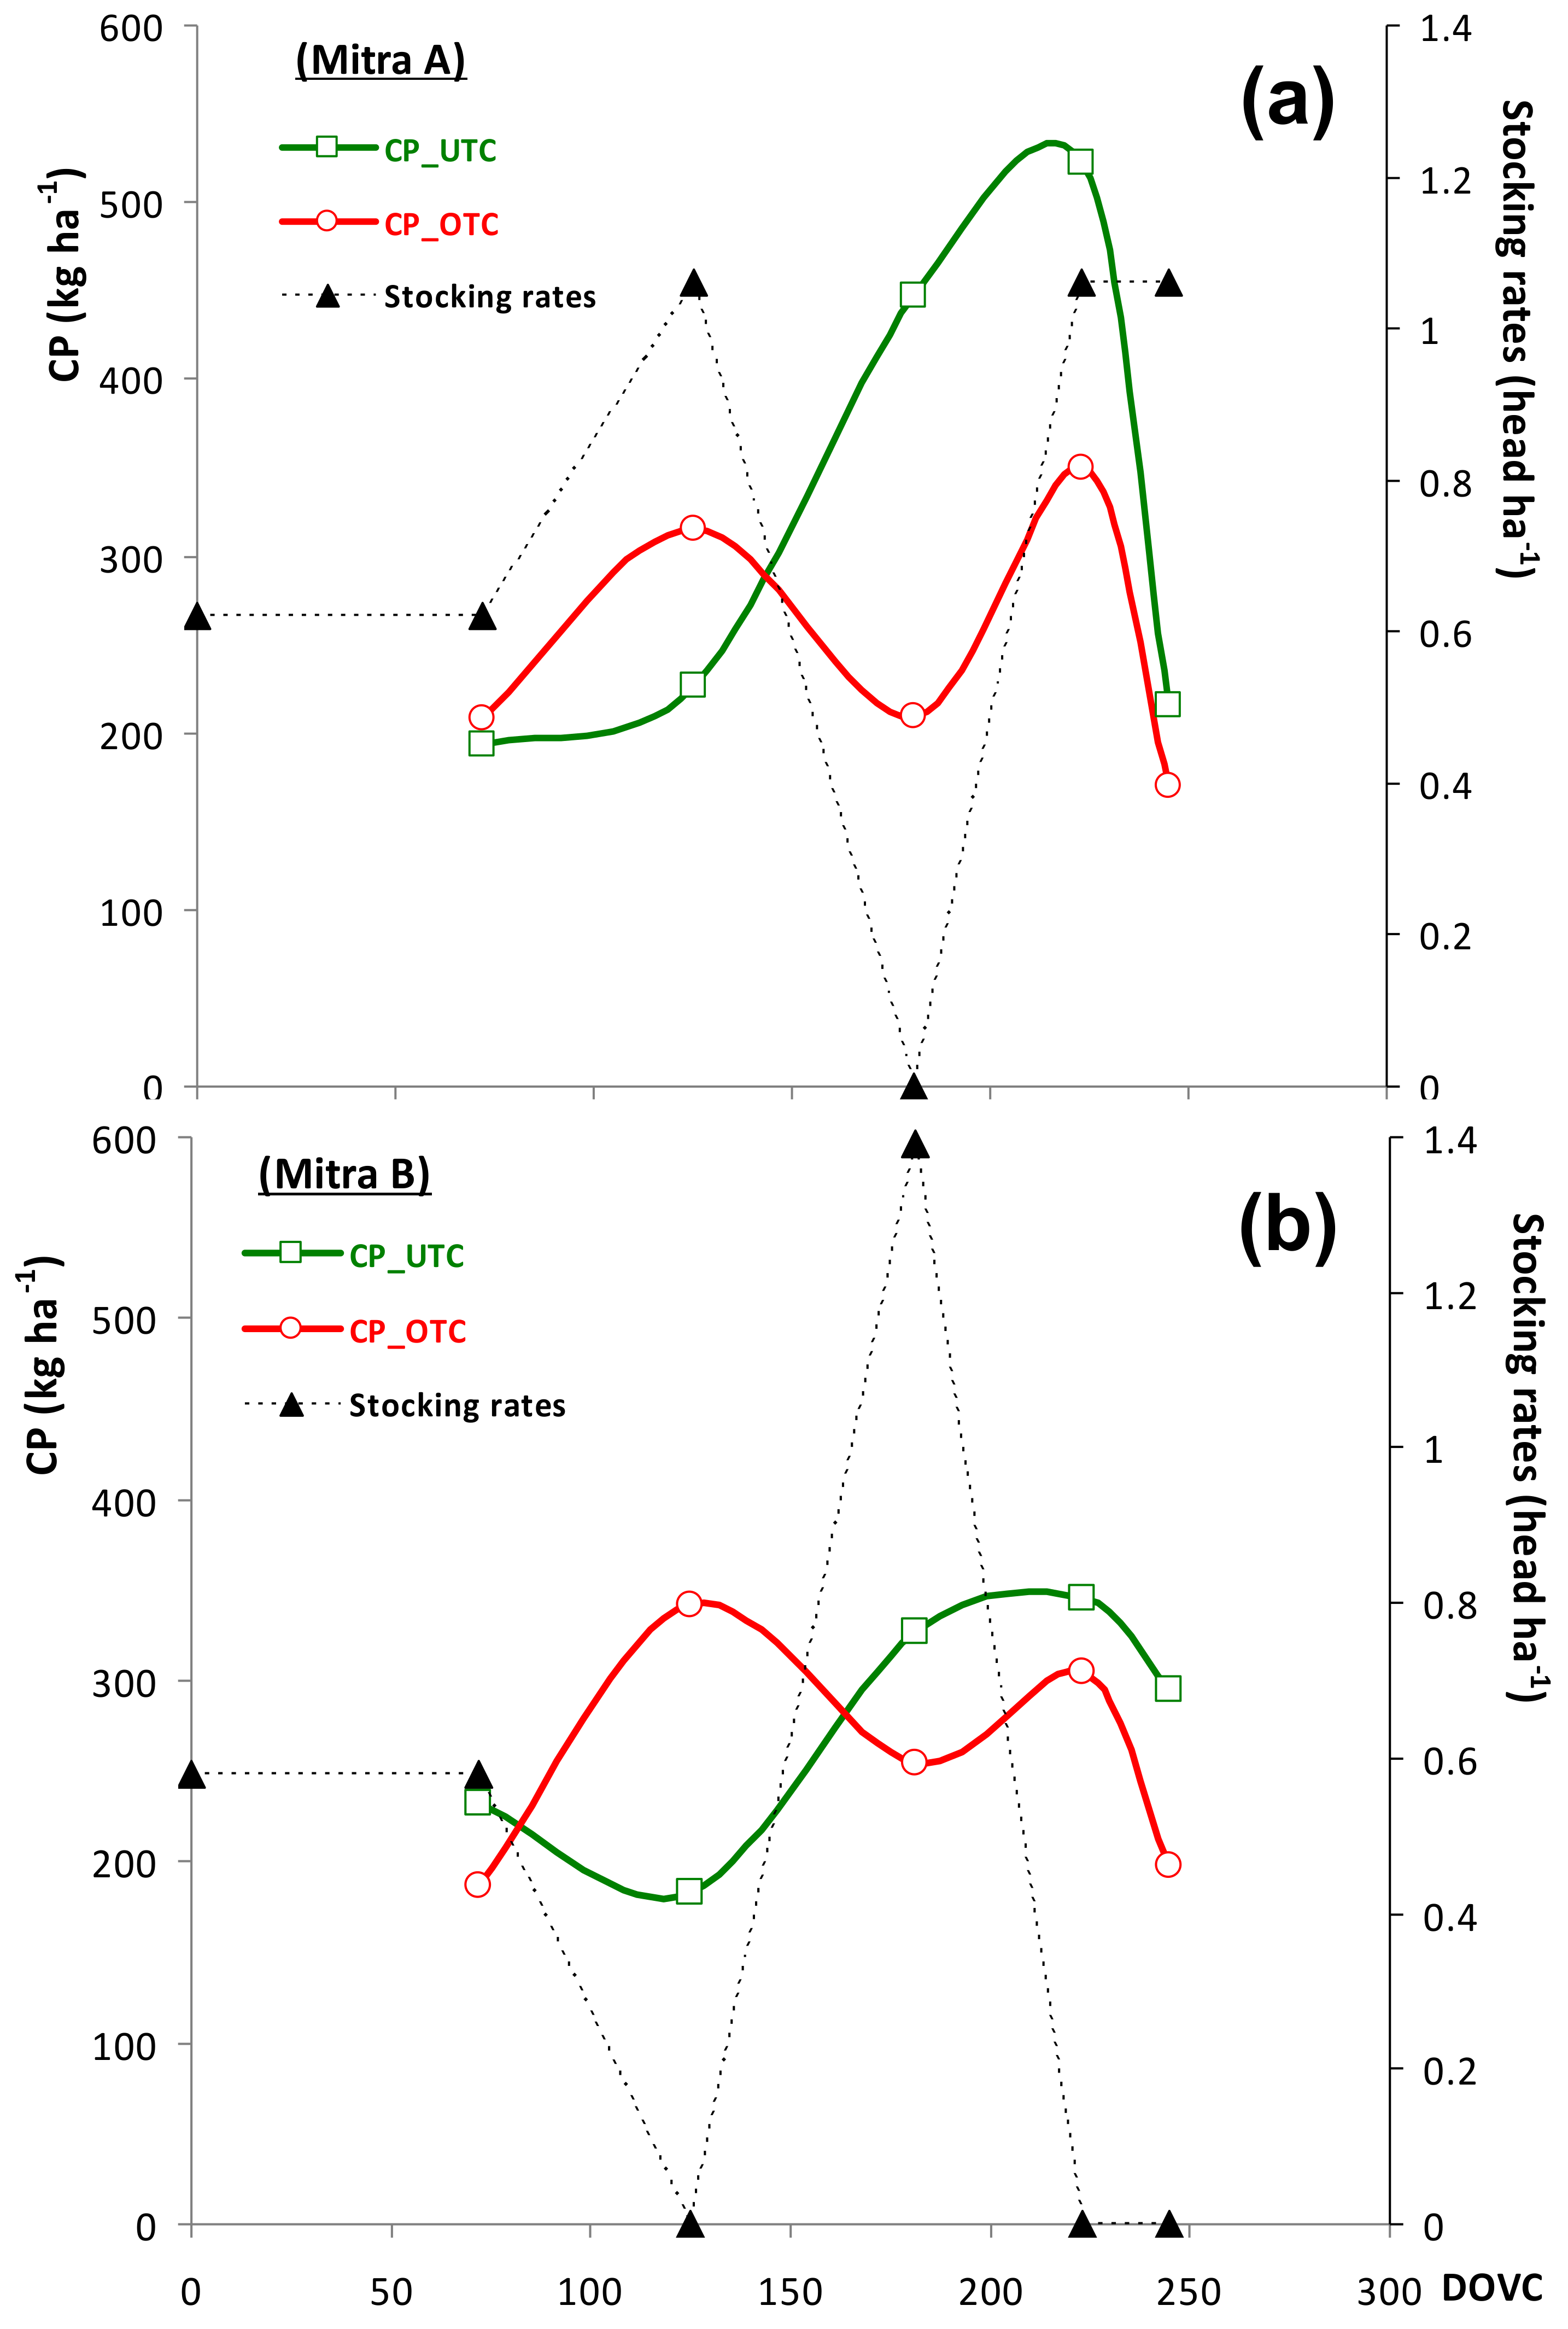
3.1. Variability of Soil and Pasture Parameters

Descriptive statistics of soil and pasture parameters of the two experimental fields are shown in Table 2 and Table 3, respectively.
The topsoil layer (0–0.30 m depth) of these fields, with a coarse texture (sand > 80% and clay < 10%), slightly acidic pH (<6.0), OM of 2.0–2.5%, low levels of P2O5 (<50 mg kg−1) and relatively rich in K2O, shows mean characteristics typical of soils dedicated to extensive animal production in this region (Table 2). The two monitored fields (“Field A” and “Field B”) have similar soil characteristics, with particularly noticeable differences between the UTC and OTC areas, with higher fertility UTC (higher levels of OM, P2O5 and K2O). On the other hand, there is an important spatial variability of the soil parameters, especially K2O and CEC (particularly in “Field A”, where the CV reached, respectively, 83.4% and 70.3%, OTC), P2O5 (CV between 20–64%), clay (CV > 25%), silt (CV close of 20%), and OM (CV between 11–27%). Soil pH and sand content showed low spatial variability (CV < 6%).
Regarding the pasture (Table 3), the different samplings carried out throughout the vegetative cycle allow the assessment of both spatial and temporal variability. At each sampling date, the spatial variability is particularly evident in terms of productivity (DM and CP, in kg ha−1, with CV of 10–40%). In terms of PMC, there is a relative spatial stability at each date, even between UTC and OTC areas (CV < 5%), which shows a homogeneous evolution of the vegetative cycle of the pasture. The temporal evolution of pasture parameters is shown in Figure 6, Figure 7 and Figure 8. The first of October 2020 was considered as the day of the beginning of the pasture vegetative cycle (DOVC), taking into consideration the distribution of temperature and precipitation (Figure 3).
The evolution of pasture quality indicators (PMC, CP and NDF) is shown in Figure 6, UTC (a) and OTC (b). A similar pattern of PMC and CP is evident, with a tendency to decrease as the vegetative cycle progresses and with a significant break in the final phase of the vegetative cycle (in late Spring–June 2021). Pasture fiber (NDF) shows an inverse pattern of PMC and CP.
The evolution of pasture productivity indicators is presented in Figure 7 and Figure 8, respectively for DM and CP, in kg ha−1.
These figures highlight the irregularity of these parameters throughout the pasture vegetative cycle. Both parameters show a break that happens earlier in the “Field B” and in UTC areas (right on date 2: 2 February 2021; DOVC = 125) than in the “Field B” and in OTC areas (only on date 3: 30 March 2021; DOVC = 181). In addition to aspects related to grazing and livestock management (different between fields), the reduced accumulated rainfall in March 2021 (only 18 mm, compared to 142 mm in February and 106 mm in April; see Figure 3), with a variable impact on the soil moisture dynamics in the areas under study (UTC and OTC), may help explain this break. In relation to DM indicator, the maximum productivity was found in both fields (“Field A” and “Field B”) on date 4 (11 May 2021; DOVC = 223), with higher values UTC than OTC. The indicator CP, in kg ha−1, is particularly interesting since it simultaneously integrates the dimension of pasture quality (CP, in % of DM) and the dimension of pasture productivity (DM, in kg ha−1), therefore reflecting the proportion and trend that each of these dimensions presents in each field and in both areas (UTC and OTC). Also, in this parameter there is a time lag of the break: it happens first UTC (Date 2: 2 February 2021; DOVC = 125) and only in “Field B”, while it happens later (Date 3: 30 March 2021; DOVC = 181) OTC and in both fields. The pattern of evolution of this parameter shows, in absolute terms (kg ha−1), greater availability of CP in UTC areas throughout the spring and even at the end of the vegetative cycle (Figure 8). For example, on Date 5 (2 June 2021; DOVC = 245), the availability of CP is approximately 300 kg ha−1 in UTC areas of “Field B”, while in the same field but in the OTC areas the availability of CP is less than 200 kg ha−1. The maximum productivity in terms of CP (in kg ha−1) was found in “Field A” on date 4 (11 May 2021; DOVC = 223) with significant higher values UTC that OTC. In “Field B” the maximum value of CP in areas UTC was found on date 4 (11 May 2021; DOVC = 223), while in areas OTC the maximum value was found in date 2 (2 February 2021; DOVC = 125).

3.2. Maps of Homogeneous Management Zones (HMZ)

The ECa and topographic surveys led to the elaboration of the respective maps and, finally, to the elaboration of the HMZ map presented in Figure 9. From a practical perspective, three zones were established (less, intermediate and more potential). In the future, this map should serve as a guideline for smart sampling purposes (soil and/or pasture sampling) and to support the differentiated prescription of fertilizers and amendments. The ECa map, predominantly with very low values (<3 mS m−1) reflects the low clay contents of the topsoil layer (<10%). Although the HMZ map shows three zones with different productive potential, even the zones with more potential will have limitations that result from the coarse texture of the soil.
Figure 10 shows the validation of HMZ through soil (i–vi) and pasture parameters (vii–viii). Different letters indicate significant differences (p < 0.05) between zones performed by the Dunn test. The trend of five of the six soil properties (except the P2O5) are in accordance with the proposed zoning, where significant higher values were found in zones with more soil fertility potential. Also pasture parameters (biomass and NDVI) were useful variables to characterize homogeneous zones, with significantly higher productivity (biomass) and vegetative vigor (NDVI) values in zones of more potential.
The map in Figure 11 shows how the differential phosphate fertilizer (“Bio 0-25-0”) application, based in HMZ map, affected the sampling areas in the two fields (“Field A” and “Field B”). Higher levels of fertilizer were applied in zones of more potential and vice versa.

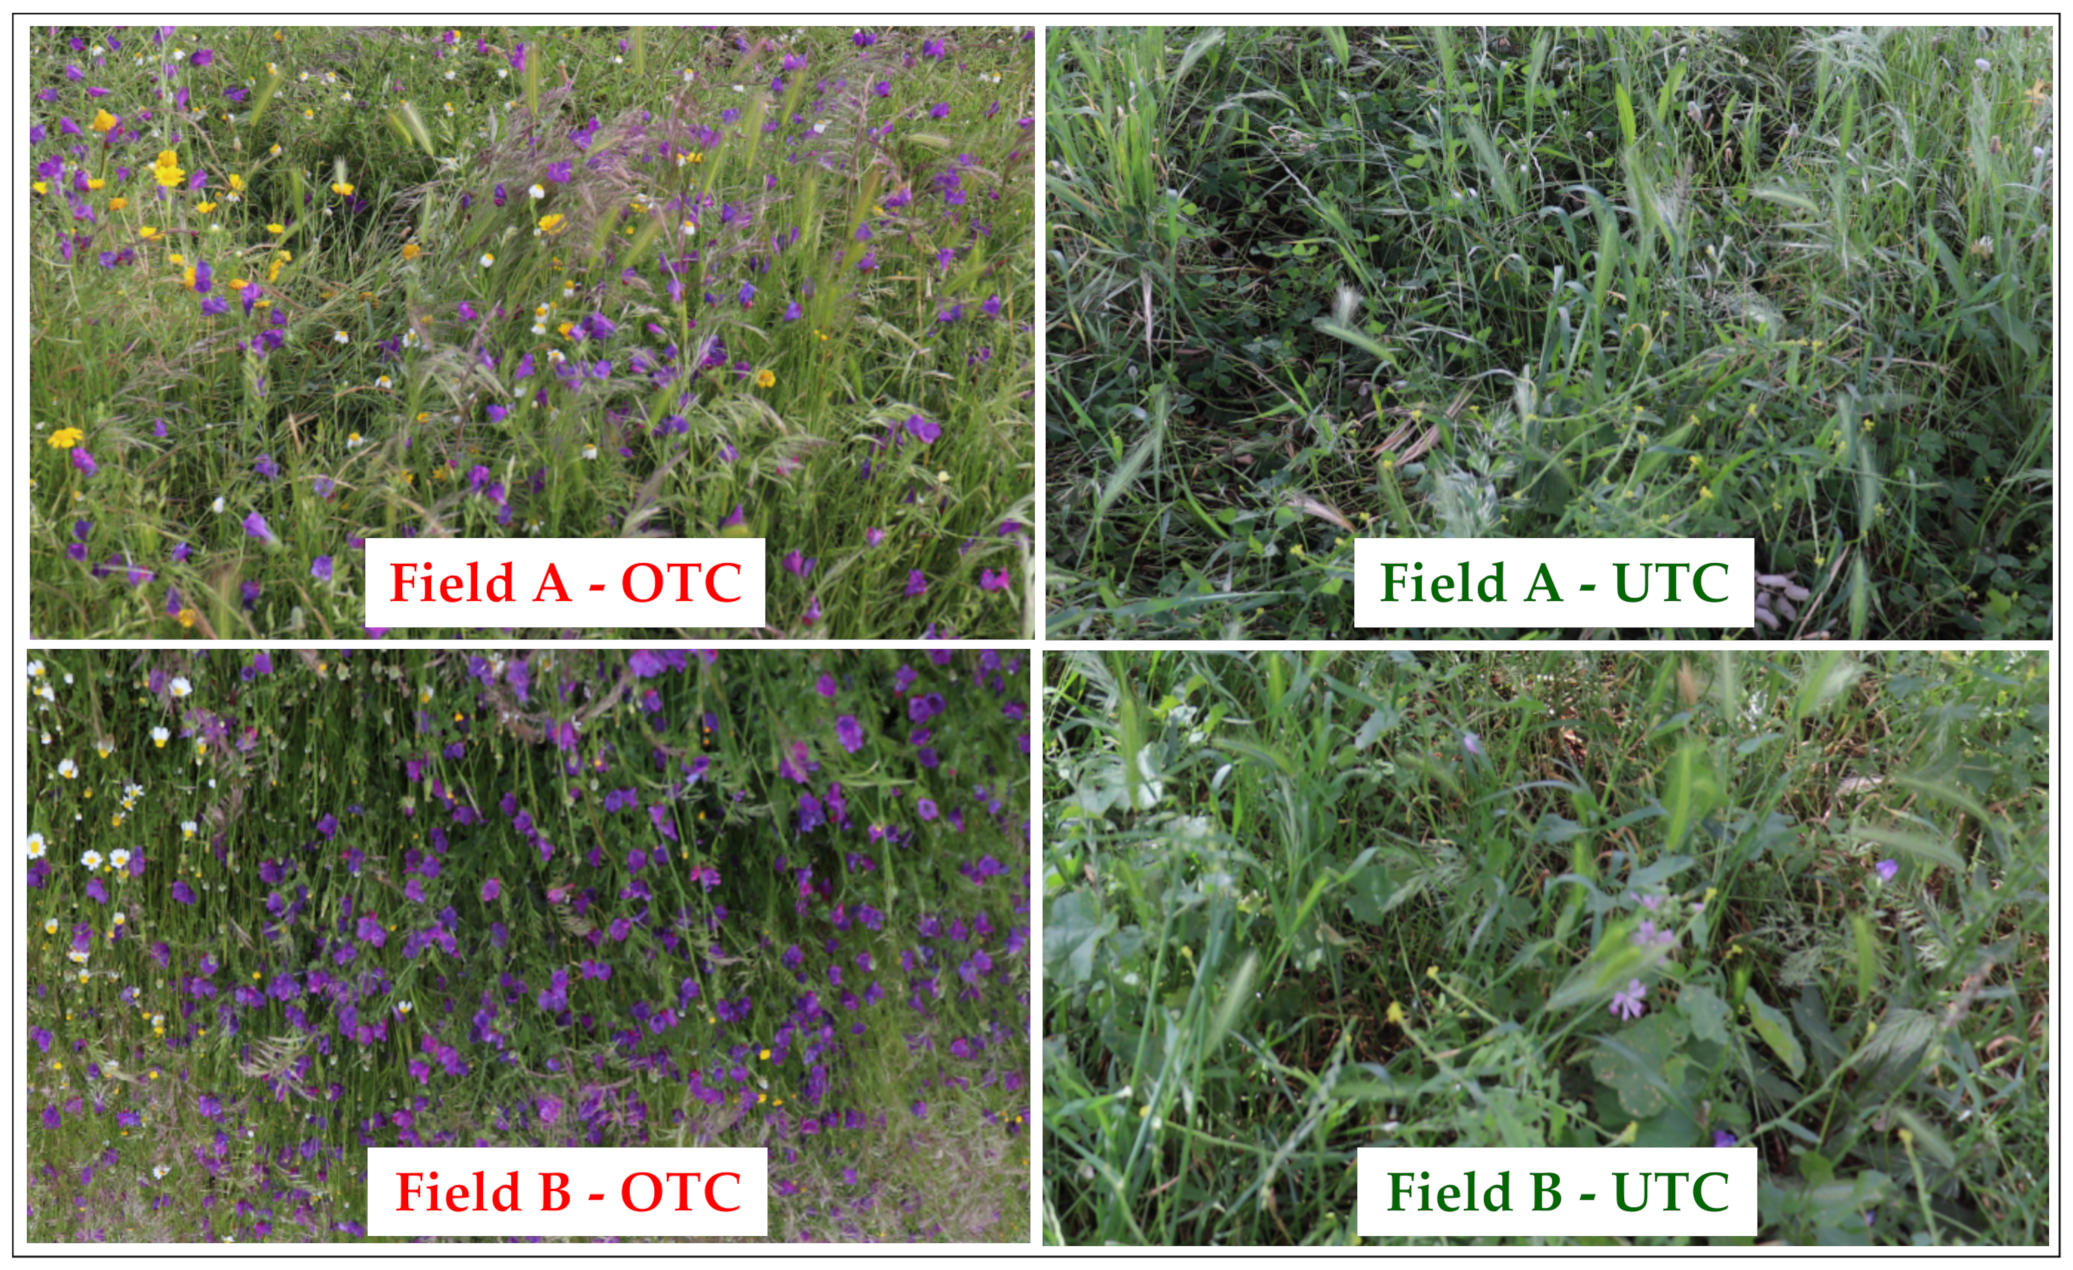
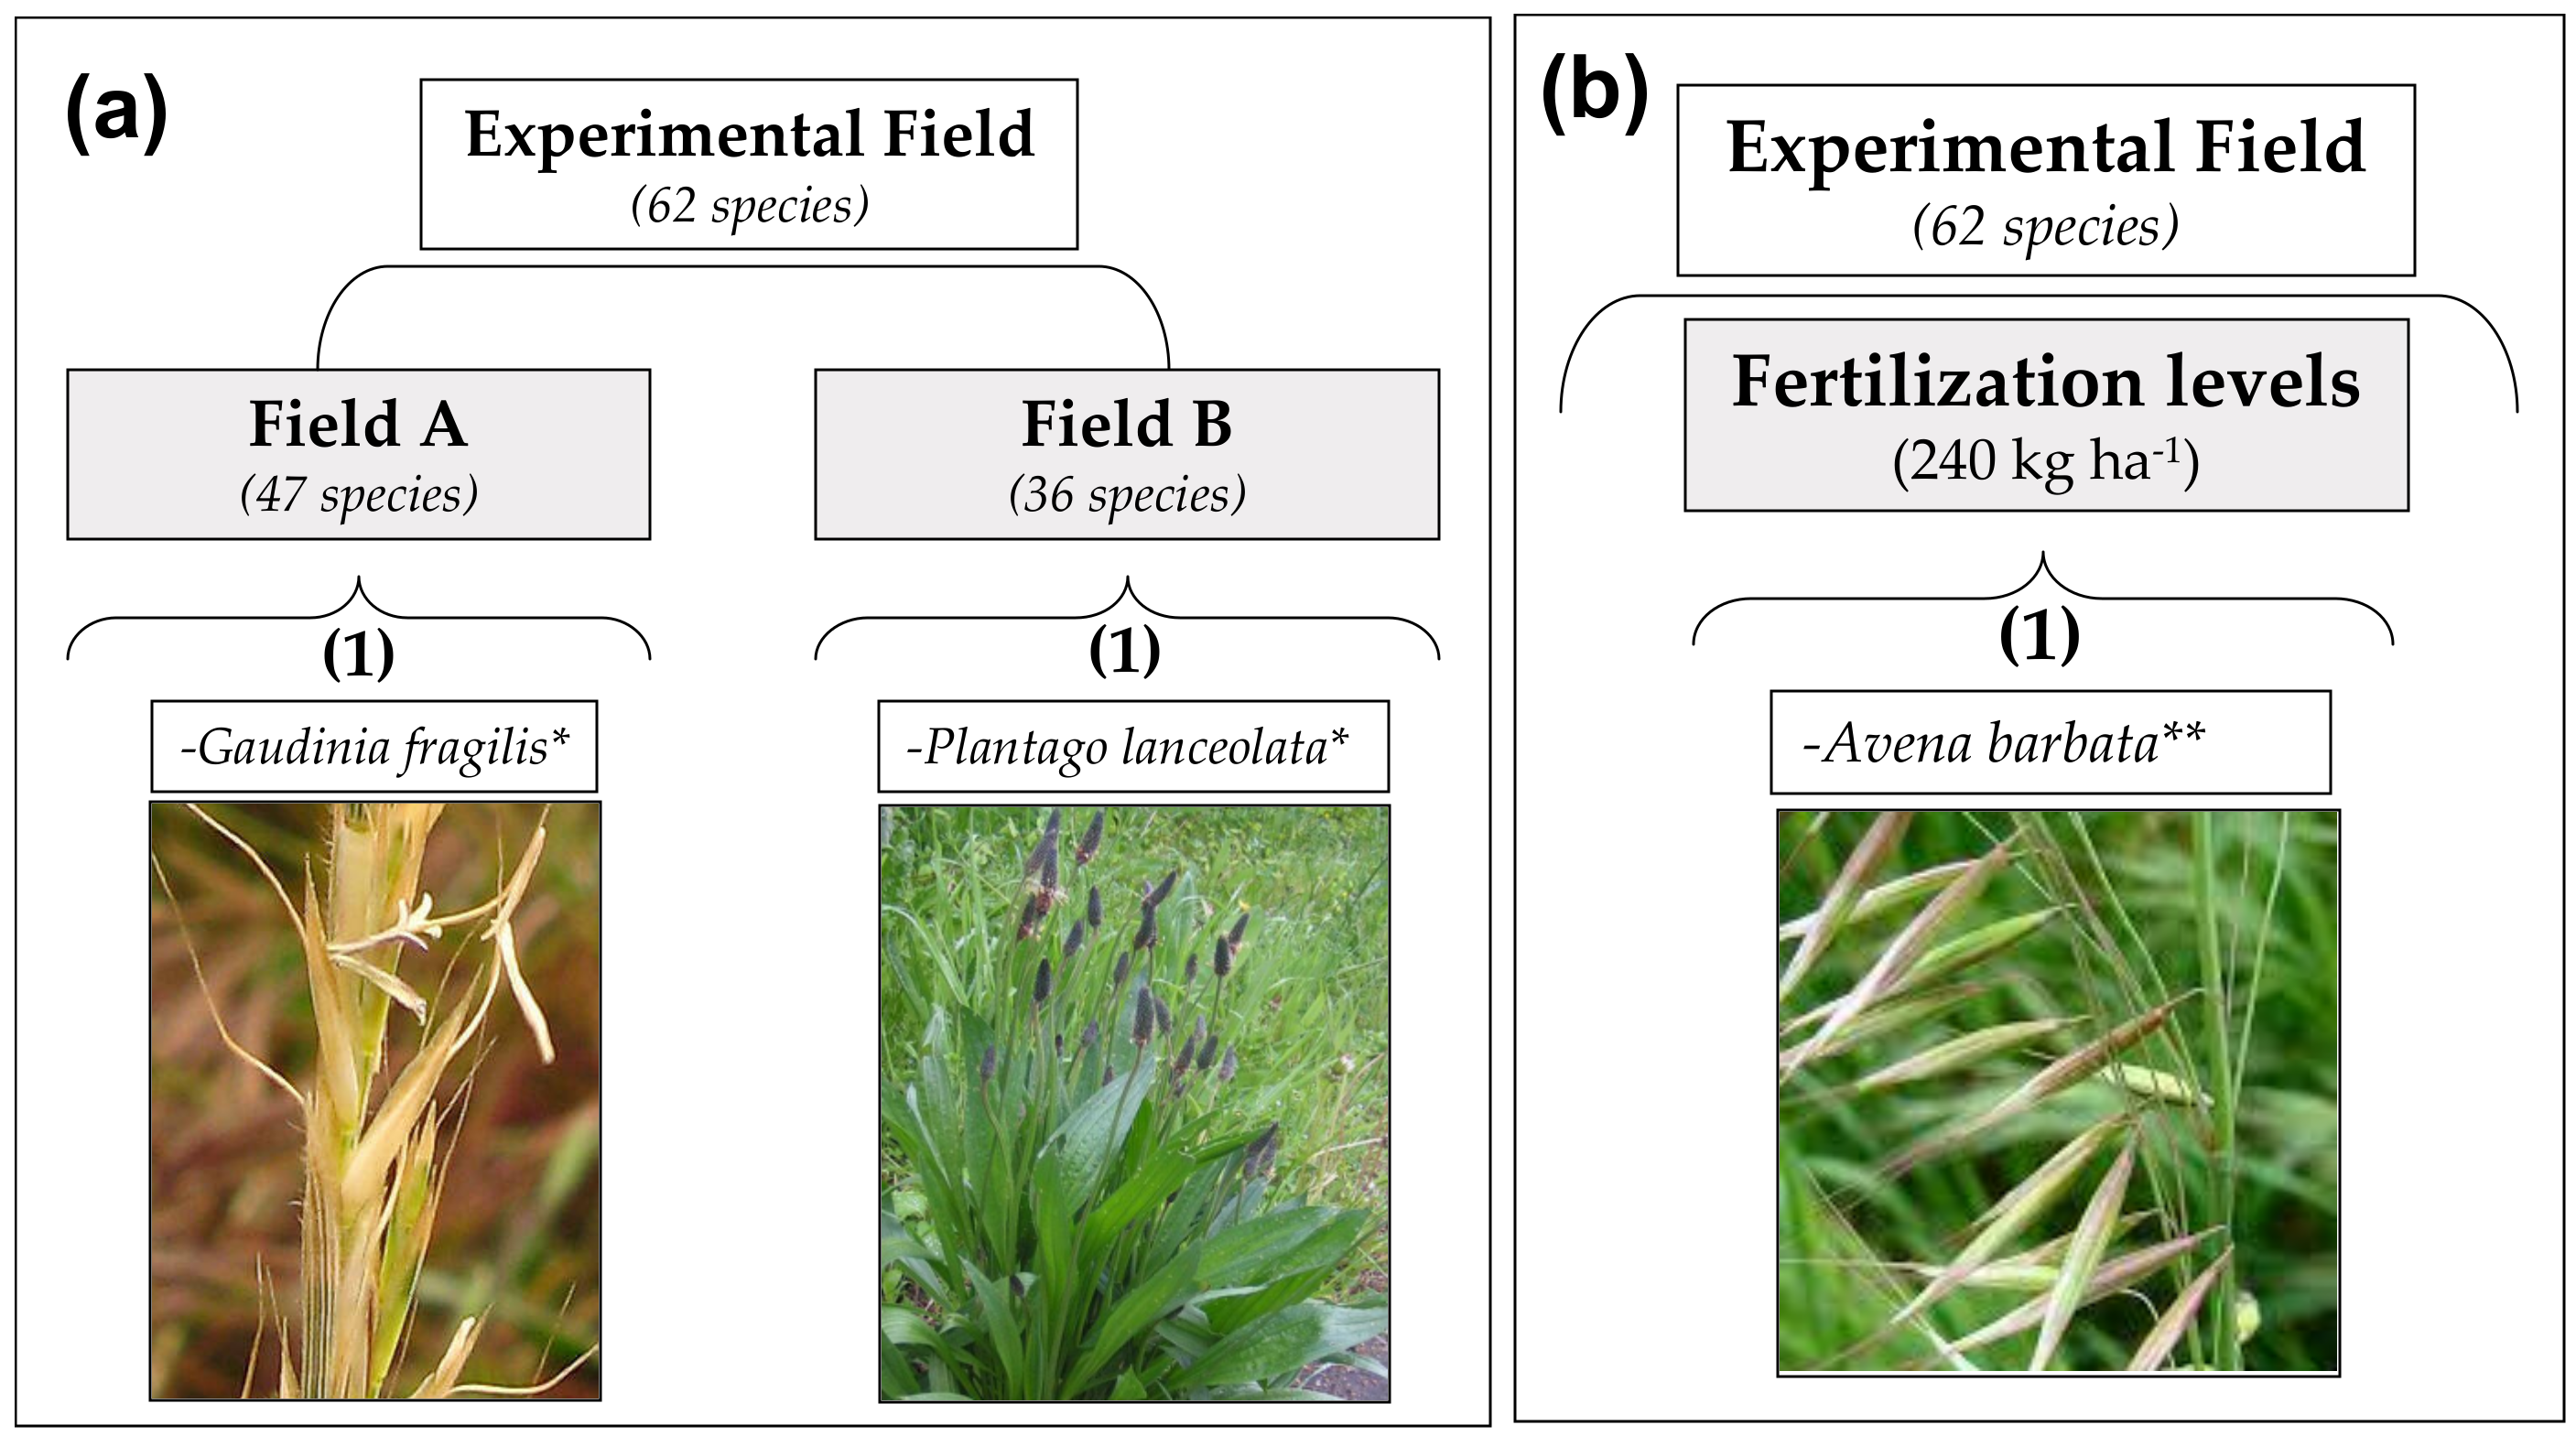
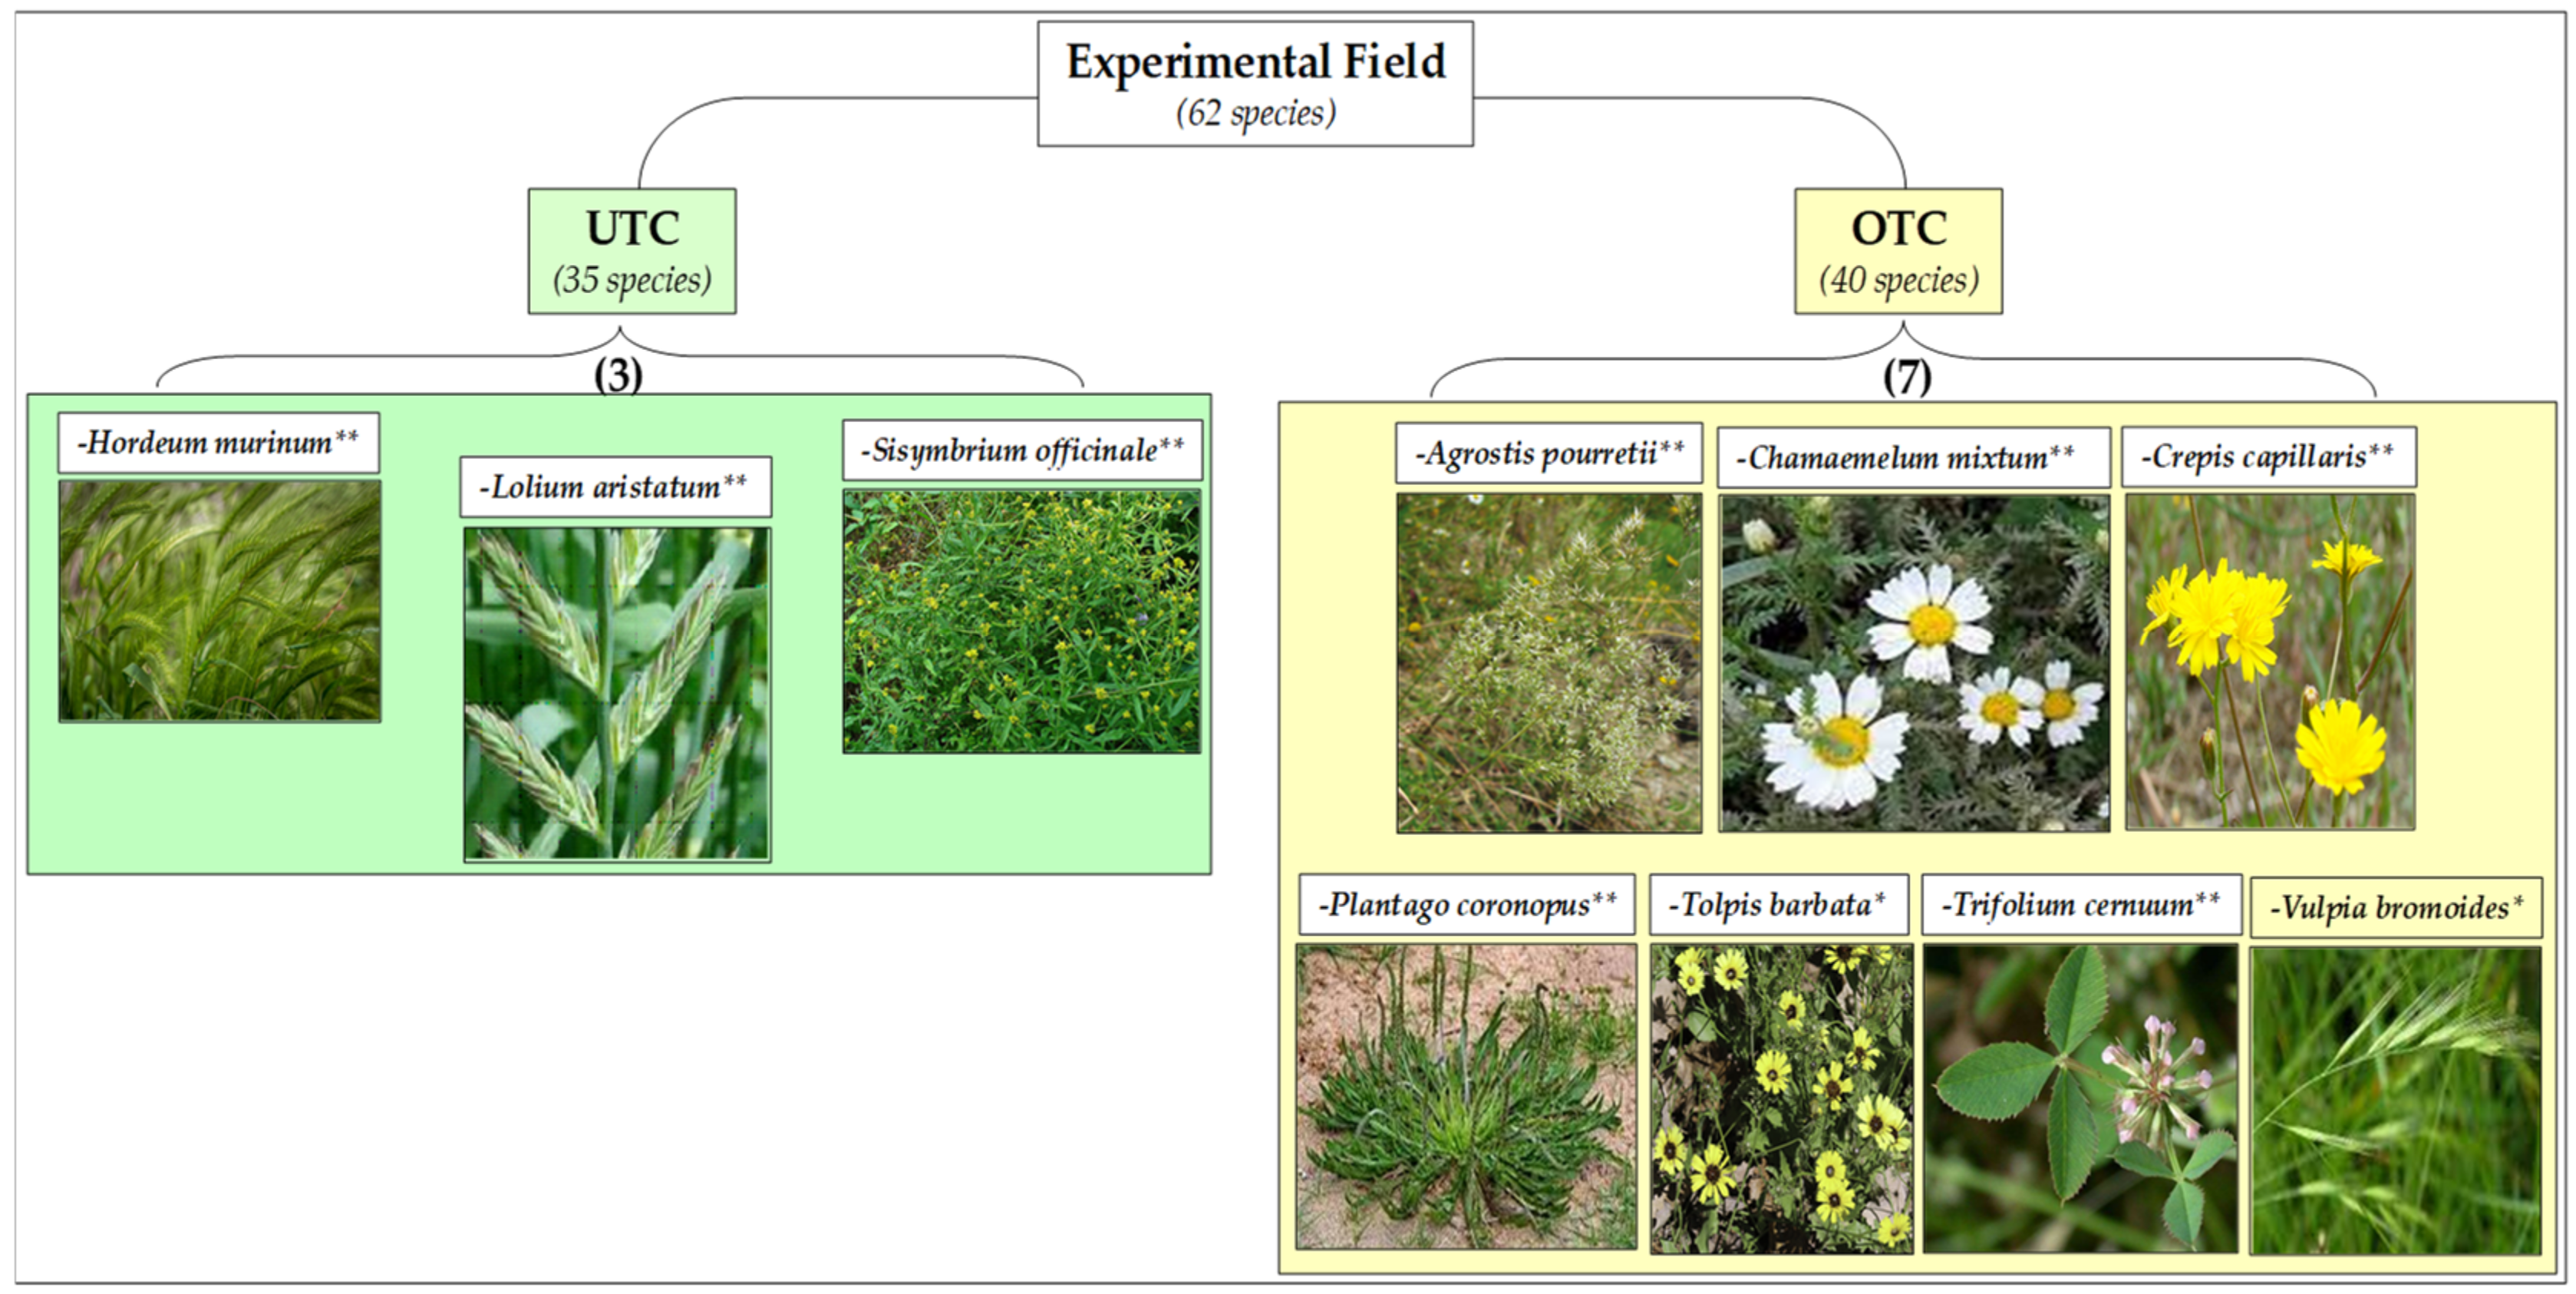
3.3. Pasture Floristic Composition (PFC) as Bio-Indicator of Field Management

In terms of PFC, "grazing system" and "fertilizer level" treatments did not present significant differences in pasture biodiversity indicators considered in this study (“richness” and “TCS”). However, the "tree canopy" effect (Figure 12) showed significant differences with better indicators in OTC areas (richness = 15.2 ± 1.8; TCA = 104.5 ± 5.5%) in comparison to UTC areas (richness = 11.7 ± 4.0; TCA = 79.8 ± 16.3%). After assessing the trends in terms of biodiversity patterns, the ISA application (Figure 13 and Figure 14) shows one significant bio-indicator species associated with the highest level of fertilization (Avena barbata; 240 kg ha−1 of fertilizer), one significant bio-indicator species for each “grazing system” (Gaudinia fragilis in “Field A”—system of pasture for “field grazing”; Plantago lanceolata in “Field B”—system of “pasture mowing”) and ten significant bio-indicator species of tree canopy effect (three UTC: Hordeum murinum, Lolium aristatum and Sisymbrium officinale; seven OTC: Agrostis pourretii, Chamaemelum mixtum, Crepis capillaries, Plantago coronopus, Tolpis barbata, Trifolium cernuum, and Vulpia bromoides).

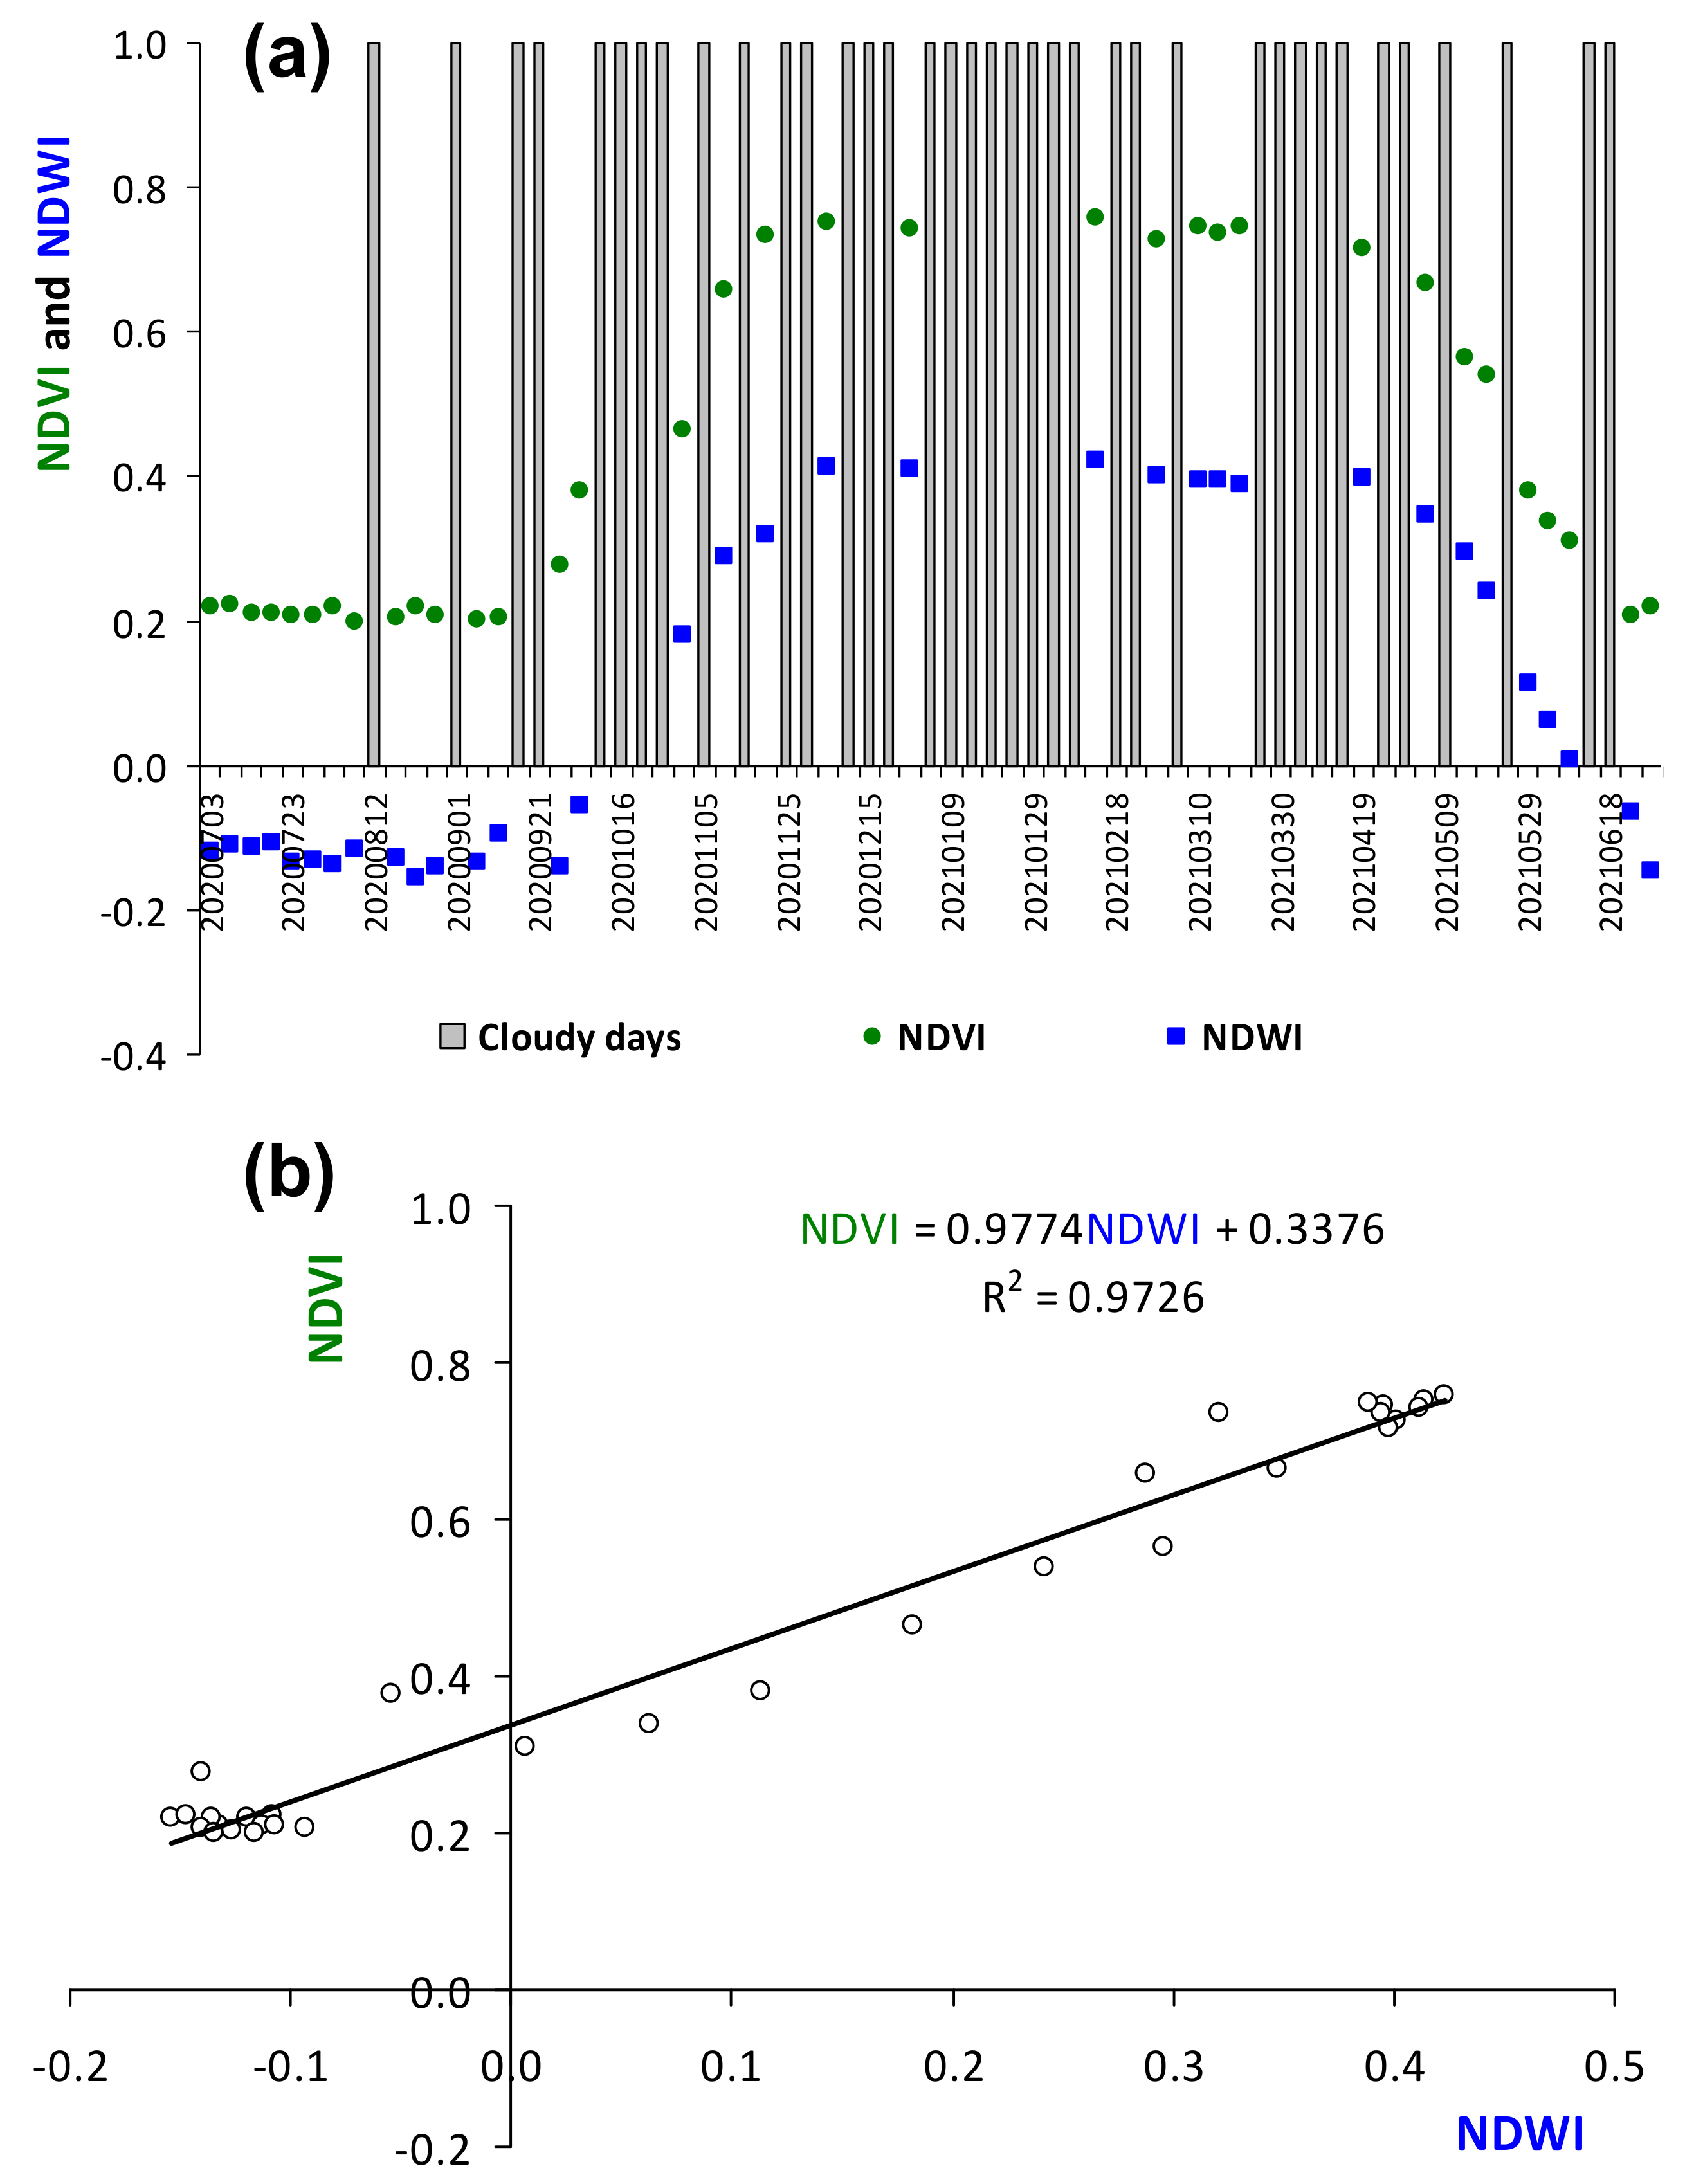
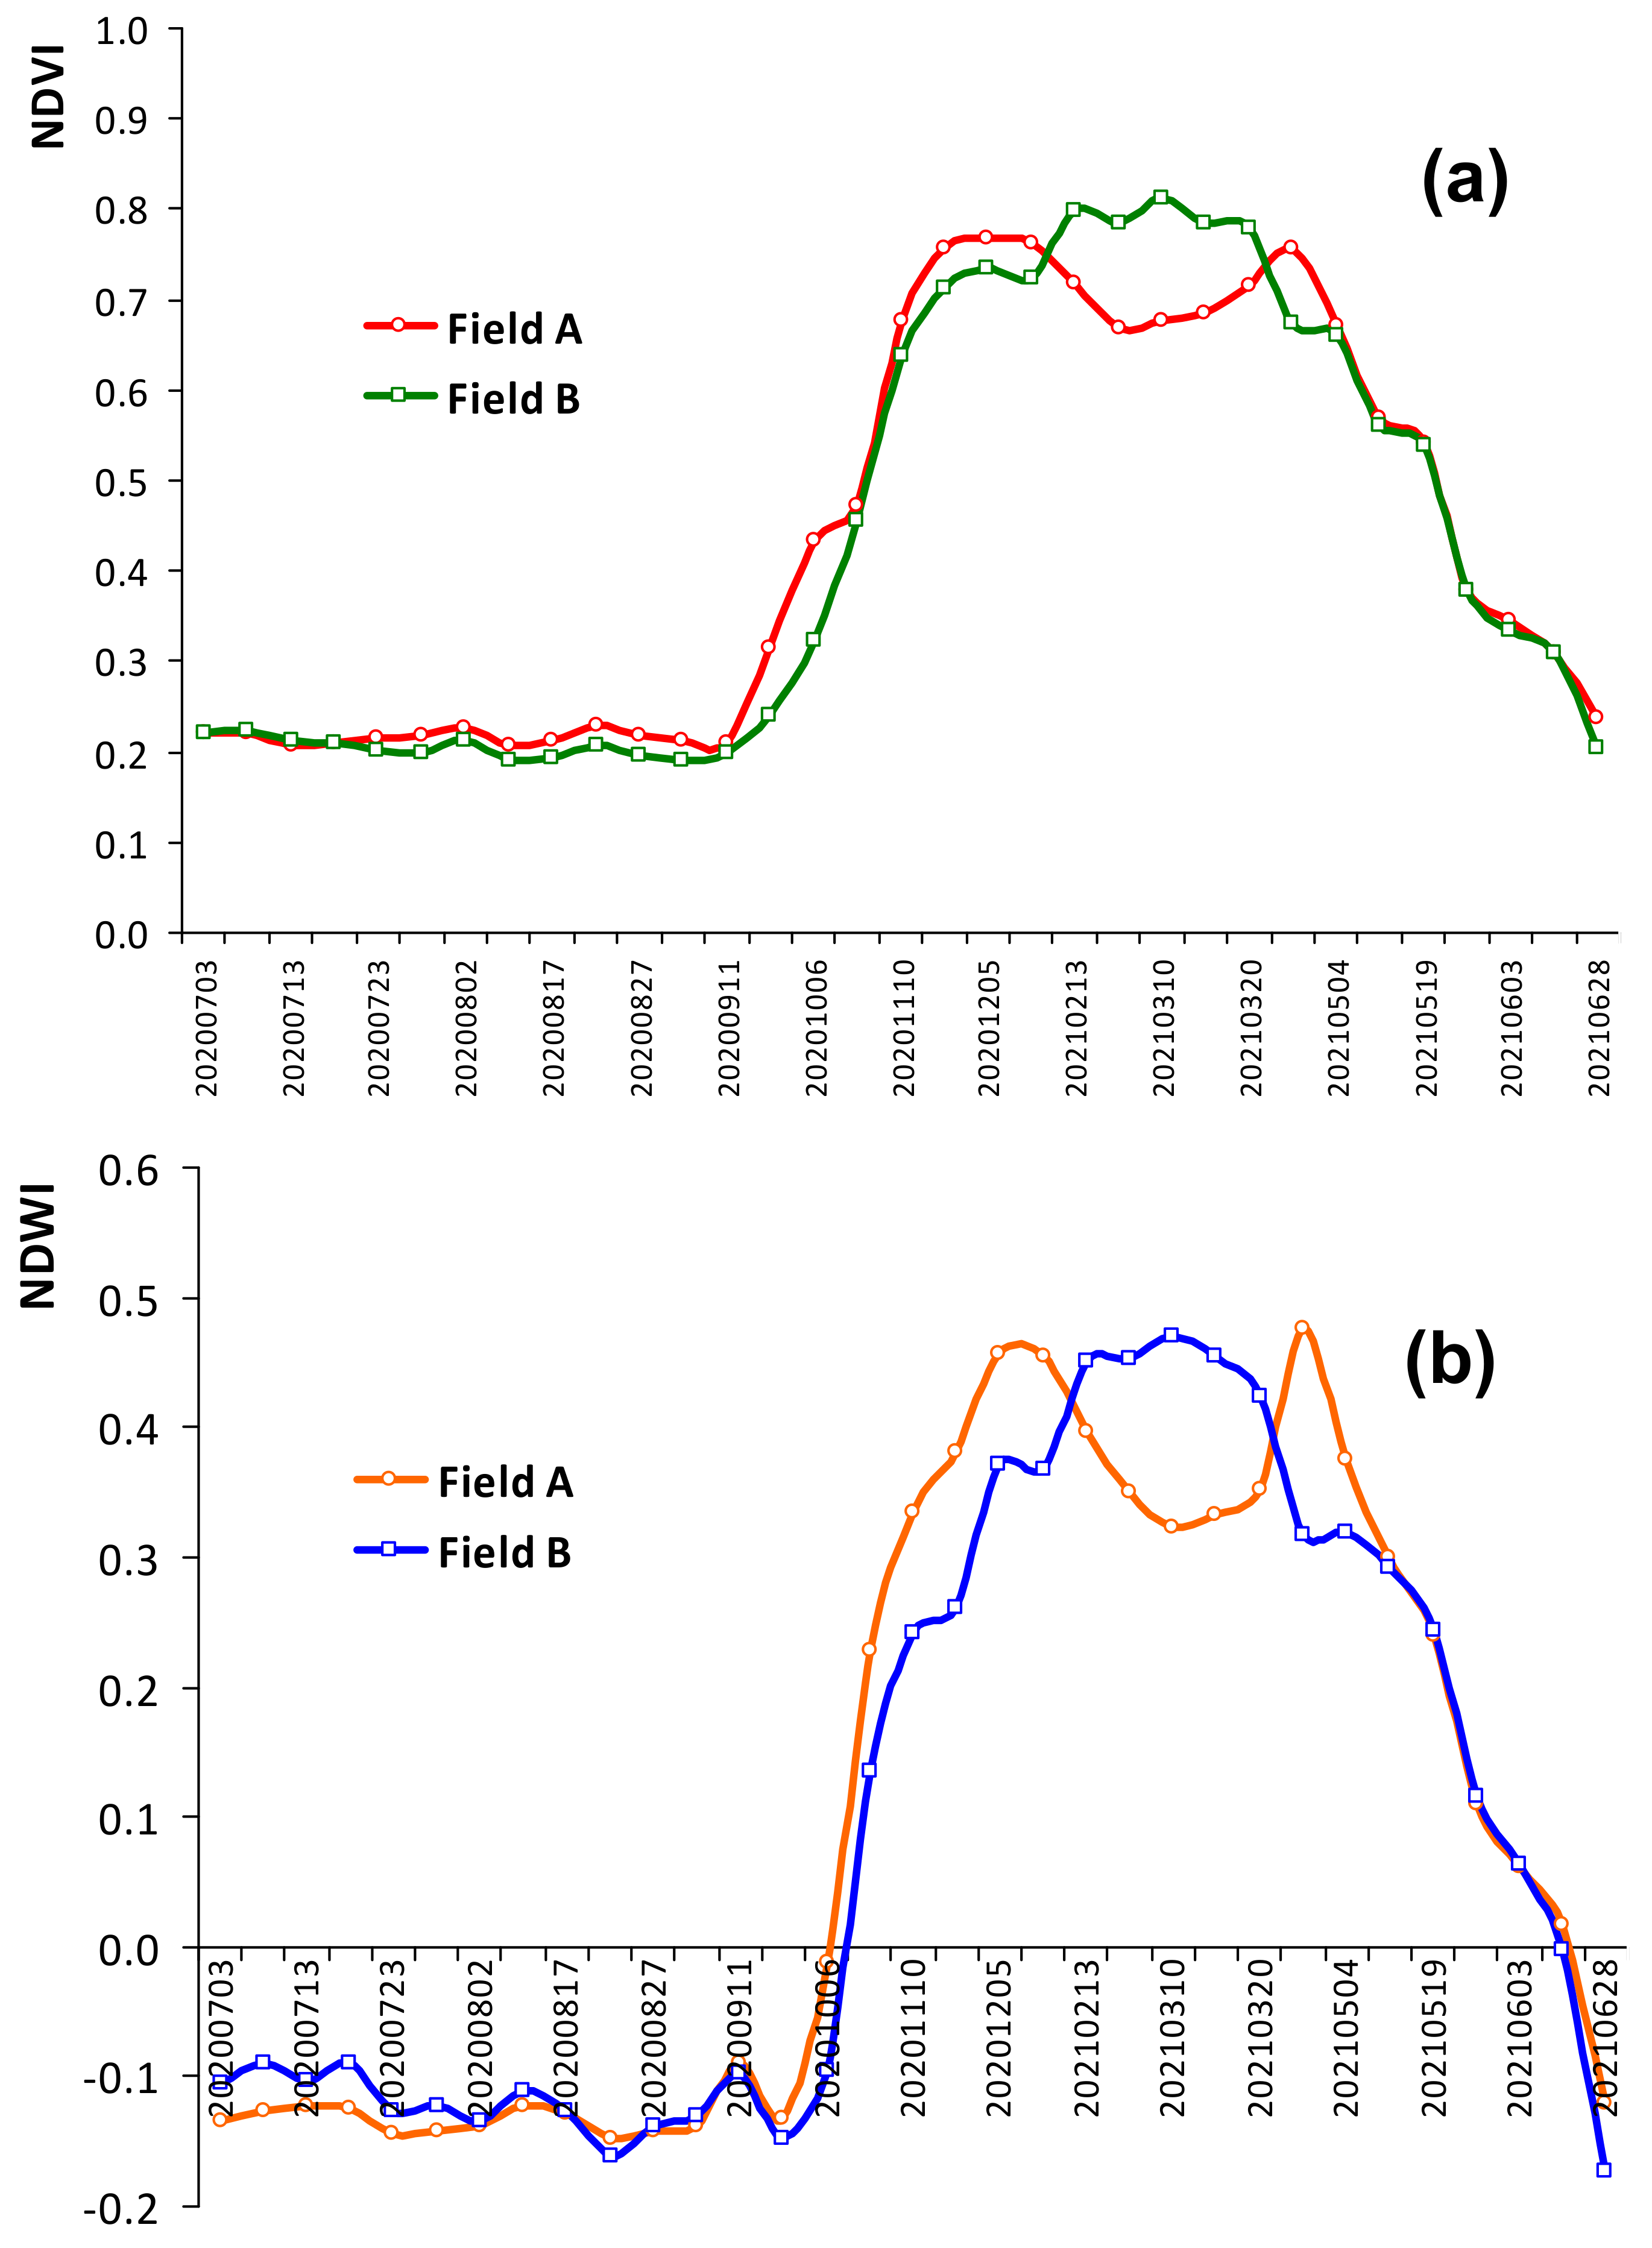
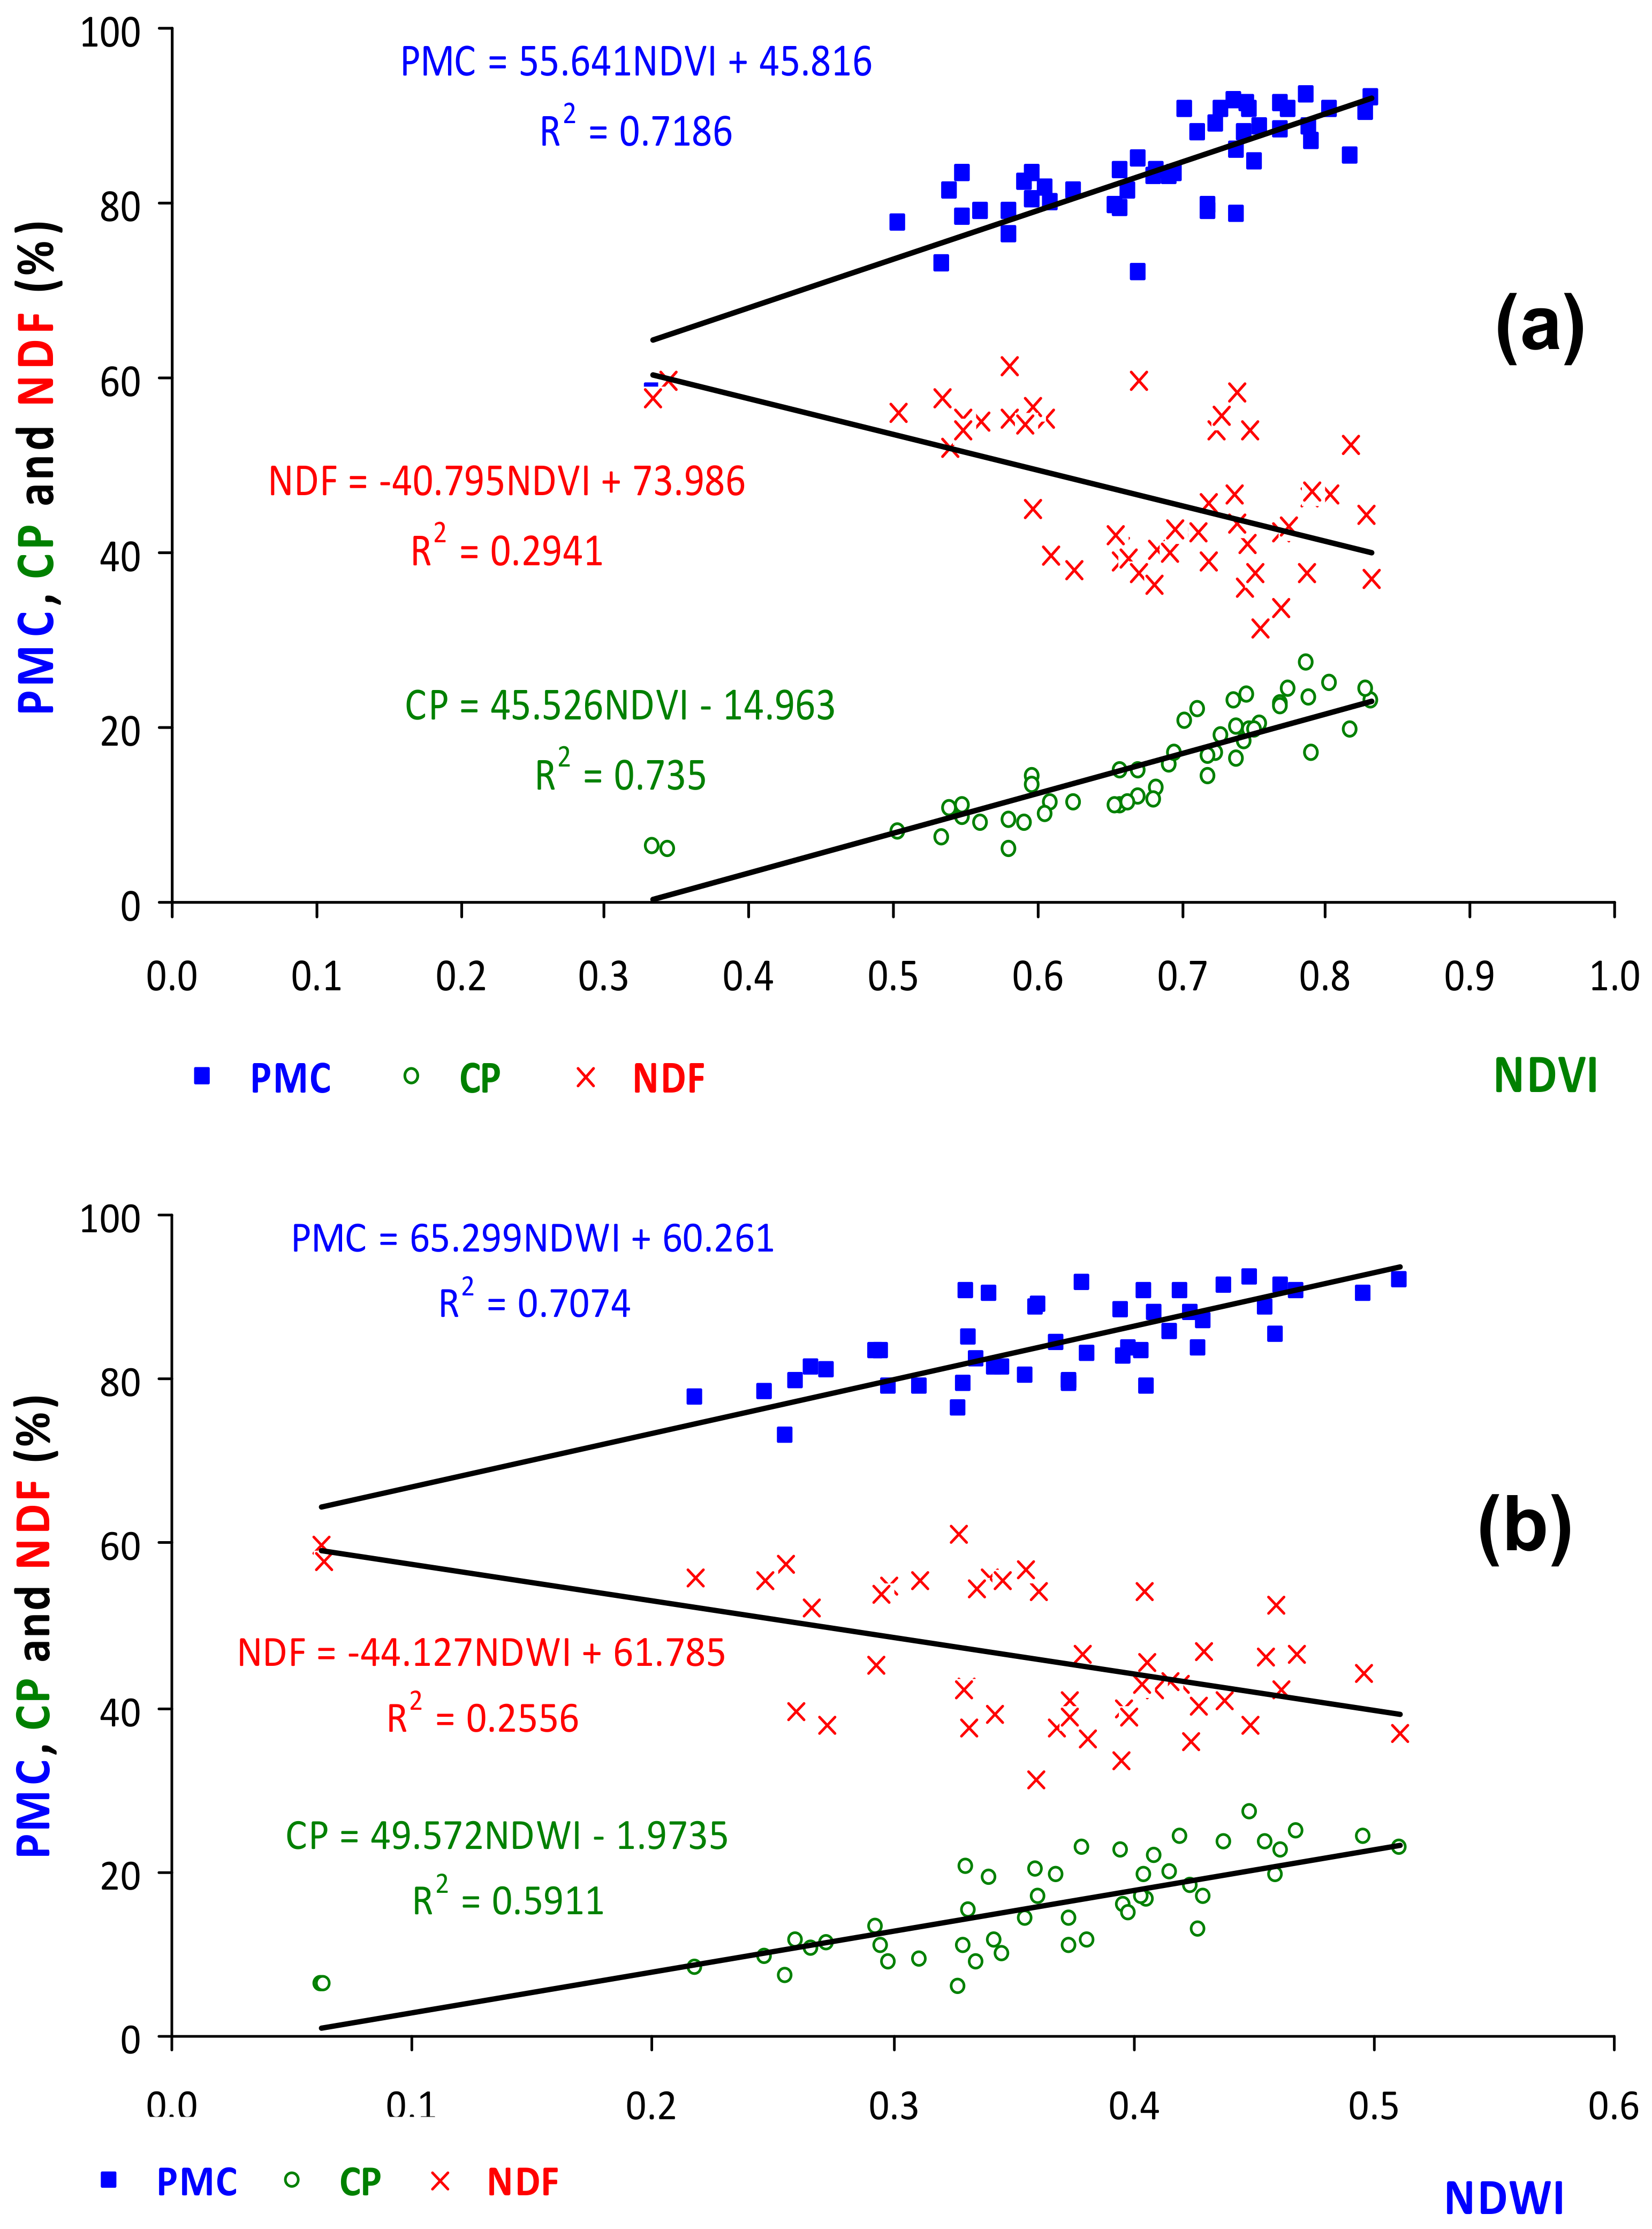
3.4. Relationship between Pasture Quality Parameters and Indices Obtained by Remote Sensing

The mean values of NDVI and NDWI time series records retrieved between July 2020 and June 2021 are presented in Figure 15. In addition to the pattern of evolution of these indices in the experimental field, it is possible to confirm (Figure 15a) one of the limitations of the use of satellite imagery: the occurrence of cloudy days in the region throughout the year, particularly in the autumn and winter months (especially between November and February). The presence of clouds affected about 50% of the images (35 out of 71). The strong correlation between these two indices (R2 = 0.97) is also presented (Figure 15b).
The patterns of mean values of NDVI (Figure 16a) and NDWI (Figure 16b), indicate a level of greater vegetative vigor, in the two experimental fields (“Field A” and “Field B”), between December 2020 and April 2021, with a sharp drop from May 2021 onwards. The “Field A”, however, also shows a significant drop of these two indices (NDVI and NDVI) in March 2021, followed by an important recovery in April.
One of the constraints of remote sensing of permanent grasslands in open woodland such as Dehesa (in Spain) or Montado (in Portugal) is the presence of scattered trees. The spatial resolution of Sentinel-2 encourages the use of open pasture areas where there is no influence of trees on the pixel reflectance [24]. In this study, only the satellite images corresponding to open zones (no trees) were used. The results of regression analysis (p < 0.05) between pasture quality parameters (PMC, CP and NDF) and NDVI (Figure 17a) or NDWI (Figure 17b) show high R2 for PMC (0.71–0.72) and for CP (0.59–0.74) and relatively low values for fiber (0.26–0.29).

4. Discussion

The Montado is a complex ecosystem, since it integrates biodiverse pasture species, trees and grazing animals [4]. The Mediterranean climate, with marked seasonality and inter-annual irregularity of temperature and precipitation, has an unpredictable effect on the pattern of pasture development [41]. In addition to different vegetation types, the annual variations of floristic composition and vegetation dynamics introduce significant variability and uncertainty [3]. Further, the situation becomes more complicated when grazing animals are involved, creating specific spatial patterns of sward biomass that change throughout the year with considerable effects on the spatial heterogeneity of the grassland field [3]. This whole context makes the incorporation of technology into extensive cattle production a huge challenge.
The objective of this work was to show the potential of some PA technologies to monitor soil or pasture in extensive livestock production systems and support grazing management decisions, contributing to a holistic approach to the maintenance of the Montado Mediterranean ecosystem.
The use of spatial information technology in livestock farming, such as global navigation satellite systems (GNSS), geographical information systems (GIS), geostatistical techniques, VRT, proximal and remote sensing, has increased rapidly over the past decade for research purposes and also in on-farm applications. In addition to the technological incorporation, the use of simulation modelling is very important for understanding the impact of grazing management variables (e.g., grazing season and stocking rate), and biotic and abiotic factors on the pasture productivity [29] or pasture degradation [5], and the respective validation using real-working observations [42].

4.1. Variability of Soil and Pasture Parameters

Pastures are highly heterogeneous systems due to variations in sward structure, composition, and phenology, as well as continuous changes caused by different drivers such as environmental factors and grazing [16]. The spatial variability in soils used for livestock production at farm and paddock scale is usually very high [43]. The important spatial variability of soil (particularly K2O, CEC, P2O5, and OM) and pasture (DM, CP, and NDF) parameters revealed in our study confirms the findings of previous studies in the same ecosystem in Portugal [4,26] and Spain [23,24]. The characteristics of soil genesis, the presence of trees, the livestock grazing and the interaction with seasonality and inter-annual variability of the Mediterranean climate, are factors that determine a marked spatial variability [6]. Soil moisture availability is a key factor in plant growth and vegetation development [44]. The distinct wet and dry seasons affect pasture growth throughout the year [18]. The climatic seasonality characteristic of the Mediterranean region has a marked impact on the pattern of availability of dryland pastures, with high yields in the spring period (April to June) and a drastic drop during the dry summer months (July to September) [41]. The nutritional value of a plant depends on many factors, including, among others, the type of soil on which it is grown, the amount of precipitation and fertilizer doses, as well as its development stage at harvest [30]. The tendency for a decrease in pasture quality (decrease of PMC and CP and inverse pattern of NDF) as the vegetative cycle progresses with a significant break in the final phase is documented by several works [22,41,45]. Monitoring this evolution of pasture availability and quality is essential for the purpose of supporting management decisions related (for example, with grazing intensity, rotation between plots or with animal feed supplementation) [20,41].
The results of this study show that tree canopy is the most influential factor in terms of variability of soil characteristics and pasture availability. Scattered trees lead to a great spatial variation of soil conditions, generating islands of higher soil quality (as evidenced by our results in terms of OM and macronutrients), improving soil physical properties, and affecting productivity and quality in understory vegetation compared with surrounding open zones [46].
On the other hand, preferential use of certain areas of pasture and heterogeneous urine and fecal livestock deposition leads to a greater concentration and an uneven distribution of soil nutrients, mainly P and K macronutrients [47]. Rivero et al. [47] refer a higher animal occupancy rate at open grassland (with greater herbage availability) compared to areas under tree canopies, particularly in cold winters. The same authors refer that low herbage nutritional value (and higher temperatures) in summer causes greatly concentrated grazing activity around trees, whilst winter and early spring herbage of high nutritional value and low herbage mass motivate more widely dispersed grazing.
Although heterogeneity among natural grassland plots is one of the main constraints in the application of PA technologies and routines, the potential for profitability increases with heterogeneity of the system [3]. Understanding this spatial variation within a field is the first step for site-specific crop management [43]. According to Serrano et al. [48], the basis for grazing management is the measurement of the spatial variability of pasture soil and vegetation; in turn, the physical and chemical properties of the soil are one of the factors most affecting pasture biomass, so they must be considered in delimiting homogeneous zones.

4.2. Homogeneous Management Zones (HMZ)

Ecosystem heterogeneity results in spatial variability, which, from an economic and environmental conservation perspective, requires differentiated management, varying the application of inputs according to soil and crop requirements [49]. The results of our study showed that data based on ECa and topographic surveys can be used as support tools for implementing site-specific management of fields [43], with permanent pastures, such as those in the Montado or Dehesa ecosystems, in the southwest of the Iberian Peninsula [13]. These results also validate works published in recent years with the same purpose and in the same ecosystem [13,50]. According to Cicore et al. [10], ECa has the potential to be used as a pasture yield variability estimator due to the fact that some of the soil properties that are related to this parameter have a high spatial heterogeneity in soils used for livestock production. Although the ECa does not have a direct relationship with the growth and yield of plants, the spatial pattern of ECa is temporally stable (unlike yield measurements) and is correlated with soil properties that do affect crop productivity, which offers a better basis for delineation of HMZ [51].
The ECa maps obtained in this field reveal low values (<2 mS m−1) in practically the entire monitored area, which reflects the topsoil coarse texture [51]. The low values of mean soil pH (<6.0) and P2O5 (26–46 mg kg−1) justify the usual and primary application of these HMZ maps in differential soil amendment and differential application of phosphate fertilizer [41] with variable rate technology (VRT) and with the aim of contributing to the optimization of pasture soil fertility [13].
The validation process of these HMZ was carried out through soil parameters (clay, pH, OM, CEC, P2O5, and K2O) as well as pasture productivity (biomass) and vegetative vigor (NDVI), which is in line with similar works carried out in other fields of the same ecosystem and in the same region [13,50,52]. However, in livestock systems, the practice of defining HMZ should extend to the dynamic management of animal grazing and its impact on pasture productivity, quality, and biodiversity. When pasture quality starts to decrease, animal performance tends to be negatively affected unless supplementation strategies are applied [20].
In addition to animal feed supplementation, another important aspect of applying HMZ to grazing management is related to the impact on pasture quality. For instance, the relative amount of time animals spent displaying different behaviors throughout the grazing area could help to identify those areas that are overused (grazing hotspots) or resting sites and underused areas. This could inform the development of management strategies to modify cattle distribution in the landscapes, such as decreasing overgrazing and nutrient accumulation limited to small areas in resting sites through strategic location (for example, of water or mineral supplements) [47].
The HMZ approach can also be used to prevent pasture degradation and improve pasture biodiversity and resilience, which are aspects that are particularly important in the context of the challenges of climate change [53]. Plant communities composed of different species functional groups (which is the case of the biodiverse pastures used in this study), with different responses to change (climatic, but also timed and repeated management throughout the growing season, such as cutting, grazing or fertilizer application) are expected to exhibit greater yield temporal stability, since they are more resistant or resilient to environmental or biological disturbances [54]. Additionally, biodiverse pastures with adequate proportions of the different families, namely grasses and legumes, possess higher nutritional value, since CP content depends on the contribution of the legume proportion to the sward mixture [30]. According to Luscher et al. [55], the development of legume-based grassland–livestock systems undoubtedly constitutes one of the pillars of more sustainable and competitive ruminant production systems.

4.3. Pasture Floristic Composition (PFC) as Bio-Indicator of Field Management

The spatial pattern of floristic composition in permanent biodiverse pastures in a given area is the expression of the accumulated effect of several factors over time, namely, the characteristics of the soil (e.g., texture, pH, fertility, moisture), the relief, the proximity of trees, the evolution of temperature and precipitation throughout the vegetative cycle, as well as the grazing management variable. In addition to all of these factors applied to the selection of botanical species that constitute the initial mixture based mainly on their productivity in the local environment, according to ecological theory, we should also consider complex factors related to the positive interactions and differential tolerance to disturbance and stress among species [54]. PFC, on the one hand, reflects the complexity of factors involved in the dynamics of Montado ecosystem and, on the other, determines pasture productivity and quality.
One of the problems of the topsoil of this ecosystem in the southern region of Portugal is the low phosphorous content and the implications on pasture productivity [41,56,57]. The surface application of fertilizers (not incorporated into the soil through mobilization), a common procedure in pastures [41], has a delayed effect on soil pH and fertility [58] and, therefore, it can take several years for its affect to become noticeable. It is not surprising, therefore, that “fertilizer level” (differentiated application of phosphate fertilizer in October 2020) did not result in May 2021 in significant differences in pasture biodiversity indicators (“richness” and “TCS”) and only one significant bio-indicator species associated with the highest level of fertilization (the grass Avena barbata of Poaceae family; 240 kg ha−1 of fertilizer). Hawkins et al. [42] refers to a study of six years of applying treatments and the need for more time required to judge whether it resulted in changes in plant composition, suggesting that some plants apparently disappeared and can reappear in subsequent years. Also, Serrano et al. [28] showed the interest in monitoring the evolution of the floristic composition of a pasture grazed by sheep for several years (in this case also for the six-year period from 2015 to 2020), to evaluate the effect of soil amendment and fertilization in areas under and outside tree canopy.
Regarding to rotational grazing variables, in this study different stocking rates were considered throughout the vegetative cycle of the pasture and with different objectives for each field: while “Field A” area provides pasture fundamentally for in situ grazing, the aim of “Field B” is to accumulate green matter for cutting (mowing) and conservation, to be distributed to animals in the periods of greatest need, especially in summer. In terms of PFC, “grazing system” treatment did not present significant differences in the pasture biodiversity indicators (“richness” and “TCS”). After all, ISA application shows one significant bio-indicator species for each “grazing system” (Gaudinia fragilis of Poaceae family in “Field A”—system of pasture for “field grazing”; Plantago lanceolata of Plantaginaceae family in “Field B”—system of “pasture mowing”). As in the evaluation of the “fertilizer level” effect, also the “grazing system” variable justifies the follow-up and monitoring of the PFC over a longer period of years to assess the stability of these or other bio-indicator species, particularly in face of climatic irregularity. The increasingly frequent extreme weather conditions associated with global climatic changes, especially long-term droughts, have an impact on variability of the grasslands [30].
As with the impact on soil and on pasture productivity and quality, the results of this study show that “tree canopy” is the factor with the greatest impact on the PFC, with better indicators in OTC areas (richness = 15.2 ± 1.8; TCA = 104.5 ± 5.5%) in comparison to UTC areas (richness = 11.7 ± 4.0; TCA = 79.8 ± 16.3%). This greater species richness in OTC areas is also evident in the ISA application, with seven bio-indicator species of four families (Poaceae, Asteraceae, Plantaginaceae, and Fabaceae), while UTC areas showed only three bio-indicator species of two families (Poaceae and Brassicaceae). According to Luscher et al. [55] plant communities with higher number of species (richness) could be a promising strategy for sustainable intensification since these are expected to: (i) better utilize available resources due to species-niche complementarity; (ii) have a higher probability of showing positive interspecific interactions; and (iii) may contain highly productive species that dominate the community (selection effect).
This effect of trees on pasture is a direct consequence of the extent to which they modify the microclimate and soil properties [45]. The significant differences in pasture phenology and quality under and outside tree canopy were also referred by Fernandez-Habas et al. [24] and demonstrated by Serrano et al. [4] in biodiverse dryland pastures grazed by sheep. However, this advantage of OTC areas in terms of biodiversity, assessed at a given moment of pasture vegetative cycle, corresponding to the peak of production (May), should also be placed in an integrated perspective, which contemplates the supply of DM or CP (in kg ha−1) throughout the growing season. In our study, these variables (DM and CP) had higher values in UTC areas on the last three evaluation dates (March, May and June).

4.4. Relationship between Pasture Quality Parameters and Indices Obtained by Remote Sensing

Pasture monitoring based only on field measurements is time-consuming, costly, and spatial limited, making it difficult to implement in large scale [59]. Monitoring pasture quality through technological approaches is a challenge which fits into a perspective of providing information to support decision making in extensive livestock production systems. According to Pearson et al. [18] the strong relationships between vegetation indices and animal performance demonstrate the importance of vegetation quality monitoring in extensive production systems.
Several studies show that the use of remote sensing (RS) technologies (in particular, Sentinel-2 satellite imagery) is a promising tool for estimating pasture botanical composition, structure, phenology, quantity, or quality in highly diverse Mediterranean permanent grassland [24,47]. The increasing availability of satellite images, their spatial continuity and extent, spectral crop information and low cost, provides added value and can address numerous uses in agriculture and lower the threshold of implementing precision farming practices by providing a preliminary spatial field assessment [7]. RS data combined with field measurements is an affordable way to monitor pasture areas, allowing for the monitoring of the spatiotemporal evolution of pasture management indicators at different scales [24] and the statistical validation of prediction models [20].
Our results show that NDVI and NDWI indices obtained by RS reflected the patterns of grassland vegetative vigor throughout the development cycle, from emergence (October), to peak production (May), also reflecting the break in late spring (June). The regression analysis between NDVI or NDWI and pasture quality parameters also show high R2 values (0.71–0.72 between RS indices and PMC and 0.59–0.74 between RS indices and CP), similar values to those obtained in other experimental fields of Southern Portugal [20,21,22]. These values are within the range of those obtained by Pullanagari et al. [6] or Zhao et al. [60], which, according to Albayrak [61], can be attributed, in the case of the “vegetation index” (NDVI), to the absorbance of visible radiance by the existing chlorophyll in green vegetation (NDVI is chlorophyll sensitive) [18,20]. In the case of “water index” (NDWI), these results corroborate the findings of Wang et al. [62] and Serrano et al. [21], which suggests that shortwave infrared band captures important information on seasonally variable water status throughout the pastures vegetative cycles. The practical interest of these results, related to the integration of satellite-derived NDVI and NDWI in site-specific management of the Montado ecosystem, is the possibility of supporting the decision-making process when the farmer intends to intensify the production (irrigation, fertilization, or dynamic grazing management) [21]. The fact that the pasture CP content information can be collected in near-real time supports the hypothesis that the approach can be used to define the time to start and end feed supplementation, to adjust stocking rates and plan the spatio-temporal livestock grazing, with potential for productivity gains as well as improved animal welfare [18,24].
In contrast, the R2 values between RS indices and NDF are low (0.26–0.29). Few studies have investigated the potential of Sentinel-2 configuration to assess fiber content in pastures [24], however, these values are clearly lower than those obtained by Zhao et al. [61] (R2 = 0.58) or by Fernandez-Habas et al. [24] (R2 = 0.48). One of the factors affecting the prediction accuracy of these models is the high species diversity of the permanent grasslands analyzed in this study. Heterogeneous pastures with multiple functional groups and different phenological stages might produce confounding effects on the relationship between pasture quality variables and reflectance [24]. These results, relating to fiber (NDF), justify further detailed research to evaluate RS application in Mediterranean permanent grasslands using Sentinel-2, including exploring the possibility of improving predictions using separate models for specific phenological stages or mixtures in high-diversity Mediterranean grassland [24].
This study also demonstrates the major disadvantage of optical satellite imagery: the dependence on a clear, cloud-free view of the object of interest, which is especially challenging in temperate regions [7]. A viable alternative to overcome this difficulty could be the fusion of the RS data with proximal sensors [20,63], by extracting complementary information from multiple sensors or sources [51], simultaneously solving the difficulty associated with access to under the tree canopy in the Montado ecosystem [20]. In this same line of complementarity of sensors, another important development with application in the context of extensive animal production is the combination of RS technologies with GPS collars and accelerometers, which can help track animal behavior [42]. Combining RS, real-time GPS tracking information with other bio-loggers of grazing behavior aligned with three benefits (environment, production, and welfare) could be integrated into a precision livestock approach representing an integrative tool for improving the sustainability of ruminant grazing systems through designing “smart farms” [47]. Understanding the behavior of grazing animals in the field, (i.e., how grazing animals spread and move across pasture and what activities they perform in each area) is crucial in order to develop management strategies (e.g., areas which are not suitable for grazing and others where grazing can be maximized, strategically positioning water troughs or supplemental feed stations) that will increase the potential productivity of the grazing systems and also decrease their negative impact on the environment [47,53].
Another aspect to mention regarding NDVI is that it suffers from scaling issues and saturation signals at higher densities, besides being susceptible to canopy background fluxes, with the most significant decrease occurring at dense canopy background brightness [64]. This constraint shows that in general, multi-data sources will be required to have concrete field status for farm management purposes. One possibility in prospective future works may be to use single or multiple vegetation indices derived from synthetic-aperture radar (SAR) data (e.g., C-band from Sentinel-1 satellite).

5. Conclusions

This is an exploratory study, applied to real-scale cattle grazing management, which assesses the potential of increasing technological incorporation into the monitoring of the Montado ecosystem. Researchers have recognized that this is complex challenge, due to the inherent heterogeneity and the high number of variables involved, but it is simultaneously stimulating as it provides different technological approaches and levels of intervention. The results show the interest in sensors for monitoring soil ECa associated with GNSS receivers as tools for an expeditious survey of soil spatial variability. This georeferenced information, subject to geostatistical treatments, allows the delimitation of HMZ, structural elements that define the units for the implementation of strategies for differentiated management of variability. It is intended, therefore, to optimize the use of inputs, (e.g., fertilizers, correctives, seeds or feed supplements), ensuring a more sustainable and economically profitable management. The indices obtained from satellite (Sentinel-2) imagery time series (NDVI and NDWI) open good perspectives for the application of RS in the monitoring of the vegetative vigor of the pasture. Obtaining these indices with interesting spatial and temporal resolution and without cost provide decisive elements for decision-making in the dynamic management of grazing (e.g., stocking rates, time, and areas of grazing, need of supplementation).
This work can be replicated in several other areas in order to obtain a better representation of the complexity and diversity of this ecosystem, thus integrating inter-annual climate variability and the adaptive response of the pasture, namely through the evaluation of the floristic composition as a bio-indicator (which also envisages in this application the potential of remote sensing technologies).

Author Contributions

Conceptualization, J.S.; methodology, J.S., L.R., A.D.F.B., E.C., L.L.P., F.M., L.P. and J.M.d.S.; software, J.S., L.L.P., F.M., L.P. and J.M.d.S.; validation, J.S. and S.S.; formal analysis, J.S.; investigation, J.S. and L.R.; resources, J.S.; data curation, J.S. and S.S.; writing—original draft preparation, J.S.; writing—review and editing, J.S. and S.S.; visualization, J.S.; supervision, J.S.; project administration, J.S.; funding acquisition, J.S. All authors have read and agreed to the published version of the manuscript.

Funding

This work was funded by National Funds through FCT (Foundation for Science and Technology) under the Project UIDB/05183/2020 and by the projects PDR2020−101-030693 and PDR2020−101-031244 (“Programa 1.0.1-Grupos Operacionais”).

Institutional Review Board Statement

Not applicable.

Informed Consent Statement

Not applicable.

Data Availability Statement

Not applicable.

Conflicts of Interest

The authors declare no conflict of interest.

References

  1. Serrano, J.; Shahidian, S.; Marques da Silva, J.; Silva, L.L.; Sousa, A.; Baptista, F. Differential vineyard fertilizer management based on nutrient’s spatio-temporal variability. J. Soil Sci. Plant Nutr. 2017, 17, 46–61. [Google Scholar]
  2. Serrano, J.; Shahidian, S.; Marques da Silva, J.; Paixão, L.; Moral, F.; Carmona-Cabezas, R.; Garcia, S.; Palha, J.; Noéme, J. Mapping management zones based on soil apparent electrical conductivity and remote sensing for implementation of variable rate irrigation: Case study of Corn under a center pivot. Water 2020, 12, 3427. [Google Scholar] [CrossRef]
  3. Schellberg, J.; Hill, M.J.; Gerhards, R.; Rothmund, M.; Braun, M. Precision agriculture on grassland: Applications, perspectives and constraints. Eur. J. Agron. 2008, 29, 59–71. [Google Scholar]
  4. Serrano, J.; Shahidian, S.; Costa, F.; Carreira, E.; Pereira, A.; Carvalho, M. Can soil pH correction reduce the animal supplementation needs in the critical autumn period in Mediterranean Montado ecosystem? Agronomy 2021, 11, 514. [Google Scholar] [CrossRef]
  5. Yu, H.; Wang, L.; Wang, Z.; Ren, C.; Zhang, B. Using Landsat OLI and random forest to assess grassland degradation with aboveground net primary production and electrical conductivity data. Int. J. Geo-Inf. 2019, 8, 511. [Google Scholar]
  6. Pullanagari, R.; Yule, I.; Tuohy, M.; Hedley, M.; Dynes, R.; King, W. Proximal sensing of the seasonal variability of pasture nutritive value using multispectral radiometry. Grass Forage Sci. 2013, 68, 110–119. [Google Scholar]
  7. Georgi, C.; Spengler, D.; Itzerott, S.; Kleinschmit, B. Automatic delineation algorithm for site-specific management zones based on satellite remote sensing data. Precis. Agric. 2018, 19, 684–707. [Google Scholar]
  8. Costa, M.M.; Queiroz, D.M.; Pinto, F.A.C.; Reis, E.F.; Santos, N.T. Moisture content effect in the relationship between apparent electrical conductivity and soil attributes. Acta Sci. 2014, 36, 395–401. [Google Scholar] [CrossRef] [Green Version]
  9. Schenatto, K.; Souza, E.G.; Bazzi, C.L.; Gavioli, A.; Betzek, N.M.; Beneduzzi, H.M. Normalization of data for delineating management zones. Comput. Electron. Agric. 2017, 143, 238–248. [Google Scholar]
  10. Cicore, P.L.; Castro Franco, M.; Peralta, N.R.; Marques da Silva, J.R.; Costa, J.L. Relationship between soil apparent electrical conductivity and forage yield in temperate pastures according to nitrogen availability and growing season. Crop. Pasture Sci. 2019, 70, 908–916. [Google Scholar]
  11. Stepien, M.; Samborski, S.; Gozdowski, D.; Dobers, E.S.; Chormanski, J.; Szatylowicz, J. Assessment of soil texture class on agricultural fields using ECa, Amber NDVI, and topographic properties. J. Plant Nutr. Soil Sci. 2015, 178, 523–536. [Google Scholar]
  12. Serrano, J.; Shahidian, S.; Da Silva, J.M.; Paixão, L.; Calado, J.; De Carvalho, M. Integration of soil electrical conductivity and indices obtained through satellite imagery for differential management of pasture fertilization. AgriEngineering 2019, 1, 567–585. [Google Scholar] [CrossRef] [Green Version]
  13. Moral, F.J.; Serrano, J.M. Using low-cost geophysical survey to map soil properties and delineate management zones on grazed permanent pastures. Prec. Agric. 2019, 20, 1000–1014. [Google Scholar]
  14. Gavioli, A.; Souza, E.G.; Bazzi, C.L.; Schenatto, K.; Betzek, N.M. Identification of management zones in precision agriculture: An evaluation of alternative cluster analysis methods. Biosyst. Eng. 2019, 181, 86–102. [Google Scholar]
  15. Cordoba, M.A.; Bruno, C.I.; Costa, J.L.; Peralta, N.R.; Balzarini, M.G. Protocol for multivariate homogeneous zone delineation in precision agriculture. Biosyst. Eng. 2016, 143, 95–107. [Google Scholar]
  16. Moral, F.J.; Rebollo, F.J.; Serrano, J.M. Estimating and mapping pasture soil fertility in a portuguese montado based on a objective model and geostatistical techniques. Comput. Electron. Agric. 2019, 157, 500–508. [Google Scholar] [CrossRef]
  17. Teague, W.R.; Dowhower, S.L.; Waggoner, J.A. Drought and grazing patch dynamics under different grazing management. J. Arid Environ. 2004, 58, 97–117. [Google Scholar]
  18. Pearson, C.; Filippi, P.; González, L.A. The relationship between satellite-derived vegetation indices and live weight changes of beef cattle in extensive grazing conditions. Remote Sens. 2021, 13, 4132. [Google Scholar]
  19. Moral, F.J.; Rebollo, F.J.; Serrano, J.M. Delineating site-specifc management zones on pasture soil using a probabilistic and objective model and geostatistical techniques. Prec. Agric. 2020, 21, 620–636. [Google Scholar] [CrossRef]
  20. Serrano, J.; Shahidian, S.; Da Silva, J.M. Monitoring seasonal pasture quality degradation in the Mediterranean montado ecosystem: Proximal versus remote sensing. Water 2018, 10, 1422. [Google Scholar] [CrossRef] [Green Version]
  21. Serrano, J.; Shahidian, S.; Marques da Silva, J. Evaluation of normalized difference water index as a tool for monitoring pasture seasonal and inter-annual variability in a Mediterranean agro-silvo-pastoral system. Water 2019, 11, 62. [Google Scholar] [CrossRef] [Green Version]
  22. Serrano, J.; Shahidian, S.; Paixão, L.; Marques da Silva, J.; Morais, T.; Teixeira, R.; Domingos, T. Spatiotemporal patterns of pasture quality based on NDVI time-series in Mediterranean Montado ecosystem. Remote Sens. 2021, 13, 3820. [Google Scholar]
  23. Lugassi, R.; Chudnovsky, A.; Zaady, E.; Dvash, L.; Goldshleger, N. Spectral slope as an indicator of pasture quality. Remote Sens. 2015, 7, 256–274. [Google Scholar]
  24. Fernández-Habas, J.; Moreno, A.M.G.; Hidalgo-Fernández, M.A.T.; Leal-Murillo, J.R.; Oar, B.A.; Gámez-Giráldez, P.J.; González Dugo, M.P.; Fernández-Rebollo, P. Investigating the potential of Sentinel-2 configuration to predict the quality of Mediterranean permanent grasslands in open woodlands. Sci. Total Environ. 2021, 791, 148101. [Google Scholar]
  25. Serrano, J.; Shahidian, S.; Marques da Silva, J. Calibration of GrassMaster II to estimate green and dry matter yield in Mediterranean pastures: Effect of pasture moisture content. Crop. Pasture Sci. 2016, 67, 780–791. [Google Scholar] [CrossRef]
  26. Serrano, J.; Shahidian, S.; Moral, F.; Carvajal-Ramirez, F.; Marques da Silva, J. Estimation of productivity in dryland Mediterranean pastures: Long-term field tests to calibration and validation of the Grassmaster II probe. AgriEngineering 2020, 2, 240–255. [Google Scholar] [CrossRef]
  27. Serrano, J.; Shahidian, S.; Da Silva, J.M.; Sales-Baptista, E.; De Oliveira, I.F.; De Castro, J.L.; Pereira, A.; De Abreu, M.C.; Machado, E.; De Carvalho, M. Tree influence on soil and pasture: Contribution of proximal sensing to pasture productivity and quality estimation in montado ecosystems. Int. J. Remote. Sens. 2017, 39, 4801–4829. [Google Scholar]
  28. Serrano, J.; Shahidian, S.; Machado, E.; Paniagua, L.L.; Carreira, E.; Moral, F.; Pereira, A.; Carvalho, M. Floristic composition: Dynamic biodiversity indicator of tree canopy effect on dryland and improved Mediterranean pastures. Agriculture 2021, 11, 1128. [Google Scholar]
  29. Xiao, X.; Zhang, T.; Angerer, J.P.; Hou, F. Grazing seasons and stocking rates affects the relationship between herbage traits of Alpine meadow and grazing behaviors of Tibetan sheep in the Qinghai–Tibetan Plateau. Animals 2020, 10, 488. [Google Scholar] [CrossRef] [Green Version]
  30. Borawska-Jarmułowicz, B.; Mastalerczuk, G.; Janicka, M.; Wróbe, B. Effect of silicon-containing fertilizers on the nutritional value of grass–legume mixtures on temporary grasslands. Agriculture 2022, 12, 145. [Google Scholar] [CrossRef]
  31. FAO. World Reference Base for Soil Resources; World Soil Resources Reports N 103; Food and Agriculture Organization of the United Nations: Rome, Italy, 2006. [Google Scholar]
  32. Peel, M.C.; Finlayson, B.L.; McMahon, T.A. Updated world map of the Köppen-Geiger climate classification. Hydrol. Earth Syst. Sci. 2007, 11, 1633–1644. [Google Scholar] [CrossRef] [Green Version]
  33. Webster, R.; Oliver, M.A. Geostatistics for Environmental Sciences; John Wiley & Sonns Ltd: Hoboken, NJ, USA, 2007. [Google Scholar]
  34. Egner, H.; Riehm, H.; Domingo, W.R. Utersuchungeniiber die chemische Bodenanalyse als Grudlagefir die Beurteilung des Nahrstof-zunstandes der Boden. II. K. Lantbrhogsk. Annlr 1960, 20, 199–216. (In German) [Google Scholar]
  35. AOAC. Official Method of Analysis of AOAC International, 18th ed.; AOAC International: Arlington, TX, USA, 2005. [Google Scholar]
  36. Braun-Blanquet, J. Pflanzensoziologie, 3rd ed.; Grundzüge der Vegetationskunde; Springer: Vienna, Austria; New York, NY, USA, 1964. [Google Scholar]
  37. Franco, J.A. Nova Flora de Portugal; Sociedade Astória: Lisboa, Portugal, 1984; Volumes I and II. (In Portuguese) [Google Scholar]
  38. Franco, J.A.; Rocha Afonso, M.L. Nova Flora de Portugal; Escolar Editora: Lisboa, Portugal, 2003; Volume III. (In Portuguese) [Google Scholar]
  39. Shore, A. DESeq and Indicator Species Analysis R Script; Figshare Software: Cambridge, MA, USA, 2020. [Google Scholar]
  40. Dufrêne, M.; Legendre, P. Species assemblages and indicator species: The need for a flexible asymmetrical approach. Ecol. Monogr. 1997, 67, 345–366. [Google Scholar] [CrossRef]
  41. Efe Serrano, J. Pastures in Alentejo: Technical basis for Characterization, Grazing and Improvement; University of Évora: Évora, Portugal, 2006; pp. 165–178. (In Portuguese) [Google Scholar]
  42. Hawkins, H.J.; Short, A.; Kirkman, K.P. Does Holistic Planned Grazing™ work on native rangelands? Afr. J. Range Forage Sci. 2017, 34, 59–63. [Google Scholar]
  43. Peralta, N.R.; Costa, J.L.; Balzarini, M.; Franco, M.C.; Córdoba, M.; Bullock, D. Delineation of management zones to improve nitrogen management of wheat. Comput. Electron. Agric. 2015, 110, 103–113. [Google Scholar] [CrossRef]
  44. Jong, S.M.; Heijenk, R.A.; Nijland, W.; Meijde, M. Monitoring soil moisture dynamics using electrical resistivity tomography under homogeneous field conditions. Sensors 2020, 20, 5313. [Google Scholar]
  45. Benavides, R.; Douglas, G.B.; Osoro, K. Silvopastoralism in New Zealand: Review of effects of evergreen and deciduous trees on pasture dynamics. Agrofor. Syst. 2008, 76, 327–350. [Google Scholar]
  46. Gómez-Rey, M.X.; Garcês, A.; Madeira, M. Soil organic-C accumulation and N availability under improved pastures established in Mediterranean Oak Woodlands. Soil Use Manag. 2012, 28, 497–507. [Google Scholar] [CrossRef]
  47. Rivero, M.J.; Grau-Campanario, P.; Mullan, S.; Held, S.D.E.; Stokes, J.E.; Lee, M.R.F.; Cardenas, L.M. Factors affecting site use preference of grazing cattle studied from 2000 to 2020 through GPS tracking: A review. Sensors 2021, 21, 2696. [Google Scholar]
  48. Serrano, J.; Peça, J.; Marques da Silva, J.; Shahidian, S. Mapping soil and pasture variability with an electromagnetic induction sensor. Comput. Electron. Agric. 2010, 73, 7–16. [Google Scholar]
  49. Nawar, S.; Corstanje, R.; Halcro, G.; Mulla, D.; Mouazen, A.M. Delineation of soil management zones for variable-rate fertilization: A review. Adv. Agron. 2017, 143, 175–245. [Google Scholar]
  50. Moral, F.J.; Rebollo, F.J.; Serrano, J.M.; Carvajal, F. Mapping management zones in a sandy pasture soil using an objective model and multivariate techniques. Prec. Agric. 2021, 22, 800–817. [Google Scholar]
  51. Heil, K.; Schmidhalter, U. The application of EM38: Determination of soil parameters, selection of soil sampling points and use in agriculture and archaeology. Sensors 2017, 17, 2540. [Google Scholar]
  52. Serrano, J.; Shahidian, S.; Paixão, L.; Marques da Silva, J.; Moral, F. Management zones in pastures based on soil apparent electrical conductivity and altitude: NDVI, soil and biomass sampling validation. Agronomy 2022, 12, 778. [Google Scholar] [CrossRef]
  53. Dasselaar, A.; Hennessy, D.; Isselstein, J. Grazing of dairy cows in Europe—An in-depth analysis based on the perception of grassland experts. Sustainability 2020, 12, 1098. [Google Scholar] [CrossRef] [Green Version]
  54. Distel, R.A.; Arroquy, J.I.; Lagrange, S.; Villalba, J.J. Designing diverse agricultural pastures for improving ruminant production systems. Front. Sustain. Food Syst. 2020, 4, 596869. [Google Scholar]
  55. Luscher, A.; Mueller-Harvey, I.; Soussana, J.F.; Rees, R.M.; Peyraud, J.L. Potential of legume-based grassland–livestock systems in Europe: A review. Grass Forage Sci. 2014, 69, 206–228. [Google Scholar] [PubMed]
  56. Carvalho, M.; Goss, M.J.; Teixeira, D.M. Manganese toxicity in Portuguese Cambisols derived from granitic rocks: Causes, limitations of soil analyses and possible solutions. Rev. Cienc. Agrar. 2015, 38, 518–527. [Google Scholar] [CrossRef]
  57. Serrano, J.; Shahidian, S.; Da Silva, J.M.; Moral, F.; Carvajal-Ramirez, F.; Carreira, E.; Pereira, A.; De Carvalho, M. Evaluation of the effect of dolomitic lime application on pastures—Case study in the Montado Mediterranean ecosystem. Sustainability 2020, 12, 3758. [Google Scholar] [CrossRef]
  58. Serrano, J.M.; Shahidian, S.; Marques da Silva, J.R. Small scale soil variation and its effect on pasture yield in southern Portugal. Geoderma 2013, 195–196, 173–183. [Google Scholar]
  59. Silva, Y.F.; Reis, A.A.; Werner, J.P.S.; Valadares, R.V.V.; Campbell, E.E.; Lamparelli, R.A.C.; Magalhães, P.S.G.; Figueiredo, J.K.D.A. Assessing the capability of MODIS to monitor mixed pastures with high-intensity grazing at a finescale. Geocarto Int. 2021. [Google Scholar]
  60. Zhao, F.; Xu, B.; Yang, X.; Jin, Y.; Li, J.; Xia, L.; Chen, S.; Ma, H. Remote sensing estimates of grassland aboveground biomass based on MODIS net primary productivity (NPP): A case study in the Xilingol grassland of Northern China. Remote Sens. 2014, 6, 5368–5386. [Google Scholar] [CrossRef] [Green Version]
  61. Albayrak, S. Use of reflectance measurements for the detection of N, P, K, ADF and NDF contents in Sainfoin pasture. Sensors 2008, 8, 7275–7286. [Google Scholar] [PubMed] [Green Version]
  62. Wang, X.; Fuller, D.O.; Setemberg, L.; Miralles-Wilhelm, F. Foliar nutrient and water content in subtropical tree islands: A new chemohydro dynamic link between satellite vegetation indices and foliar δ 15N values. Remote Sens. Environ. 2011, 3, 923–930. [Google Scholar] [CrossRef]
  63. Schaefer, M.T.; Lamb, D.W. A combination of plant NDVI and Lidar measurements improve the estimation of pasture biomass in Tall Fescue (Festuca Arundinacea Var. Fletcher). Remote Sens. 2016, 8, 109. [Google Scholar] [CrossRef] [Green Version]
  64. Huete, A.R. A soil adjusted vegetation index (SAVI). Remote Sens. Environ. 1988, 25, 295–309. [Google Scholar] [CrossRef]
Figure 1. Diagram of the experimental approach proposed procedure. PS, pasture sampling; FC, floristic composition; Soil S, soil sampling; ECa, soil apparent electrical conductivity.
Agronomy 12 01212 g001
Figure 2. Approximate sampling locations in field A and field B: areas without trees (“sampling pixels”; outside tree canopy, OTC) and areas under tree canopy (“sampling tree”; UTC).
Agronomy 12 01212 g002
Figure 3. Thermo-pluviometric diagram of the Meteorological Station of Mitra (Évora, Portugal) between July 2015 and June 2020 (a) and between July 2020 and June 2021 (b).
Agronomy 12 01212 g003
Figure 4. Schematic representation of “A” and “B” field management between July 2020 and June 2021.VRT, variable rate technology; ECa, soil apparent electrical conductivity; SS, soil sampling; PS, pasture sampling; RS, remote sensing.
Agronomy 12 01212 g004
Figure 5. Stocking rates used in the experimental fields “A” (a) and “B” (b) (July 2020 to June 2021).
Agronomy 12 01212 g005
Figure 6. Evolution of the pasture quality parameters throughout the vegetative cycle, under tree canopy (UTC; (a)) and outside tree canopy; (OTC; (b)). DOVC, day of the pasture vegetative cycle; PMC, pasture moisture content; CP, crude protein; NDF, neutral detergent fiber.
Agronomy 12 01212 g006
Figure 7. Evolution of the pasture productivity (dry matter, DM, kg ha−1) throughout the vegetative cycle, in “Field A” (a) and “Field B” (b), under tree canopy (UTC) and outside tree canopy (OTC). DOVC, day of the pasture vegetative cycle.
Agronomy 12 01212 g007
Figure 8. Evolution of the pasture productivity (crude protein, CP, kg ha−1) throughout the vegetative cycle, in “Field A” (a) and “Field B” (b), under tree canopy (UTC) and outside tree canopy (OTC). DOVC, day of the pasture vegetative cycle.
Agronomy 12 01212 g008
Figure 9. Soil apparent electrical conductivity (ECa), elevation, and homogeneous management zones (HMZ) of experimental field.
Agronomy 12 01212 g009
Figure 10. Homogenous management zones (HMZ) validation through soil (ivi) and pasture (vii,viii) parameters. Different letters indicate significant differences.
Agronomy 12 01212 g010
Figure 11. Impact of differential fertilizer application levels on sampling areas of the experimental field.
Agronomy 12 01212 g011
Figure 12. Picture of pastures in sampling areas of the two fields (“Field A” and “Field B”), UTC and OTC in May–June 2021.
Agronomy 12 01212 g012
Figure 13. Bio-indicator species of “grazing system” (a) and “fertilizer level” (b). *: Probability < 0.05; **: Probability < 0.01.
Agronomy 12 01212 g013
Figure 14. Bio-indicator species of “tree canopy” effect (UTC, under tree canopy; OTC, outside tree canopy). *: Probability < 0.05; **: Probability < 0.01.
Agronomy 12 01212 g014
Figure 15. (a) Time series records of normalized difference vegetation index (NDVI) and normalized difference water index (NDWI) obtained in sampling pixels between July 2020 and June 2021; (b) relationship between NDVI and NDWI.
Agronomy 12 01212 g015
Figure 16. Pattern of normalized difference vegetation index (NDVI; (a)) and (b) normalized difference water index (NDWI; (b)) obtained in sampling pixels of “Field A” and “Field B” between July 2020 and June 2021.
Agronomy 12 01212 g016
Figure 17. Relationships between mean pasture quality parameters (pasture moisture content, PMC; crude protein, CP; and neutral detergent fiber, NDF) and: (a) mean normalized difference vegetation index (NDVI); (b) mean normalized difference water index (NDWI).
Agronomy 12 01212 g017
Table 1. Dates of pasture sampling and Sentinel-2 imagery capture (remote sensing, RS).
Sampling DatesDate of Pasture SamplingDate of RS
Capture *
Granule **Gap
(Days)
Date 111 December 20205 December 2020L2A_T29SNC_A028491_20201205T112447−6
Date 22 February 202113 February 2021L2A_T29SNC_A029492_20210213T112445+11
Date 330 March 20214 April 2021L2A_T29SNC_A030207_20210404T112443+5
Date 411 May 202114 May 2021L2A_T29SNC_A030779_20210514T112449+3
Date 52 June 20213 June 2021L2A_T29SNC_A031065_20210603T112450+1
* Valid multispectral image (cloudless day) closest to the date of collection of the pasture samples; RS- Remote sensing. ** Granule, minimum indivisible partition of a product (100 × 100 km2 ortho-images in UTM/WGS84 projection).
Table 2. Descriptive statistics (mean, coefficient of variation and range) of the soil parameters (0–0.30 m depth) in each of the two experimental fields (A and B) used in this work.
UTC OTC
ParameterMeanCVRangeMeanCVRange
Field A
Sand (%)81.43.676.2–87.182.64.477.6–85.4
Silt (%)11.719.79.2–13.510.718.59.0–13.3
Clay (%)6.939.13.8–8.96.742.73.2–9.2
pH5.53.75.3–5.85.75.95.3–6.0
OM (%)2.711.02.5–3.01.926.61.3–2.5
P2O5 (mg kg−1)46.063.715–7225.852.415–45
K2O (mg kg−1)148.042.090–23663.583.426–142
CEC (cmol kg−1)12.348.08.0–21.010.370.35.8–21.2
Field B
Sand (%)84.25.081.9–87.285.84.383.2–88.4
Silt (%)7.719.56.7–8.27.217.76.3–8.1
Clay (%)8.125.96.1–9.27.032.35.4–8.6
pH6.02.45.9–6.15.42.65.3–5.5
OM (%)2.311.42.1–2.51.814.91.7–2.0
P2O5 (mg kg−1)39.519.734–4528.060.616–40
K2O (mg kg−1)146.03.9142–15072.023.660–84
CEC (cmol kg−1)7.311.56.7–7.87.66.87.3–8.0
UTC, under tree canopy; OTC, outside tree canopy; CV, coefficient of variation; OM, organic matter; CEC, cationic exchange capacity.
Table 3. Descriptive statistics (mean, coefficient of variation and range) of the pasture parameters in each of the two experimental fields (A and B) used in this work.
UTC OTC
ParameterMeanCVRangeMeanCVRange
Date 1 (11 December 2020)
Field A
DM (kg ha−1)79836.7430–11651011040.44095–16,015
PMC (%)91.03.186.6–94.489.06.078.6–92.4
CP (%)24.321.817.8–31.021.917.816.4–27.2
CP (kg ha−1)192.945.0104.9–331.0208.432.3129.7–312.3
NDF (%)39.217.031.2–47.242.019.735.9–58.2
Field B
DM (kg ha−1)116233.5725–167591719.6650–1120
PMC (%)87.24.979.9–92.490.51.088.9–91.8
CP (%)21.432.612.9–33.620.613.116.8–24.3
CP (kg ha−1)231.921.8181.3–320.4187.320.7148.5–246.8
NDF (%)51.317.442.1–66.049.312.342.4–55.7
Date 2 (2 February 2021)
Field A
DM (kg ha−1)97528.6655–1455182126.31245–2680
PMC (%)86.91.983.8–88.183.87.272.1–88.7
CP (%)23.211.619.9–26.517.723.611.9–21.9
CP (kg ha−1)226.830.6140.1–332.1315.024.3201.4–392.4
NDF (%)35.626.025.6–47.442.322.331.2–59.5
Field B
DM (kg ha−1)85714.3700–1005157612.71255–1825
PMC (%)88.02.785.8–92.588.42.385.4–90.7
CP (%)21.210.917.4–24.021.914.216.8–24.9
CP (kg ha−1)182.619.3122.0–217.7342.213.6274.5–409.4
NDF (%)44.115.332.4–49.545.013.833.6–52.4
Date 3 (30 March 2021)
Field A
DM (kg ha−1)234616.91680–2890140711.91225–1710
PMC (%)85.23.282.3–89.181.32.679.1–83.7
CP (%)19.214.315.5–21.614.914.911.0–17.1
CP (kg ha−1)447.519.7331.4–531.5209.415.9147.5–243.6
NDF (%)39.59.732.2–42.441.16.238.9–45.5
Field B
DM (kg ha−1)259230.31695–4050210838.71355–3625
PMC (%)80.82.976.9–84.281.72.579.5–85.0
CP (%)12.515.99.8–14.712.013.011.0–15.1
CP (kg ha−1)327.538.5198.1–553.8254.541.8152.1–417.7
NDF (%)44.27.141.0–48.938.85.236.3–42.0
Date 4 (11 May 2021)
Field A
DM (kg ha−1)414726.62835–6125363818.43115–4890
PMC (%)76.24.570.7–81.078.84.873.0–83.5
CP (%)12.225.57.5–15.89.834.55.9–14.3
CP (kg ha−1)522.147.9274.6–949.6350.034.3238.9–552.9
NDF (%)54.42.253.4–56.755.39.845.0–61.2
Field B
DM (kg ha−1)355834.62240–5040319037.22215–5215
PMC (%)71.96.965.5–78.480.62.578.4–83.4
CP (%)10.119.88.8–13.99.78.68.9–10.9
CP (kg ha−1)346.125.1247.3–462.7304.832.3202.3–471.1
NDF (%)60.45.354.5–63.854.42.452.0–55.5
Date 5 (2 June 2021)
Field A
DM (kg ha−1)2842--2660--
PMC (%)38.1--58.5--
CP (%)7.6--6.4--
CP (kg ha−1)215.7--170.2--
NDF (%)61.4--57.8--
Field B
DM (kg ha−1)3518--3212--
PMC (%)53.4--59.5--
CP (%)8.4--6.2--
CP (kg ha−1)294.5--197.7--
NDF (%)60.9--59.7--
UTC, under tree canopy; OTC, outside tree canopy; CV, coefficient of variation; DM, dry matter; PMC, pasture moisture content; CP, crude protein; NDF, neutral detergent fiber.
Publisher’s Note: MDPI stays neutral with regard to jurisdictional claims in published maps and institutional affiliations.

