Article

Effects of Soil Properties and Microbiome on Highbush Blueberry (Vaccinium corymbosum) Growth

1
College of Resources and Environmental Sciences, Nanjing Agricultural University, Nanjing 210095, China
2
Soil Science and Plant Nutrition, UWA School of Agriculture and Environment, The University of Western Australia, 35 Stirling Highway, Perth, WA 6009, Australia
3
Institute for Adriatic Crops and Karst Reclamation, Put Duilova 11, 21000 Split, Croatia
*
Author to whom correspondence should be addressed.
Agronomy 2022, 12(6), 1263; https://doi.org/10.3390/agronomy12061263
Submission received: 11 May 2022 / Revised: 21 May 2022 / Accepted: 21 May 2022 / Published: 25 May 2022

Abstract

:
Blueberry has high nutritional value and is favored by consumers, so the planting area is increasing. However, due to the influence of climate conditions and the edaphic environment, achieving high production and the healthy growth of blueberries has become a major problem. In this study, we collected soil and blueberry plants which had normal and limited growth to determine the underlying causes of poor growth by characterizing soil pH, EC, enzyme activities and the microbiome, plant growth properties, and root metabolites. The results showed that the pH of the blueberry rhizosphere soil was less than 6.0 in the case of plants growing well, and higher than 6.0 in case of plants growing poorly. The activities of acid phosphatase and invertase were significantly higher in the rhizosphere soil of the normally growing than growth-limited blueberry plants. The relative abundance of Proteobacteria and Saccharibacteria was higher in the rhizosphere soil of normally growing than growth-limited blueberry plants and they were positively correlated with activity of soil acid phosphatase. Ascomycota, as the dominant fungi, had the highest relative abundance in the rhizosphere soil of growth-limited blueberry plants. The six metabolites showing enrichment in the KEGG pathway analysis were thymidine, cholic acid, raffinose, p-salicylic acid, astaxanthin, and inosine. It was found that flavonoids were correlated positively with soil fungi abundance. The contents of flavonoids apin, rutin and epigallocatechin were significantly higher in roots of growth-limited than normally growing blueberry plants. The content of the flavonoid daidzin was significantly higher in the roots of poorly growing blueberries compared to normally growing ones. In conclusion, the growth of blueberry was significantly related to soil organic matter, soil enzyme activity and soil microbial community diversity.

1. Introduction

Blueberries belong to the genus Vaccinium of the heath family (Ericaceae) and are native to North America [1]. The fruits and leaves of blueberry contain numerous anthocyanin, flavone, isoflavone, and polyphenol compounds [2]. These substances have a variety of beneficial functions in human health, such as high antioxidant capacity and vascular system protection.
Blueberry plants are suitable for growing in moist, acidic soils with good aeration and drainage [3,4]. Studies have shown that blueberry plants grow best when soil pHwater is 4.2–5.5 [5] and decrease productivity over 1.5 dS/m [6]. Too high or too low of a soil pHwater will affect the normal growth and physiological metabolism process of blueberry. The plant height and stem diameter of blueberry obviously decrease when the soil pHwater is 3.4 and 5.8 [7]. When the soil pHwater was higher than 5.5, the biological yield of blueberry decreased with the increase of soil pHwater [8].
Plants and soil microorganisms co-exist in a complex ecological community. Soil microorganisms decompose organic matter and thus cycle nutrients. Some soil rhizosphere microorganisms may stimulate plant growth and development, particularly by producing plant hormones [9]. Simultaneously, roots secrete complex metabolites that provide the root microbial flora with the energy and nutrients needed for growth [10]. For example, soybean promotes the colonization by arbuscular mycorrhizal fungi via increasing the concentration of flavonoids and polyamines in roots [11]. Soil microorganisms change plant signal transduction and metabolism by secreting secondary metabolites, and plants exude a range of metabolites, some of which lead to the selective enrichment of specific microorganisms in the rhizosphere soil [12]. For example, the exudation of isoflavones significantly influenced bacterial diversity in the soybean rhizosphere [13]. Hence, plant-microbe interactions in the rhizosphere provide distinct environments with different composition and structure of the soil microbiome. However, the knowledge on the interactions between blueberry plants and the rhizosphere soil microbiome is scant.
In the present study, by analyzing and comparing the soil chemical properties, soil microbiome and root metabolome of normally growing and growth-limited blueberry plants, we characterized the interactions between plants and their rhizosphere soil, and thus the soil factors (pH, EC, enzyme activities and microbiome, etc.) that limited the growth of blueberries were put forward in order to better plant blueberry.

2. Materials and Methods

The sampling site was located in Fuhe Blueberry Picking Park, Shitouzhai Village, Baima Town, Lishui District, Nanjing City, Jiangsu Province (31°31′31.86′′ N, 119°08′27.09′′ E). The blueberries in the area have been planted into ameliorated soil, resulting in a high initial investment cost. These blueberry fruit trees have been affected by unknown factors to varying degrees for more than 10 years. Different varieties of blueberries were planted in different parts of the plantation, with identical fertilization treatment and manual weeding.

2.1. Sample Collection

In mid-July 2020, we randomly selected 30 blueberry plants with normal growth (no yellowing in plant leaves) and 30 plants with limited growth (the percentage of the yellowing of plant leaves exceeded 60%) in the part of the plantation with southern highbush blueberry (Vaccinium corymbosum L.). The roots, stems and leaves of blueberry plants with normal growth and limited growth were collected. Part of each root sample was packed into aluminum foil and snap-frozen in liquid nitrogen and stored at −80 °C for testing the metabolome.
The rhizosphere and non-rhizosphere soils were collected separately into plastic bags [14]. About 10 g of each fresh rhizosphere and non-rhizosphere soil were wrapped in aluminum foil, snap-frozen in liquid nitrogen and stored at −70 °C for the subsequent characterization of soil microorganisms [15]. Each sample was collected in three replicates, and each replicate comprised at least nine sampling points. The samples were denoted: NR (rhizosphere soil of normally growing plants), LR (rhizosphere soil of plants with limited growth), N (normal-growth bulk soil), L (limited-growth bulk soil).

2.2. Sample Processing

Soil samples were air dried, ground, sieved through a 0.15 mm sieve, and stored in ziplock bags for later use. Roots were washed out of soil with deionized water and lightly blotted by absorbent paper. The fresh weight of roots, stems and leaves was determined, followed by drying in an oven at 105 °C for 10 min and then at 75 °C to constant weight. After determining dry weight, samples were crushed, ground, sieved through a 200 mesh sieve, and stored. The water content of various samples was calculated.

2.3. Measurement Methods

2.3.1. Soil pH and EC

The pH and EC were measured in 1:5 (soil:water) mixture with a pH meter and a conductivity meter, respectively, after shaking, standing and filtering [16].

2.3.2. Determination of Soil Enzymes

Soil catalase was measured by the potassium permanganate titration method. Soil invertase and acid phosphatase were tested using Solaribio soil invertase and acid phosphatase activity detection kits, respectively [17].

2.3.3. DNA Extraction and Next-Generation Sequencing of Soil Microorganisms

The microbial samples were sent to the Beijing Ovison Gene Company for testing. The specific operation processes included soil DNA extraction, PCR amplification and MiSeq sequencing according to the company instructions. The rhizosphere and non-rhizosphere soils of normally growing plants and limited growth of blueberry were selected, and each treatment was repeated three times. DNA was extracted by a MoBio PowerSoil® DNA Isolation Kit, and the extracted genomic DNA was detected by 1% w/w agarose gel electrophoresis. Sequencing the V3-V4 region of the 16Sr RNA gene of bacteria was used with the Illumina MiSeq platform sequencing (Ovison Gene Technology Co., Ltd., Beijing, China). We used forward primer 338F (5′-ACTCCTACGGGAGGCAGCAG-3′) and the reverse primer 806R (5′-GGACTACHVGGGTWTCTAAT-3′). Amplification primer sequence of fungi: forward primer sequence ITS1 (CTTGGTCATTTAGAGGAAGTAAAAGTAAaagtaa) and reverse primer sequence (TGCGTTCTTCATCGATGC). PCR products were detected by 1% agarose gel electrophoresis and purified with an Agincourt Ampure XP nucleic acid purification kit. Next, paired-end sequencing was performed using an Illumina miseq pe300 high-throughput sequencing platform (Beijing Ovison Gene Technology Co., Ltd. Beijing, China).The original data were quality controlled before OTU clustering [18]. The CD-HIT pipeline was used for assigning operational taxonomic units (OTUs) with a similarity of 97%. We performed alpha and beta diversity analyses, species annotation, and other analyses based on the clustering results. The related gene functions of microorganisms were determined using annotation databases. To determine a relationship between the physical and chemical properties of blueberry soil and the abundance of soil microorganisms, a redundancy analysis (RDA) was carried out.
Microbiological analyses were done using Trimmomatic (v0.36), Pear (v0.9.6), Flash (v1.20), and Vsearch (v2.7.1) software. The function predictions were done by PICRUSt2 v2.2.0-b (https://github.com/picrust/picrust2/releases/tag/v2.2.0-b, accessed on 27 July 2019) for bacteria and by FUNGuild21 (https://github.com/UMNFuN/FUNGuild, accessed on 19 August 2019) for fungi.

2.3.4. Nutrient Elements in Roots, Stems and Leaves

Plant material was digested in the HNO3/H2O2 mixture according to the published method [19].

2.3.5. Root Metabolome

The roots of 30 blueberry plants were sampled and rinsed with deionized water, Root subsamples were stored in 10-mL centrifuge tubes in liquid nitrogen and were sent to China NanJing Biomarker Technologies for analysis. Metabolites were extracted from 50 mg of root samples using 1000 μL of extractant (volume ratio of methanol-to acetonitrile-to water = 2:2:1) containing internal standard (L-2-chlorophenylalanine at 2 mg/L), vortexing for 30 s, adding ceramic beads, sonicating at 45 Hz once for 10 min, ultrasonicating in an ice-water bath for 10 min, and then letting the mixture stand at −20 °C for 1 h. Samples were then centrifuged at 5294× g at 4 °C for 15 min. Supernatant (500 μL) was transferred to an Eppendorf tube and dried in a vacuum concentrator. A 160 μL aliquot of acetonitrile:water mixture (1:1) was added to the dried metabolites, vortexed for 30 s, ultrasonicated in the ice-water bath for 10 min, and centrifuged at 15,294× g at 4 °C for 15 min. Supernatant (120 μL) was placed in a 2 mL injection bottle. 10 μL of each sample was mixed into a quality control sample for machine testing. The LC/MS system for metabolomics analysis was composed of a Waters Acquity I-Class PLUS ultra-high performance liquid chromatograph in tandem with a Waters Xevo G2-XS QT high-resolution mass spectrometer. A Waters Acquity UPLC HSS T3 column (1.8 μm, 2.1 mm × 100 mm) was used.
Metabolomics raw data were analyzed by MassLynx V4.2. Progenesis QI software was used for peak extraction and alignment and other data processing. The Progenesis QI online METLIN database and Biomark’s self-built library were used for metabolite identification.

2.4. Data Analysis

All soil samples were assessed in three biological replicates. For data analysis, One-way ANOVA, multiple t-test, PCoA (Principal Co-ordinates Analysis), and RDA (Redundancy Discriminate Analysis) were done using IBM SPSS v.20.0 (IBM, Armonk, NY, USA) and R packagevegan v2.5–5 (https://github.com/vegandevs/vegan, accessed on 19 August 2019). The correlations among environmental factors including bacterial or fungal OTUs) and root metabolites were generated using the R package corrplot v0.4.3 (https://cran.r-project.org/web/packages/corrr/index.html, accessed on 19 August 2019). All of the graphs were completed in GraphPad Prism v8.0.1 (GraphPad Software, San Diego, CA, USA).

3. Results

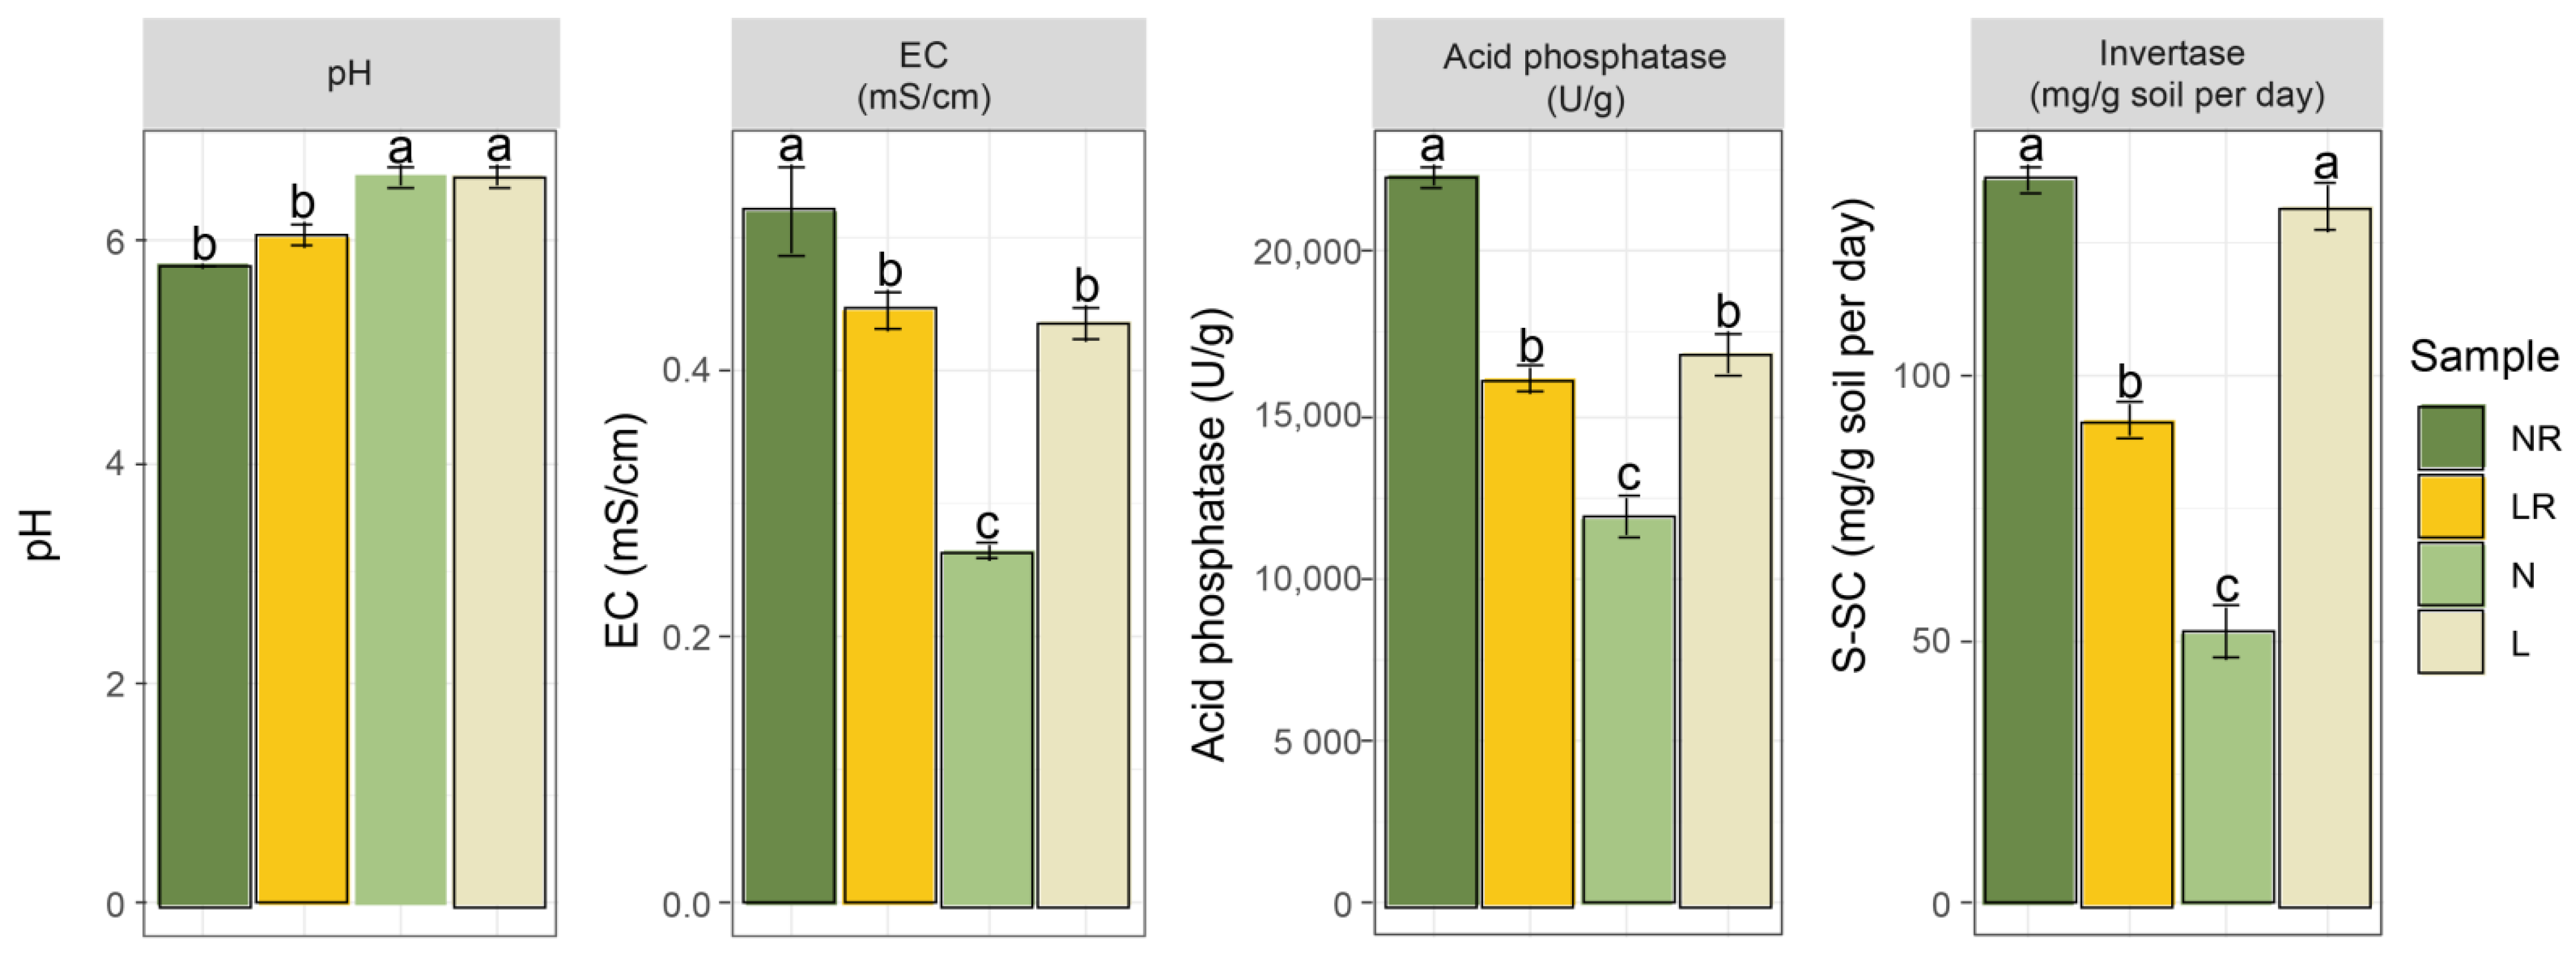
3.1. Soil Chemical Properties

Regardless of the growth status of blueberries, the pHwater was significantly higher in the non-rhizosphere than rhizosphere soil (Figure 1). Apart from the rhizosphere soil of normally growing blueberry, the other three sample types had pHwater higher than 6.0. In the rhizosphere soil, the EC value and acid phosphatase and invertase activities of the normally growing blueberry were significantly higher than those of the growth-limited blueberry plants, but the opposite was true in the non-rhizosphere soil (Figure 1). There were relatively small differences, if any, between total nutrient contents in soils supporting normal or limited growth of highbush blueberry plants (data not shown).

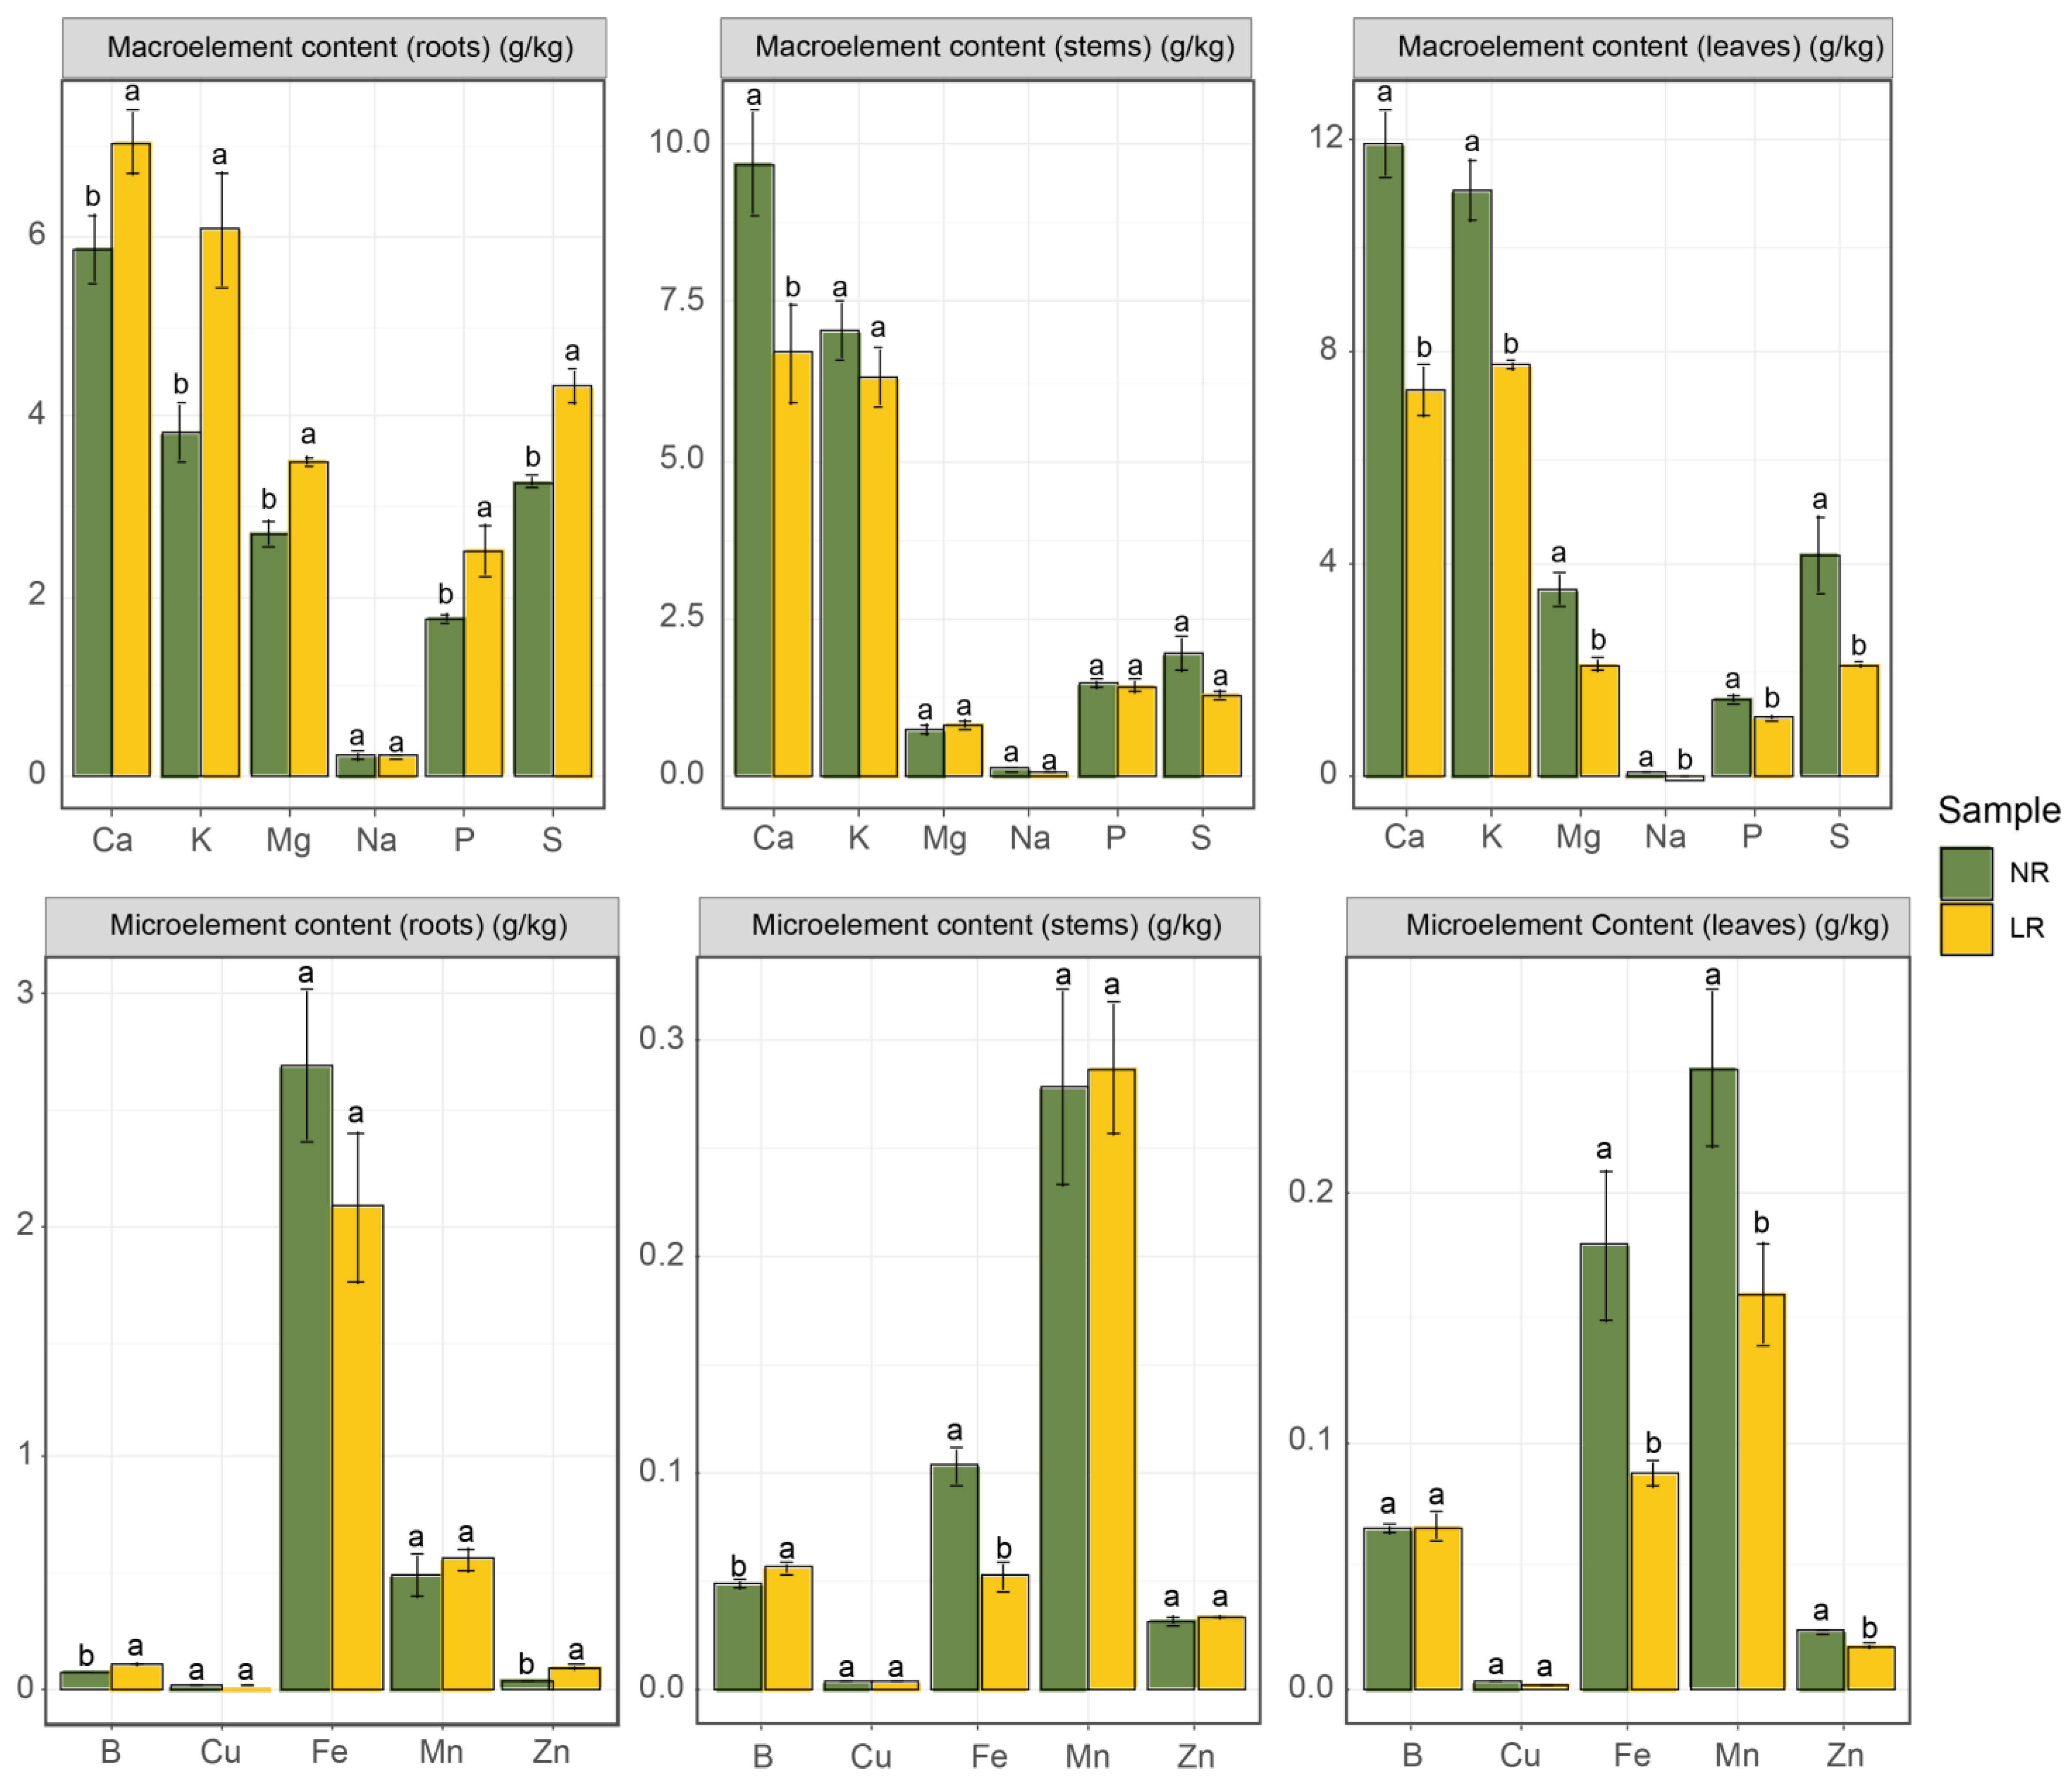
3.2. Plant Tissue Nutrient Content

The concentrations of Ca, K, Mg, P, S and Zn in leaves of normally growing blueberries were significantly higher than those in the limited-growth blueberries, whereas the concentrations in roots showed the opposite relationship. The concentration of B in roots and stems of normal-growth blueberries was significantly higher than that of limited-growth blueberries, but there was no significant difference in leaves. The Fe concentration was higher in all parts of the normal-growth than limited-growth blueberry plants, and the difference was significant in stems and leaves (Figure 2).

3.3. Soil Microorganisms

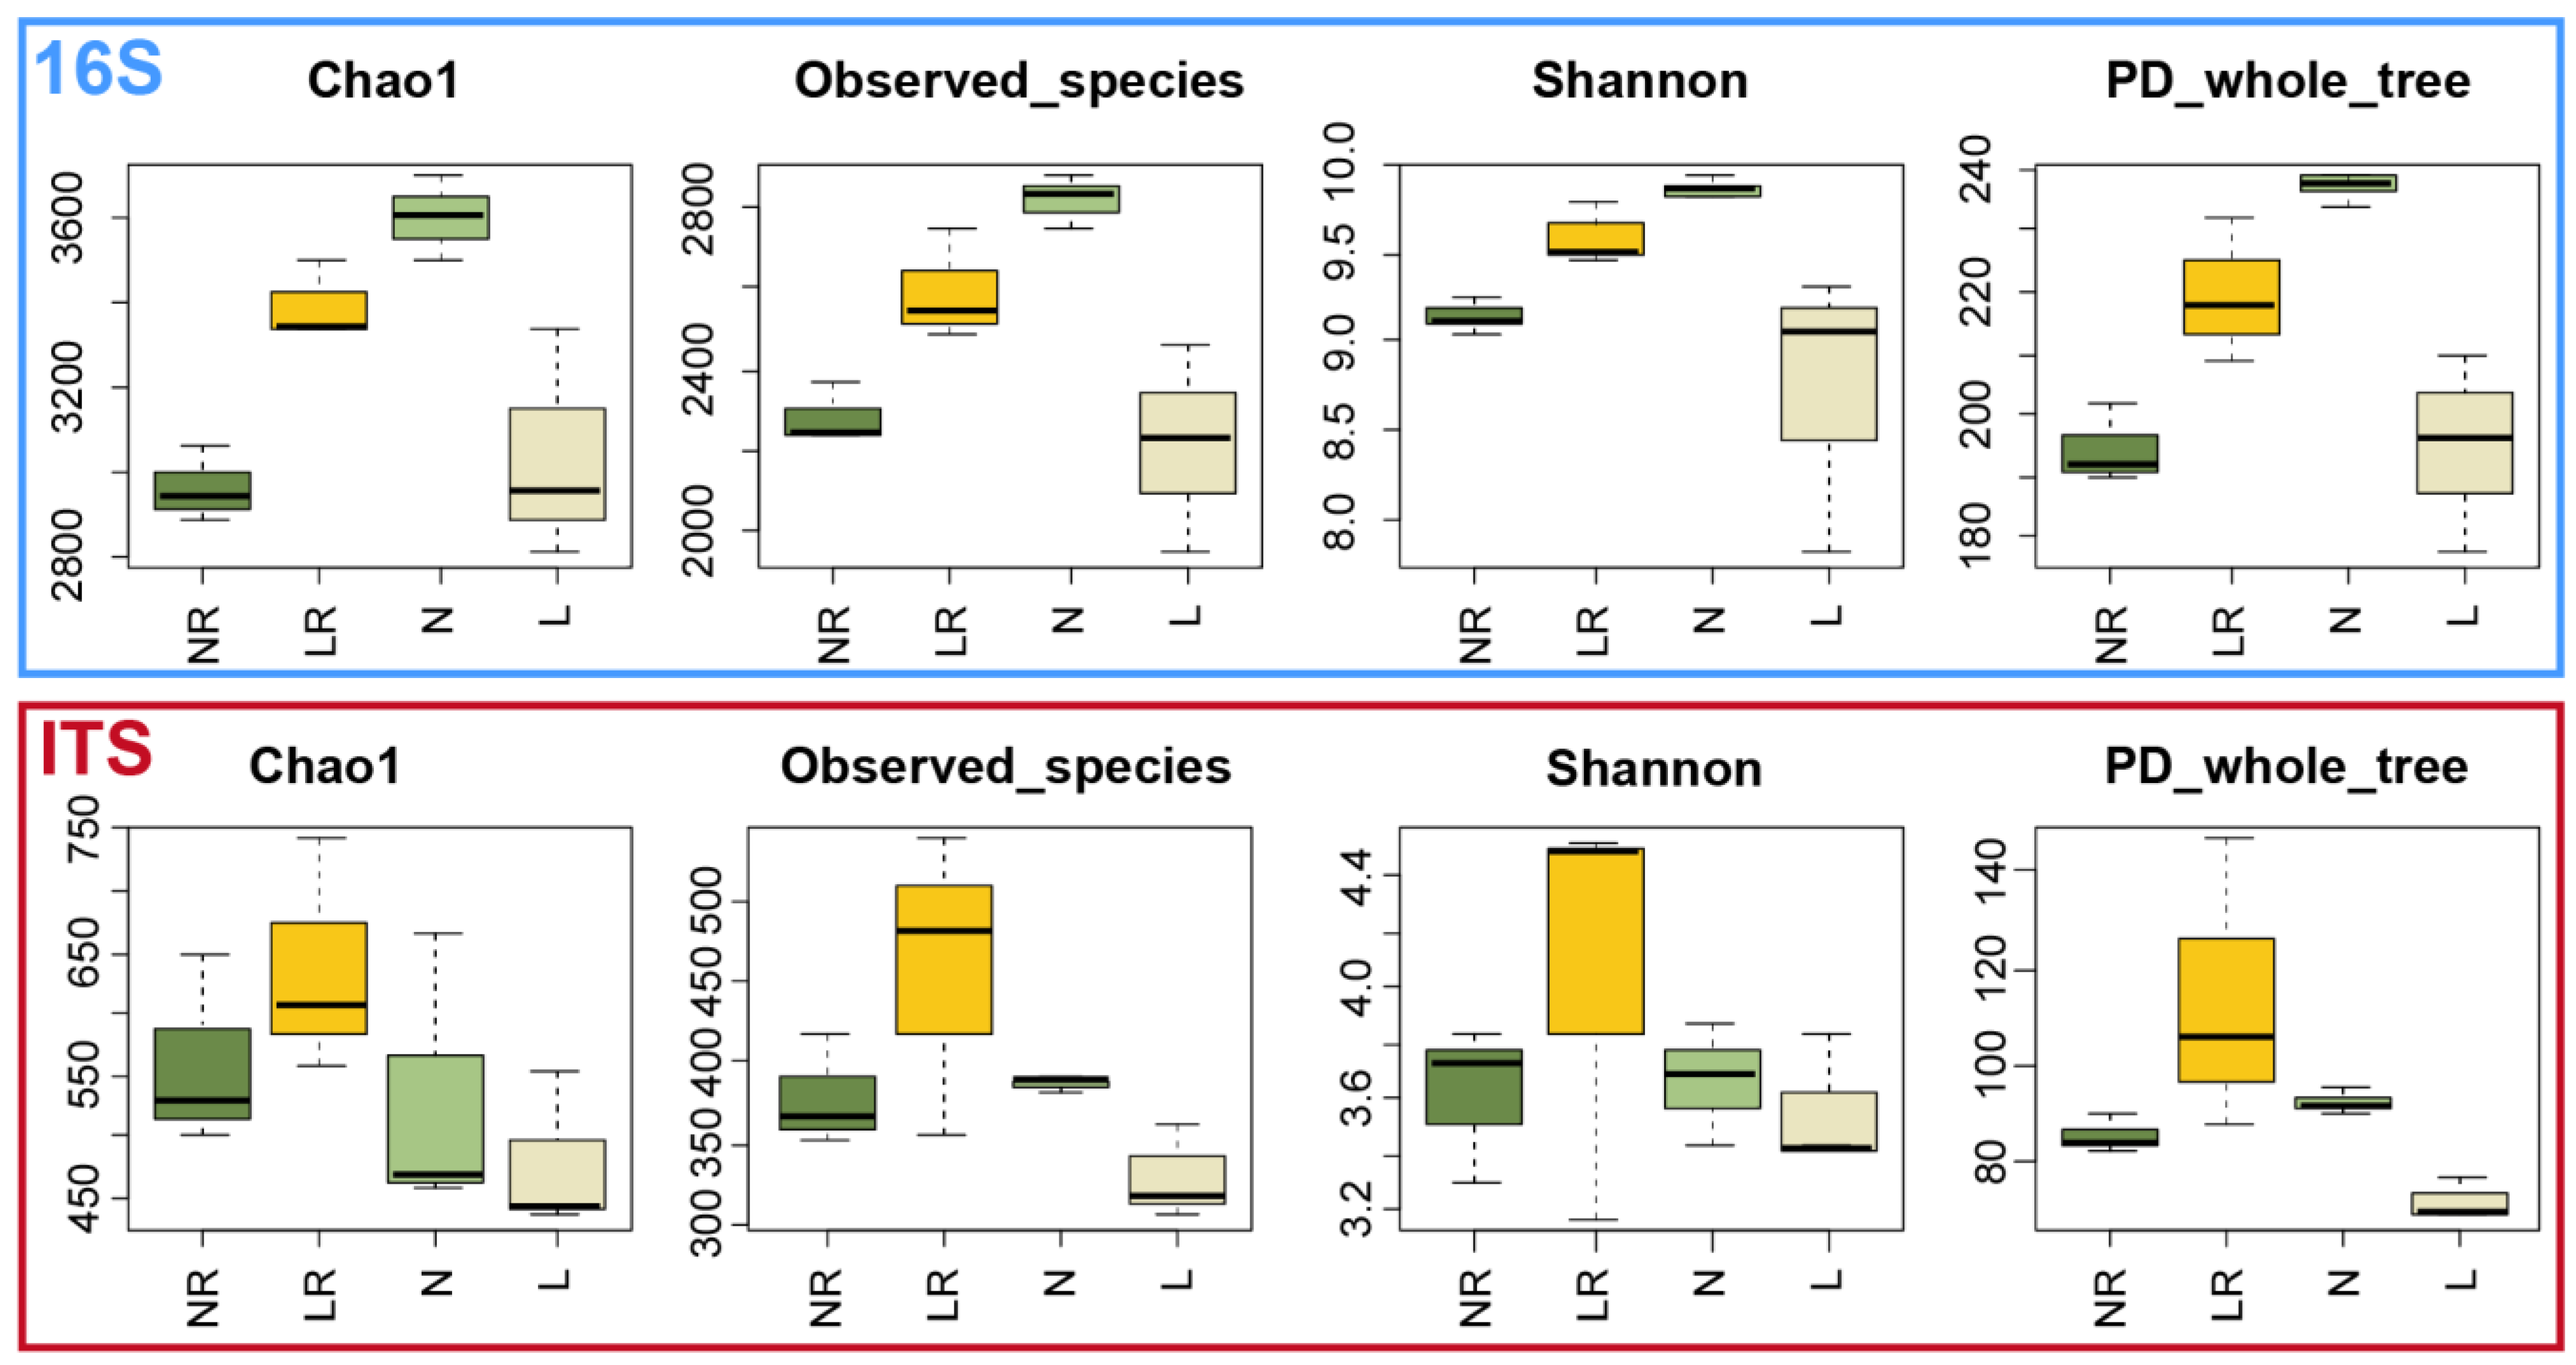
3.3.1. Alpha Diversity Analysis

The alpha diversity of bacteria and fungi was significantly different among the samples, and the trends were the same for all indices (Figure 3). The median values of indices of Chao1, Observed_species, Shannon, and PD_whole_tree were lower in the rhizosphere soil of normally growing blueberries (and were higher in the bulk soil) compared with limited-growth blueberry plants. Therefore, the microbial diversity and abundance in the rhizosphere soil of the normally growing blueberries were lower than those in the limited-growth blueberry plants, but the opposite occurred in the non-rhizosphere soil (Figure 3).

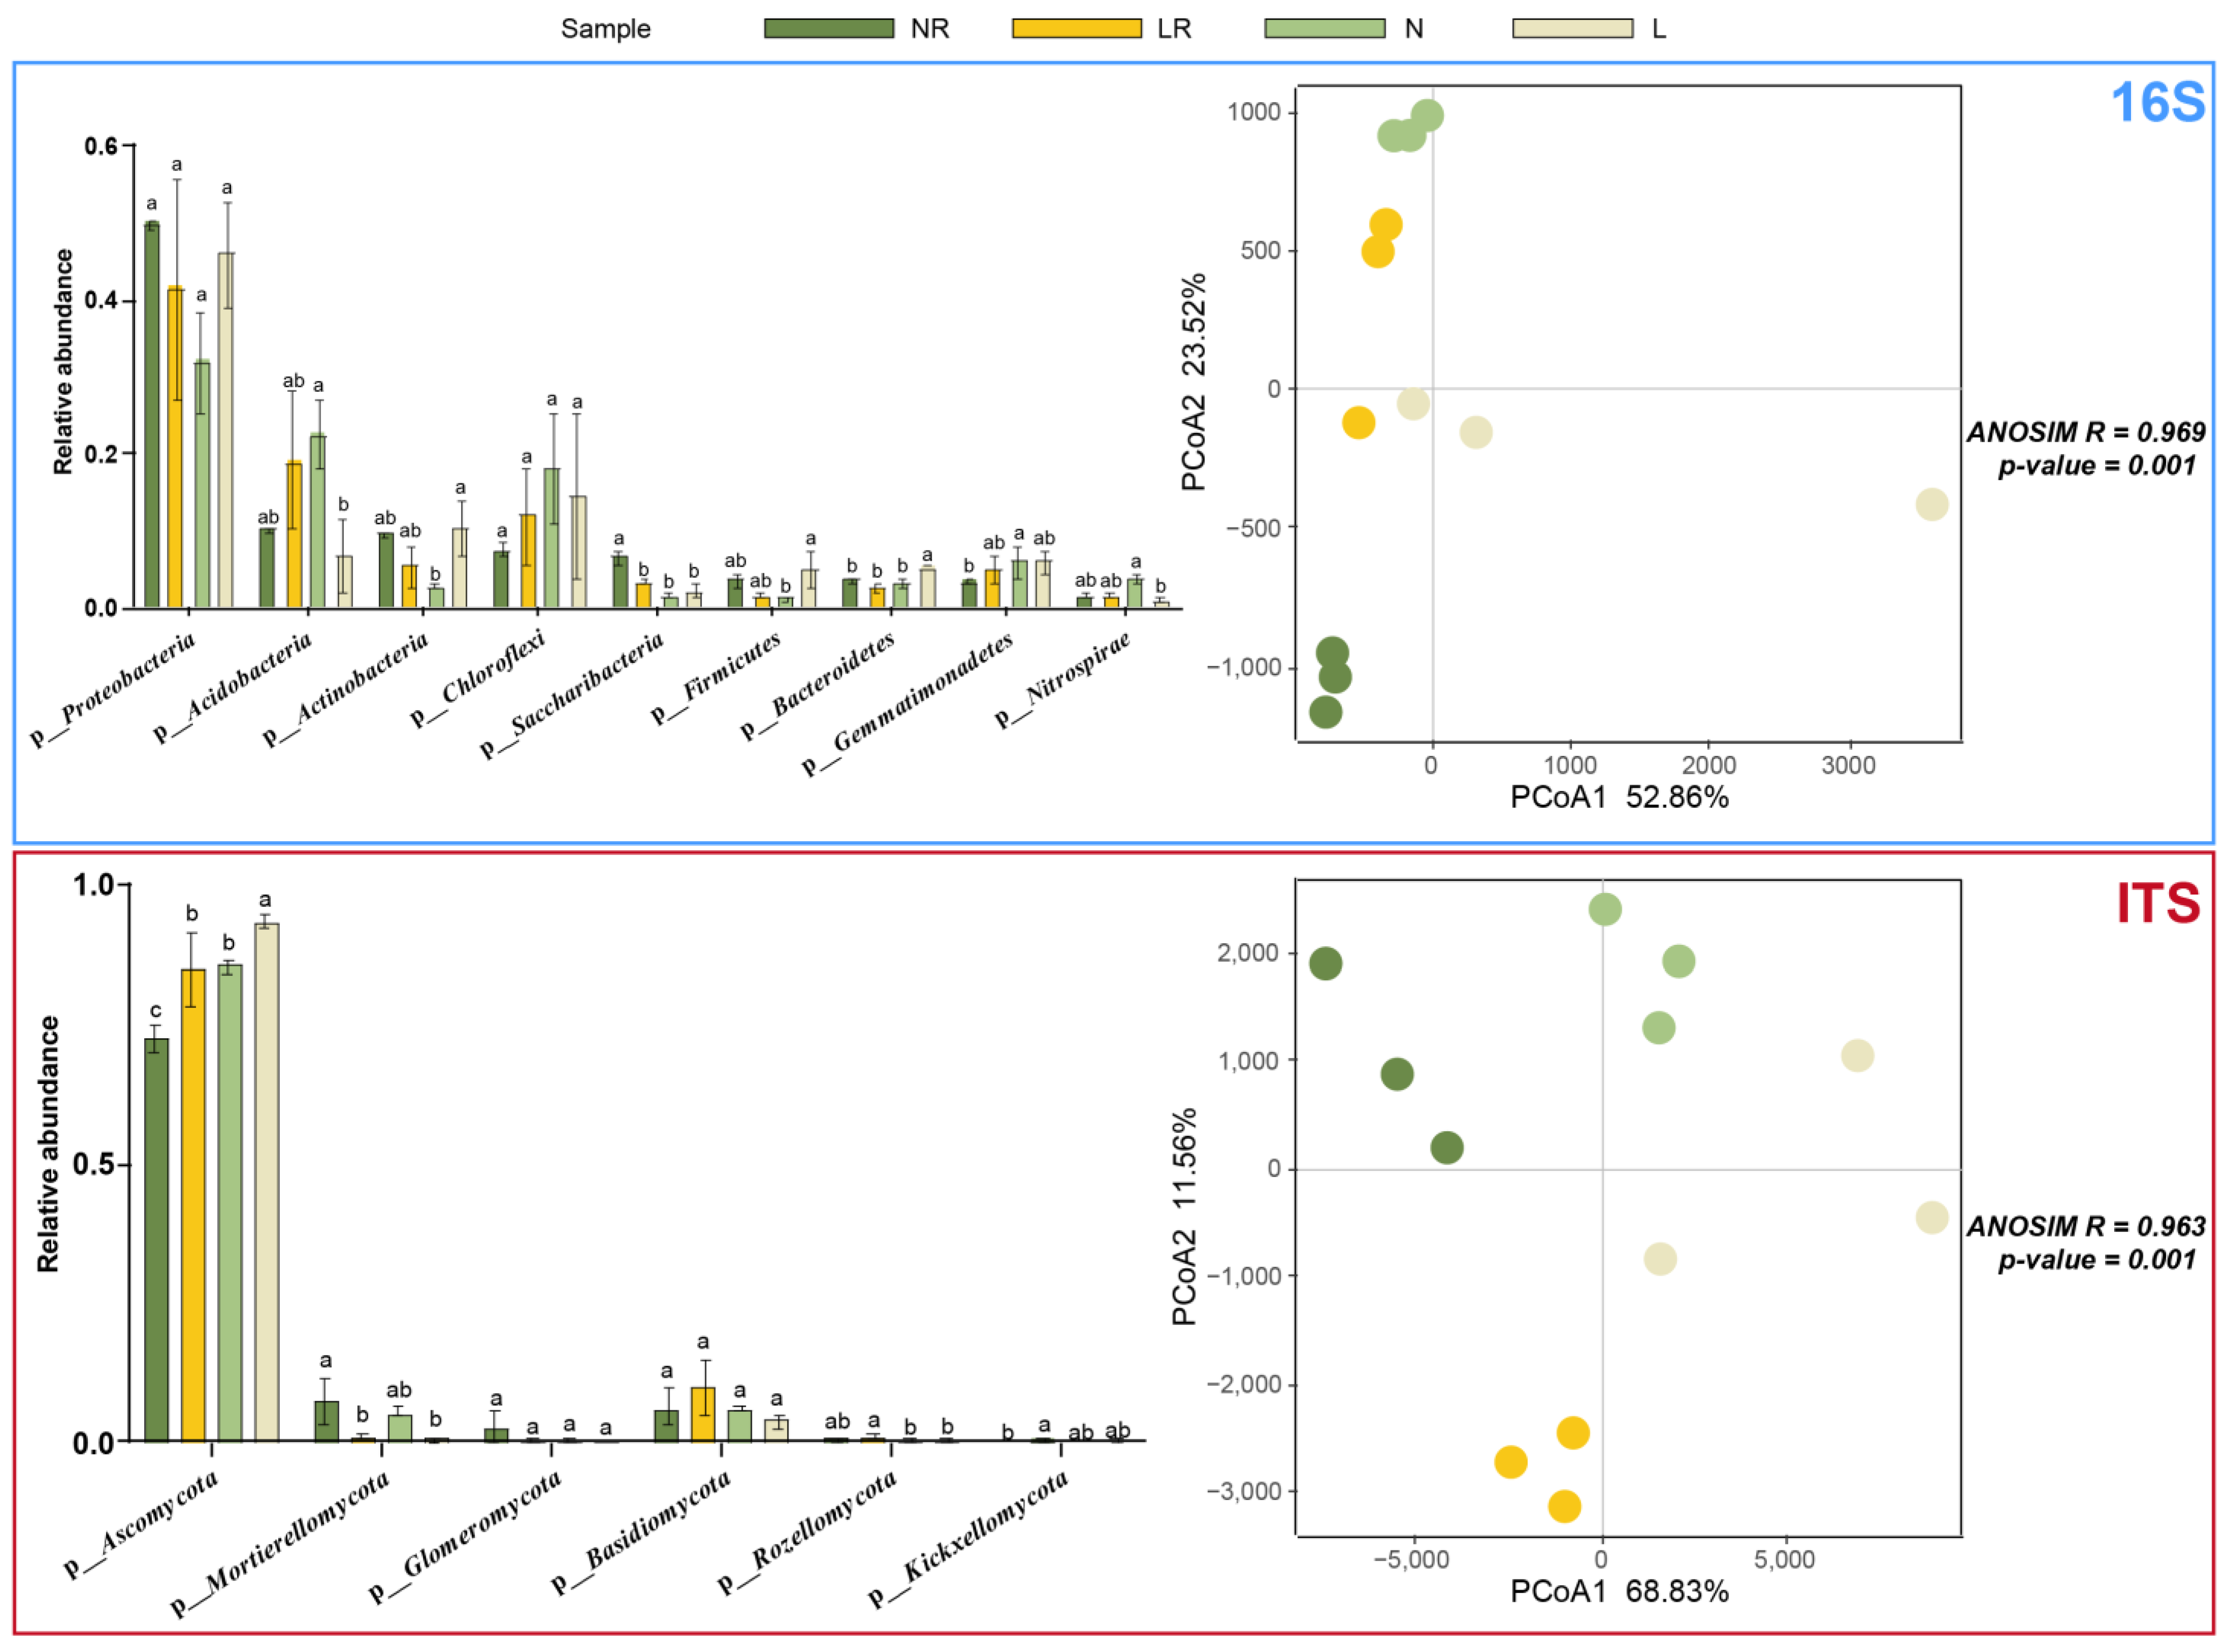
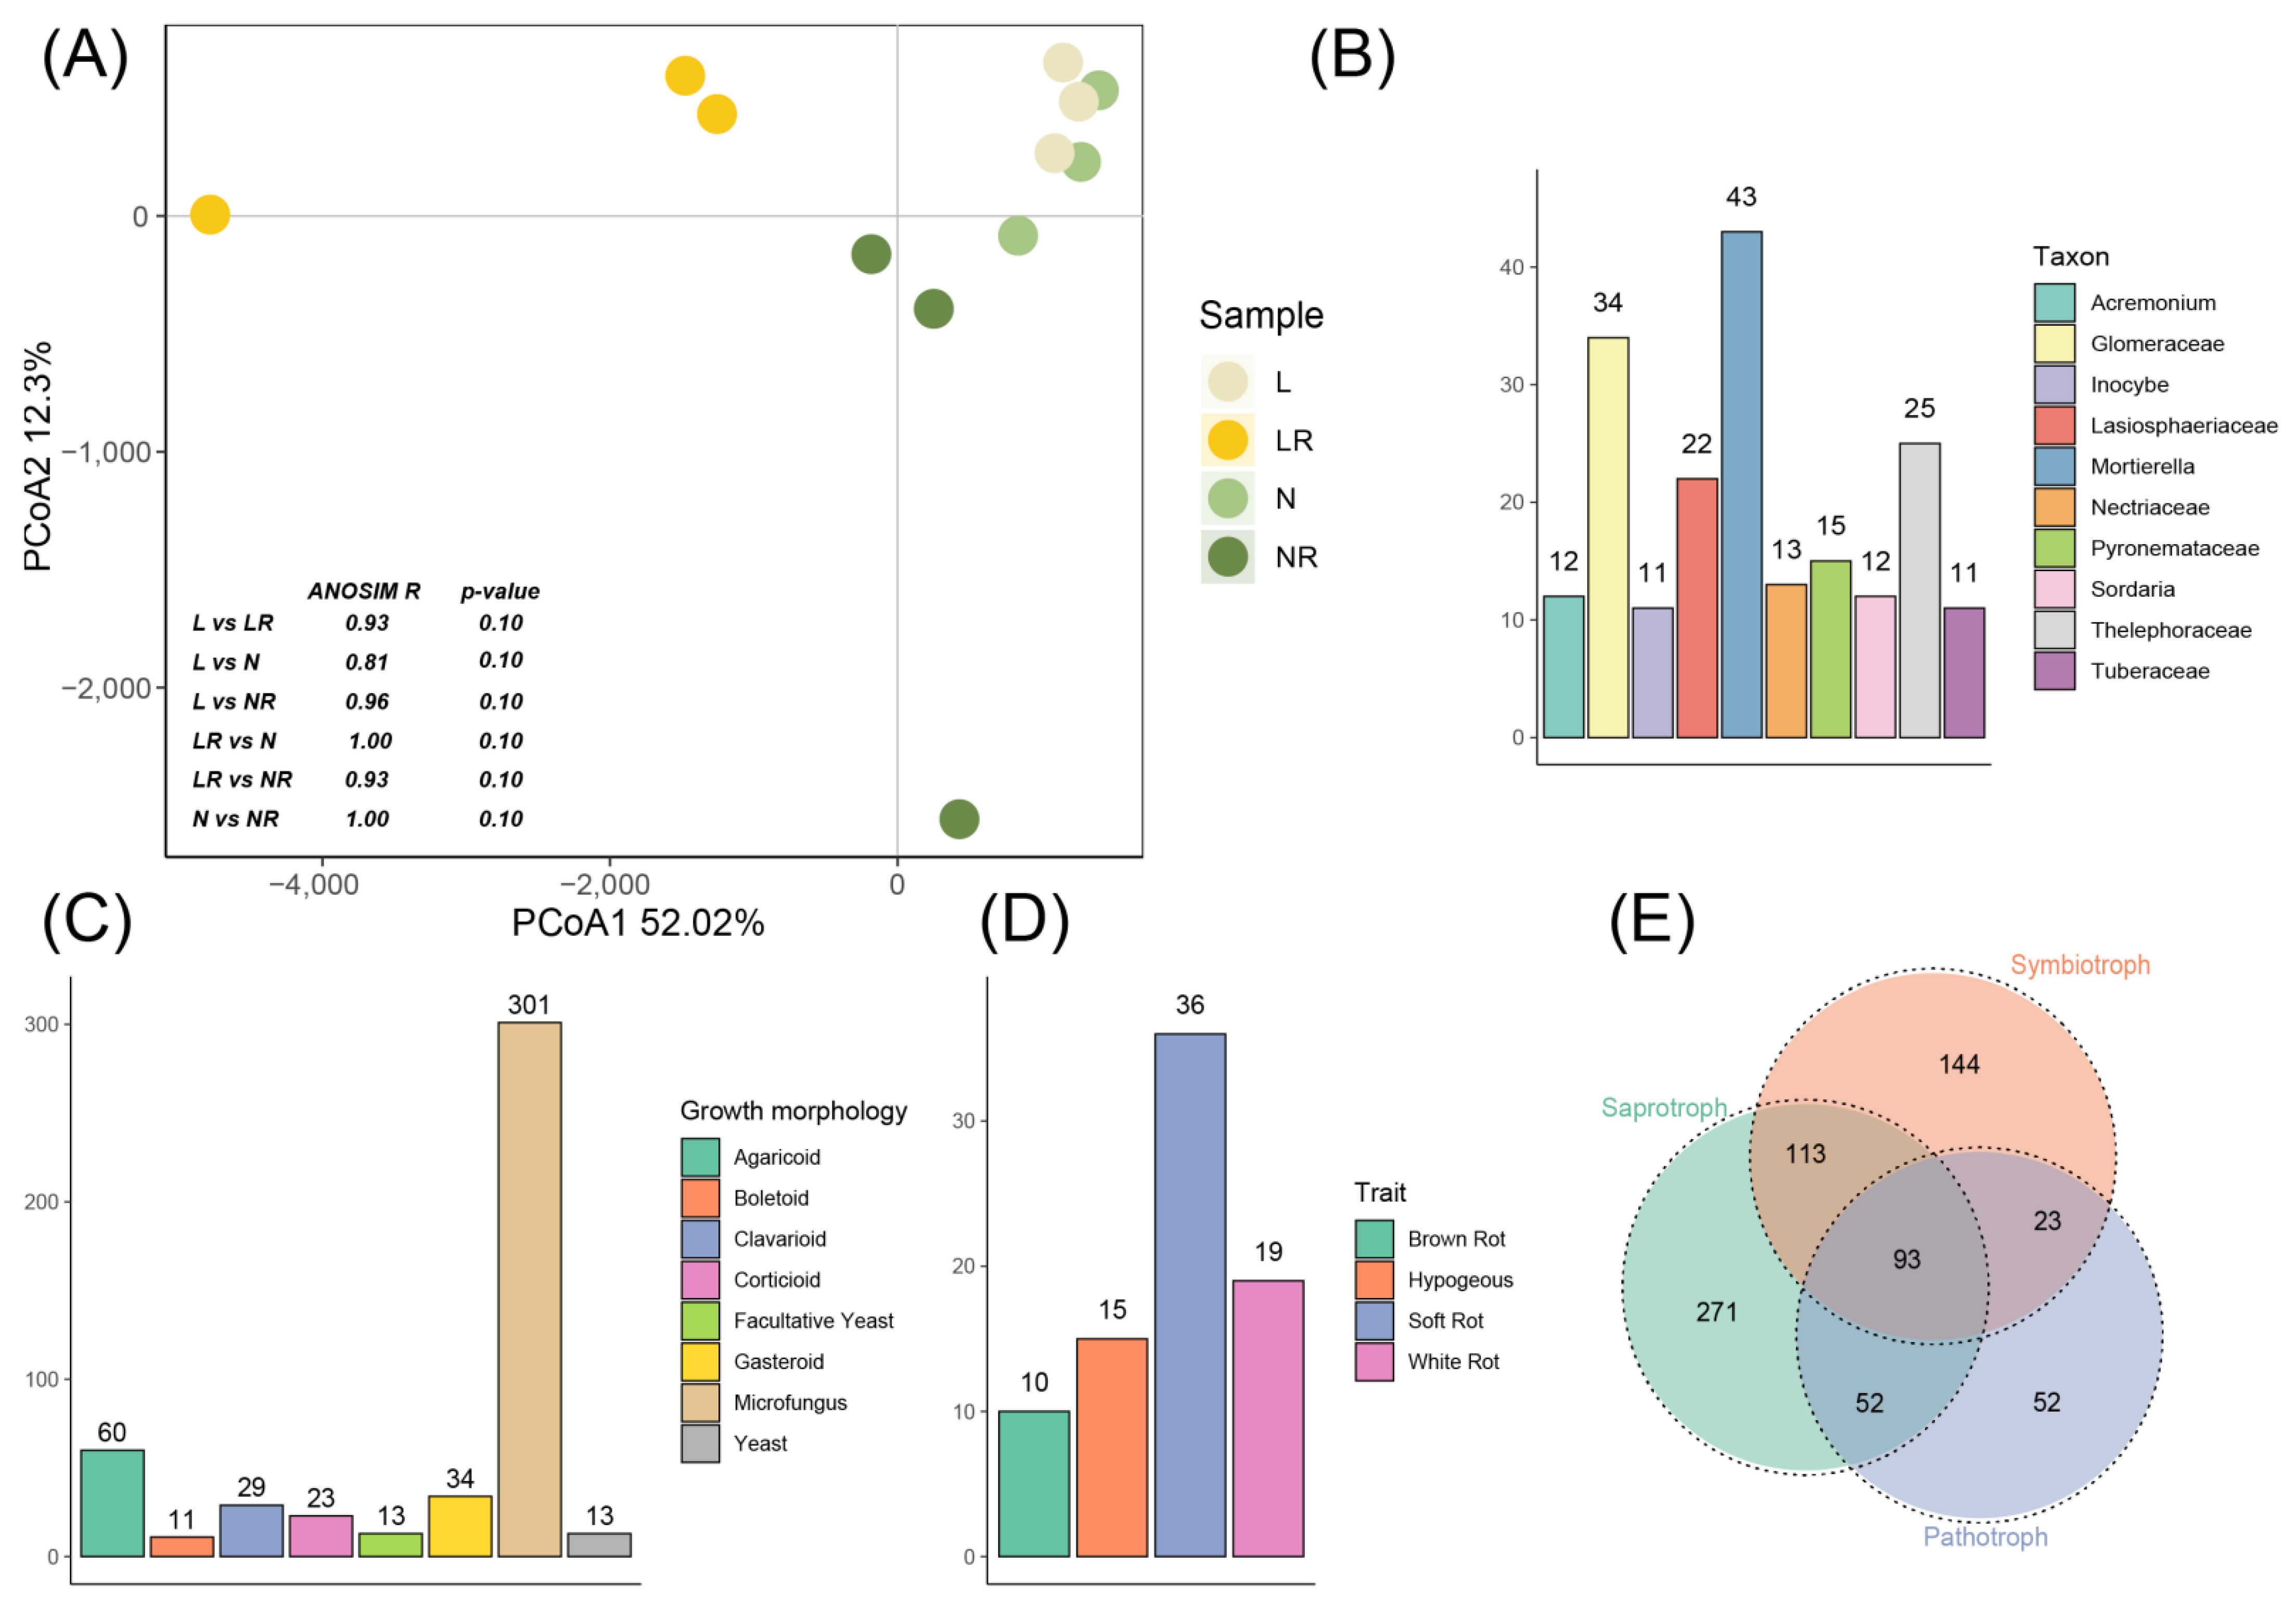
3.3.2. Analysis of Species Composition
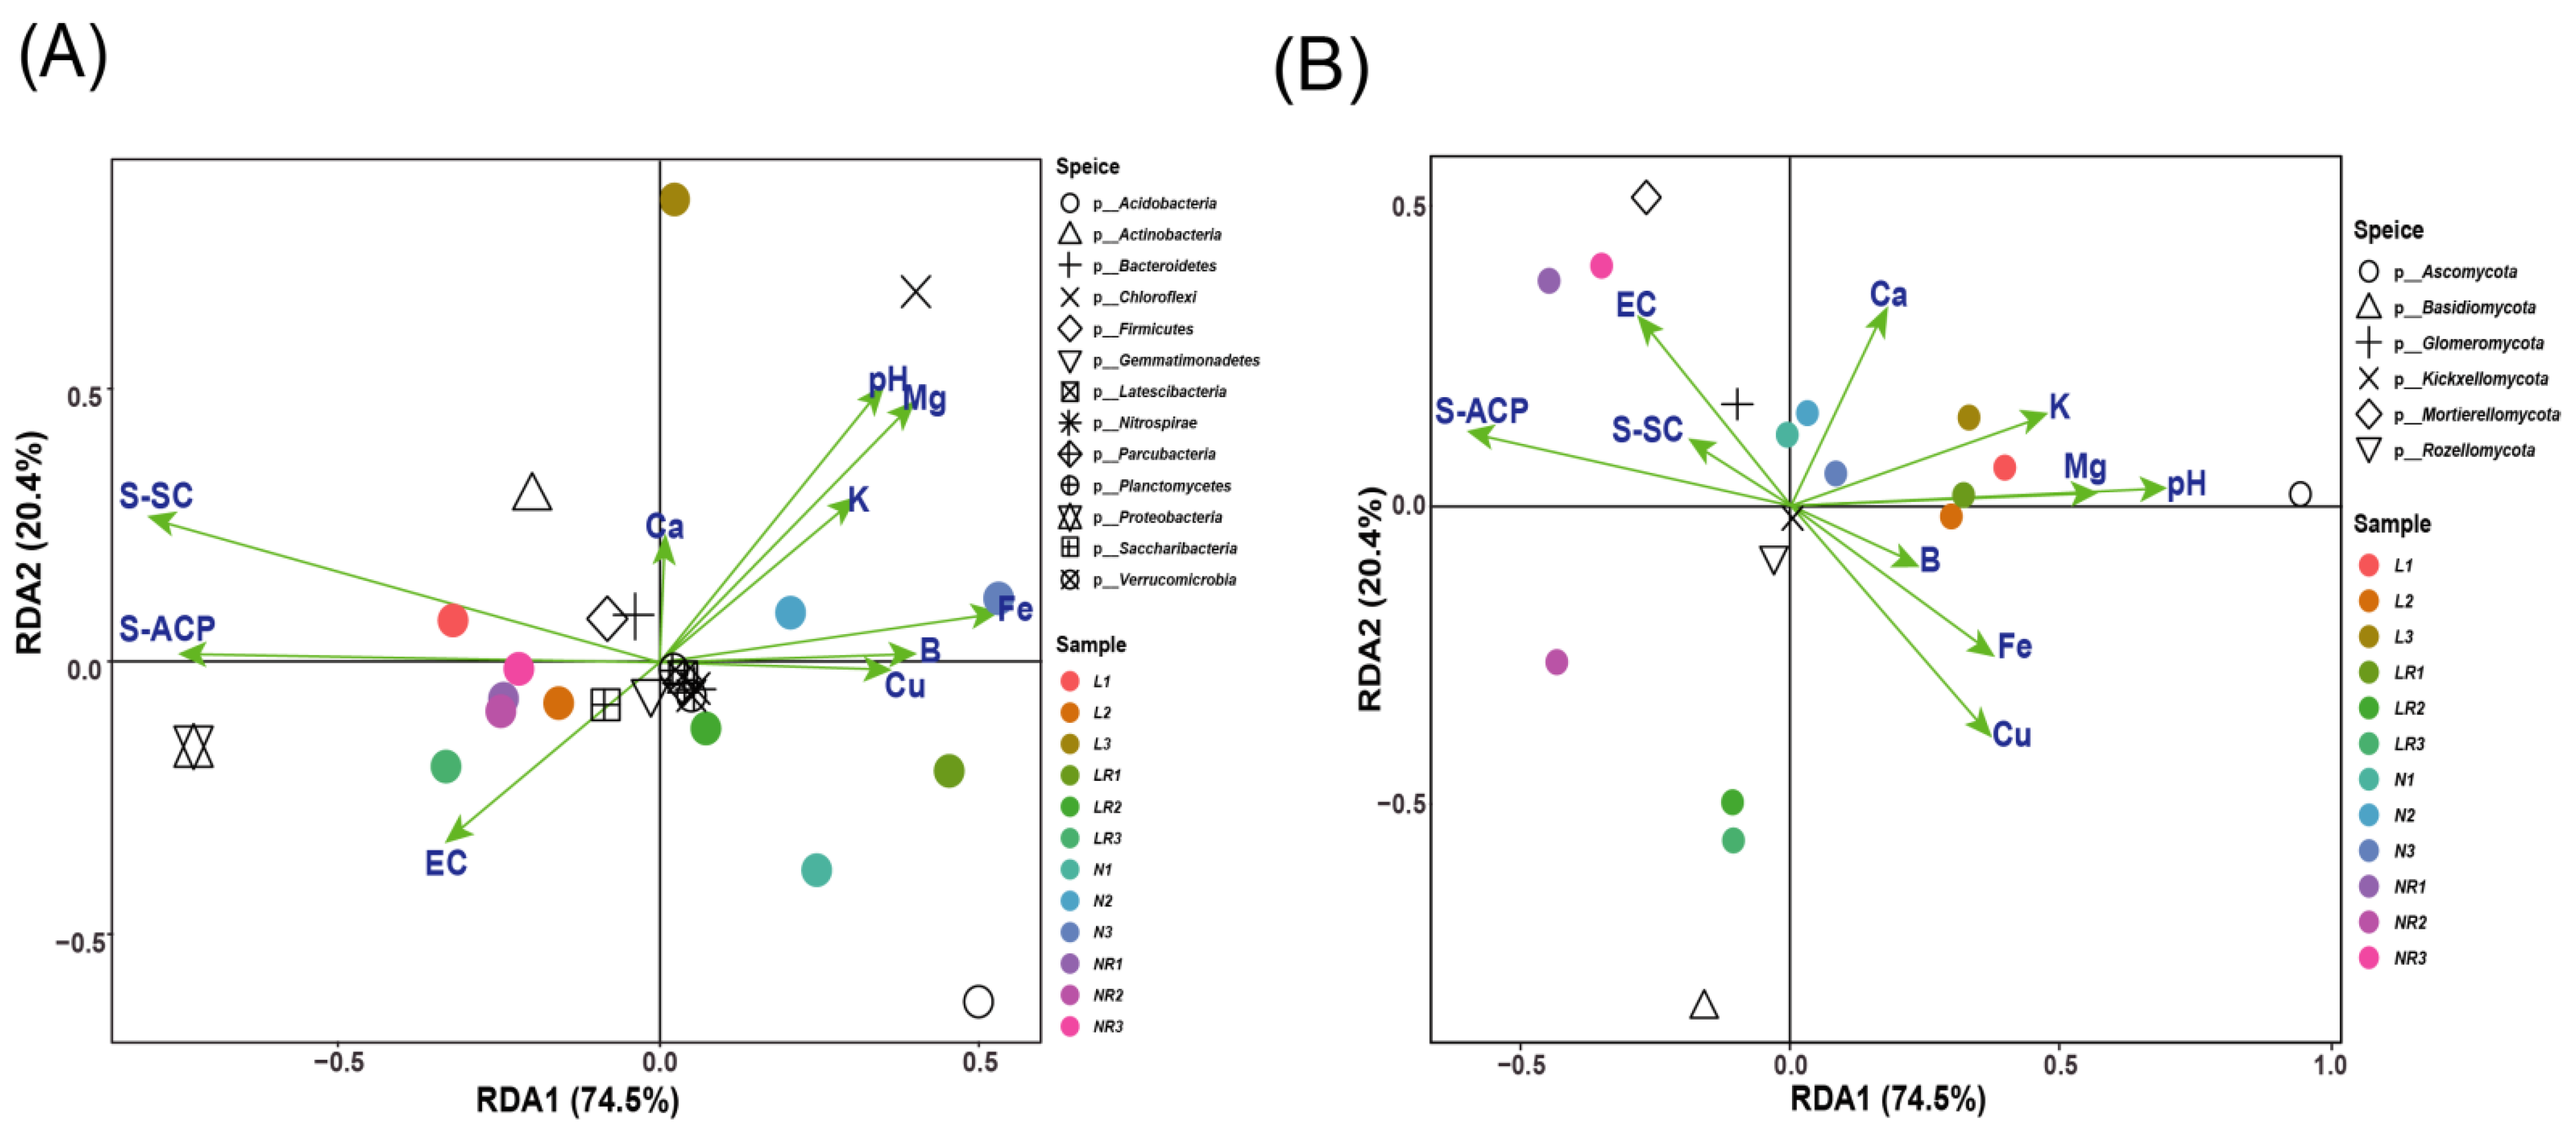
In the principal co-ordinates analysis (PCoA), bacterial and fungal phyla showed significant differences among the four types of samples (Figure 4). The dominant bacterial phyla were: Proteobacteria, Acidobacteria and Chloroflexi, accounting for 67–72% of all bacteria. Proteobacteria had the highest relative abundance in the rhizosphere soil of normally growing blueberries, but the difference with other sample types was not significant. It is worth noting that the relative abundance of Saccharibacteria was significantly higher in the rhizosphere soil of normally growing than limited-growth blueberry plants (Figure 4).
Ascomycota were by far the most abundant fungal phylum in the four types of samples, accounting for 72–93% of all fungi (Figure 4). Moreover, the relative abundance of Ascomycota in both rhizosphere and bulk soils of the limited-growth blueberry was significantly higher than that of the normally growing blueberry. The relative abundance of Mortierellomycota in the rhizosphere soil of normally growing blueberries was significantly higher than that of limited-growth blueberry plants. In the other phyla with relatively low relative abundance, Kickxellomycota had significantly higher abundance in the rhizosphere soil of poorly growing than normally growing blueberry plants (Figure 4).

3.3.3. RDA Analysis

The soil properties explained a high proportion of variation in the relative abundance of Actinobacteria, Chloroflexi, Proteobacteria, and Acidobacteria. The relative abundance of Actinobacteria was correlated positively with S-SC and S-ACP. The relative abundance of Chloroflexi was correlated positively with soil pH, and negatively with S-SC, S-ACP and soil EC. The relative abundance of Acidobacteria was correlated negatively with S-SC and S-ACP. The relative abundance of Proteobacteria was correlated positively with S-SC, S-ACP and EC, and negatively with pH (Figure 5A).
Regarding fungal phyla, the physical and chemical properties of soil had a large impact on the relative abundance of Ascomycota, Mortierellomycota and Basidiomycota (Figure 5B). Specifically, the most abundant Ascomycota were correlated positively with all measured soil nutrients and pH, and negatively with EC, S-ACP and S-SC. The relative abundance of Mortierellomycota was correlated positively with EC, S-SC, Ca, and S-ACP, and negatively with the total contents of B, Fe and Cu, and pH. The relative abundance of Basidiomycota was correlated positively with the total contents of Cu and Fe, and negatively with EC, Ca, K, Mg, and pH (Figure 5B).

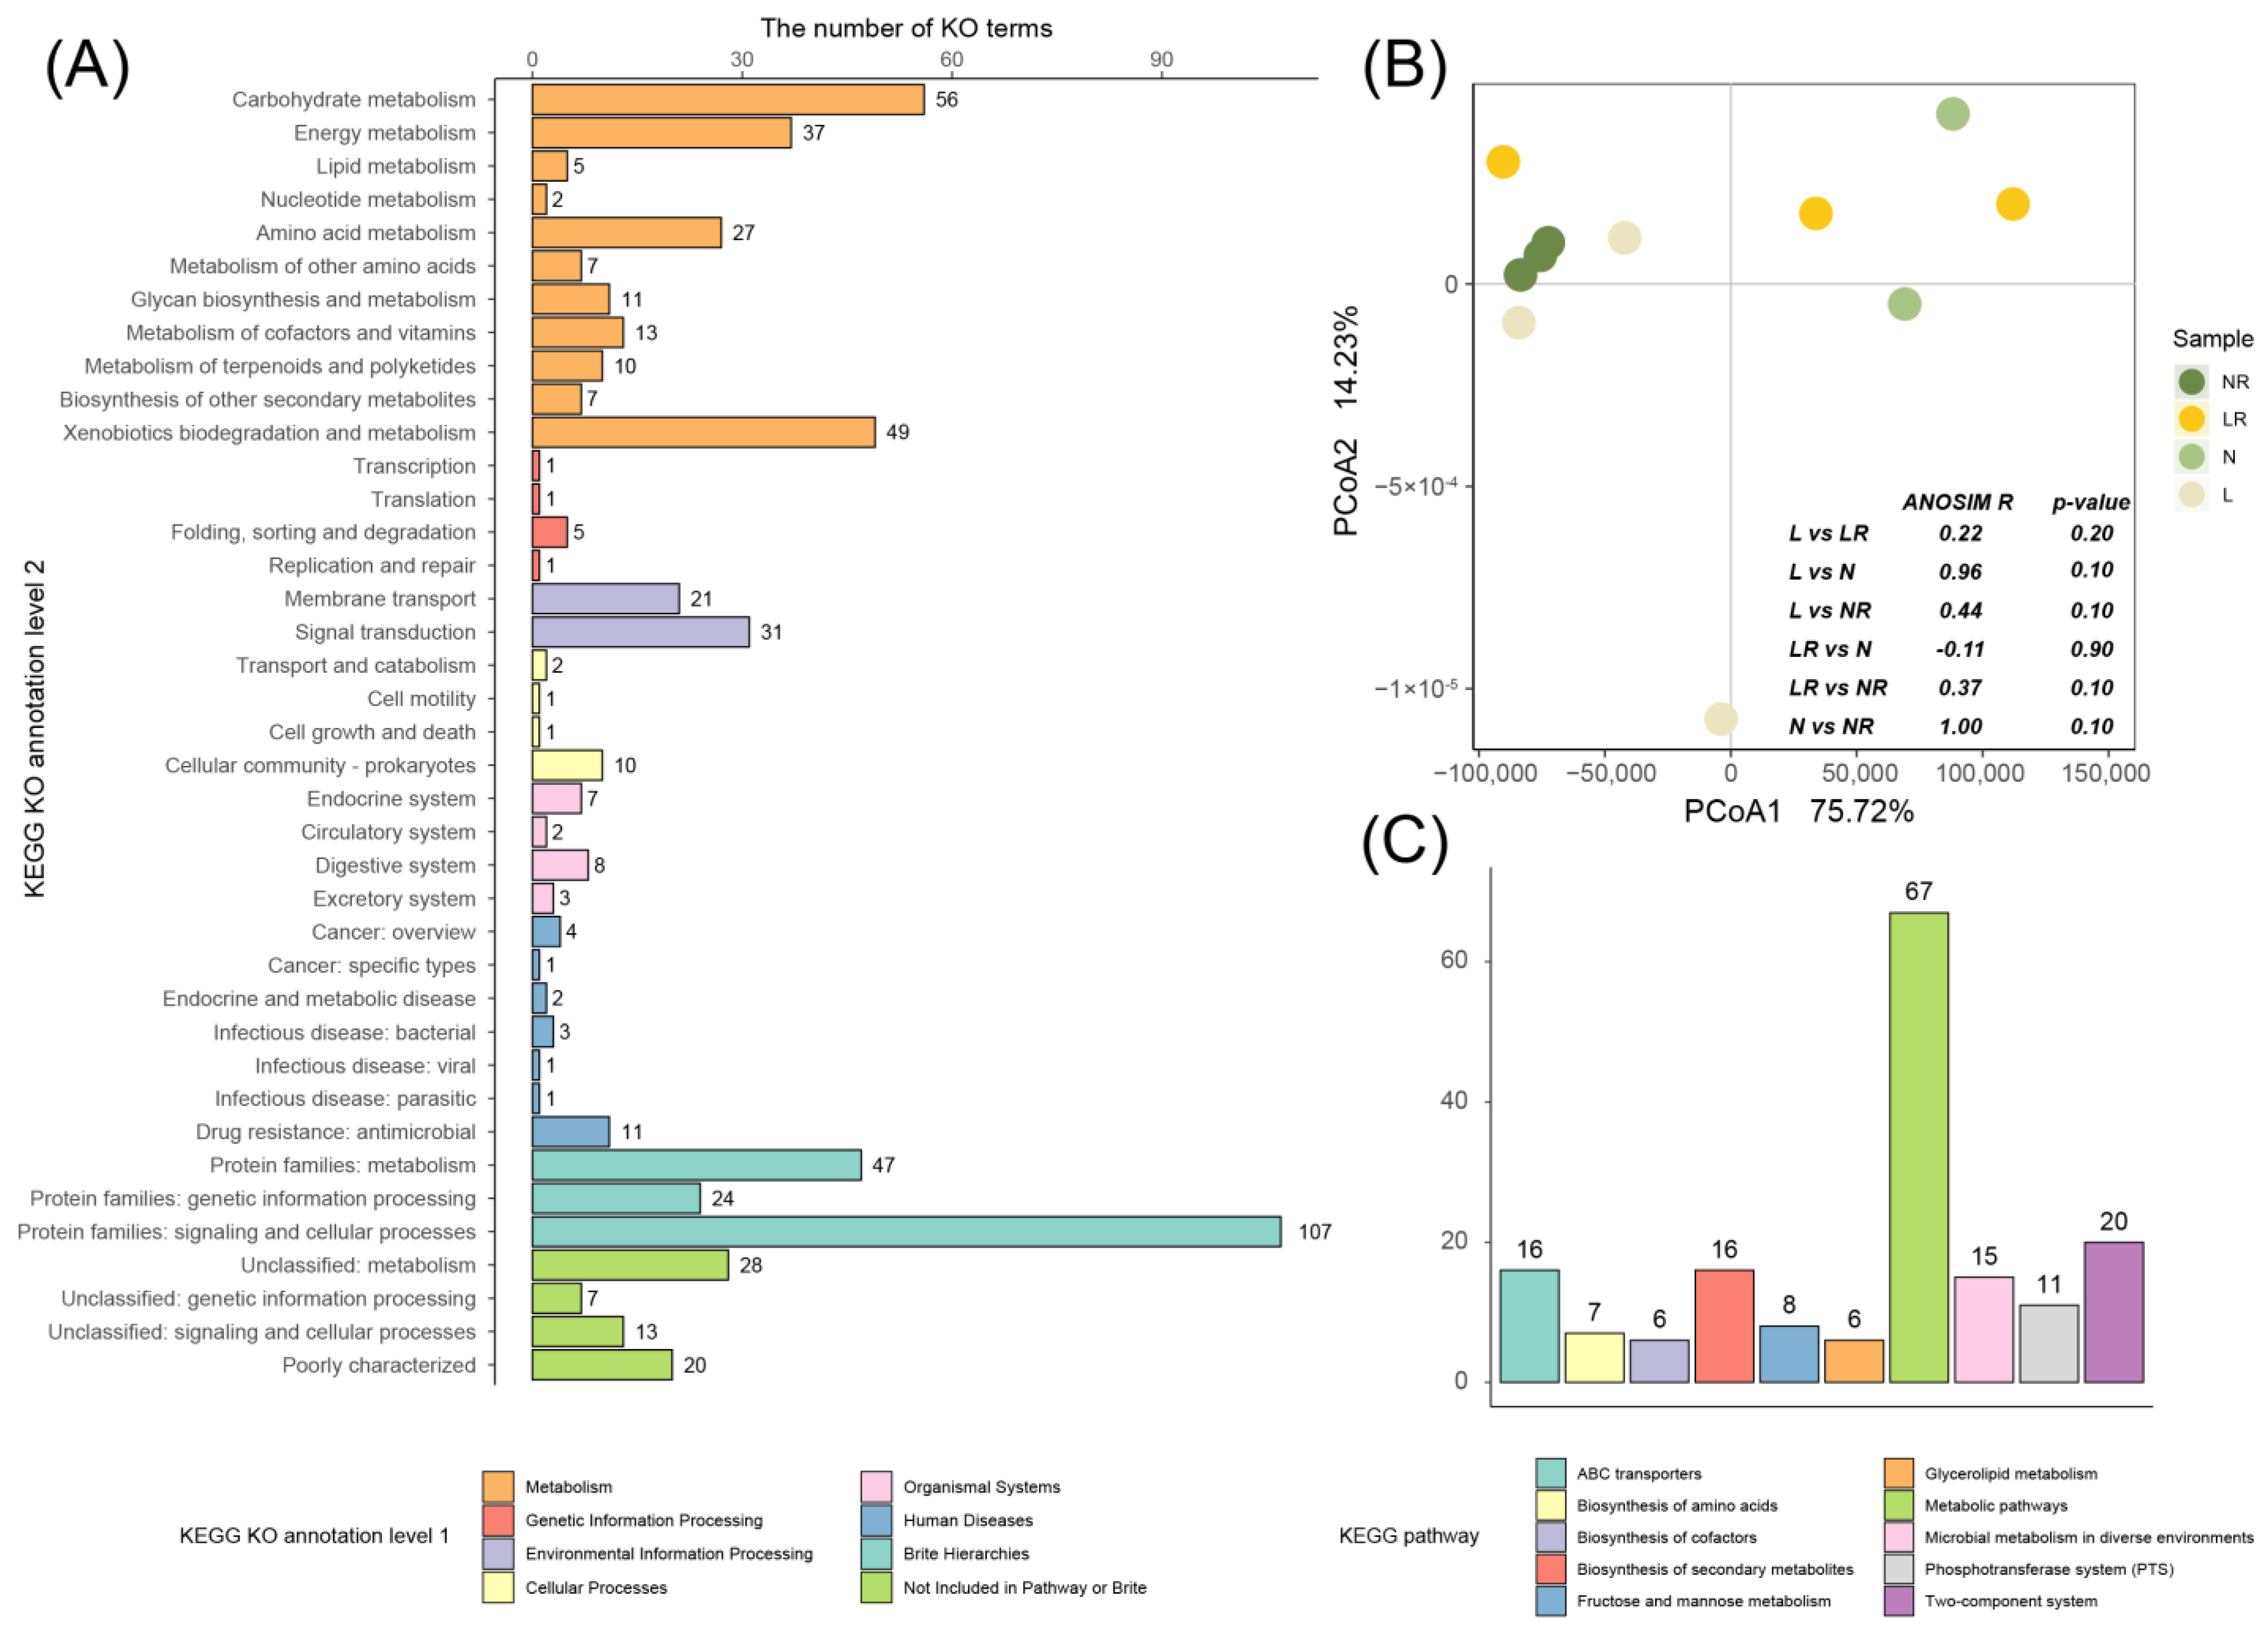
3.3.4. Prediction of Microbial Function

In order to further characterize the influence of soil microorganisms on blueberry plants, we made a functional prediction of the detected microorganisms using the KO and KEGG pathways. The results show that the metabolism of carbohydrates, xenobiotics, energy, amino acids, and proteins as well as the signaling and cellular process occupied a dominant position in the distribution of gene functions (Figure 6A). There were significant differences between non-rhizosphere and rhizosphere samples as well as between samples from limited-growth and normal-growth blueberry plants at the level of gene function (Figure 6B). The most important KEGG category was metabolic pathways (Figure 6C), which was well aligned with the KO terms (Figure 6A).
The ITS fungal function prediction results showed significant differences between the four types of samples (Figure 7A). All fungi were divided into 10 taxa with relatively high abundance. Most abundant were the Mortierella genus and the family Glomeraceae (Figure 7B). Eight growth morphology patterns were predicted, among which Microfungus growth type was the most abundant (Figure 7C). There were four main phenotypes: brown rot, hypogeous, soft rot, and white rot (Figure 7D) and three main types of nutrition: symbiotrophs, saprotrophs and pathotrophs (Figure 7E).

3.4. Root Metabolome

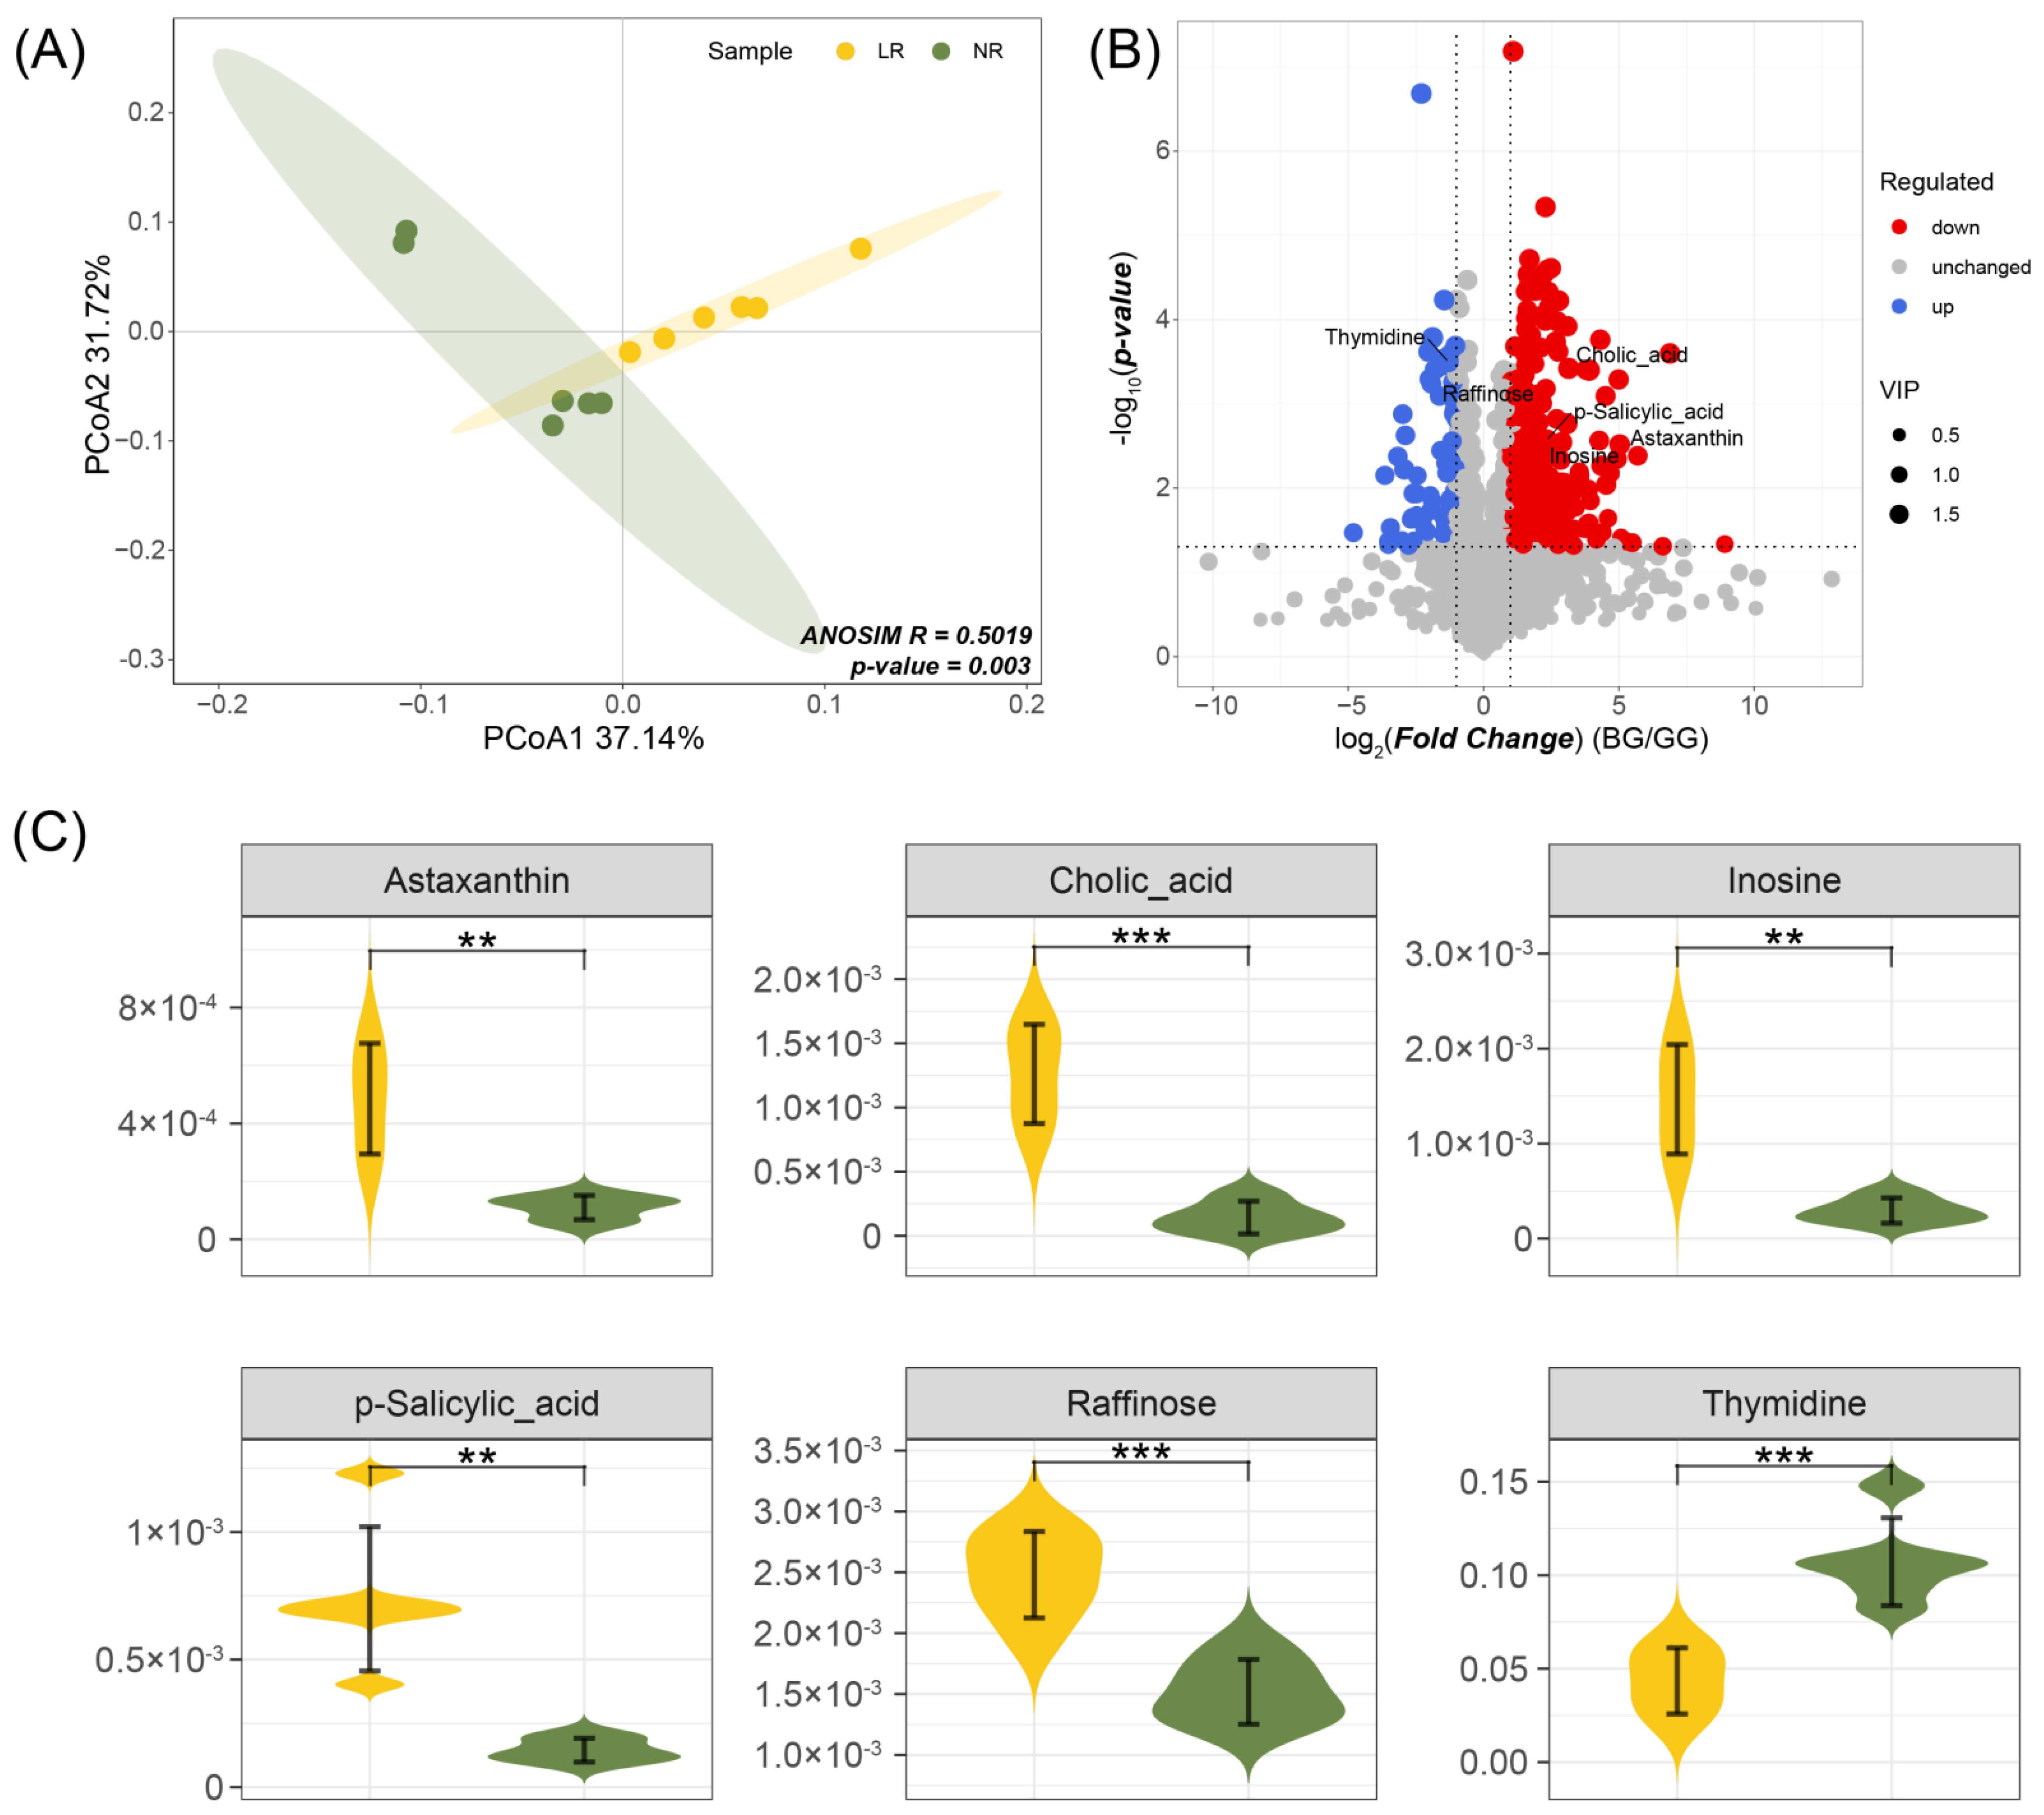
PCoA Analysis and Differential Metabolite Screening

In order to understand the causes of blueberry growth limitation more effectively, we conducted blueberry root metabolite testing. A total of 2012 metabolites were detected in all samples and were analyzed by principal coordinates analysis (PCoA). The results showed good separation of the sample types, reflecting the differences among sample types (Figure 8A). The main components PCoA1 and PCoA2 explained 37% and 32% of the variation, respectively.
According to the criteria of FC > 2, p value < 0.05 and VIP > 1, the differential metabolites were identified. The top six metabolites by p value were thymidine (up-regulated), cholic acid (down-regulated), raffinose (up), p-salicylic acid (down), astaxanthin (down), and inosine (down). Further correlation analysis with these six metabolites showed that astaxanthin, inosine and p-salicylic acid were significantly (p < 0.01) up-regulated, whereas cholic acid and raffinose were up-regulated, and thymidine was down-regulated, extremely significantly (p < 0.001).

3.5. Joint Analysis of Root Metabolome and Soil Microorganisms

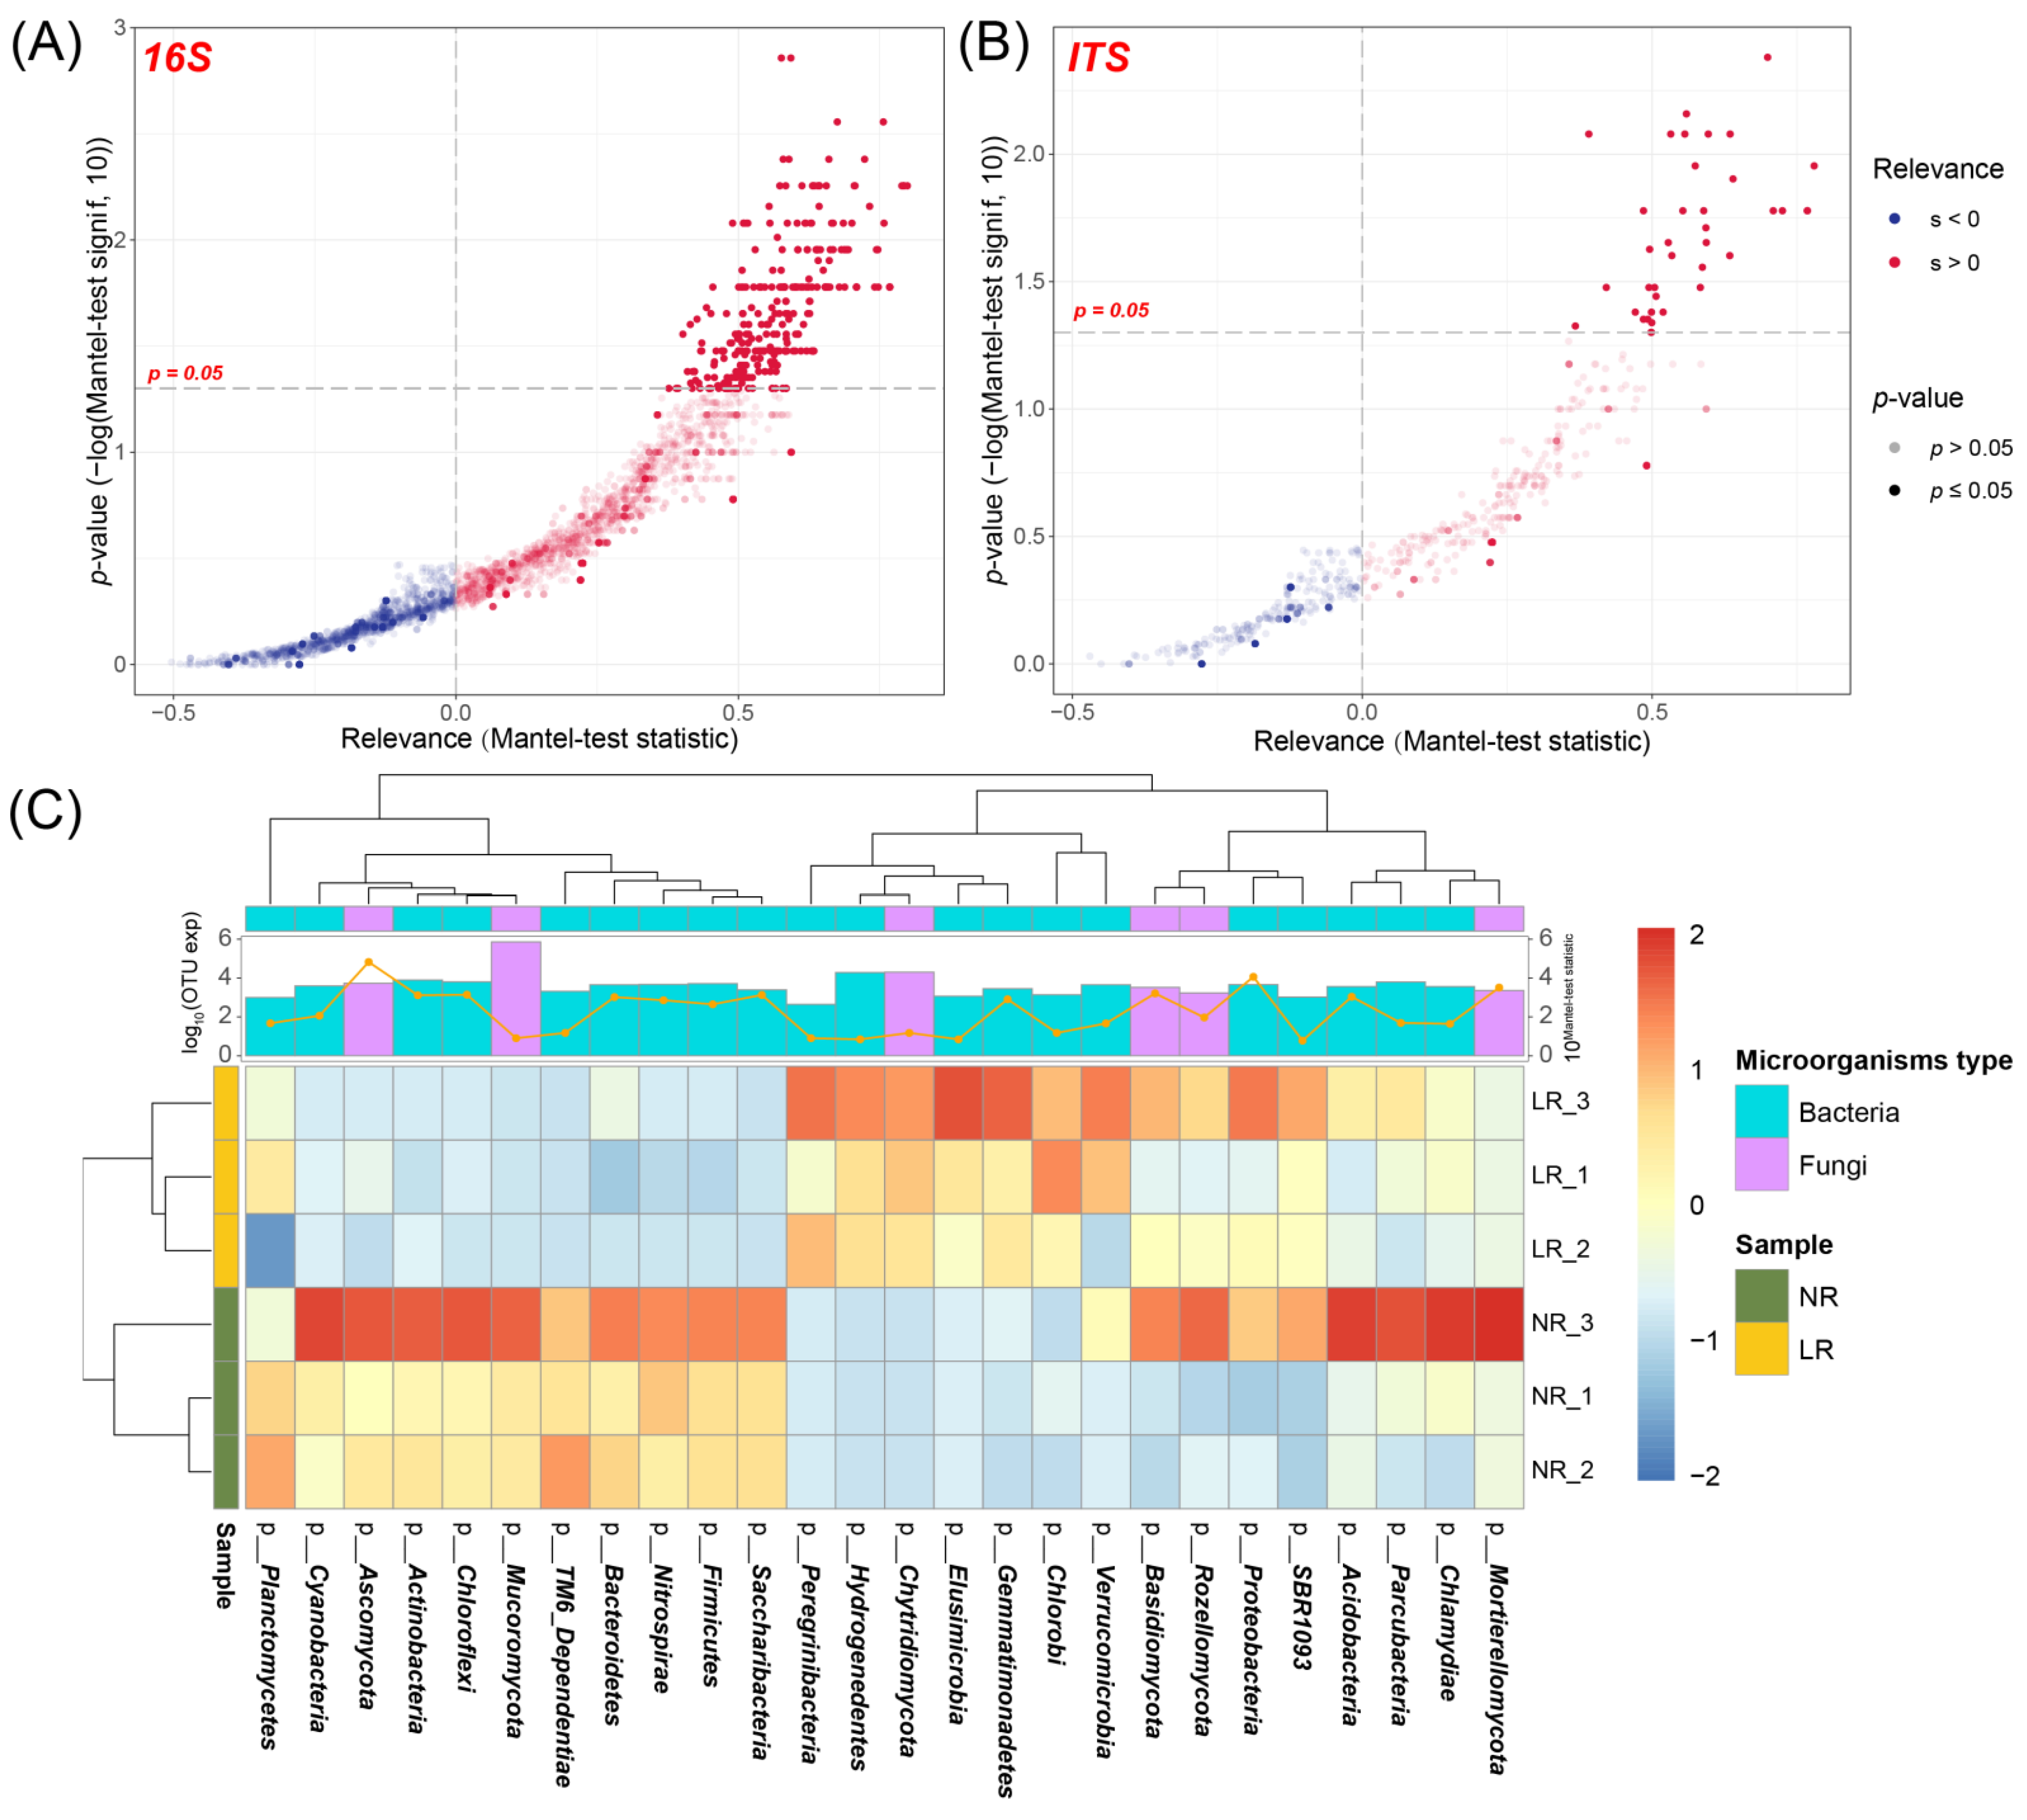
3.5.1. Screening of Microorganisms Related to Root Metabolome

Using p = 0.05 as the dividing line, the OTUs with p < 0.05 are plotted to the upper right (Figure 9A for bacteria and Figure 9B for fungi). The OTUs that met the requirements at the phylum level were used to construct a heat map (Figure 9C). The results showed that the fungal phylum Mucoromycota and Ascomycota had the strongest association with the root metabolome (Figure 9).

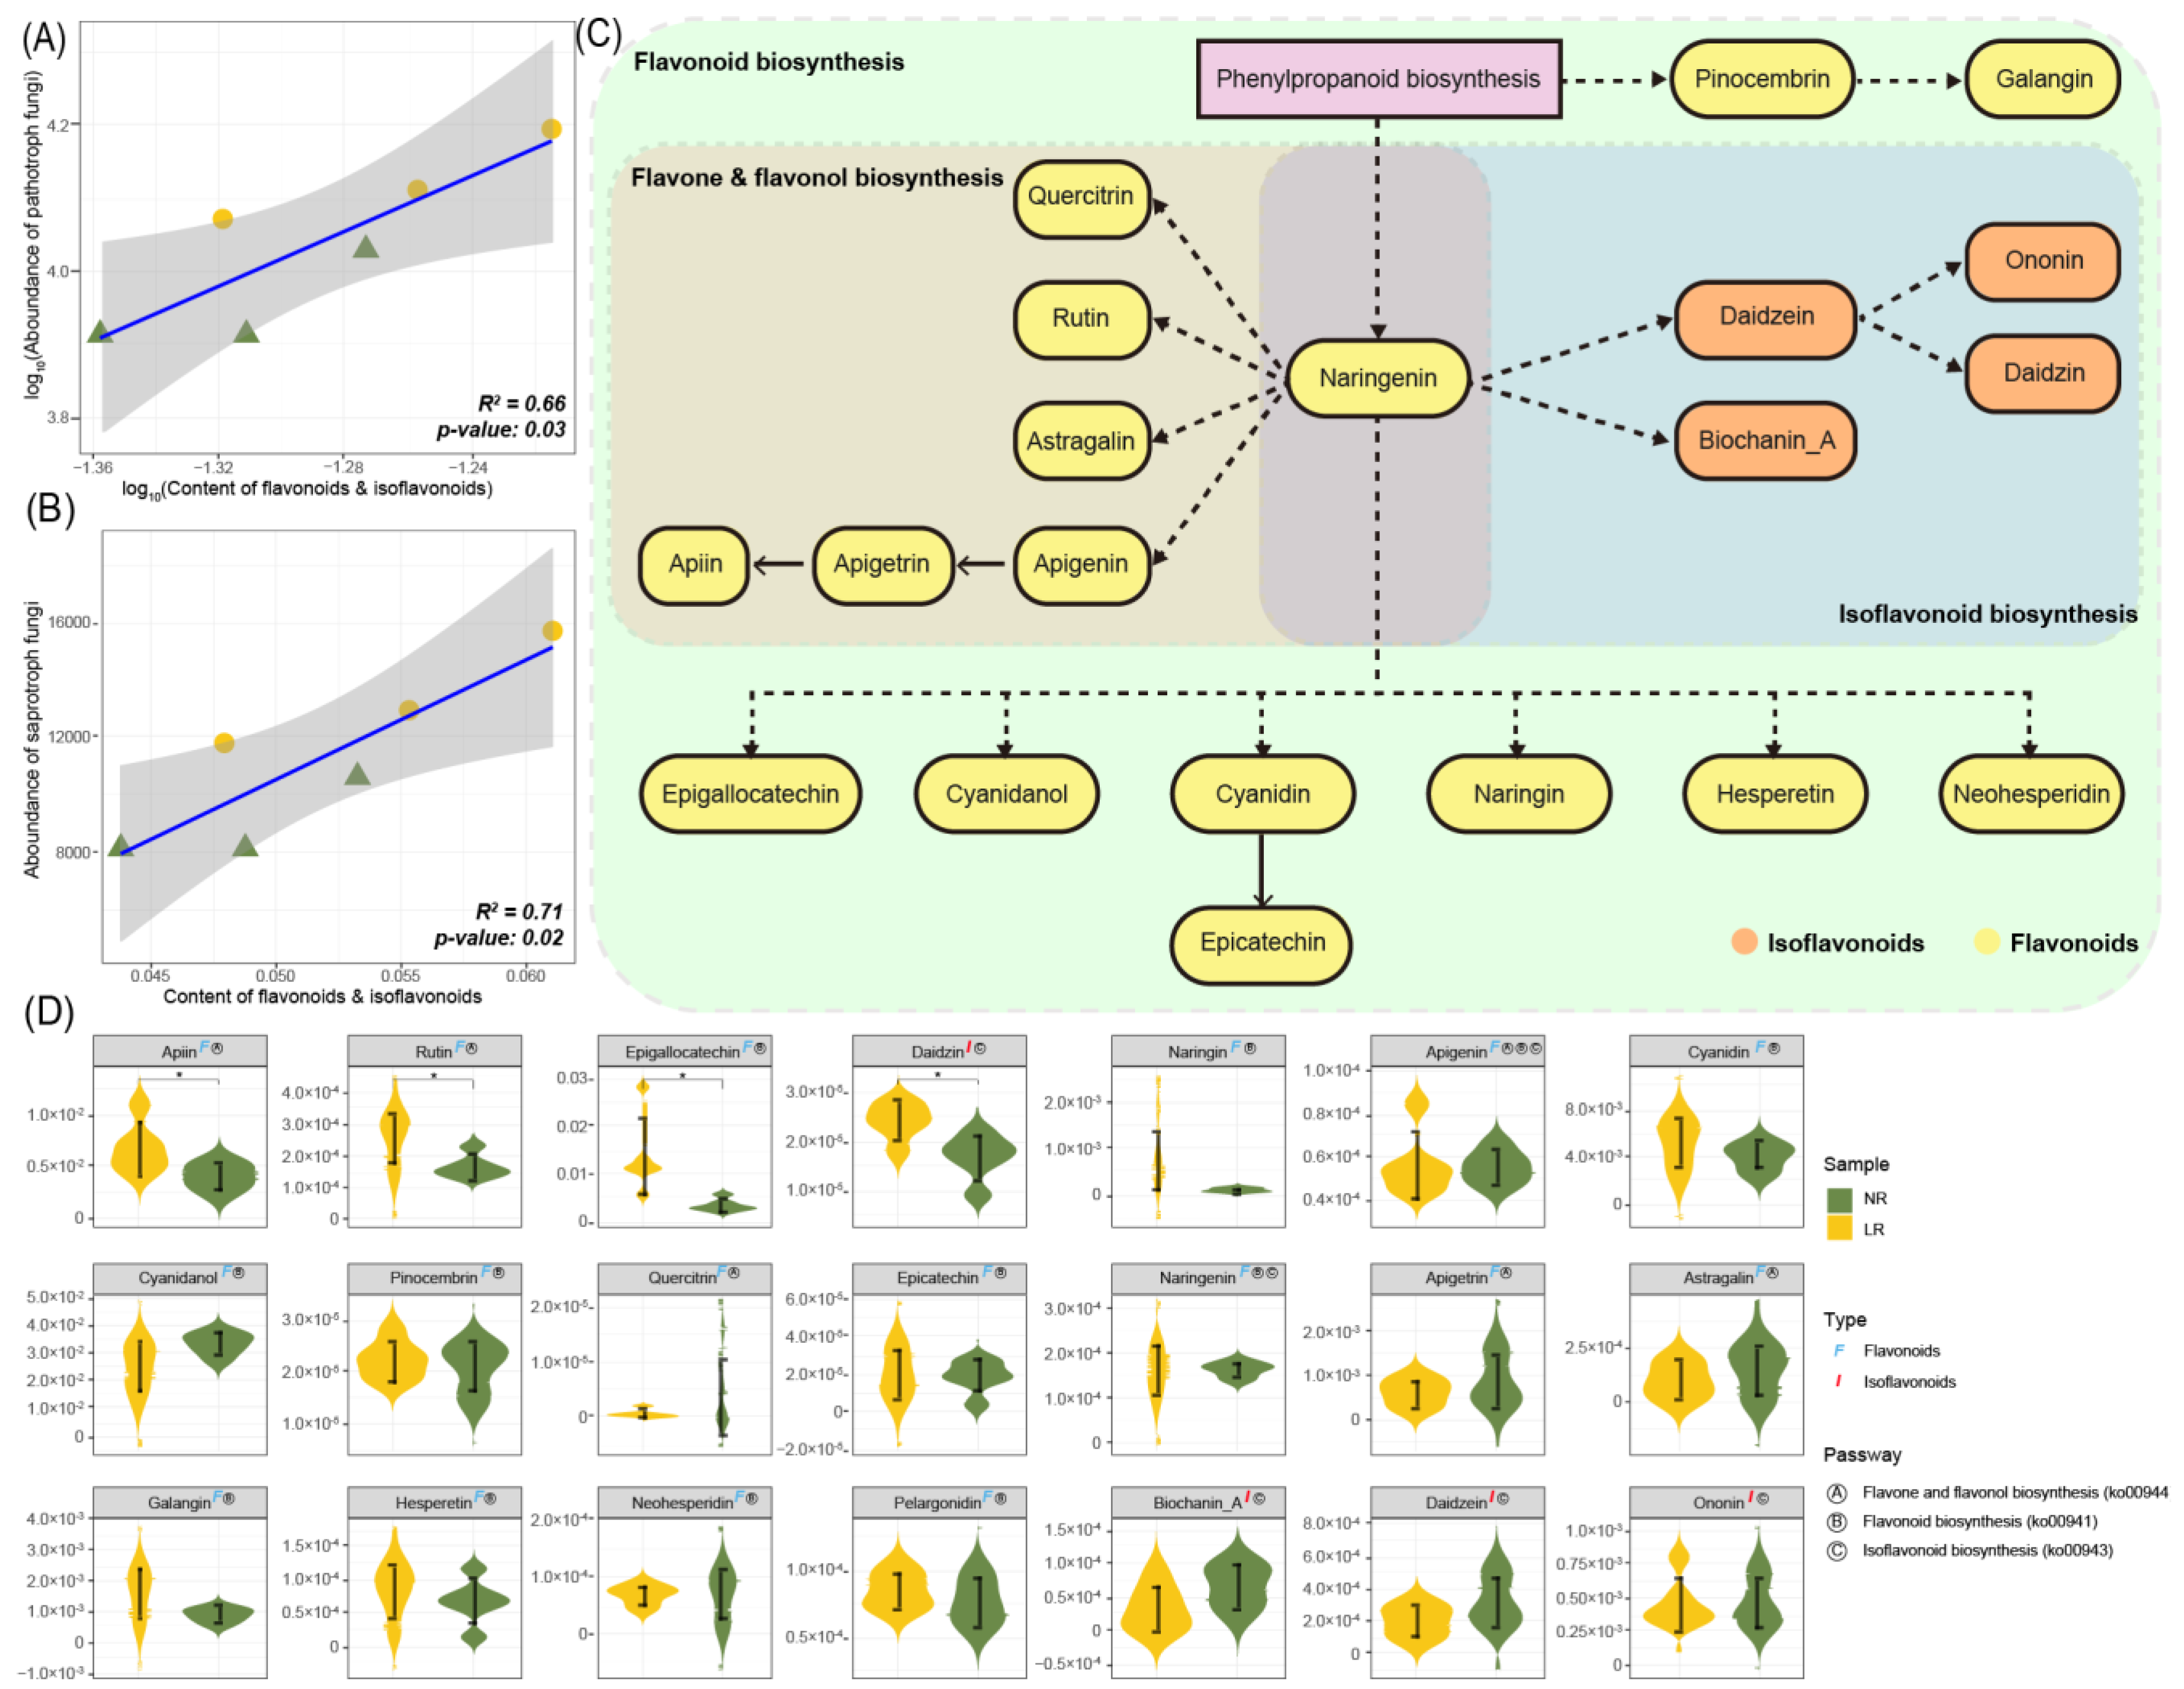
3.5.2. Analysis of Flavonoids in Roots

Anthocyanins (belonging to flavonoids) in blueberry fruits have always been the focus of attention, but there is considerably less knowledge on flavonoids in blueberry roots. We detected different flavone and isoflavone metabolites in blueberry roots. There was a significant linear relationship between accumulation of flavones/isoflavones in roots and the abundance of soil pathotrophic fungi (Figure 10A). Flavonoids in root metabolites were positively correlated with the abundance of saprotrophic fungi (Figure 10B).
We analyzed the range of flavonoids in the metabolites of blueberry roots. Three metabolic pathways were highlighted: flavone and flavonol biosynthesis, flavonoid biosynthesis and isoflavonoid biosynthesis. In the pathway diagram (Figure 10C), phenylpropanoid is a precursor substance for the synthesis of flavonoids. Naringenin participates in all three metabolic pathways and thus occupies a central position. Cyanidin and epicatechin participate directly in the flavonoid biosynthesis. The contents of flavonoids apiin, rutin and epigallocatechin were significantly higher in the root system of limited-growth blueberries than normally growing blueberries. The content of the isoflavone daidzin was significantly higher in the root system of limited-growth than normally growing blueberries (Figure 10D).

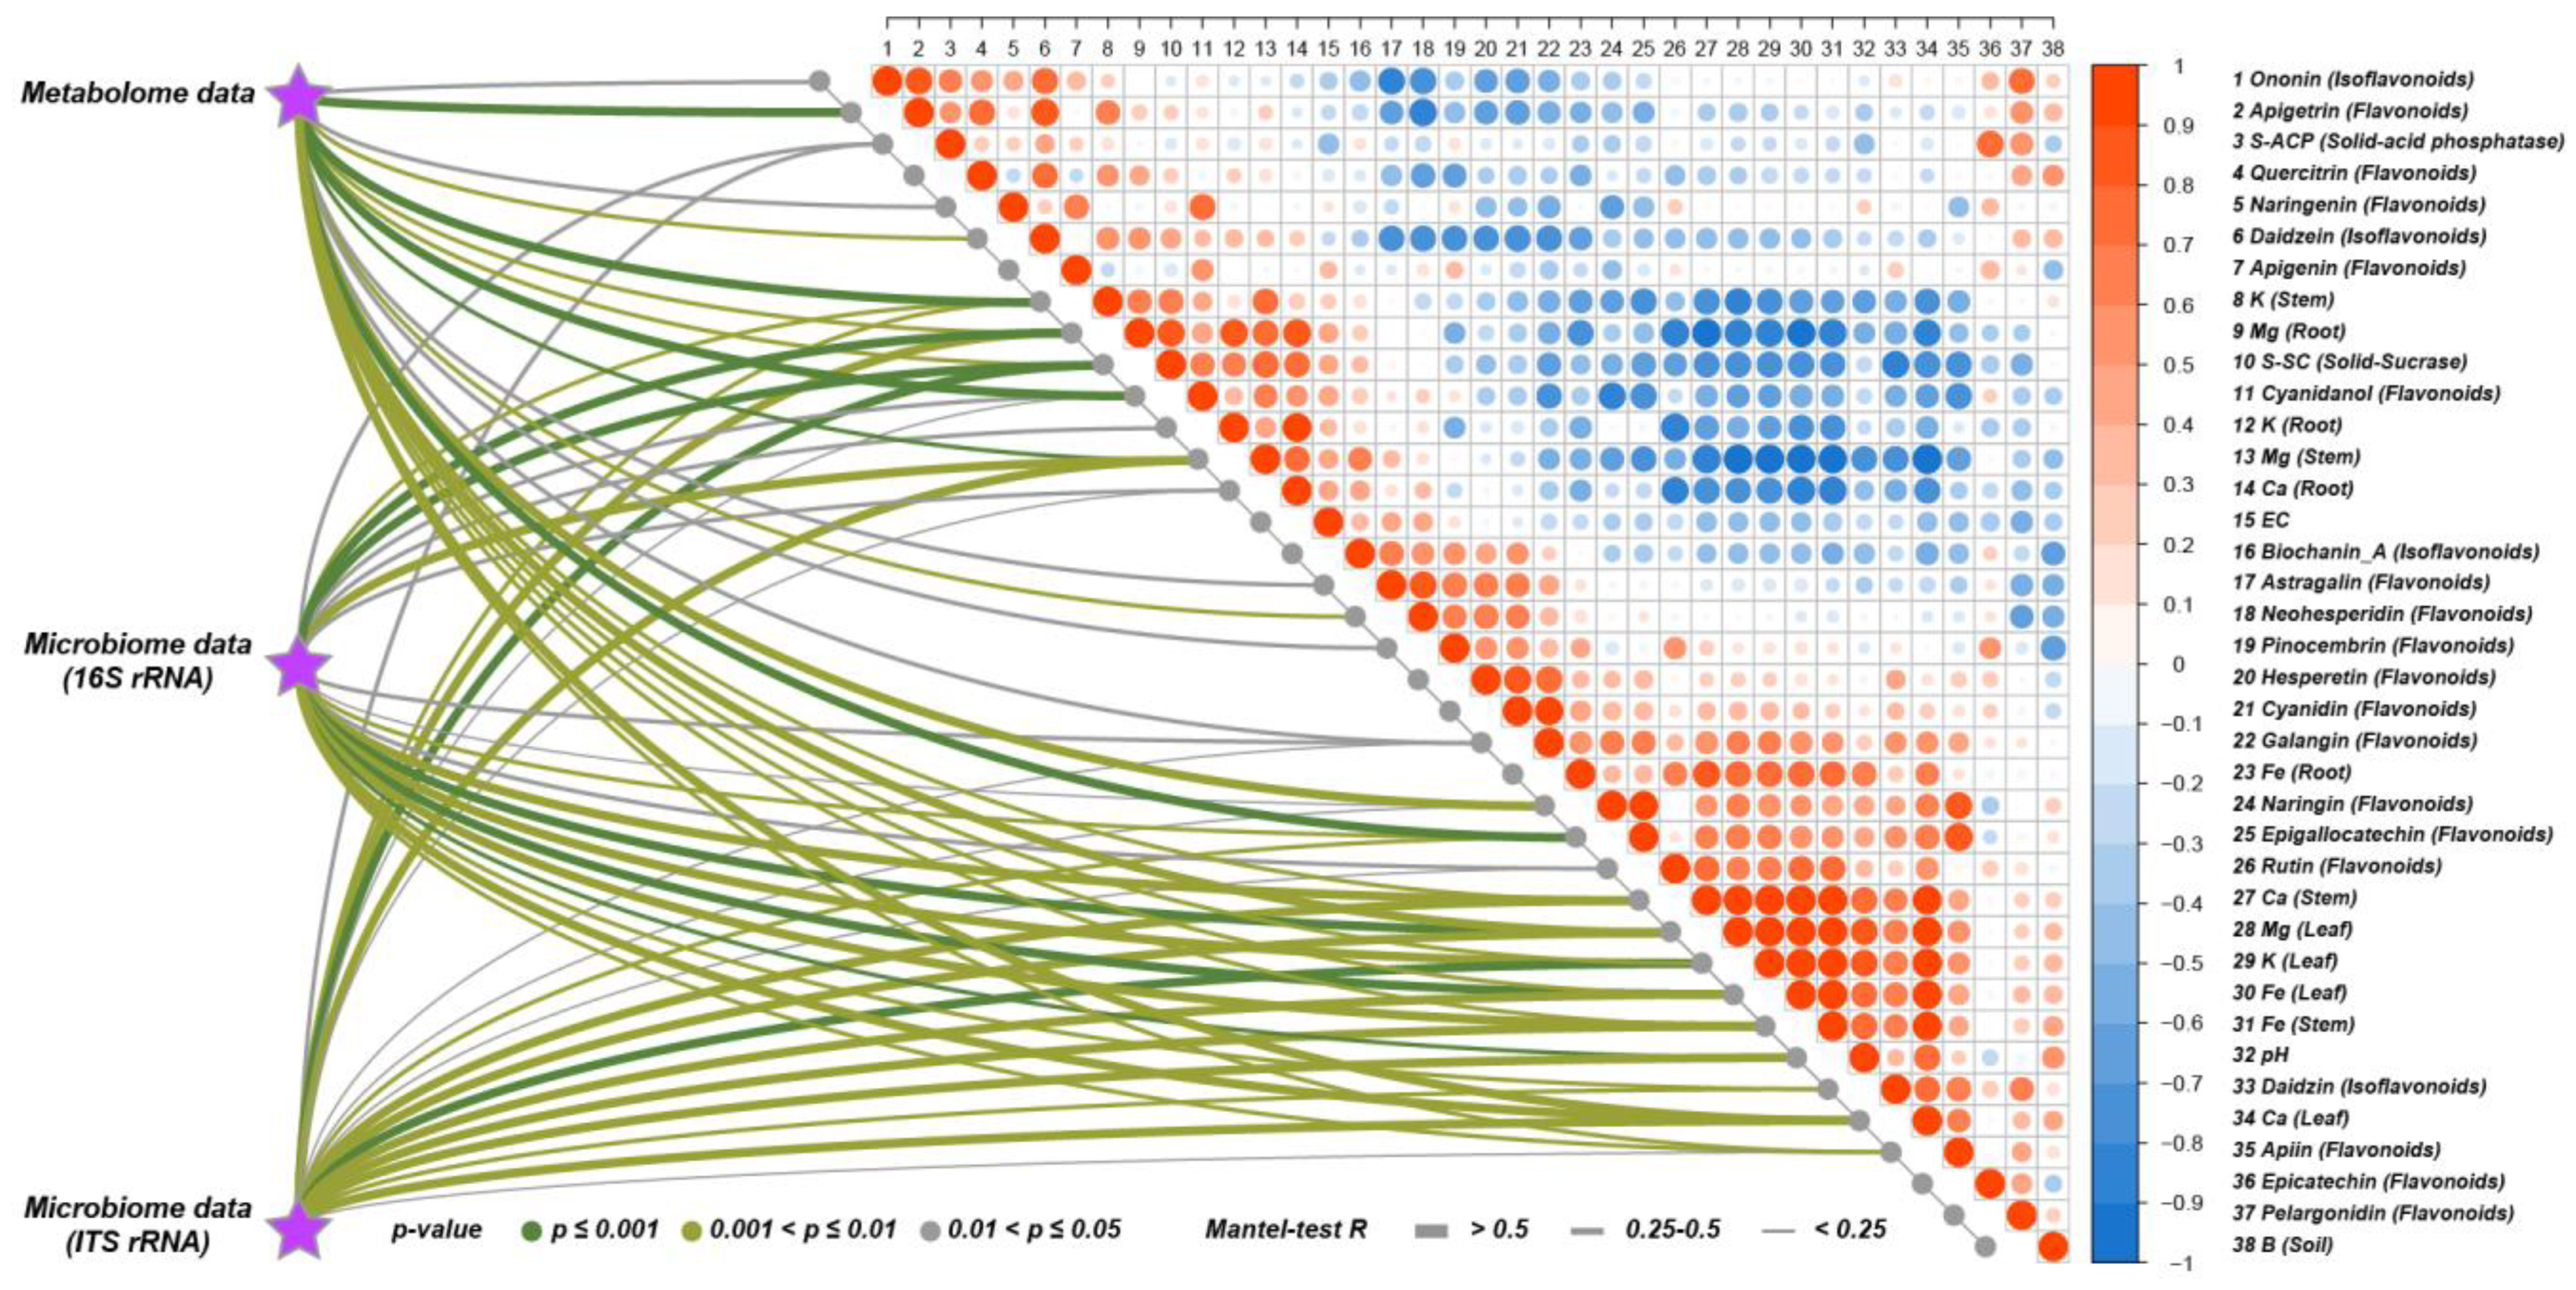
3.6. Correlation Analysis between Environmental Factors and Root Metabolites

We used the Mantel test to evaluate the correlations between environmental factors and root metabolome (Figure 11). There was a significant correlation between pH and nutrient elements in various parts of plants, especially in stems. EC was correlated with flavonoids and isoflavones, and positively correlated with K and Mg concentrations in roots and stems. Invertase was positively correlated with anthocyanins and K and Mg in roots and stems. Soil acid phosphatase was positively correlated with the flavonoids epicatechin and pelargonidin. Flavonoids in the root metabolites of blueberry were significantly positively correlated with the nutrients K, Ca, Mg, and Fe in all plant parts. In addition, the microbial community was negatively correlated with soil acid phosphatase, and negatively correlated with the flavonoids galangin, naringin and rutin.

4. Discussion

There are significant differences in the growth of blueberry plants in soils with high and low pH, with high pH treatment resulting in shallow root systems and the poor growth of blueberries [20]. This phenomenon was also found in our study. The root system of poorly growing blueberries was shallower than that of normal-growth blueberries, and the amount of thin roots was smaller (data not shown). Although the soil pH we measured in the present study was higher than the optimal value of 4.6 for blueberry [21], the rhizosphere soil pH of healthy blueberry plants was lower than 6.0 compared with >6.0 in growth-limited plants (Figure 1). Plant requires the necessary chemical elements and compounds for normal growth [22]. The concentrations of Ca, K, Mg, P, S and Zn in the leaves of normally growing blueberries were significantly higher than those in the limited-growth blueberries, which might lead to yellowing or other symptoms. There was no significant difference for Mn between roots and stems, but the Mn content in leaves of normal-growth blueberry was significantly higher than that of limited-growth blueberry, which could lead to brown spots and leaf necrosis [23].
Most soil enzymes originate from soil microorganisms and plant roots [24]. Soil enzymes can promote matter circulation and energy flow in soil, so soil enzyme activity is often used as an important index to evaluate soil fertility and soil quality [25]. In this study, the activities of two enzymes, acidphosphatase and invertase, were determined. A proportion of soil phosphorus exists in insoluble organic form, and must be mineralized to be utilized as an inorganic nutrient by plants [26]. Some plants catalyze the hydrolysis of organically bound phosphorus in the soil to soluble orthophosphate ions by secreting phosphatase from their roots [27]. In our research, the acid phosphatase activity was significantly higher in the rhizosphere soil of normally growing than growth-limited blueberry plants (Figure 1). The content of invertase was higher in the rhizosphere soil of normally growing than restricted-growth blueberry plants (Figure 1). Further work is needed to ascertain whether this finding is a cause or consequence of the good growth of blueberry plants.
Soil microorganisms are an important part of soil, and the fact that the diversity of the microbial community is controlled by both biological and abiotic factors showed that the conventional farming system led to an emergence of dominant microflora in the soil, resulting in decreased soil microbial diversity [15]. This is consistent with our current study. We found lower microbial diversity in the rhizosphere than non-rhizosphere soil for the normal-growth treatment, and the microbial diversity was lower in the soil supporting normally growing than poorly growing blueberry plants.
In the soil bacterial community, Proteobacteria are usually the most abundant phylum [28]. Large morphological, physiological and metabolic diversity of this phylum underpins its important role in the global carbon, nitrogen and sulfur cycles [29]. Repeated N fertilization practiced in conventional agriculture decreases bacterial diversity in soil, but promotes the growth of Proteobacteria and Actinomycetes [30]. Many bacterial phyla, including Proteobacteria, Actinobacteria, Bacteroidetes, Chloroflexi, etc., that are closely associated with rhizosphere soil contain N2-fixing diazotrophs that can contribute to plant N nutrition [31,32].
In addition to Proteobacteria, our results showed a high relative abundance of Acidobacteria in the rhizosphere and bulk soil of blueberry plants (Figure 4). Although Acidobacteria are ubiquitous, there are relatively few studies on their functions. Analyzing the soil microbiome in wheat fields, Smit et al. [33] found that soil fertility may determine the ratio of Proteobacteria and Acidobacteria, and the low-nutrient soils are enriched in Acidobacteria. Taxa belonging to Acidobacteria may be involved in various biogeochemical cycles in the soil [34].
Saccharibacteria play an important role in the decomposition of various organic substances [35], including pectin, starch, 1,3-β-glucan, hemicellulose, and cellulose, and produce energy by decomposing soil organic matter and plant root exudates into acetic acid or lactic acid [36]. Our results showed that the relative abundance of Saccharibacteria was significantly higher in the rhizosphere soil of normally growing than growth-limited blueberry plants, but there was no significant difference in the relative abundance of Saccharibacteria in the non-rhizosphere soils regardless of the growth status of blueberry plants (Figure 4). This positive correlation between the abundance of Saccharibacteria and the growth of blueberry plants should be explored further.
In RDA analysis, the relative abundance of Proteobacteria and Saccharibacteria and the activity of soil acid phosphatase were positively correlated (Figure 5A), indicating that these interactions may improve the soil environment.
Basidiomycota and Ascomycota interact directly with plants and have the potential to induce the selective decomposition of plant tissues [37]. Moreover, Ascomycota include many destructive plant pathogens that can cause diseases including Dutch elm disease and wheat head blight [38]. In RDA analysis, the relative abundance of Ascomycota was correlated positively with the pH of rhizosphere or non-rhizosphere soil, with higher soil pH and greater Ascomycota abundance in soil supporting growth-limited rather than normally growing blueberry plants (Figure 5B). We suggest that soil pH affects both blueberry plant growth and Ascomycota abundance.
Among root metabolites, raffinose participates in galactose metabolism. Raffinose in plants accumulates in response to abiotic stress [39], for example in different tissues of soybeans under iron deficiency [40]. Legume Macrotyloma uniflorum upregulated the expression of the raffinose synthesis gene in root tissues under drought stress [41]. In our results, raffinose was significantly up-regulated in roots of growth-limited blueberries (Figure 5B). This indicates that the growth-limited blueberries were subjected to abiotic stress and responded to this stress by up-regulating raffinose production.
p-Salicylic acid promotes adventitious root growth and changes the root tip meristem structure at low concentration, but inhibits all root growth processes at high concentration [42]. The application of exogenous salicylic acid may reduce the damaging effects of high temperature, drought and salt stress in barley by enhancing the antioxidant system [43]. Similarly, salicylic acid can improve the tolerance of tomato seedlings to high pH [44]. Astaxanthin is another natural antioxidant that can reduce cadmium toxicity in rice by inhibiting cadmium absorption [45]. In our results, the root metabolites raffinose, p-salicylic acid and astaxanthin were significantly up-regulated in the growth-limited blueberries (Figure 5B). In summary, growth-limited blueberries respond to environmental stress by up-regulating raffinose, p-salicylic acid and astaxanthin in the root system.
Flavonoids are ubiquitous in plants and can have significant antioxidant activity by decreasing the formation of free radicals and scavenging already existing free radicals [46]. They participate not only in the normal growth of plants, but also play an important role in coping with abiotic stresses [47,48]. Apiin is one of the main flavonoids [49]. Plant roots combat Cr toxicity by increasing apiin concentration [50]. Rutin was reported to reduce the harmful effects of mercury chloride on plants and to promote root growth [51]. These findings were consistent with our results; compared with the normal growth of blueberry roots, the flavonoids apiin and rutin in the growth-restricted blueberry roots were up-regulated, indicating that blueberry growth restriction was associated with increasing flavonoids as a putative way to respond to abiotic stress. However, drought stress reduced rutin content in the roots of Bupleurum chinense DC [52]. This is inconsistent with our research results, which may be caused by different types and severities of stress.
The content of daidzin in soybean sprouts gradually increased with the duration of UV-B irradiation [53]. Other studies showed that the content of daidzin in different parts of soybean seedlings exhibited variable trends under ultraviolet radiation (increasing initially, but then decreasing with prolonged exposure) [54]. In the present study, through the joint analysis of root metabolites and soil microorganisms, a positive correlation was revealed between flavonoids and pathogenic fungi. Based on our research results, we suggest that the increased content of apiin, rutin and daidzin in roots of growth-limited blueberries may be a stress response, even though a putative role of these flavonoids in increasing stress resistance might have been hampered by the type and duration of the stresses.

5. Conclusions

The blueberry growth was related to soil pH, and it is not suitable for blueberry cultivation when soil pH is higher than 6. The growth of blueberry was also significantly related to soil organic matter, soil enzyme activity and soil microbial community diversity. The rhizosphere soil invertase and acid phosphatase of normal blueberry were higher, and the relative abundance of white matter bacteria and saccharification bacteria was also higher. In addition, the contents of the flavonoids apin, rutin, daidzin and epigallocatechin were significantly higher in roots of growth-limited blueberries.

Author Contributions

Y.L., X.L., T.S. and X.Z. conceived the ideas and designed methodology; Y.L. and X.G. collected the data; Y.L., Y.Z. and X.Z. analysed the data; Y.Z., T.S. and Z.R. led the writing of the manuscript. All authors have read and agreed to the published version of the manuscript.

Funding

This research received no external funding.

Institutional Review Board Statement

Not applicable.

Informed Consent Statement

Not applicable.

Data Availability Statement

Data can be provided upon request to X.L. and T.S. for non-commercial purposes.

Acknowledgments

This work was financially supported by Forestry Science and Technology Innovation and Extension Project in Jiangsu Province (No. LYKJ[2019]07), the Wuxiang Mountain talent program of Lishui Distric, Nanjing.

Conflicts of Interest

The authors declare that they have no conflict of interest.

References

  1. Lo Vasco, V.R.; Leopizzi, M.; Di Maio, V.; Di Raimo, T.; Cesa, S.; Masci, A.; Rocca, C.D. LPS, Oleuropein and blueberry extracts affect the survival, morphology and phosphoinositide signalling in stimulated human endothelial cells. J. Cell Commun. Signal. 2017, 11, 317–327. [Google Scholar] [CrossRef] [PubMed] [Green Version]
  2. Li, D.; Li, B.; Ma, Y.; Sun, X.; Lin, Y.; Meng, X. Polyphenols, anthocyanins, and flavonoids contents and the antioxidant capacity of various cultivars of highbush and half-high blueberries. J. Food Compos. Anal. 2017, 62, 84–93. [Google Scholar] [CrossRef]
  3. Holzapfel, E.A.; Hepp, R.F.; Mariño, M.A. Effect of irrigation on fruit production in blueberry. Agric. Water Manag. 2004, 67, 173–184. [Google Scholar] [CrossRef]
  4. Paal, T.; Starast, M.; Noormets-Šanski, M.; Vool, E.; Tasa, T.; Karp, K. Influence of liming and fertilization on lowbush blueberry in harvested peat field condition. Sci. Hortic. 2011, 130, 157–163. [Google Scholar] [CrossRef]
  5. Chang, C.J.; Donaldson, R.; Brannen, P.; Krewer, G.; Boland, R. Bacterial Leaf Scorch, a new blueberry disease caused by Xylella fastidiosa. HortScience 2009, 44, 413–417. [Google Scholar] [CrossRef]
  6. Machado, R.M.A.; Bryla, D.R.; Vargas, O. Effects of salinity induced by ammonium sulfate fertilizer on root and shoot growth of highbush blueberry. Acta Hortic. 2014, 1017, 407–414. [Google Scholar] [CrossRef] [Green Version]
  7. Spiers, J.M.; Braswell, J.H. Soil-applied sulfur affects elemental leaf content and growth of ‘tifblue’ rabbiteye blueberry. J. Am. Soc. Hortic. Sci. 1992, 117, 230–233. [Google Scholar] [CrossRef] [Green Version]
  8. Tamir, G.; Zilkah, S.; Dai, N.; Shawahna, R.; Cohen, S.; Bar Tal, A. Combined effects of CaCO3 and the proportion of N-NH4+ among the total applied inorganic N on the growth and mineral uptake of rabbiteye blueberry. J. Soil Sci. Plant Nutr. 2020, 21, 35–48. [Google Scholar] [CrossRef]
  9. Anna, G.; Karolina, G.; Jarosław, G.; Magdalena, F.; Jerzy, K. Microbial community diversity and the interaction of soil under maize growth in different cultivation techniques. Plant Soil Environ. 2017, 63, 264–270. [Google Scholar] [CrossRef] [Green Version]
  10. Sasse, J.; Martinoia, E.; Northen, T. Feed your friends: Do plant exudates shape the root microbiome? Trends Plant Sci. 2018, 23, 25–41. [Google Scholar] [CrossRef] [Green Version]
  11. Salloum, M.S.; Menduni, M.F.; Benavides, M.P.; Larrauri, M.; Luna, C.M.; Silvente, S. Polyamines and flavonoids: Key compounds in mycorrhizal colonization of improved and unimproved soybean genotypes. Symbiosis 2018, 76, 265–275. [Google Scholar] [CrossRef]
  12. Lareen, A.; Burton, F.; Schäfer, P. Plant root-microbe communication in shaping root microbiomes. Plant Mol. Biol. 2016, 90, 575–587. [Google Scholar] [CrossRef] [PubMed] [Green Version]
  13. White, L.J.; Jothibasu, K.; Reese, R.N.; Brözel, V.S.; Subramanian, S. Spatio temporal influence of isoflavonoids on bacterial diversity in the soybean rhizosphere. Mol. Plant-Microbe Interact. 2015, 28, 22–29. [Google Scholar] [CrossRef] [PubMed] [Green Version]
  14. Chen, S.; Zhu, Y.; Shao, T.; Long, X.; Gao, X.; Zhou, Z. Relationship between rhizosphere soil properties and disease severity in highbush blueberry (Vaccinium corymbosum). Appl. Soil Ecol. 2019, 137, 187–194. [Google Scholar] [CrossRef]
  15. Zhu, T.; Shao, T.; Liu, J.; Li, N.; Long, X.; Gao, X.; Rengel, Z. Improvement of physico-chemical properties and microbiome in different salinity soils by incorporating Jerusalem artichoke residues. Appl. Soil Ecol. 2021, 158, 103791. [Google Scholar] [CrossRef]
  16. Shao, T.; Long, X.; Liu, Y.; Gao, X.; Liu, M.; Rengel, Z. Effect of industrial crop Jerusalem artichoke on the micro-ecological rhizosphere environment in saline soil. Appl. Soil Ecol. 2021, 166, 104080. [Google Scholar] [CrossRef]
  17. Shao, T.; Gu, X.; Zhu, T.; Pan, X.; Zhu, Y.; Long, X.; Shao, H.; Liu, M.; Rengel, Z. Industrial crop Jerusalem artichoke restored coastal saline soil quality by reducing salt and increasing diversity of bacterial community. Appl. Soil Ecol. 2019, 138, 195–206. [Google Scholar] [CrossRef]
  18. Li, N.; Shao, T.; Zhou, Y.; Cao, Y.; Hu, H.; Sun, Q.; Long, X.; Yue, Y.; Gao, X.; Rengel, Z. Effects of planting Melia azedarach L. on soil properties and microbial community in saline-alkali soil. Land Degrad. Dev. 2021, 32, 2951–2961. [Google Scholar] [CrossRef]
  19. Souza, S.O.; Costa, S.S.L.; Brum, B.C.T.; Santos, S.H.; Garcia, C.A.B.; Araujo, R.G.O. Determination of nutrients in sugarcane juice using slurry sampling and detection by ICP OES. Food Chem. 2019, 273, 57–63. [Google Scholar] [CrossRef]
  20. Finn, C.E.; Luby, J.J.; Rosen, C.J.; Ascher, P.D. Blueberry germplasm screening at several soil pH regimes. I. Plant Survival and Growth. J. Am. Soc. Hortic. Sci. 1993, 118, 377–382. [Google Scholar] [CrossRef] [Green Version]
  21. Haynes, R.J.; Swift, R.S. Effects of liming on the extractability of Fe, Mn, Zn and Cu from a peat medium and the growth and micronutrient uptake of highbush blueberry plants. Plant Soil 1985, 84, 213–223. [Google Scholar] [CrossRef]
  22. Tiffin, L.O. Mineral Nutrition of Plants: Principles and Perspectives. Soil Sci. Soc. Am. J. 1972, 36, 78. [Google Scholar] [CrossRef]
  23. Schmidt, S.B.; Husted, S. The Biochemical Properties of Manganese in Plants. Plants 2019, 8, 381. [Google Scholar] [CrossRef] [PubMed] [Green Version]
  24. Shiel, R.S. Book review: Soil organic matter and biological activity. Outlook Agric. 1987, 16, 203. [Google Scholar] [CrossRef]
  25. Schomburg, I.; Chang, A.; Placzek, S.; Söhngen, C.; Rother, M.; Lang, M.; Munaretto, C.; Ulas, S.; Stelzer, M.; Grote, A.; et al. BRENDA in 2013: Integrated reactions, kinetic data, enzyme function data, improved disease classification: New options and contents in BRENDA. Nucleic Acids Res. 2012, 41, D764–D772. [Google Scholar] [CrossRef] [PubMed] [Green Version]
  26. Turner, B.L.; Cade-Menun, B.J.; Condron, L.M.; Newman, S. Extraction of soil organic phosphorus. Talanta 2005, 66, 294–306. [Google Scholar] [CrossRef]
  27. Lee, J.J.; Park, R.D.; Kim, Y.W.; Shim, J.H.; Chae, D.H.; Rim, Y.S.; Sohn, B.K.; Kim, T.H.; Kim, K.Y. Effect of food waste compost on microbial population, soil enzyme activity and lettuce growth. Bioresour. Technol. 2004, 93, 21–28. [Google Scholar] [CrossRef]
  28. Janssen, P.H. Identifying the dominant soil bacterial taxa in libraries of 16s rRNA and 16s rRNA genes. Appl. Environ. Microbiol. 2006, 72, 1719–1728. [Google Scholar] [CrossRef] [Green Version]
  29. Kersters, K.; De Vos, P.; Gillis, M.; Swings, J.; Vandamme, P.; Stackebrandt, E. Introduction to the proteobacteria. In The Prokaryotes: A Handbook on the Biology of Bacteri; Springer: Berlin/Heidelberg, Germany, 2006; pp. 3–37. [Google Scholar] [CrossRef]
  30. Dai, Z.; Su, W.; Chen, H.; Barberán, A.; Zhao, H.; Yu, M.; Yu, L.; Brookes, P.C.; Schadt, C.W.; Chang, S.X.; et al. Long-term nitrogen fertilization decreases bacterial diversity and favors the growth of Actinobacteria and Proteobacteria in agro-ecosystems across the globe. Glob. Change Biol. 2018, 24, 3452–3461. [Google Scholar] [CrossRef]
  31. Roley, S.S.; Xue, C.; Hamilton, S.K.; Tiedje, J.M.; Robertson, G.P. Isotopic evidence for episodic nitrogen fixation in switchgrass (Panicum virgatum L.). Soil Biol. Biochem. 2019, 129, 90–98. [Google Scholar] [CrossRef]
  32. Szymańska, S.; Borruso, L.; Brusetti, L.; Hulisz, P.; Furtado, B.; Hrynkiewicz, K. Bacterial microbiome of root-associated endophytes of Salicornia europaea in correspondence to different levels of salinity. Environ. Sci. Pollut. Res. 2018, 25, 25420–25431. [Google Scholar] [CrossRef] [PubMed] [Green Version]
  33. Smit, E.; Leeflang, P.; Gommans, S.; Broek, J.; van den Mil, S.; van Wernars, K. Diversity and seasonal fluctuations of the dominant members of the bacterial soil community in a wheat field as determined by cultivation and molecular methods. Appl. Environ. Microbiol. 2001, 67, 2284–2291. [Google Scholar] [CrossRef] [PubMed] [Green Version]
  34. Lee, S.H.; Ka, J.O.; Cho, J.C. Members of the phylum acidobacteria are dominant and metabolically active in rhizosphere soil. FEMS Microbiol. Lett. 2008, 285, 263–269. [Google Scholar] [CrossRef] [PubMed] [Green Version]
  35. Kindaichi, T.; Yamaoka, S.; Uehara, R.; Ozaki, N.; Ohashi, A.; Albertsen, M.; Nielsen, P.H.; Nielsen, J.L. Phylogenetic diversity and ecophysiology of Candidate phylum Saccharibacteria in activated sludge. FEMS Microbiol. Ecol. 2016, 92, fiw078. [Google Scholar] [CrossRef] [PubMed] [Green Version]
  36. Starr, E.P.; Shi, S.; Blazewicz, S.J.; Probst, A.J.; Herman, D.J.; Firestone, M.A.; Banfield, J.F. Stable isotope informed genome-resolved metagenomics reveals that Saccharibacteria utilize microbially processed plant derived carbon. Microbiome 2018, 6, 122. [Google Scholar] [CrossRef] [PubMed] [Green Version]
  37. Challacombe, J.F.; Hesse, C.N.; Bramer, L.M.; McCue, L.A.; Lipton, M.; Purvine, S.; Nicora, C.; Gallegos-Graves, L.V.; Porras-Alfaro, A.; Kuske, C.R. Genomes and secretomes of Ascomycota fungi reveal diverse functions in plant biomass decomposition and pathogenesis. BMC Genom. 2019, 20, 976. [Google Scholar] [CrossRef] [Green Version]
  38. Berbee, M.L. The phylogeny of plant and animal pathogens in the Ascomycota. Physiol. Mol. Plant Pathol. 2001, 59, 165–187. [Google Scholar] [CrossRef] [Green Version]
  39. Kito, K.; Yamane, K.; Yamamori, T.; Matsuhira, H.; Tanaka, Y.; Takabe, T. Isolation, functional characterization and stress responses of raffinose synthase genes in sugar beet. J. Plant Biochem. Biotechnol. 2018, 27, 36–45. [Google Scholar] [CrossRef]
  40. Chu, Q.; Sha, Z.; Maruyama, H.; Yang, L.; Pan, G.; Xue, L.; Watanabe, T. Metabolic reprogramming in nodules, roots, and leaves of symbiotic soybean in response to iron deficiency. Plant Cell Environ. 2019, 42, 3027–3043. [Google Scholar] [CrossRef]
  41. George, S.; Manoharan, D.; Li, J.; Britton, M.; Parida, A. Drought and salt stress in macrotyloma uniflorum leads to common and specific transcriptomic responses and reveals importance of raffinose family oligosaccharides in stress tolerance. Gene Rep. 2018, 10, 7–16. [Google Scholar] [CrossRef]
  42. Pasternak, T.; Groot, E.P.; Kazantsev, F.V.; Teale, W.; Omelyanchuk, N.; Kovrizhnykh, V.; Palme, K.; Mironova, V.V. Salicylic acid affects root meristem patterning via auxin distribution in a concentration-dependent manner. Plant Physiol. 2019, 180, 1725–1739. [Google Scholar] [CrossRef] [PubMed]
  43. Torun, H. Time-course analysis of salicylic acid effects on ROS regulation and antioxidant defense in roots of hulled and hulless barley under combined stress of drought, heat and salinity. Physiol. Plant. 2019, 165, 169–182. [Google Scholar] [CrossRef] [PubMed]
  44. Khan, A.; Kamran, M.; Imran, M.; Al-Harrasi, A.; Al-Rawahi, A.; Al-Amri, I.; Lee, I.-J.; Khan, A.L. Silicon and salicylic acid confer high-pH stress tolerance in tomato seedlings. Sci. Rep. 2019, 9, 19788. [Google Scholar] [CrossRef] [PubMed] [Green Version]
  45. Dai, S.; Wang, B.; Song, Y.; Xie, Z.; Li, C.; Li, S.; Huang, Y.; Jiang, M. Astaxanthin and its gold nanoparticles mitigate cadmium toxicity in rice by inhibiting cadmium translocation and uptake. Sci. Total Environ. 2021, 786, 147496. [Google Scholar] [CrossRef]
  46. Pietta, P.G. Flavonoids as Antioxidants. J. Nat. Prod. 2000, 63, 1035–1042. [Google Scholar] [CrossRef]
  47. Fini, A.; Brunetti, C.; Ferdinando, M.D.; Ferrini, F.; Tattini, M. Stress-induced flavonoid biosynthesis and the antioxidant machinery of plants. Plant Signal. Behav. 2011, 6, 709–711. [Google Scholar] [CrossRef]
  48. Gharibi, S.; Sayed Tabatabaei, B.E.; Saeidi, G.; Talebi, M.; Matkowski, A. The effect of drought stress on polyphenolic compounds and expression of flavonoid biosynthesis related genes in Achillea pachycephala Rech.f. Phytochemistry 2019, 162, 90–98. [Google Scholar] [CrossRef]
  49. Fejes, S.; Lemberkovics, E.; Balázs, A.; Apáti, P.; Kristó, T.S.; Szöke, E.; Kery, A.; Blázovics, A. Antioxidant activity of different compounds from Anthriscus cerefolium L. (Hoffm.). Acta Hortic. 2003, 597, 191–198. [Google Scholar] [CrossRef]
  50. Pradas del Real, A.E.; Silvan, J.M.; de Pascual-Teresa, S.; Guerrero, A.; García-Gonzalo, P.; Lobo, M.C.; Pérez-Sanz, A. Role of the polycarboxylic compounds in the response of Silene vulgaris to chromium. Environ. Sci. Pollut. Res. 2017, 24, 5746–5756. [Google Scholar] [CrossRef]
  51. De Matos, Y.M.L.S.; Vasconcelos, D.L.M.; Barreto, A.C.H.; Rocha, J.E.; Neto, J.B.; Campina, F.F.; de A. M. Guedes, T.T.; Sousa, A.K.; Teixeira, R.N.P.; Alvarez-Pizarro, J.C.; et al. Reduction of the phytotoxic effect of mercury chloride by rutin and evaluation of interactions by vibrational spectroscopy (Raman and FTIR). Vib. Spectrosc. 2020, 109, 103084. [Google Scholar] [CrossRef]
  52. Yang, L.-L.; Yang, L.; Yang, X.; Zhang, T.; Lan, Y.; Zhao, Y.; Han, M.; Yang, L.-M. Drought stress induces biosynthesis of flavonoids in leaves and saikosaponins in roots of Bupleurum chinense DC. Phytochemistry 2020, 177, 112434. [Google Scholar] [CrossRef] [PubMed]
  53. Lim, Y.J.; Jeong, H.Y.; Gil, C.S.; Kwon, S.J.; Na, J.K.; Lee, C.; Eom, S.H. Isoflavone accumulation and the metabolic gene expression in response to persistent UV-B irradiation in soybean sprouts. Food Chem. 2020, 303, 125376. [Google Scholar] [CrossRef] [PubMed]
  54. Lim, Y.J.; Lyu, J.I.; Kwon, S.J.; Eom, S.H. Effects of UV-A radiation on organ-specific accumulation and gene expression of isoflavones and flavonols in soybean sprout. Food Chem. 2021, 339, 128080. [Google Scholar] [CrossRef] [PubMed]
Figure 1. Chemical properties of soils supporting normal or limited growth of highbush blueberry plants. S-SC-soil saccharase (invertase); NR-rhizosphere soil of normally growing plants; LR-rhizosphere soil of plants with limited growth; N-bulk soil of normally growing plants; L-bulk soil of plants with limited growth. Different lower-case letters indicate significant differences (p ≤ 0.05).
Agronomy 12 01263 g001
Figure 2. Elemental content in roots, stems and leaves of highbush blueberry plants with normal or limited growth. NR-normally growing plants; LR-limited-growth plants. For individual elements and tissues, different lower-case letters indicate significant differences (p ≤0.05).
Agronomy 12 01263 g002
Figure 3. Alpha diversity indices of bacteria (16S) and fungi (ITS) in soil supporting highbush blueberry plants with normal or limited growth. NR-rhizosphere soil of normally growing plants; LR-rhizosphere soil of plants with limited growth; N-bulk soil of normally growing plants; L-bulk soil of plants with limited growth.
Agronomy 12 01263 g003
Figure 4. The relative abundance of the top bacterial (16S) and fungal (ITS) phyla and principal co-ordinates analysis in the rhizosphere and bulk soil of highbush blueberry plants with normal or limited growth. NR-rhizosphere soil of normally growing plants; LR-rhizosphere soil of plants with limited growth; N-bulk soil of normally growing plants; L-bulk soil of plants with limited growth. Different lower-case letters indicate significant differences (p ≤ 0.05).
Agronomy 12 01263 g004
Figure 5. Redundancy analysis between bacterial (A) and fungal phyla (B) and the physical and chemical properties of soils supporting normal or limited growth of highbush blueberry plants. NR-rhizosphere soil of normally growing plants; LR-rhizosphere soil of plants with limited growth; N-bulk soil of normally growing plants; L-bulk soil of plants with limited growth. The colored dots are replicate samples of different sample types, and the geometric shapes are bacterial or fungal phyla.
Agronomy 12 01263 g005
Figure 6. Prediction of function of soil bacteria associated with normal-growth and limited-growth highbush blueberry plants. NR-rhizosphere soil of normally growing plants; LR-rhizosphere soil of plants with limited growth; N-bulk soil of normally growing plants; L-bulk soil of plants with limited growth. (A) Distribution of KO entries for predicted gene function. (B) Principal co-ordinates analysis of predicted gene function of bacteria. (C) Predicted distribution of KEGG pathway categories.
Agronomy 12 01263 g006
Figure 7. Prediction of function of soil fungi associated with normal-growth and limited-growth highbush blueberry plants. LR-rhizosphere soil of plants with limited growth; N-bulk soil of normally growing plants; L-bulk soil of plants with limited growth. (A) Principal co-ordinates analysis of predicted gene function of fungi. (B) Predicted distribution of the fungal taxa. NR-rhizosphere soil of normally growing plants. (C) Predicted fungal growth morphology. (D) Predicted fungal phenotypes regarding decomposition of carbon-containing compounds. (E) Venn diagram of the main nutritional mode of fungi.
Agronomy 12 01263 g007
Figure 8. PCoA analysis of root metabolites of highbush blueberry with normal or limited growth. N-normally growing plants; L-plants with limited growth. ** p < 0.01, *** p < 0.001. The error bar represents the standard error value of three replicates. (A) Principal co-ordinates analysis of root metabolites. (B) Differential metabolite volcano map. (C) Changes in expression of differential metabolites.
Agronomy 12 01263 g008
Figure 9. Identification of microorganism taxa related to root metabolome. NR- rhizosphere soil of normally growing plants; LR- rhizosphere soil of plants with limited growth. (A) Scatter plot of bacterial taxa related to the root metabolome data. (B) Scatter plot of fungal taxa related to the root metabolome data. (C) The heat map relating the abundance of bacteria and fungi to the root metabolome. The values in the middle heat map are the Z values of the relative abundance of bacteria or fungi in each row after standardization.
Agronomy 12 01263 g009
Figure 10. Differences in flavonoids in highbush blueberry roots. NR-rhizosphere soil of normally growing plants; LR-rhizosphere soil of plants with limited growth. * significant difference (p ≤ 0.05). The error bar represents the standard error of three replicates. (A) A linear relationship between the abundance of pathogenic fungi in rhizosphere soil and content of flavonoids in roots. (B) A linear relationship between abundance of saprotrophic fungi in rhizosphere soil and content of flavonoids in roots. (C) Links among biosynthetic pathways of various flavonoids. (D) Differences in root content of flavonoids between blueberry plants with normal and restricted growth.
Agronomy 12 01263 g010
Figure 11. Correlation analysis of soil and plant chemical properties and root metabolome. The color gradient on the right represents Spearman’s correlation coefficients. The chemical properties and metabolites used have passed the partial Mantel tests. The thickness of the curve in the figure is proportional to the Mantel r statistic of the corresponding distance correlation, and the color of the curve indicates the statistical significance based on 9999 permutations (the legend at the bottom corresponds to p values).
Agronomy 12 01263 g011
Publisher’s Note: MDPI stays neutral with regard to jurisdictional claims in published maps and institutional affiliations.

