Article

Apple Fruit Size QTLs on Chromosomes 8 and 16 Characterized in ‘Honeycrisp’-Derived Germplasm

Department of Horticultural Science, University of Minnesota, Saint Paul, MN 55108, USA
*
Author to whom correspondence should be addressed.
Agronomy 2022, 12(6), 1279; https://doi.org/10.3390/agronomy12061279
Submission received: 5 April 2022 / Revised: 23 May 2022 / Accepted: 24 May 2022 / Published: 26 May 2022
(This article belongs to the Special Issue DNA-Informed Breeding in Fruit and Nut Crops)

Abstract

:
Multiple quantitative trait loci (QTLs) associated with fruit size have been reported in apple (Malus domestica Borkh.); however, few have been fully characterized and/or validated. A pedigree-based QTL analysis approach was used to examine the genetic basis of fruit weight in ‘Honeycrisp’-derived germplasm. Fourteen breeding parents were represented by 814 offspring from 13 full-sib families with breeding parents ‘Honeycrisp’ and ‘Minneiska’ being highly represented. Historical fruit weight data and curated genome-wide single nucleotide polymorphism (SNP) data were leveraged to map QTLs to chromosomes (Chrs) 8 and 16, which together accounted for 15% of the phenotypic variation. The Chr 16 QTL colocalized with other important Chr 16 trait loci. ‘Honeycrisp’ inherited two low fruit weight haplotypes at the Chr 8 QTL from progenitors ‘Northern Spy’ and ‘Grimes Golden’. At the Chr 16 QTL, ‘Honeycrisp’ inherited a low fruit weight haplotype from ‘Frostbite’ and a high fruit weight haplotype from ‘Duchess of Oldenburg’. The small-fruited ‘Honeycrisp’ progenitor ‘Frostbite’ had three low fruit weight haplotypes across the two QTLs. Non-additive interactions were observed at and across QTLs. Results will enable more informed parent selection and/or development of trait-predictive DNA tests for use in apple breeding programs.

1. Introduction

Fruit size is an important trait in apple (Malus domestica Borkh.) that influences postharvest storage decisions, production economics, and a consumer’s willingness to purchase (described in Musacchi and Serra [1]). Large fruit are more prone to flesh breakdown in cold storage and often have reduced storability compared to small fruit [2]. In general, consumers prefer larger fruit (discussed in Musacchi and Serra [1]) but some fruit might be considered too large. For example, ‘Honeycrisp’ trees tend to produce excessively large fruit (~300 g) at low crop loads [3].
Standardized phenotyping of fruit size, which is primarily a function of cell number [4], can be challenging because several factors including the individual (e.g., cultivar, seedling), environment (e.g., growing region, temperature, and light during fruit development), and management practices (e.g., rootstock, crop load) can influence fruit size [1,4,5,6,7]. Various metrics including fruit diameter, length, circumference and/or weight have been previously used to quantify fruit size e.g., [8,9,10,11,12]. Fruit size traits (e.g., diameter, length, circumference, weight) have been reported to be highly correlated [12]. Therefore, use of different metrics in quantitative trait locus (QTL) studies has resulted in detection of QTLs at similar locations in the apple genome e.g., [8,12].
Fruit size traits have been investigated in QTL mapping studies in various crops such as peach (Prunus persica L. Batsch) [13], sweet cherry (Prunus avium L.) [14,15], and tomato (Solanum lycopersicum L.) [16,17]. In apple, multiple QTLs associated with fruit size traits have been mapped to almost every chromosome (Chr) in the genome [8,9,10,11,12,18]. For example, Liebhard et al. [18], detected several fruit weight QTLs on Chrs 1, 3, 6, 8, 10, 12, 16, and 16 in a biparental family (n = 251 offspring) derived from ‘Fiesta’ × ‘Discovery’. Fruit size QTL studies in apple have been limited to a few biparental families representing cultivars such as Braeburn, Co-op 17, Co-op 16, Discovery, Fiesta, Golden Delicious, Granny Smith, Jonathan, Prima, Royal Gala, Starkrimson, and Telamon [8,9,10,11,12,18]. Little is known about the genetic basis of fruit size in modern breeding parents and cultivars like Honeycrisp. To-date few fruit size QTLs have been validated, characterized for their allele effects, and/or targeted for DNA test development. Fruit size is an attractive target for DNA-informed breeding (e.g., marker-assisted parent selection, marker-assisted seedling selection) but breeders are currently limited by the lack of DNA tests for breeding relevant fruit size QTLs.
‘Honeycrisp’, an explosively crisp apple cultivar introduced by the University of Minnesota (UMN) apple breeding program [19], has become an important apple cultivar and breeding parent in the United States e.g., [20]. Current understanding of the genetic factors that influence fruit size is insufficient for the development of DNA tests relevant to breeding programs that utilize ‘Honeycrisp’-derived germplasm. The goal of this study was to elucidate the genetic basis of fruit size, quantified as fruit weight at harvest, in a pedigree-connected apple breeding germplasm set. This study leveraged representative germplasm, high-quality genome-wide single nucleotide polymorphism array data [21,22,23], and FlexQTLTM software [24,25,26,27] to (1) detect QTLs associated with fruit weight and (2) characterize QTL allele effects. We hypothesized that multiple QTLs associated with fruit weight would be detected.

2. Materials and Methods

2.1. Germplasm

Germplasm evaluated in this study included 814 offspring from 13 full-sib families that represented 14 breeding parents (Table 1; Table S1). Cultivars Honeycrisp and Minneiska (SweeTango®) were highly represented with 507 and 284 direct offspring, respectively (Table 1; Table S1). The other parents represented were cultivars Dayton, Jonafree, Minnewashta (Zestar!®), MN55 (First Kiss®; Rave®), MonArk, Pitmaston Pine Apple, WA2 (Sunrise Magic®), and Wildung (SnowSweet®) and UMN advanced selections MN1702, MN1836, MN1915, and MN1965 (Table 1; Table S1). These families were included because of sufficient average allelic representation (AAR) of their parents (>12.5 AAR units) [28]. Additionally, 103 other important cultivars, progenitors, and UMN advanced selections were evaluated. Over ten years, a total of 917 individuals grown on B.9 or G.16 rootstocks at the UMN Horticultural Research Center, Chanhassen, MN, USA were evaluated for fruit weight at harvest.

2.2. Phenotypic Data

Approximately three to five fruit per individual were harvested in at least one year from 2010 to 2020. Fruit were harvested at an average starch iodine index of approximately four to six on the eight-point scale developed for ‘McIntosh’ [29]. Fruit were weighed at harvest and subsequently averaged for each individual (i.e., cultivar, parent, progenitor, offspring, advanced selection) within a given year.
Average fruit weights were analysed across years with linear mixed models fit by restricted maximum likelihood (REML) via the ‘lme4’ R package [30]. Year and individual were included as random effects. A model that included year × individual interaction term was also initially tested. Normality of random effects and residuals were examined using normal QQ plots (i.e., sample vs. theoretical quantiles plots) (Figure S1). Across year fruit weight best linear unbiased predictions (BLUPs), adjusted by trait means (as in Amyotte et al. [31] and Kostick et al. [32]), were used to estimate individual responses. Adjusted fruit weight BLUPs (referred to throughout as fruit weight BLUPs) of offspring were used as phenotypic values in QTL analyses.

2.3. Genotypic Data

All individuals were previously genotyped via the International ROSBREED SNP Consortium 8K Illumina Infinium® array v1 [21] or the Illumina Infinium® 20K array [22]. Marker calling, filtering, and curation were done using the workflow described by Vanderzande et al. [23]. A total of 2213 SNPs common to both arrays were used in QTL analyses. An earlier version of the genetic map used in this study was described in Howard et al. [33].

2.4. QTL Detection

The QTL analyses were conducted via FlexQTLTM software v0.99, which enables pedigree-based QTL analysis (PBA) using Markov Chain Monte Carlo simulation. The FlexQTLTM software has been described in detail [24,25,26,27] and has previously been utilized to detect QTLs for several traits in apple [24,32,34,35,36,37,38,39,40]. Adequate MCMC convergence was reached using the selected FlexQTLTM software parameter settings (Table S2). The model applied using FlexQTLTM software was an additive, biallelic (Q/q) model where high phenotypic values (i.e., high fruit weights) were associated with Q and low phenotypic values (i.e., low fruit weights) were associated with q. As described in Kostick et al. [32], van de Weg et al. [39], and Verma et al. [40], phenotypic data were included for unselected offspring in full-sib families (n = 814) and were not included for cultivars, parents, and progenitors to avoid biases from previous selection. Two replicate runs with different starting seed numbers were conducted to ensure reproducibility of QTL results (as in Kostick et al. [32], Howard et al. [37], van de Weg et al. [39], and Verma et al. [40]).
The Bayes Factor (BF; 2lnBF10) and posterior intensity values were used to examine significance and stability of a putative QTL with evidence of a QTL being considered positive, strong, or decisive if BF were >2, >5, and >10, respectively (as defined by Kass and Raftery [41]). The QTL intervals were recorded as consecutive 2-cM chromosome segments (bins) with BF greater than five (as in Howard et al. [37]) with the furthest left and right cM positions of the two outer bins defining the boundaries of the QTL interval (as in Kostick et al. [32]). As in Kostick et al. [32], the most likely QTL positions (i.e., QTL peaks) were recorded as the modes within the detected QTL intervals. Within a replicate run, the proportion of phenotypic variance explained by a QTL with decisive evidence (BF > 10) was estimated by dividing the variance explained by the total phenotypic variance (as in Kostick et al. [32] and Verma et al. [40]).

2.5. Haplotype Characterization of QTL Alleles

The QTLs with decisive evidence (BF > 10) were targeted for haplotype characterization. The SNP markers (Table S3) were chosen based on their proximity to detected QTL modes (peaks). The SNP marker phasing was conducted with FlexQTLTM software. Offspring with recombinant haplotypes were excluded from analyses due to insufficient representation. If necessary, progenitor and/or offspring SNP data were examined to deduce haplotypes (as in Kostick et al. [32]). Parent haplotypes were traced via identity-by-descent (IBD) through extended pedigrees, reconstructed by Luby et al. [42], to the furthest known ancestor. Pedigree reconstruction of some parents (e.g., ‘Pitmaston Pine Apple’) was previously done by Howard et al. [43] as part of a collaborative apple pedigree reconstruction project. If a given haplotype was traced to multiple ancestors, extended haplotypes were examined to determine most likely source. Haplotypes that could not be traced to a common ancestor/progenitor were considered identical-by-state (IBS).
To determine if fruit weight BLUPs were significantly different for presence versus absence of a given QTL haplotype, one-way analyses of variance (ANOVAs, R version 4.0.4 software) were conducted (as in Kostick et al. [32]). A haplotype was considered to have a significant effect if p < 0.05. Haplotypes with significantly higher or lower means indicated high or low relative fruit weights, respectively. Haplotypes that did not have significant effects (p ≥ 0.05) were classified as neutral effect haplotypes.
Interactions among QTL alleles at and across QTLs were examined by grouping the offspring by their functional diplotypes at and across the QTLs. ANOVAs at and across QTLs were used to determine if the functional diplotype or compound QTL functional genotype had significant effects on fruit weight. Fruit weight BLUP means and 95% confidence intervals were determined and plotted via the R package ggpubr [44] for each offspring group at and across QTLs. Mean separation among groups was calculated using least significant difference with a Bonferroni P adjustment for multiple comparisons via the R package ‘agricolae’ [45].

3. Results

3.1. Phenotypic Data

Year and individual had significant effects on fruit weight (p < 0.0001). The inclusion of a year × individual interaction term did not significantly improve model fit (i.e., result in a significant decrease in the Akaike Information Criterion value). The random effects and residuals were normally distributed (Figure S1). The proportion of variation associated with individual effects was 0.50 whereas 0.10 and 0.40 of the variation was associated with year effects and residual error, respectively. Quantitative variation for average fruit weight (g) was observed within and among full-sib families with offspring fruit weight BLUPs ranging from 65.1 to 244.8 g (mean = 119.4 g; Table S1). A similar range of fruit weight BLUPs (70.4 to 265.5 g; mean = 142.8 g) was observed among phenotyped cultivars, parents, and progenitors. Fruit weight BLUPs of phenotyped UMN selections ranged from 88.2 to 160.7 g (mean = 124.2 g). Fruit weight BLUPs had a low but statistically significant negative correlation with starch iodine index BLUPs (R = −0.096, p < 0.01).

3.2. QTL Detection

Two QTLs were detected with decisive evidence (BF > 10) on Chr 8 and Chr 16 (Table 2; Figures S2 and S3). Additionally, four other putative QTLs with strong evidence (BF > 5) were detected on Chrs 2, 4, 6, 10, and 14 (Table 2; Figures S2 and S3). For Chr 4, there was positive (BF > 2) to strong (BF > 5) evidence for two QTLs (Table 2; Figures S2 and S3).

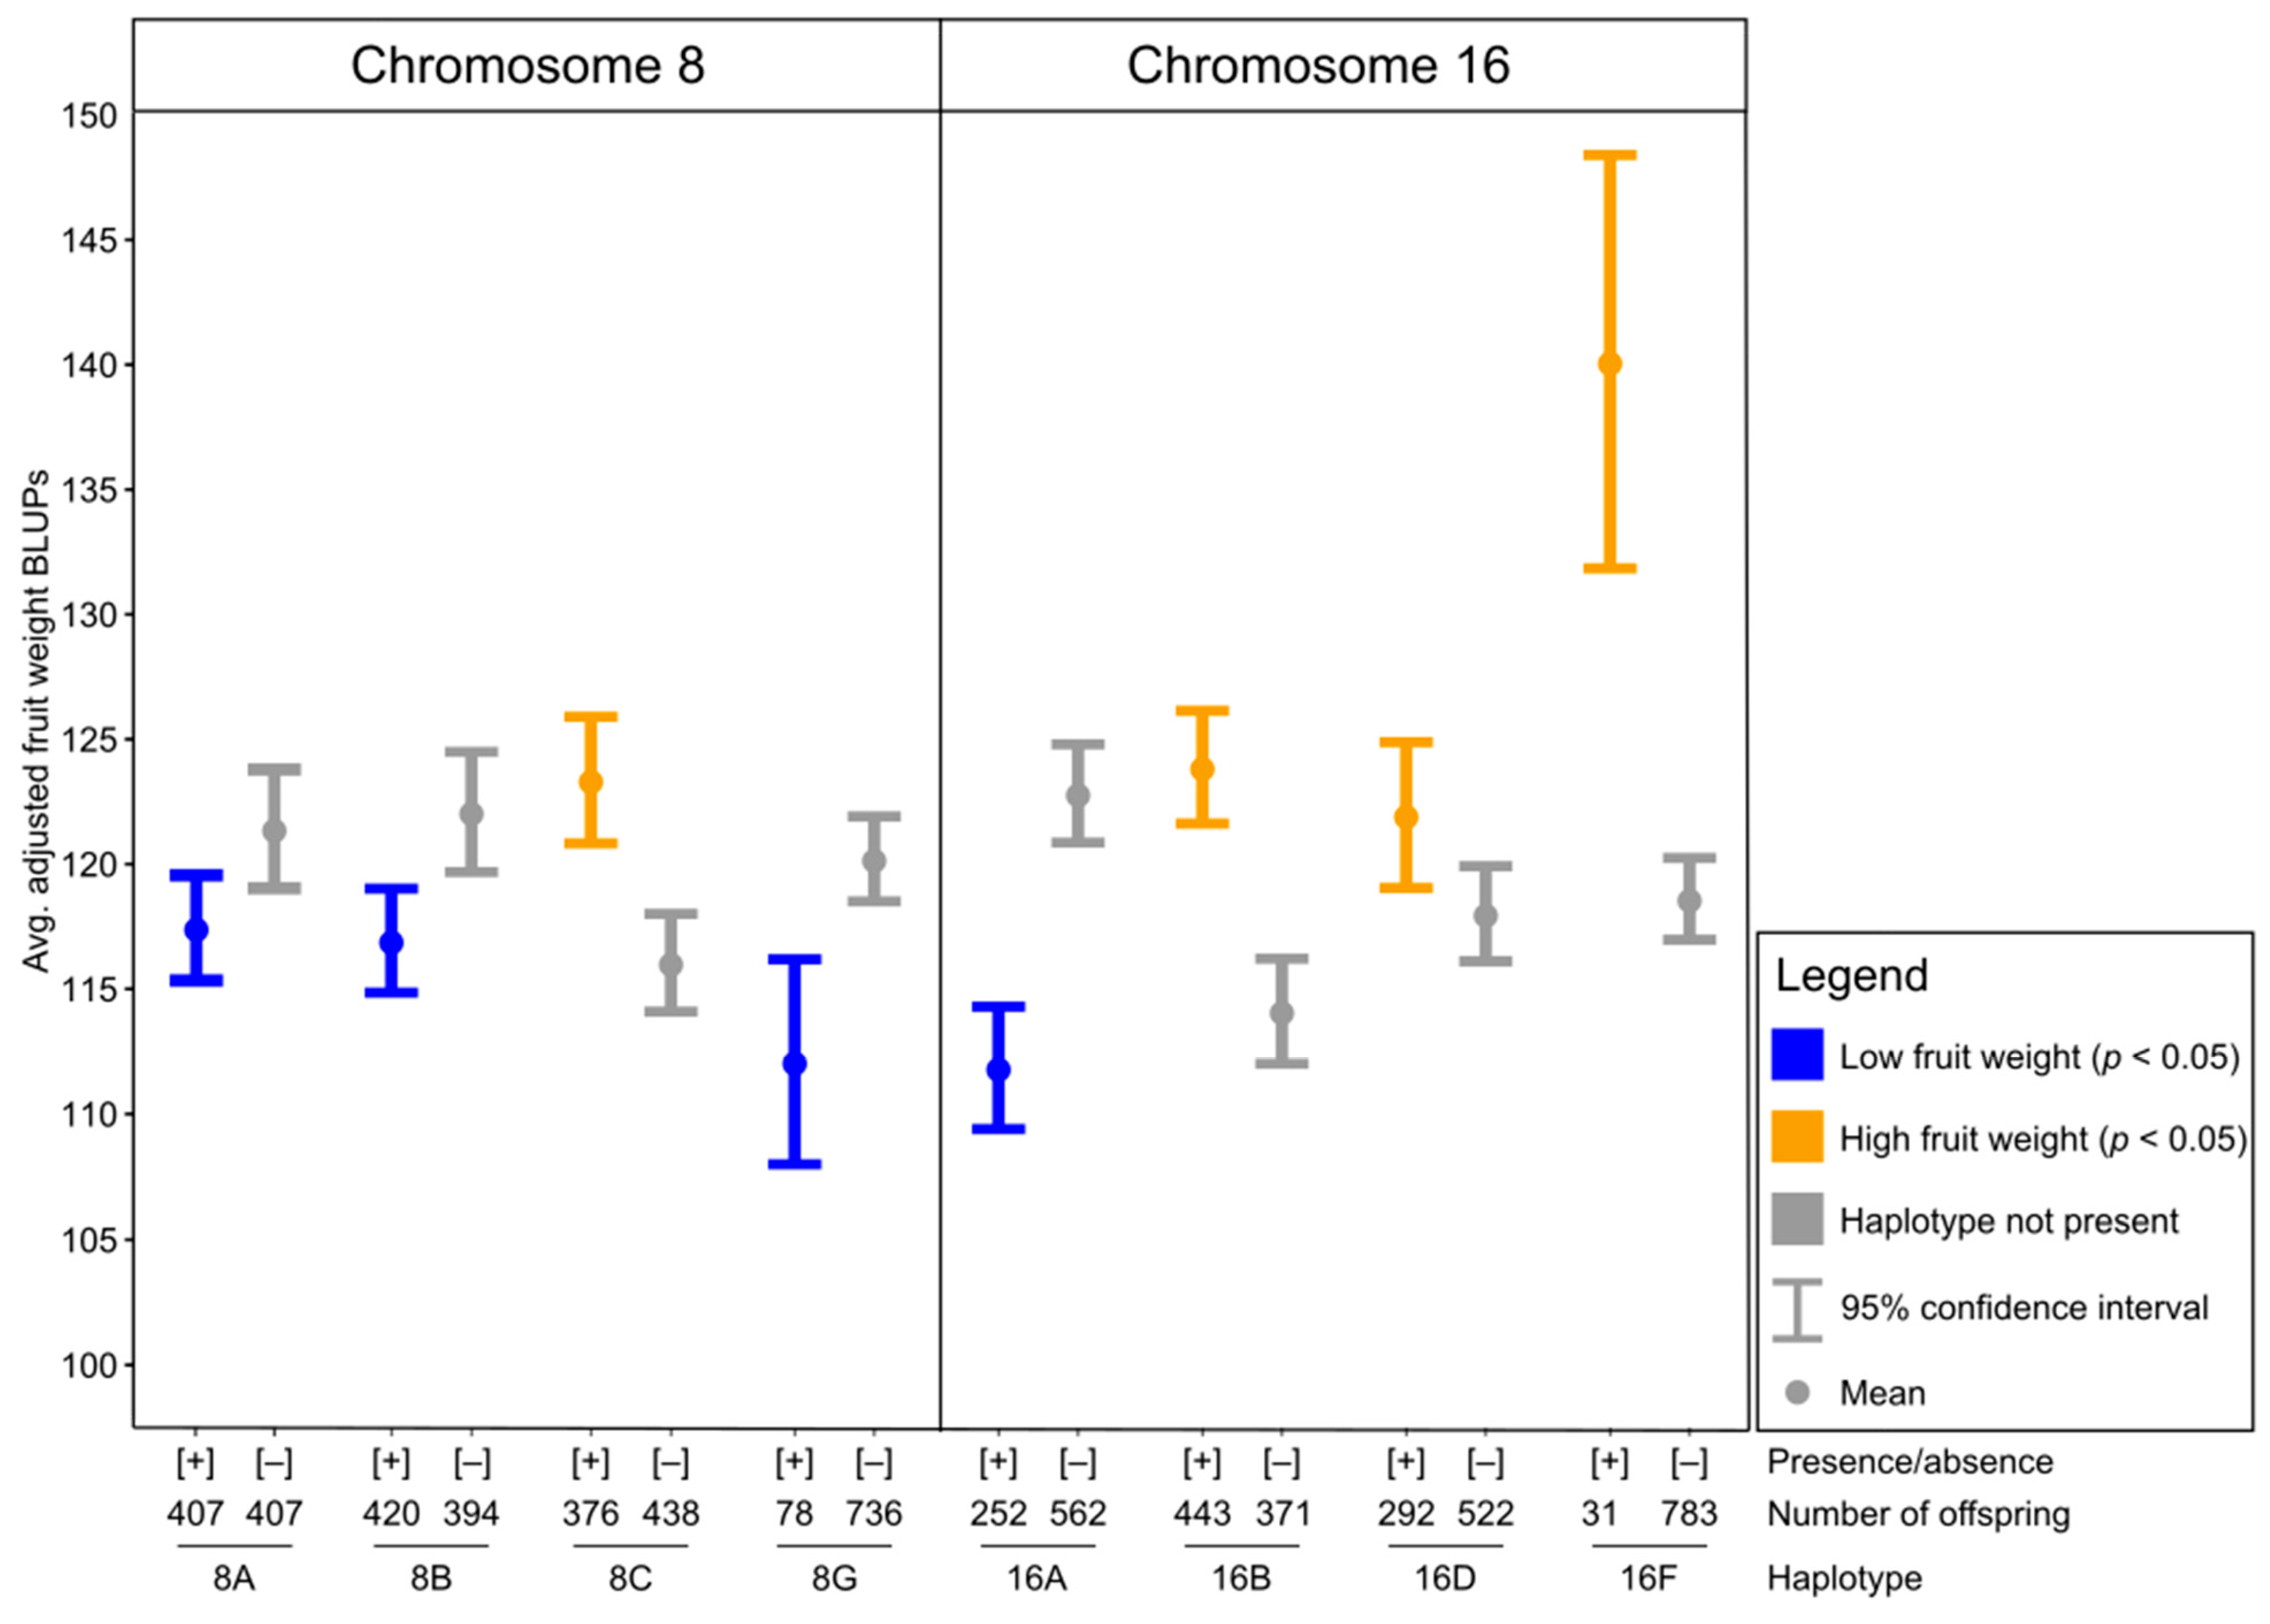
3.3. Chromosome 8 QTL Haplotype Analysis

Seven parent Chr 8 QTL haplotypes, constructed from seven SNPs spanning 4.9 cM (1.6-Mbp; Tables S3 and S4), segregated in the full sib families. Four Chr 8 QTL haplotypes (8A, 8B, 8C, and 8G) had significant effects (p < 0.05) whereas the other three haplotypes (8D, 8E, and 8F) did not have significant effects (p ≥ 0.05; Table S4). Offspring that inherited haplotypes 8A (n = 407), 8B (n = 420), or 8G (n = 78) generally had lower fruit weights with fruit weight BLUP means of 117.5, 116.9, and 112.1 g, respectively (Figure 1). In contrast, offspring that inherited haplotype 8C (n = 376) demonstrated higher fruit weights with a fruit weight BLUP mean of 123.4 g (Figure 1).
The low fruit weight haplotype 8A of ‘Honeycrisp’ and ‘Minneiska’ was inherited from ‘Northern Spy’ (Table S4). The low fruit weight haplotype 8B of breeding parents ‘Honeycrisp’, ‘MN55’, ‘Pitmaston Pine Apple’, and ‘WA2’ was traced to multiple ancestors: ‘Grimes Golden’, ‘Reinette Franche’, and an unknown parent of ‘Delicious’ (Table S4). The examination of the extended Chr 8 haplotypes revealed that ‘Grimes Golden’ and ‘Reinette Franche’ homologs matched from 0 to 22 cM. Haplotype 8B of ‘MonArk’ likely originated from a recombination of the two uncharacterized Chr 8 QTL haplotypes of ‘Mollie’s Delicious’ (Table S4). Both copies of 8B possessed by ‘WA2’ were likely inherited from the unknown parent of ‘Delicious’ (Table S4). The low fruit weight haplotype 8G of MN1702 and MN1836 was inherited from ‘Frostbite’ (Table S4). The high fruit weight haplotype 8C of breeding parents ‘Minneiska’, ‘Minnewashta’, MN1702, MN1836, MN1915, and ‘Wildung’ was traced to ancestors: ‘Northwest Greening’ and ‘Tetofsky’ (Table S4). Progenitor ‘Duchess of Oldenburg’ also had two copies of 8C. Examination of extended Chr 8 haplotypes revealed that ‘Minnewashta’ homologs matched ‘Tetofsky’ and ‘Northwest Greening’ homologs from approximately 0 to 17 cM and 0 to 12 cM, respectively. In contrast, ‘Minnewashta’ homologs matched ‘Duchess of Oldenburg’ homologs from approximately 0 to 5 cM. Chr 8 homologs of ‘Minneiska’ and MN1915 matched the second homolog of ‘Minnewashta’, inherited from its parent MN1691, from approximately 0 to 60 cM and 0 to 59 cM, respectively. ‘Dayton’ also had a copy of 8C, the source of which could not be determined (Table S4).

3.4. Chromosome 16 QTL Haplotype Analysis

Eight parent Chr 16 QTL haplotypes, constructed from nine SNPs spanning 3.6 cM (0.8-Mbp; Tables S3 and S5), segregated in the full-sib families. Four Chr 16 QTL haplotypes (16A, 16B, 16D, and 16F) had significant effects (p < 0.05). The remaining four haplotypes (16C, 16E, 16G, and 16H) did not have significant effects (p ≥ 0.05). Offspring that inherited haplotype 16A generally had low relative fruit weights with a fruit weight BLUP mean of 111.8 (Figure 1). In contrast, offspring that inherited haplotypes 16B, 16D, or 16F generally had high relative fruit weights with fruit weight BLUP means of 123.9, 122.0, 140.1 g, respectively (Figure 1).
The low fruit weight haplotype 16A of Honeycrisp, MN1836, and MN1915 was traced to ‘Frostbite’ and was likely inherited from an unknown parent of ‘Frostbite’ (Table S5). Breeding parents ‘Honeycrisp’, ‘Minneiska’, ‘MN55’, and MN1965 inherited high fruit weight haplotype 16B from ‘Duchess of Oldenburg’ (Table S5). The high fruit weight haplotype 16D of ‘Minnewashta’, MN1702, MN1915, MN1965, ‘Wildung’, and ‘WA2’ was traced to multiple ancestors: ‘Grimes Golden’, ‘Northwest Greening’, and ‘Winesap’ (Table S5). Haplotype 16D of ‘MonArk’ was likely inherited from an unknown parent. Examination of extended haplotypes revealed that ‘Monark’s homolog matched ‘Jonathan’ and F2-26829-2-2 homologs from 0 to 42 cM and 0 to 35 cM, respectively. ‘Jonathan’ likely inherited haplotype 16D from its unknown parent. ‘Pitmaston Pine Apple’ also inherited haplotype 16D, the source of which could not be determined. High fruit weight haplotype 16F of ‘Wildung’ was traced to ‘McIntosh’ (Table S5).

3.5. Interactions at and among the Chromosomes 8 and 16 QTLs

Average phenotypic variances explained by the Chr 8, Chr 16, and combined QTLs were 8%, 7%, and 15%, respectively. Significant variation among Chr 8 functional diplotypes (p < 0.0001) for fruit weight BLUPs was observed. Offspring with one or two low Chr 8 fruit weight haplotypes had the lowest fruit weight BLUP means (range = 114.4 to 121.3 g; Figure 2; Table S6). The highest fruit weight BLUP mean was observed for offspring with two high Chr 8 fruit weight haplotypes (mean = 133.4 g; Figure 2; Table S6).
At the Chr 16 QTL, the functional diplotype had a significant effect on fruit weight (p < 0.0001). Offspring characterized by a low and neutral allele, two neutral alleles, or two low alleles had fruit weight BLUP means of 111.3, 110.6, and 102.9 g, respectively (Figure 2; Table S7). The fruit weight BLUP means of offspring with two high functional alleles, a high and a non-significant allele (i.e., neutral), or a high and a low allele were 126.9, 121.3, and 114.3 g (Figure 2; Table S7).
Most compound QTL functional diplotypes were associated with moderate fruit weights (Figure 2; Table S8). The lowest fruit weight BLUP means were observed for offspring characterized by two Chr 8 low alleles and two Chr 16 neutral alleles (mean = 106.1 g), a high and low Chr 8 allele and two low Chr 16 alleles (mean = 104.6 g), and four low alleles across the QTLs (mean = 100.8 g; Figure 2; Table S8). The highest fruit weight BLUP means were observed for offspring with a high and neutral Chr 8 alleles and two high Chr 16 alleles (mean = 152.0 g) or four high alleles across QTLs (mean = 145.3 g; Figure 2; Table S8).

4. Discussion

To the best of our knowledge, this is the first report of QTLs associated with fruit weight in ‘Honeycrisp’-derived germplasm. The QTLs on Chrs 8 and 16 were characterized across pedigree-connected breeding families derived from 14 breeding parents. Four low fruit weight haplotypes and four high fruit weight haplotypes across QTLs were identified. The genetic information obtained in this study has potential utility in targeting fruit weight in apple breeding programs.

4.1. Quantitative Variation for Fruit Weight Observed within Germplasm Set

Variation within and among full-sib families for fruit size was not surprising as quantitative variation for fruit size traits has been previously observed in other germplasm sets [8,10,11,12,18]. In this study, fruit weight was used as a metric for fruit size because Potts et al. [12] demonstrated that fruit size traits (e.g., circumference, diameter, length, weight) are strongly correlated. Therefore, use of a single fruit size trait is likely sufficient for fruit size QTL detection. Quantitative variation within and among full-sib families in this study suggested that multiple QTLs might underlie observed variation in fruit weight.

4.2. Identities of Chromosomes 8 and 16 QTLs

Lack of common markers with previous studies [8,9,11] made it challenging to determine if the fruit weight QTLs on Chrs 8 and 16 in this study were novel or colocalized with previously detected fruit size QTLs.

4.3. Chromosome 16 QTL Colocalized with Other Important QTLs

The Chr 16 QTL detected in this study colocalized with other important trait-loci at the proximal end of Chr 16. The malic acid content (Ma) QTL (~0.9–3.4-Mbp on the GDDH13 reference genome sequence [46]), which also has been shown to influence crispness and juiciness e.g., [11,40], colocalized with the Chr 16 QTL detected in this study. The Chr 16 QTL in this study also colocalized with a bitter pit susceptibility QTL (Bp-2) near the SSR marker Hi22f06 (~3.5-Mbp) [47,48]. Larger fruit sizes have been reported to be associated with increased incidences of bitter pit due to decreased concentration of calcium in the fruit [49]. Because ‘Honeycrisp’ is highly prone to the development of bitter pit [50], future studies should examine the effects of the Chr 16 fruit weight QTL ‘Honeycrisp’ haplotypes on bitter pit incidence. Colocalization of multiple trait-loci at the proximal end of Chr 16 demonstrates the importance of considering this region when targeting fruit quality traits in apple. Breeders should leverage knowledge of allele effects for relevant trait-loci (as provided in Verma et al. [40] and here) to aid in more efficient development of high-quality apple cultivars.

4.4. ‘Minneiska’ Was Heterozygous for Fruit Weight QTL on Chromosome 8

Haplotype analysis findings demonstrated that ‘Minneiska’ (SweeTango®), a recent UMN cultivar release, was heterozygous for the Chr 8 QTL. ‘Minneiska’s haplotype 8B, inherited from ‘Grimes Golden’ through ‘Golden Delicious’, was associated with low relative adjusted fruit weight BLUPs albeit of more moderate effect compared to low fruit weight haplotypes 8G and 16A (Figure 1). Haplotype 8B in ’Grimes Golden’ and ‘Reinette Franche’, reported to be an ancestor of ‘Grimes Golden’ [42], was likely IBD because homologs of ‘Reinette Franche’ and ‘Grimes Golden’ matched from 0 to 22 cM. Haplotype 8B likely segregates in other germplasm sets as ‘Golden Delicious’ and ‘Reinette Franche’ are present in the pedigrees of multiple other important cultivars e.g., [32,42,51]. ‘Minneiska’s other Chr 8 QTL haplotype, 8C, was associated with high relative fruit weight BLUPs albeit of more moderate effect compared to high fruit weight haplotypes 16B and 16F. ‘Minneiska’ inherited 8C from its parent ‘Minnewashta’, which had two copies of 8C. Multiple ancestors of ‘Minnewashta’ including ‘Duchess of Oldenburg’, ‘Northwest Greening’, and ‘Tetofsky’ had haplotype 8C; however, examination of extended haplotypes indicated that ‘Minnewashta’ likely inherited its copies of 8C from ‘Tetofsky’ and ‘Northwest Greening’. Although ‘Minneiska’ could have inherited either of ‘Minnewashta’s copies of 8C, it likely inherited 8C from ‘Northwest Greening’ as ‘Minneiska’s homolog matched the second homolog of ‘Minnewashta’ from approximately 0 to 60 cM.

4.5. Unique Low Fruit Weight Haplotype at the Chromosome 16 QTL in ‘Honeycrisp’

‘Honeycrisp’ was heterozygous for the Chr 16 fruit weight QTL based on haplotype analysis findings. Haplotype 16A, present in ‘Honeycrisp’ as well as UMN selections MN1836 and MN1915, was significantly associated with lower fruit weights and had a large effect compared to low fruit weight haplotypes 8A, 8B, and 8G (Figure 1; Tables S4 and S5). Haplotype 16A seems to be unique to germplasm derived from ‘Frostbite’, a small-fruited cultivar that is an important progenitor in the UMN apple breeding program [42]. The lower fruit weight BLUPs of cultivars Frostbite (86.6 g), Keepsake (109.2 g), and Sweet Sixteen (132.1 g) could partially be explained by the inheritance of haplotype 16A. The other ‘Honeycrisp’ Chr 16 QTL haplotype, 16B, was significantly associated with higher fruit weights and was traced to ‘Honeycrisp’s progenitor ‘Duchess of Oldenburg’, an important progenitor in the UMN apple breeding program [42]. The inheritance of haplotype 16B could partially explain the higher fruit weight BLUPs of ‘Minneiska’ (158.2 g) and ‘MN55’ (168.5 g).

4.6. Putative Large Effect Fruit Weight Haplotype at the Chromosome 16 QTL in ‘Wildung’

Representation of the high fruit weight haplotype 16F was relatively low (n = 31 offspring) due to segregation in a single family (‘Minneiska’ × ‘Wildung’), which might have hampered estimation of its effect. Interestingly, haplotype 16F, which was traced to ‘McIntosh’, had the largest effect of all significant haplotypes with a mean difference of 21.5 g between offspring with and without 16F present. Haplotype 16F should be considered a putative high fruit weight haplotype and should be validated in future studies.

4.7. Tracing of ‘MonArk’ Fruit Weight Haplotype Sources Hampered by Incomplete Pedigree

The incomplete, complex pedigree of ‘MonArk’ (also known as AA44), parent of UMN cultivar MN55, made it challenging to determine ancestral sources of ‘MonArk’s haplotypes including the high fruit weight haplotype 16D. Luby et al. [42] reported that ‘Mollie’s Delicious’ and ‘July Red’ were grandparents of ‘MonArk’ while ‘Duchess of Oldenburg’, ‘Jonathan’, ‘Melba’, ‘Newtown Pippin’, ‘Starr’, and F2 26829-2-2 were likely ancestors of ‘Monark’s other parent. Examination of extended Chr 16 haplotypes revealed that ‘MonArk’s homolog matched the homologs of ‘Jonathan’ and F2 26829-2-2 from approximately 0 to 42 cM and 0 to 35 cM, respectively. Shared extended haplotypes indicated that the source of high fruit weight haplotype 16D of ‘MonArk’ was likely an unknown common ancestor of ‘Jonathan’ and F2 26829-2-2.

4.8. ‘Frostbite’, a Grandparent of ‘Honeycrisp’, Had Three Low Fruit Weight Haplotypes

The identification of three low fruit weight haplotypes in ‘Frostbite’, a small-fruited progenitor of ‘Honeycrisp’, was not surprising. ‘Frostbite’ had a low adjusted fruit weight BLUP value (86.64 g) in this study and has been reported to produce small to medium sized fruit (5.6–6.6 cm in diameter) [52].

4.9. Non-Additive Interactions at and among QTLs

The lack or underrepresentation of some genotype classes at and across QTLs, although a common limitation of multi-locus studies e.g., [32], made it difficult to empirically examine dominance and/or epistatic interactions at and among QTLs. The approach used to examine combined QTL effects was similar to the Q-allele dosage model employed by Verma et al. [40]. By combining haplotypes into functional allele groups (i.e., high, low, neutral relative effects), the need to examine specific allelic combinations separately was avoided, which increased statistical power. A limitation of this approach was the underlying assumption that haplotypes within a given functional allele group have similar effect sizes.
Under an additive model, fruit weight BLUP means were expected to be significantly higher with each additional high fruit weight haplotype regardless of the number of low fruit weight haplotypes present. There might have been dominance effects at a QTL and/or epistatic interactions among QTLs as more high fruit weight haplotypes at and across QTLs did not always correspond to significantly higher fruit weight BLUP means (Figure 2). However, not all QTL genotype classes were represented, which limited the conclusions that could be made about interactions at and between these QTLs.

4.10. Putative QTLs on Chromosomes 2, 4, 6, 10, and 14

Other QTLs might underlie variation for fruit weight in apple as several putative QTLs with strong evidence (BF > 5) were detected on Chrs 2, 4, 6, 10, and 14 in this study. Previous studies have demonstrated that inheritance of fruit size traits is highly quantitative and likely controlled by multiple QTLs [8,9]. Only QTLs with decisive evidence were further characterized for their haplotypes in this study. The QTLs detected with strong evidence in this study should be considered putative and validated in future studies.

4.11. Study Limitations

Large residual variation was observed and managed in this study. Similar to Liebhard et al. [18], a large proportion of the variation for fruit weight (50%) was associated with the parameter individual. However, significant proportions of the phenotypic variations were associated with year (10%) and residual error (40%), likely due to factors such as variable environmental conditions, biennial bearing, crop load, and tree age. The large residual variation was managed in this study by utilizing fruit weight BLUPs as phenotypic values (similar to Kostick et al. [32]).
Haplotype effects might have been under or overestimated because of growing environment and use of dwarfing rootstocks. Fruit produced in Minnesota are often smaller than fruit produced in other U.S. growing regions (e.g., Washington, New York). Cline et al. [6] reported that in the NC-140 Regional Rootstock Research Project trials, the mean weight of ‘Honeycrisp’ fruit produced in Minnesota was 146 g, similar to ‘Honeycrisp’s fruit weight BLUP in this study, whereas mean ‘Honeycrisp’ fruit weights ranged from 212 g to 288 g in other U.S. growing regions. Additionally, because fruit in this study were mostly harvested from individuals propagated onto the very dwarfing rootstock B.9, fruit weights were likely lower than if individuals were propagated on more vigorous rootstocks e.g., [5,6]. Haplotype effects should be validated in other environments and rootstock combinations.
Uneven representation of some parents’ genomes, called “skewed average allelic representation [28]”, inevitably resulted in under-representation or no representation of some parent haplotypes (similar to Kostick et al. [32]). Most Chrs 8 and 16 haplotypes were well represented (≥50 offspring) but three haplotypes (8E, 16F, 16H) were represented by only 23 to 31 offspring which likely limited estimation of haplotype effects (Tables S4 and S5). Under representation of parent haplotypes is a common challenge in pedigree-based QTL analyses e.g., [32]. Effects of under-represented haplotypes (e.g., 16F) should be validated in future studies.

4.12. Breeding Implications

High and low fruit weight haplotype information gained in this study has utility in targeting fruit size in apple breeding programs. Allele information reported in this study could be used to inform parent selection in the short term. The Chrs 8 and 16 QTLs might be useful targets for DNA test development. Breeders should select against individuals homozygous for either low or high haplotypes across QTLs if individuals with moderate fruit weights are desired. Because the Chr 16 fruit weight QTL colocalized with other important Chr 16 trait loci, breeders should consider alleles at all Chr 16 trait loci when choosing parents for crossing. Future work should determine if available Ma and/or BP-2 trait-loci DNA tests (reviewed in Evans and Peace [53]) also differentiate Chr 16 fruit weight QTL alleles.
Genome-wide selection might be a valuable breeding approach when targeting fruit size in apple as multiple QTLs (e.g., Chrs 2, 4, 6, 10, 14) likely underlie variation for fruit weight in addition to the two large effect QTL characterized in this study. Moderate predictive abilities have been reported for genome-wide prediction of fruit size traits in apple e.g., [54,55,56]. Future studies should estimate predictive abilities of genome-wide prediction models for fruit weight in ‘Honeycrisp’-derived germplasm.

5. Conclusions

Results of this study supported the conclusion that fruit size is a quantitative trait controlled by multiple QTLs throughout the genome. In this study, two large-effect fruit weight QTLs on Chrs 8 and 16 were characterized in germplasm derived from ‘Honeycrisp’, an important apple cultivar and breeding parent. Additionally, putative QTLs were detected on Chrs 2, 4, 6, 10, and 14. Results of this study further demonstrated the importance of considering the proximal end of Chr 16 when targeting fruit quality in apple as the fruit weight QTL colocalized with multiple Chr 16 trait loci. The QTLs characterized in this study will enable more informed parent selection, development of trait-predictive DNA tests for use in apple breeding programs and/or development of genome-wide prediction models that include large-effect QTLs as fixed effects. Future studies should aim to validate QTL allele effects and/or other putative QTLs in different germplasm sets and environments.

Supplementary Materials

The following supporting information can be downloaded at https://www.mdpi.com/article/10.3390/agronomy12061279/s1. Figure S1: Normal QQ plots (sample vs. theoretical quantile plots) for random effects (year and individual) and residuals of linear mixed model. Figure S2: Replicate run 1 posterior intensity and sampling trace plots for QTL positions from FlexQTLTM software output for adjusted fruit weight BLUPs across years. Chromosome numbers are indicated on top of each plot. Genetic coordinates (cM) indicate ends and middle of chromosomes. Figure S3: Replicate run 2 posterior intensity and sampling trace plots for QTL positions from FlexQTLTM software output for adjusted fruit weight BLUPs across years. Chromosome numbers are indicated on top of each plot. Genetic coordinates (cM) indicate ends and middle of chromosomes. Tables S1–S8: Combined Supplementary Tables S1–S8.

Author Contributions

Conceptualization, S.A.K. and J.J.L.; formal analysis, S.A.K.; writing—original draft preparation, S.A.K.; writing—review and editing, J.J.L. All authors have read and agreed to the published version of the manuscript.

Funding

This research was funded by the Minnesota State Agricultural Experiment Station—University of Minnesota Projects MIN-21-040 and MIN-21-097 and by the United States Department of Agriculture—National Institute of Food and Agriculture Specialty Crop Initiative Projects 2009-51181-05808 and 2014-51181-22378.

Data Availability Statement

The data presented in this study are available in Supplementary Materials.

Acknowledgments

The authors would like to thank Baylee Miller and John Tillman for their assistance with data collection. The authors are grateful to undergraduate and graduate research assistants in the University of Minnesota apple breeding program who aided in collection of phenotypic data. In addition, the authors appreciate the insights provided by Nicholas Howard.

Conflicts of Interest

The University of Minnesota receives royalty payments related to the ‘Honeycrisp’, ‘Minnewashta’, ‘Wildung’, ‘Minneiska’, and ‘MN55’ apple cultivars. J.J.L., and the University of Minnesota have a royalty interest in these cultivars. These relationships have been reviewed and managed by the University of Minnesota in accordance with its conflicts of interest policies.

References

  1. Musacchi, S.; Serra, S. Apple fruit quality: Overview on pre-harvest factors. Sci. Hortic. 2018, 234, 409–430. [Google Scholar] [CrossRef]
  2. Lee, J.; Mattheis, J.P.; Rudell, D.R. Fruit size affects physiological attributes and storage disorders in cold-stored ‘Royal Gala’ apples. HortScience 2013, 48, 1518–1520. [Google Scholar] [CrossRef] [Green Version]
  3. Robinson, T.L.; Watkins, C.B. Cropload of Honeycrisp affects not only fruit size but many quality attributes. N. Y. Fruit Q. 2003, 11, 7–10. [Google Scholar]
  4. Lakso, A.N.; Goffinet, M.C. Apple fruit growth. N. Y. Fruit Q. 2013, 21, 11–14. [Google Scholar]
  5. Autio, W.; Robinson, T.; Blatt, S.; Cochran, D.; Francescato, P.; Hoover, E.; Kushad, M.; Lang, G.; Lordan, J.; Miller, D.; et al. Budagovsky, Geneva, Pillnitz, and Malling apple rootstocks affect ‘Honeycrisp’ performance over eight years in the 2010 NC-140 ‘Honeycrisp’ apple rootstock trial. J. Am. Pomol. 2020, 74, 182–195. [Google Scholar]
  6. Cline, J.A.; Autio, W.; Clements, J.; Cowgill, W.; Crassweller, R.; Einhorn, T.; Fallahi, E.; Francescatto, P.; Hoover, E.; Lang, G.; et al. Early performance of ‘Honeycrisp’ apple trees on several size-controlling rootstocks in the 2014 NC-140 rootstock trial. J. Am. Pomol. 2021, 75, 189–202. [Google Scholar]
  7. Serra, S.; Leisso, R.; Giordani, L.; Kalcsits, L.; Musacchi, S. Crop load influences fruit quality, nutritional balance, and return bloom in ‘Honeycrisp’ apple. HortScience 2016, 51, 236–244. [Google Scholar] [CrossRef]
  8. Chang, Y.; Sun, R.; Sun, H.; Zhao, Y.; Han, Y.; Chen, D.; Wang, Y.; Zhang, X.; Han, Z. Mapping of quantitative trait loci corroborates independent genetic control of apple size and shape. Sci. Hortic. 2014, 174, 126–132. [Google Scholar] [CrossRef]
  9. Devoghalaere, F.; Doucen, T.; Guitton, B.; Keeling, J.; Payne, W.; Ling, T.J.; Ross, J.J.; Hallett, I.C.; Gunaseelan, K.; Dayatilake, G.A.; et al. A genomics approach to understanding the role of auxin in apple (Malus × domestica) fruit size. BMC Plant Biol. 2012, 12, 7. [Google Scholar] [CrossRef] [Green Version]
  10. Kenis, K.; Keulemans, J.; Davey, M.W. Identification and stability of QTLs for fruit traits in apple. Tree Genet. Genomes 2008, 4, 647–661. [Google Scholar] [CrossRef]
  11. King, G.J.; Lynn, J.R.; Dover, C.J.; Evans, K.M.; Seymour, G.B. Resolution of quantitative trait loci for mechanical measures accounting for genetic variation in fruit texture of apple (Malus pumila Mill.). Theor. Appl. Genet. 2001, 102, 1227–1235. [Google Scholar] [CrossRef]
  12. Potts, S.M.; Khan, M.A.; Han, Y.; Kushad, M.M.; Korban, S.S. Identification of quantitative trait loci (QTLs) for fruit quality traits in apple. Plant Mol. Biol. Rep. 2014, 32, 109–116. [Google Scholar] [CrossRef]
  13. Fresnedo-Ramírez, J.; Frett, J.T.; Sandefur, P.J.; Salgado-Rojas, A.; Clark, J.R.; Gasic, K.; Peace, C.P.; Anderson, J.; Hartmann, T.P.; Byrne, D.d.H.; et al. QTL mapping and breeding value estimation through pedigree-based analysis of fruit size and weight in four diverse peach breeding programs. Tree Genet. Genomes 2016, 12, 25. [Google Scholar] [CrossRef]
  14. Zhang, G.; Sebolt, A.M.; Sooriyapathirana, S.S.; Wang, D.; Bink, M.C.A.M.; Olmstead, J.W.; Iezzoni, A.F. Fruit size QTL analysis of an F1 population derived from a cross between a domesticated sweet cherry cultivar and a wild forest sweet cherry. Tree Genet. Genomes 2010, 6, 25–36. [Google Scholar] [CrossRef]
  15. Rosyara, U.R.; Bink, M.C.A.M.; van de Weg, E.; Zhang, G.; Wang, D.; Sebolt, A.; Dirlewanger, E.; Quero-Garcia, J.; Schuster, M.; Iezzoni, A.F. Fruit size QTL identification and the prediction of parental QTL genotypes and breeding values in multiple pedigreed populations of sweet cherry. Mol. Breed. 2013, 32, 875–887. [Google Scholar] [CrossRef]
  16. Grandillo, S.; Ku, H.M.; Tanksley, S.D. Identifying the loci responsible for natural variation in fruit size and shape in tomato. Theor. Appl. Genet. 1999, 99, 978–987. [Google Scholar] [CrossRef]
  17. Prudent, M.; Causse, M.; Génard, M.; Tripodi, P.; Grandillo, S.; Bertin, N. Genetic and physiological analysis of tomato fruit weight and composition: Influence of carbon availability on QTL detection. J. Exp. Bot. 2009, 60, 923–937. [Google Scholar] [CrossRef] [Green Version]
  18. Liebhard, R.; Kellerhals, M.; Pfammatter, W.; Jertmini, M.; Gessler, C. Mapping quantitative physiological traits in apple (Malus × domestica Borkh.). Plant Mol. Biol. 2003, 52, 511–526. [Google Scholar] [CrossRef]
  19. Luby, J.J.; Bedford, D.S. Honeycrisp Apple. Minnesota Report 225-1992. 1992. Available online: https://conservancy.umn.edu/bitstream/handle/11299/141481/MR225.pdf?sequence=1&isAllowed=y (accessed on 3 March 2022).
  20. Evans, E.M.; Barritt, B.H.; Konishi, B.S.; Brutcher, L.J.; Ross, C.F. ‘WA 38’ apple. HortScience 2012, 47, 1177–1179. [Google Scholar] [CrossRef] [Green Version]
  21. Changé, D.; Crowhurst, R.N.; Troggio, M.; Davey, M.W.; Gilmore, B.; Lawley, C.; Vanderzande, S.; Hellens, R.P.; Kumar, S.; Cestaro, A.; et al. Genome-wide SNP detection, validation, and development of an 8K SNP array for apple. PLoS ONE 2012, 7, e31745. [Google Scholar] [CrossRef] [Green Version]
  22. Bianco, L.; Cestaro, A.; Sargent, D.J.; Banchi, E.; Derdak, S.; Di Guardo, M.; Salvi, S.; Jansen, J.; Viola, R.; Gut, I.; et al. Development and validation of a 20K single nucleotide polymorphism (SNP) whole genome genotyping array for apple (Malus × domestica Borkh). PLoS ONE 2014, 9, e110377. [Google Scholar] [CrossRef] [Green Version]
  23. Vanderzande, S.; Howard, N.P.; Cai, L.; Da Silva Linge, C.; Antanaviciute, L.; Bink, M.C.A.M.; Kruisselbrink, J.W.; Bassil, N.; Iezzoni, A.; van de Weg, E.; et al. High-quality, genome-wide SNP genotypic data for pedigreed germplasm of the diploid outcrossing species apple, peach, and sweet cherry through a common workflow. PLoS ONE 2019, 14, e0210928. [Google Scholar] [CrossRef] [Green Version]
  24. Bink, M.C.A.M.; Jansen, J.; Madduri, M.; Voorrips, R.E.; Durel, C.-E.; Kouassi, A.B.; Laurens, F.; Mathis, F.; Gessler, C.; Gobbin, D.; et al. Bayesian QTL analyses using pedigreed families of an outcrossing species, with application to fruit firmness in apple. Theor. Appl. Genet. 2014, 127, 1073–1090. [Google Scholar] [CrossRef] [PubMed]
  25. Bink, M.C.A.M.; Uimari, P.; Sillanpää, M.; Janss, L.; Jansen, R. Multiple QTL mapping in related plant populations via a pedigree-analysis approach. Theor. Appl. Genet. 2012, 104, 751–762. [Google Scholar] [CrossRef] [PubMed]
  26. Bink, M.C.A.M.; Boer, M.P.; ter Braak, C.J.F.; Jansen, J.; Voorrips, R.E.; van de Weg, W.E. Bayesian analysis of complex traits in pedigreed plant populations. Euphytica 2008, 161, 85–96. [Google Scholar] [CrossRef] [Green Version]
  27. Bink, M.C.A.M.; Totir, L.R.; ter Braak, C.J.F.; Winkler, C.R.; Boer, M.P.; Smith, O.S. QTL linkage analysis of connected populations using ancestral marker and pedigree information. Theor. Appl. Genet. 2012, 124, 1097–1113. [Google Scholar] [CrossRef] [Green Version]
  28. Peace, C.P.; Luby, J.J.; van de Weg, W.E.; Bink, M.C.A.M.; Iezzoni, A.F. A strategy for developing representative germplasm sets for systematic QTL validation, demonstrated for apple, peach, and sweet cherry. Tree Genet. Genomes 2014, 10, 1679–1694. [Google Scholar] [CrossRef]
  29. Blanpied, G.D.; Silsby, K.J. Predicting harvest date windows for apples. Cornell Coop. Ext. 1992, 221. Available online: https://ecommons.cornell.edu/handle/1813/3299 (accessed on 3 April 2022).
  30. Bates, D.; Mächler, M.; Bolker, B.; Walker, S. Fitting linear mixed-effects models using lme4. J. Stat. Softw. 2015, 67, 1–48. [Google Scholar] [CrossRef]
  31. Amyotte, B.; Bowen, A.J.; Banks, T.; Rajcan, I.; Somers, D.J. Mapping the sensory perception of apple using descriptive sensory evaluation in a genome wide association study. PLoS ONE 2012, 12, e0171710. [Google Scholar] [CrossRef]
  32. Kostick, S.A.; Teh, S.L.; Norelli, J.L.; Vanderzande, S.; Peace, C.; Evans, K.M. Fire blight QTL analysis in a multi-family apple population identifies a reduced-susceptibility allele in ‘Honeycrisp’. Hortic. Res. 2021, 8, 28. [Google Scholar] [CrossRef] [PubMed]
  33. Howard, N.P.; van de Weg, E.; Bedford, D.S.; Peace, C.P.; Vanderzande, S.; Clark, M.D.; Teh, S.; Cai, L.; Luby, J.J. Elucidation of the ‘Honeycrisp’ pedigree through haplotype analysis with a multi-family integrated SNP linkage map and a large apple (Malus × domestica) pedigree-connected SNP data set. Hortic. Res. 2017, 4, 17003. [Google Scholar] [CrossRef] [PubMed] [Green Version]
  34. Allard, A.; Bink, M.C.A.M.; Martinez, S.; Kelner, J.-J.; Legave, J.-M.; di Guardo, M.; Di Pierro, E.A.; Laurens, F.; van de Weg, E.W.; Costes, E. Detecting QTLs and putative candidate genes involved in budbreak and flowering time in an apple multiparental population. J. Exp. Bot. 2016, 67, 2875–2888. [Google Scholar] [CrossRef] [Green Version]
  35. Di Guardo, M.; Bink, M.C.A.M.; Guerra, W.; Letschka, T.; Lozano, L.; Busatto, N.; Poles, L.; Tadiello, A.; Bianco, L.; Visser, R.G.F.; et al. Deciphering the genetic control of fruit texture in apple by multiple family-based analysis and genome-wide association. J. Exp. Bot. 2017, 68, 1451–1466. [Google Scholar] [CrossRef] [PubMed]
  36. Guan, Y.; Peace, C.; Rudell, D.; Verma, S.; Evans, K. QTLs detected for individual sugars and soluble solids content in apple. Mol. Breed. 2015, 35, 135. [Google Scholar] [CrossRef]
  37. Howard, N.P.; van de Weg, E.; Tillman, J.; Tong, C.B.S.; Silverstein, K.A.T.; Luby, J.J. Two QTL characterized for soft scald and soggy breakdown in apple (Malus × domestica) through pedigree-based analysis of a large population of interconnected families. Tree Genet. Genomes 2018, 14, 2. [Google Scholar] [CrossRef] [Green Version]
  38. Howard, N.P.; Tillman, J.; Vanderzande, S.; Luby, J.J. Genetics of zonal leaf chlorosis and genetic linkage to a major gene regulating skin anthocyanin production (MdMYB1) in the apple (Malus × domestica) cultivar Honeycrisp. PLoS ONE 2019, 14, e0210611. [Google Scholar] [CrossRef] [Green Version]
  39. Van de Weg, E.; Di Guardo, M.; Jänsch, M.; Socquet-Juglard, D.; Costa, F.; Baumgartner, I.; Broggini, G.A.L.; Kellerhals, M.; Troggio, M.; Laurens, F.; et al. Epistatic fire blight resistance QTL alleles in the apple cultivar ‘Enterprise’ and selection X-6398 discovered and characterized through pedigree-informed analysis. Mol. Breed. 2018, 38, 5. [Google Scholar] [CrossRef]
  40. Verma, S.; Evans, K.; Guan, Y.; Luby, J.J.; Rosyara, U.R.; Howard, N.P.; Bassil, N.; Bink, M.C.A.M.; van de Weg, W.E.; Peace, C.P. Two large-effect QTLs, Ma and Ma3, determine genetic potential for acidity in apple fruit: Breeding insights from a multi-family study. Tree Genet. Genomes 2019, 15, 18. [Google Scholar] [CrossRef] [Green Version]
  41. Kass, R.E.; Raftery, A.E. Bayes factors. J. Am. Stat. Assoc. 1995, 90, 773–795. [Google Scholar] [CrossRef]
  42. Luby, J.J.; Howard, N.P.; Tillman, J.R.; Bedford, D.S. Extended pedigrees of apple cultivars from the University of Minnesota breeding program elucidated using SNP array markers. HortScience 2022, 57, 472–477. [Google Scholar] [CrossRef]
  43. Howard, N.P.; Albach, D.C.; Luby, J.J. The identification of apple pedigree information on a large diverse set of apple germplasm and its application in apple breeding using new genetic tools. In Proceedings of the 18th International Conference on Organic Fruit Growing, Hohenheim, Germany, 19–21 February 2018; pp. 88–91. [Google Scholar]
  44. Kassambara, A. Ggpubr: ‘Ggplot2’ Based Publication Read Plots. Available online: https://rpkgs.datanovia.com/ggpubr/ (accessed on 24 April 2022).
  45. De Mendiburu, F. Agricolae: Statistical Procedures for Agricultural Research. Available online: http://tarwi.lamolina.edu.pe/~fmendiburu (accessed on 24 April 2022).
  46. Daccord, N.; Celton, J.-M.; Linsmith, G.; Becker, C.; Choisne, N.; Schijlen, E.; van de Geest, H.; Bianco, L.; Micheletti, D.; Velasco, R.; et al. High-quality de novo assembly of the apple genome and methylome dynamics of early fruit development. Nat. Genet. 2017, 49, 1099–1106. [Google Scholar] [CrossRef] [PubMed]
  47. Kumar, S.; Garrick, D.J.; Bink, M.C.; Whitworth, C.; Changé, D.; Volz, R.K. Novel genomic approaches unravel genetic architecture of complex traits in apple. BMC Genom. 2013, 14, 393. [Google Scholar] [CrossRef] [PubMed] [Green Version]
  48. Buti, M.; Poles, L.; Caset, D.; Magnago, P.; Fernandez-Fernandez, F.; Colgan, R.J.; Velasco, R.; Sargent, D.J. Identification and validation of a QTL influencing bitter pit symptoms in apple (Malus × domestica). Mol. Breed. 2015, 35, 29. [Google Scholar] [CrossRef]
  49. Ferguson, I.B.; Triggs, C.M. Sampling factors affecting the use of mineral analysis of apple fruit for the prediction of bitter pit. N. Z. J. Crop Hortic. Sci. 1990, 18, 147–152. [Google Scholar] [CrossRef]
  50. Cheng, L.; Sazo, M.M. Why is ‘Honeycrisp’ so susceptible to bitter pit? N. Y. State Hortic. Soc. Fruit Q. 2018, 26, 19–23. [Google Scholar]
  51. Muranty, H.; Denancé, C.; Feugey, L.; Crépin, J.-L.; Barbier, Y.; Tartarini, S.; Ordidge, M.; Troggio, M.; Lateur, M.; Nybom, H.; et al. Using whole-genome SNP data to reconstruct a large multi-generational pedigree in apple germplasm. BMC Plant Biol. 2020, 20, 2. [Google Scholar] [CrossRef] [Green Version]
  52. University of Minnesota—Minnesota Agricultural Experiment Station. FrostbiteTM. Available online: https://mnhardy.umn.edu/varieties/fruit/apples/frostbite#:~:text=The%20Frostbite%E2%84%A2%20Apple%20(MN,a%20distinctive%20late%20season%20option (accessed on 3 March 2022).
  53. Evans, K.; Peace, C. Advances in marker-assisted breeding of apples. In Achieving Sustainable Cultivation of Apples; Evans, K., Ed.; Burleigh Dodds Science Publishing: Cambridge, UK, 2017; pp. 165–192. [Google Scholar]
  54. McClure, K.A.; Gardner, K.M.; Douglas, G.M.; Song, J.; Forney, C.F.; DeLong, J.; Fan, L.; Du, L.; Toivonen, P.M.A.; Somers, D.J.; et al. A genome-wide association study of apple quality and scab resistance. Plant Genome 2018, 11, 1. [Google Scholar] [CrossRef] [Green Version]
  55. Minamikawa, M.F.; Kunihisa, M.; Noshita, K.; Moriya, S.; Abe, K.; Hayashi, T.; Katayose, Y.; Matsumoto, T.; Nishitani, C.; Terakami, S.; et al. Tracing founder haplotypes of Japanese apple variaties: Application in genomic prediction and genome-wide association study. Hortic. Res. 2021, 8, 49. [Google Scholar] [CrossRef]
  56. Muranty, H.; Troggio, M.; Sadok, I.B.; Al Rifaı, M.; Auwerkerken, A.; Banchi, E.; Velasco, R.; Stevanato, P.; van de Weg, W.E.; Di Guardo, M.; et al. Accuracy and responses of genomic selection on key traits in apple. Hortic. Res. 2015, 2, 15060. [Google Scholar] [CrossRef] [Green Version]
Figure 1. Means and 95% confidence intervals of adjusted fruit weight best linear unbiased predictions (BLUPs) across years for 814 offspring with and without significant haplotypes at QTLs on chromosomes 8 and 16. For each haplotype, one-way analysis of variance was used to determine if the presence of a given haplotype had a significant effect (p < 0.05) on fruit weight.
Agronomy 12 01279 g001
Figure 2. Means and 95% confidence intervals of adjusted fruit weight best linear unbiased predictions (BLUPs) across years for offspring functional diplotypes at the chromosomes 8 and 16 QTLs or compound functional QTL genotypes across the two QTLs. Low (L) fruit weight haplotypes were 8A, 8B, and 8G, and 16A (corresponding to designations in Figure 1). High (H) fruit weight haplotypes were 8C, 16B, 16D, and 16F (corresponding to designations in Figure 1). All other characterized haplotypes were neutral effect (i.e., haplotypes that did not exhibit significant effects). Mean separation letter groups (i.e., A, AB, B, BC, C) represent least significant differences with Bonferroni P adjustment (α < 0.05). The number of offspring with a given functional diplotype or compound genotype is listed in parentheses below each mean.
Agronomy 12 01279 g002
Table 1. Number of offspring in pedigree-connected full-sib families that represented 14 breeding parents.
FamilyParentsNo. of Offspring
MaternalPaternal
1DaytonMinnewashta23
2HoneycrispJonafree53
JonafreeHoneycrisp
3HoneycrispMN170252
MN1702Honeycrisp
4HoneycrispMN183649
5HoneycrispMN191530
6HoneycrispMonArk75
7HoneycrispPitmaston Pine Apple51
8HoneycrispWA248
9HoneycrispMinnewashta149
10MinneiskaMN196549
11MinneiskaMN55124
12MinneiskaWildung70
13MN1702Minneiska41
Total814
Table 2. Summary of fruit weight QTL analysis in pedigree-connected apple germplasm representing 14 breeding parents. Across year fruit weight best linear unbiased predictions (BLUPs) were used as phenotypic values. Results are shown for two FlexQTLTM replicate software runs.
Chr aReplicate Run bBF(1 vs. 0) cBF(2 vs. 1) dQTL Interval (cM) eMode (cM) fApprox. Physical Position (Mbp) gPVE (%) h
218.0−2.847–534916.7–23.7-
28.5−2.747–534916.7–23.7
416.86.231–373320.8–23.5-
25.63.429–373420.5–23.5
616.0−1.252–605432.1–32.9-
26.6−0.852–585532.1–32.8
8115.62.40–410.3–1.98.0
215.81.70–810.3–2.7
1018.4−3.572–807539.0–40.8-
28.9−3.068–787037.6–40.5
1415.2−2.23–1141.6–3.8-
26.0−0.83–1341.6–3.8
16130.0−0.49–13103.1–4.27.0
229.90.59–13103.1–4.2
a Chromosome; b Two replicate runs of FlexQTLTM software with different starting random seed numbers were done to ensure reproducibility of results; c Chromosome-wise Bayes factor (2lnBF10) for 1 QTL vs. 0 QTL model, with BF >2, 5, and 10 indicating positive, strong, or decisive, evidence respectively, for the presence of one QTL; d Chromosome-wise Bayes factor (2lnBF10) for 2 QTL vs. 1 QTL model, with BF >2, 5, and 10 indicating positive, strong, or decisive, evidence respectively, for the presence of two QTLs; e QTL interval defined by consecutive 2 cM bins (chromosome segments used and reported by FlexQTLTM software) with strong evidence (2lnBF10 (BF) > 5); f QTL interval mode, which represented the most probable QTL position; g Approximate physical position of QTL interval, estimated from physical positions on GDDH13 v1.1 reference genome [46], of closest flanking SNPs; h Estimated proportion of phenotypic variance explained by the QTL with decisive evidence (2lnBF10 (BF) > 10), averaged across replicate FlexQTLTM software runs.
Publisher’s Note: MDPI stays neutral with regard to jurisdictional claims in published maps and institutional affiliations.

