Abstract
Target and off-target spray depositions determine the spray’s effectiveness and impact on the environment. A decisive stage in the measurement of spray deposition and drift is selecting an appropriate sampling approach under field conditions. There are various approaches available for sampling spray deposition and drift, during the evaluation of ground sprayers used for the UAV sprayer assessment, under field conditions. In this study, two sampling approaches (water-sensitive paper, and glass strip collectors) were compared to analyze spray deposition in target and off-target zones. The results showed a variation in the estimation of the spray deposits among the two applied sampling methods. The results showed that the water-sensitive paper recorded the droplet deposition in the target zone with a range from 0.049 to 4.866 µLcm−2, whereas the glass strip recorded from 0.11 to 0.793 µLcm−2. The results also showed the water sensitive paper recorded an 80.3% higher deposition than that of the glass strip at zero position during the driving flight height 2 m and flight speed 2 ms−1 (T1 treatment). It can be concluded that variation in recorded depositing is due to the sampling material. It is recommended that the confident deposition results, measurement methods and sampling approaches must be standardized for UAV sprayers according to the field conditions and controlled within artificial assessments.
1. Introduction
Plant protection practice is one of the essential current crop production practices that enhances crop yield and the value of the produce. However, significantly lower spraying expressively raised the importance of modifying the conventional spraying practices [1]. Due to the environmental, worker-friendly, and efficient control advantages of unmanned aerial vehicle (UAV) sprayers over the conventional spraying technology, UAV spraying technology has been rapidly adopted by farmers worldwide, especially in China in recent times. Thus, researchers have focused on the effective utilization and adoption of UAVs in plant protection practices for all types of crop and orchard fields. In recent years, several field experimental studies have been executed to evaluate spray deposition and drift using UAV sprayers [2,3,4,5,6]. UAV flight height and plant parameters (canopy height and diameter) significantly affect the droplet deposition and penetration in the plant canopy [7,8,9,10]. Further, spray spectrum, environmental circumstances, and working parameters of UAV sprayers influence the spraying efficiency, coverage, attachment, and absorption to the target [9,11,12,13,14,15,16].
Currently, UAVs are widely used to ease agricultural activities and have progressed with recent technology developments to perform aerial spraying for crops [17,18]. UAV aerial spraying ability is not just limited to crop protection, but it can be extended to crop fertilization activities too. Aerial spraying by UAVs has a large application potential in many industries, especially in agriculture. The concept of aerial spraying using UAVs was initially developed based on the pioneering technology of unmanned helicopters that were developed by the Yamaha Corporation (Hamamatsu, Japan) for rice cultivation [19]. The effectiveness of droplet deposition is one of the most concerning issues in UAV spraying operations. In the process of spraying with UAVs, the droplets permeate the crop canopy and function. Recently, a researcher conducted field experiments using the UAV sprayer to determine the spray deposition and efficiency [20,21,22] and conducted simulation studies to determine the airflow pattern and spray profile [23,24,25].
The spray deposition pattern is a key parameter that affects the control capacity of the agrochemical. Thus, many studies have recently been conducted on spray measurement approaches [26,27,28,29,30,31]. Wen et al. [29] designed and developed an innovative spray deposition pattern measurement system (SDPMS) that used a fluorescent tracer and spectral investigation to counter the shortages of discrete sampling data and improve droplet deposition measurements for the UAV (UAV) spraying at field level. However, there are still several shortcomings in the deposition measurement approaches for aerial spraying. Several studies of spraying equipment and machines concerning measuring spray deposition patterns have been conducted in recent times [20,29,32]. However, the measuring system significantly affects the results of the experiment [31]. Wang et al. [21] developed a platform and method for testing characteristics of spray distribution and deposition for UAVs. These studies highlighted the importance of the testing system.
The interaction between droplets and samplers is significant, as adhesion, rebounding, and droplet shattering depend on liquid characteristics, droplet characteristics, and surface parameters [32,33]. Thus, the sampler’s ability to collect the sample mainly depends on the droplets’ loss of kinetic energy during the collision. The retention of the spray droplet on the sampler is also affected by the sampler orientation. Samplers can be classified based on their orientation, such as horizontal and vertical samplers. Due to higher capturing and extraction efficiency, glass surface samplers are used [34,35]. It is assumed that glass Petri dishes can collect samples for low extraction volume and easy handling ability [36], but due to the raised edge, droplet deposition may be negatively influenced near to the dish edge, and these dishes do not act as plant leaf simulators [33]. Further, the volatilization of chemicals from the dish surface also plays a role in underestimating droplet deposition. To overcome the volatilization issue, some absorbent material and fluids are used [37,38,39].
Glass microscope slides are another kind of sampler that have been applied to sample target and off-target spray deposition [21,22]. The easy handling and use of less volume of solvent for washing the glass slides made them famous as a deposition sampler; however, a lower deposition capacity has been reported if they are placed at an angle to the horizontal plane [30,40]. There is a strong relationship between deposition capacity and angle, such as low vapor pressure spray pesticides dissipating from the glass slide’s surface [30].
Water-sensitive paper (WSP) and conventional optical techniques to assess droplet images from the sprayer are generally used for the fast and easy calculation of droplet deposition, coverage, and distribution [30,41,42,43,44]. Water-sensitive paper is layered with a yellow film that converts to dark blue when droplets interact with it, as a bromophenol-blue indicator at the surface on the WSP interacts with water [31,45]. The quantity of area enclosed on the WSP changes color, indicating the deposition quantity [41,43]. The main constraint of the WSP is that the droplets of diameter below 50 mm are incapable of creating a measurable strain [41,44,46]. Additionally, this approach’s constraint is that the dynamic ingredient is not investigated; it only qualitatively displays that deposition occurs and approximates the portion of the droplet size distribution [30,31]. The ability of the imaging system has also been evaluated by Cunha et al. [31] Most image analysis systems were not effective in precisely measuring coverage density when the coverage rate is greater than about 17%. Thus, with increasing concern about the UAV sprayer’s adoption and growth, there is no specific stand method or equipment available to determine the spraying deposition pattern of UAV sprayers, either in target or off-target regions.
Previous studies have mainly been conducted using a single sampling approach [4,5,21,22,30,43], and there is no study available comparing the effect of sampling approaches on the result of UAV droplet deposition performance. Therefore, the present study was conducted to (1) compare the WSP and glass microscope slides sampling approaches to access the UAV sprayer droplet deposition performance in target and off-target zones, and (2) to find the effect of an operational parameter of UAVs on sampling approaches’ performance. This study highlights the importance of standard sampling procedures and methodology for testing UAV spray deposition performance in the field.
2. Materials and Methods
2.1. Description of the Test Site
The experiment tests were conducted at Jingdong/Runguo Farm (Private) Zhenjiang, Jiangsu Province (32.16273° N; 119.701267° E) with climatic conditions such as temperature in the range 19 °C to 19.6 °C, wind speed 3.4–4.4 ms−1, and relative humidity 70.1–73.4%. The tests were performed on 19 April 2019 from 10:00 am to 3:00 pm. The climatic parameters were determined because these parameters significantly affect droplet deposition and movement [47]. Although the experiment did not raise any bioethical issues, to conduct the experimental test, permission was granted by Jingdong/Runguo Farm (Private) Zhenjiang, Jiangsu Province, and it was confirmed that this field study did not involve endangered or protected species (plant, animal, and human).
2.2. UAV Sprayer Parameters and Spraying Device
A UAV sprayer of a single rotor (Freeman-200 model, Feirui Company, Zhenjiang, China) was applied as a spraying system. The key description and parameters of the UAV sprayer are shown in Table 1. The UAV sprayer comprises a rectangular-type liquid tank, pump, water pipe, spray lances, spray nozzle, and other components. The spray nozzle was a TeeJet TT110015, which has larger droplets for less drift with a working pressure between 15 and 90 PSI, and a total of nine nozzles equally spaced (50 cm) at spray lances and positioned perpendicular to the UAV axis with downward orientation [12].

Table 1.
UAV parameters [12].
2.3. Experimental Design
The fluorescence tracer (Rhodamine-B, Shanghai Huanchen Co., Ltd., Shanghai, China) was mixed with water as the spraying liquid. Table 2 shows four treatments (T1, T2, T3, and T4) and the UAV sprayer’s operational parameters for the field trial. Three sampling rows for each sampling approach were arranged, with the objective being three-time replication. The spraying deposition and drift were determined.
Table 2.
Operational parameters of UAV sprayer.
2.4. Sampling Setup for Field Evaluation
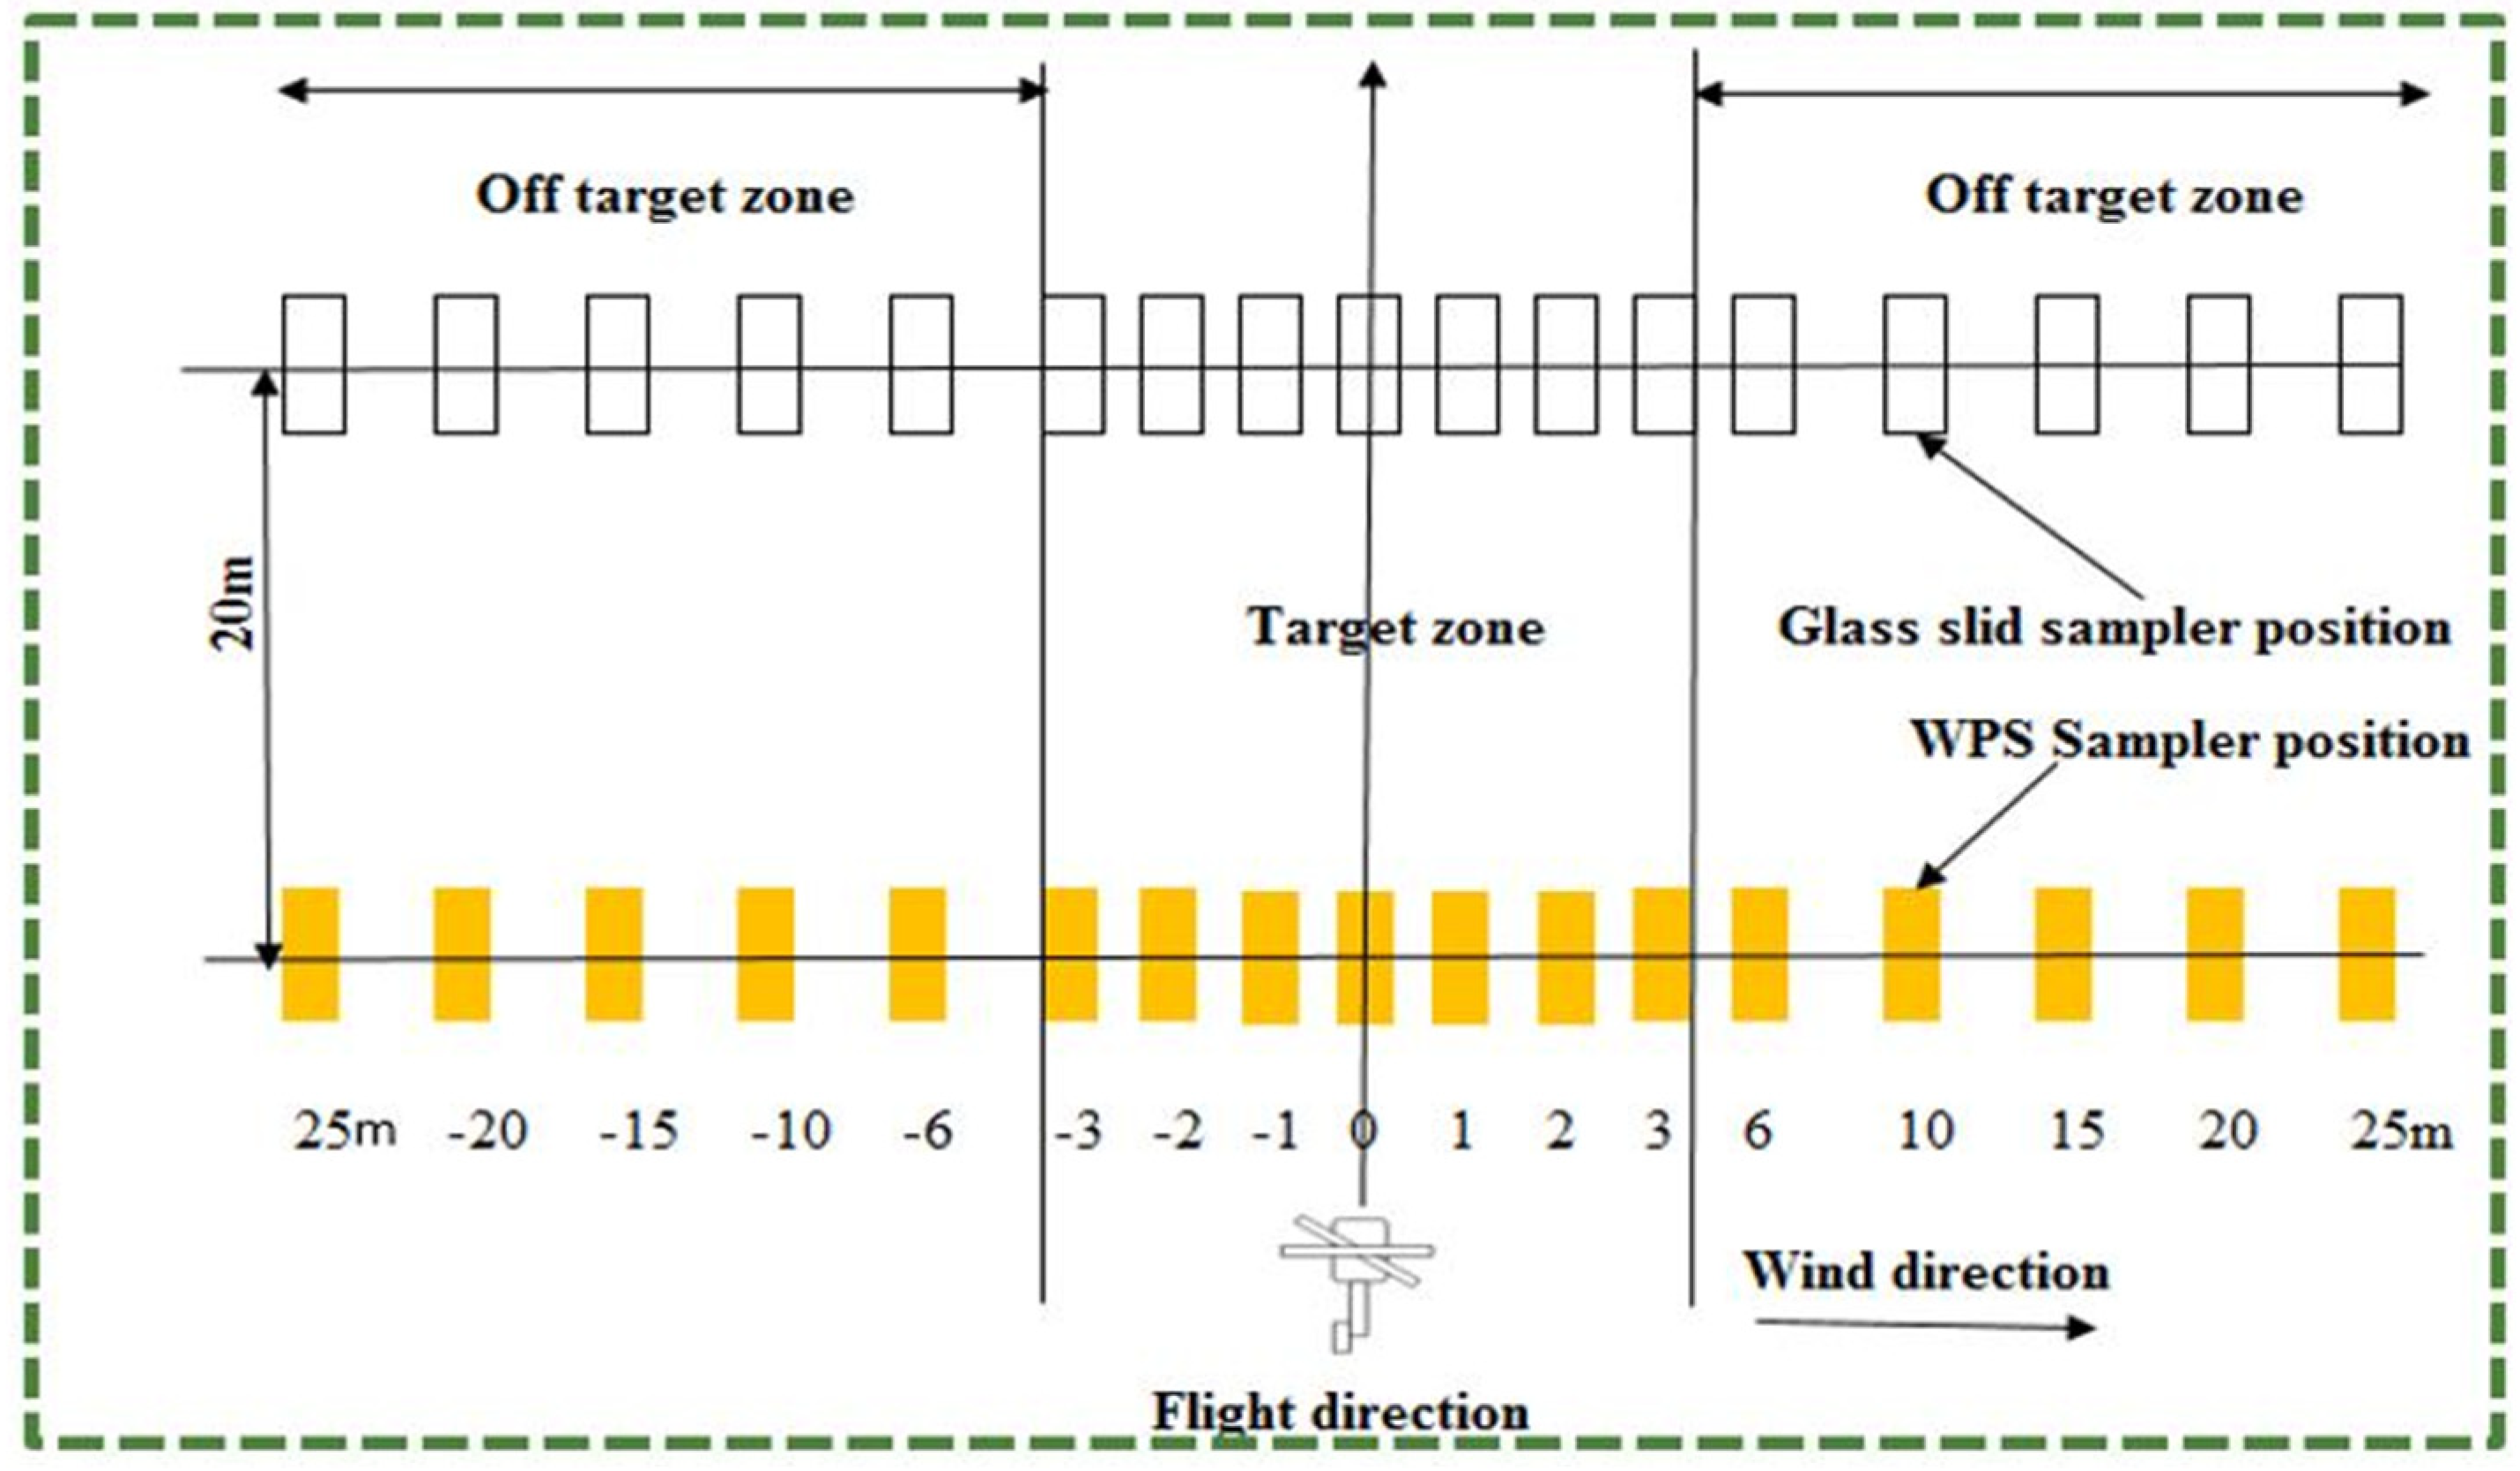
Both types of the sampler are arranged in two separate lines 20 m apart, as shown in Figure 1. On both lines, 3 m from the line of travel of the UAV (right and left sides) were marked as target zone and the off-target zone, keeping in view the UAV sprayer’s spray swath width and the spray bar length, which was 4.5 m.
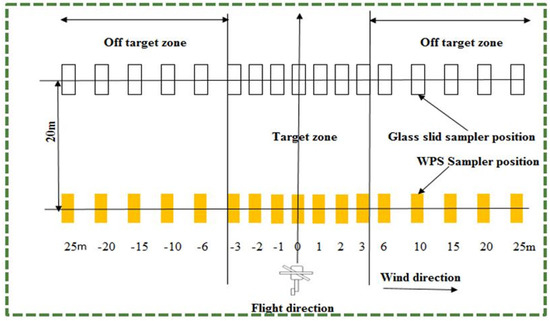
Figure 1.
Sampling layout for UAV operational test.
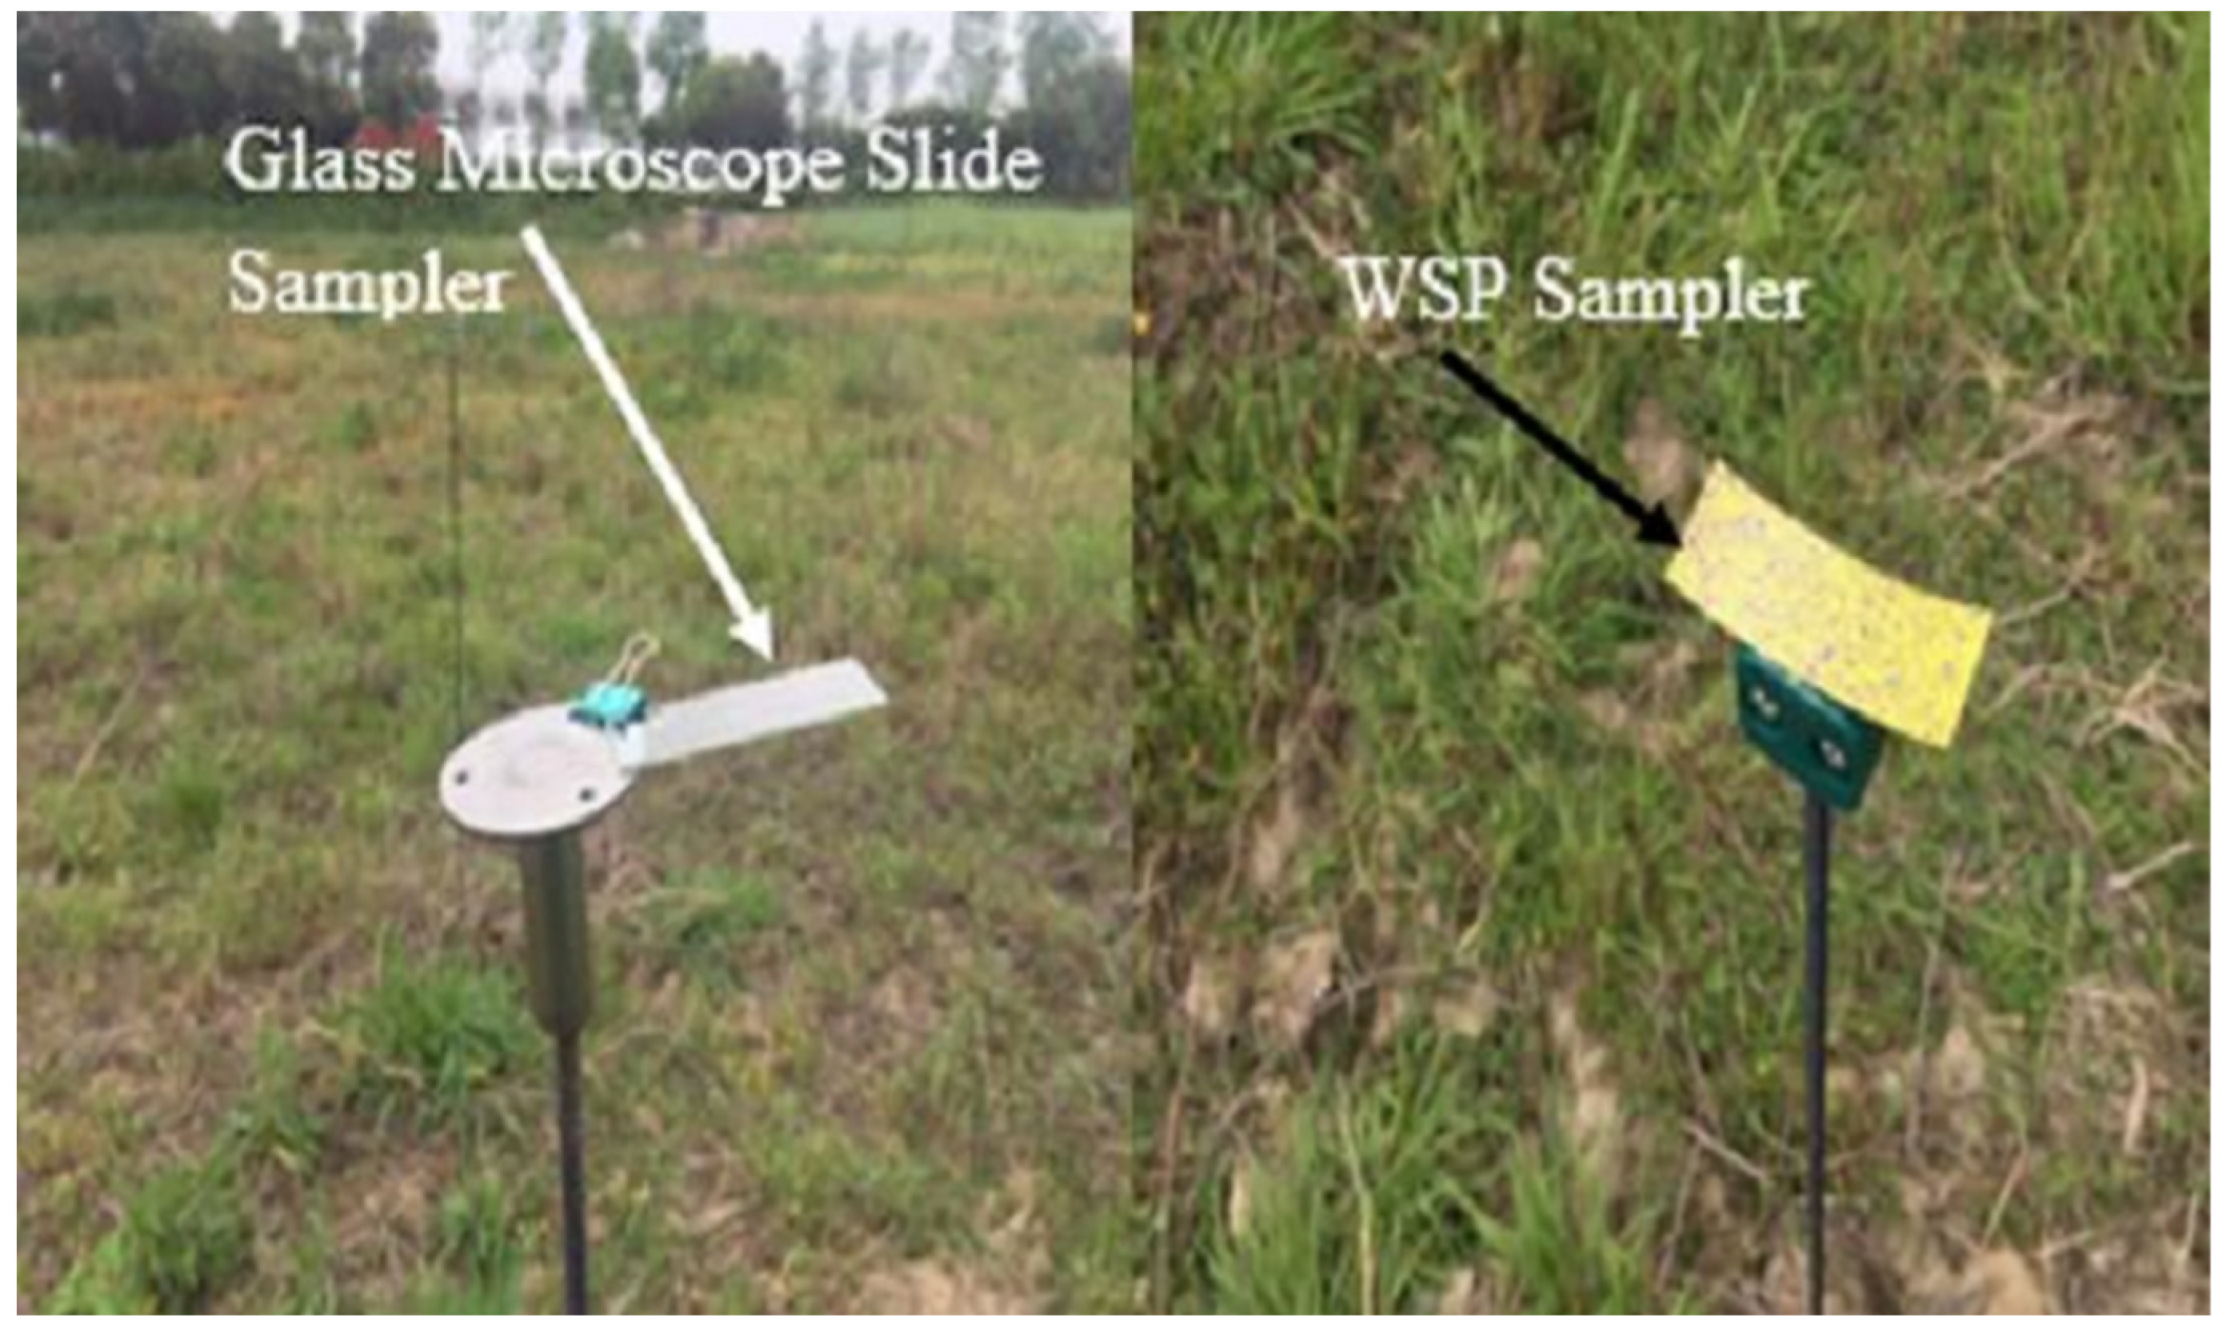
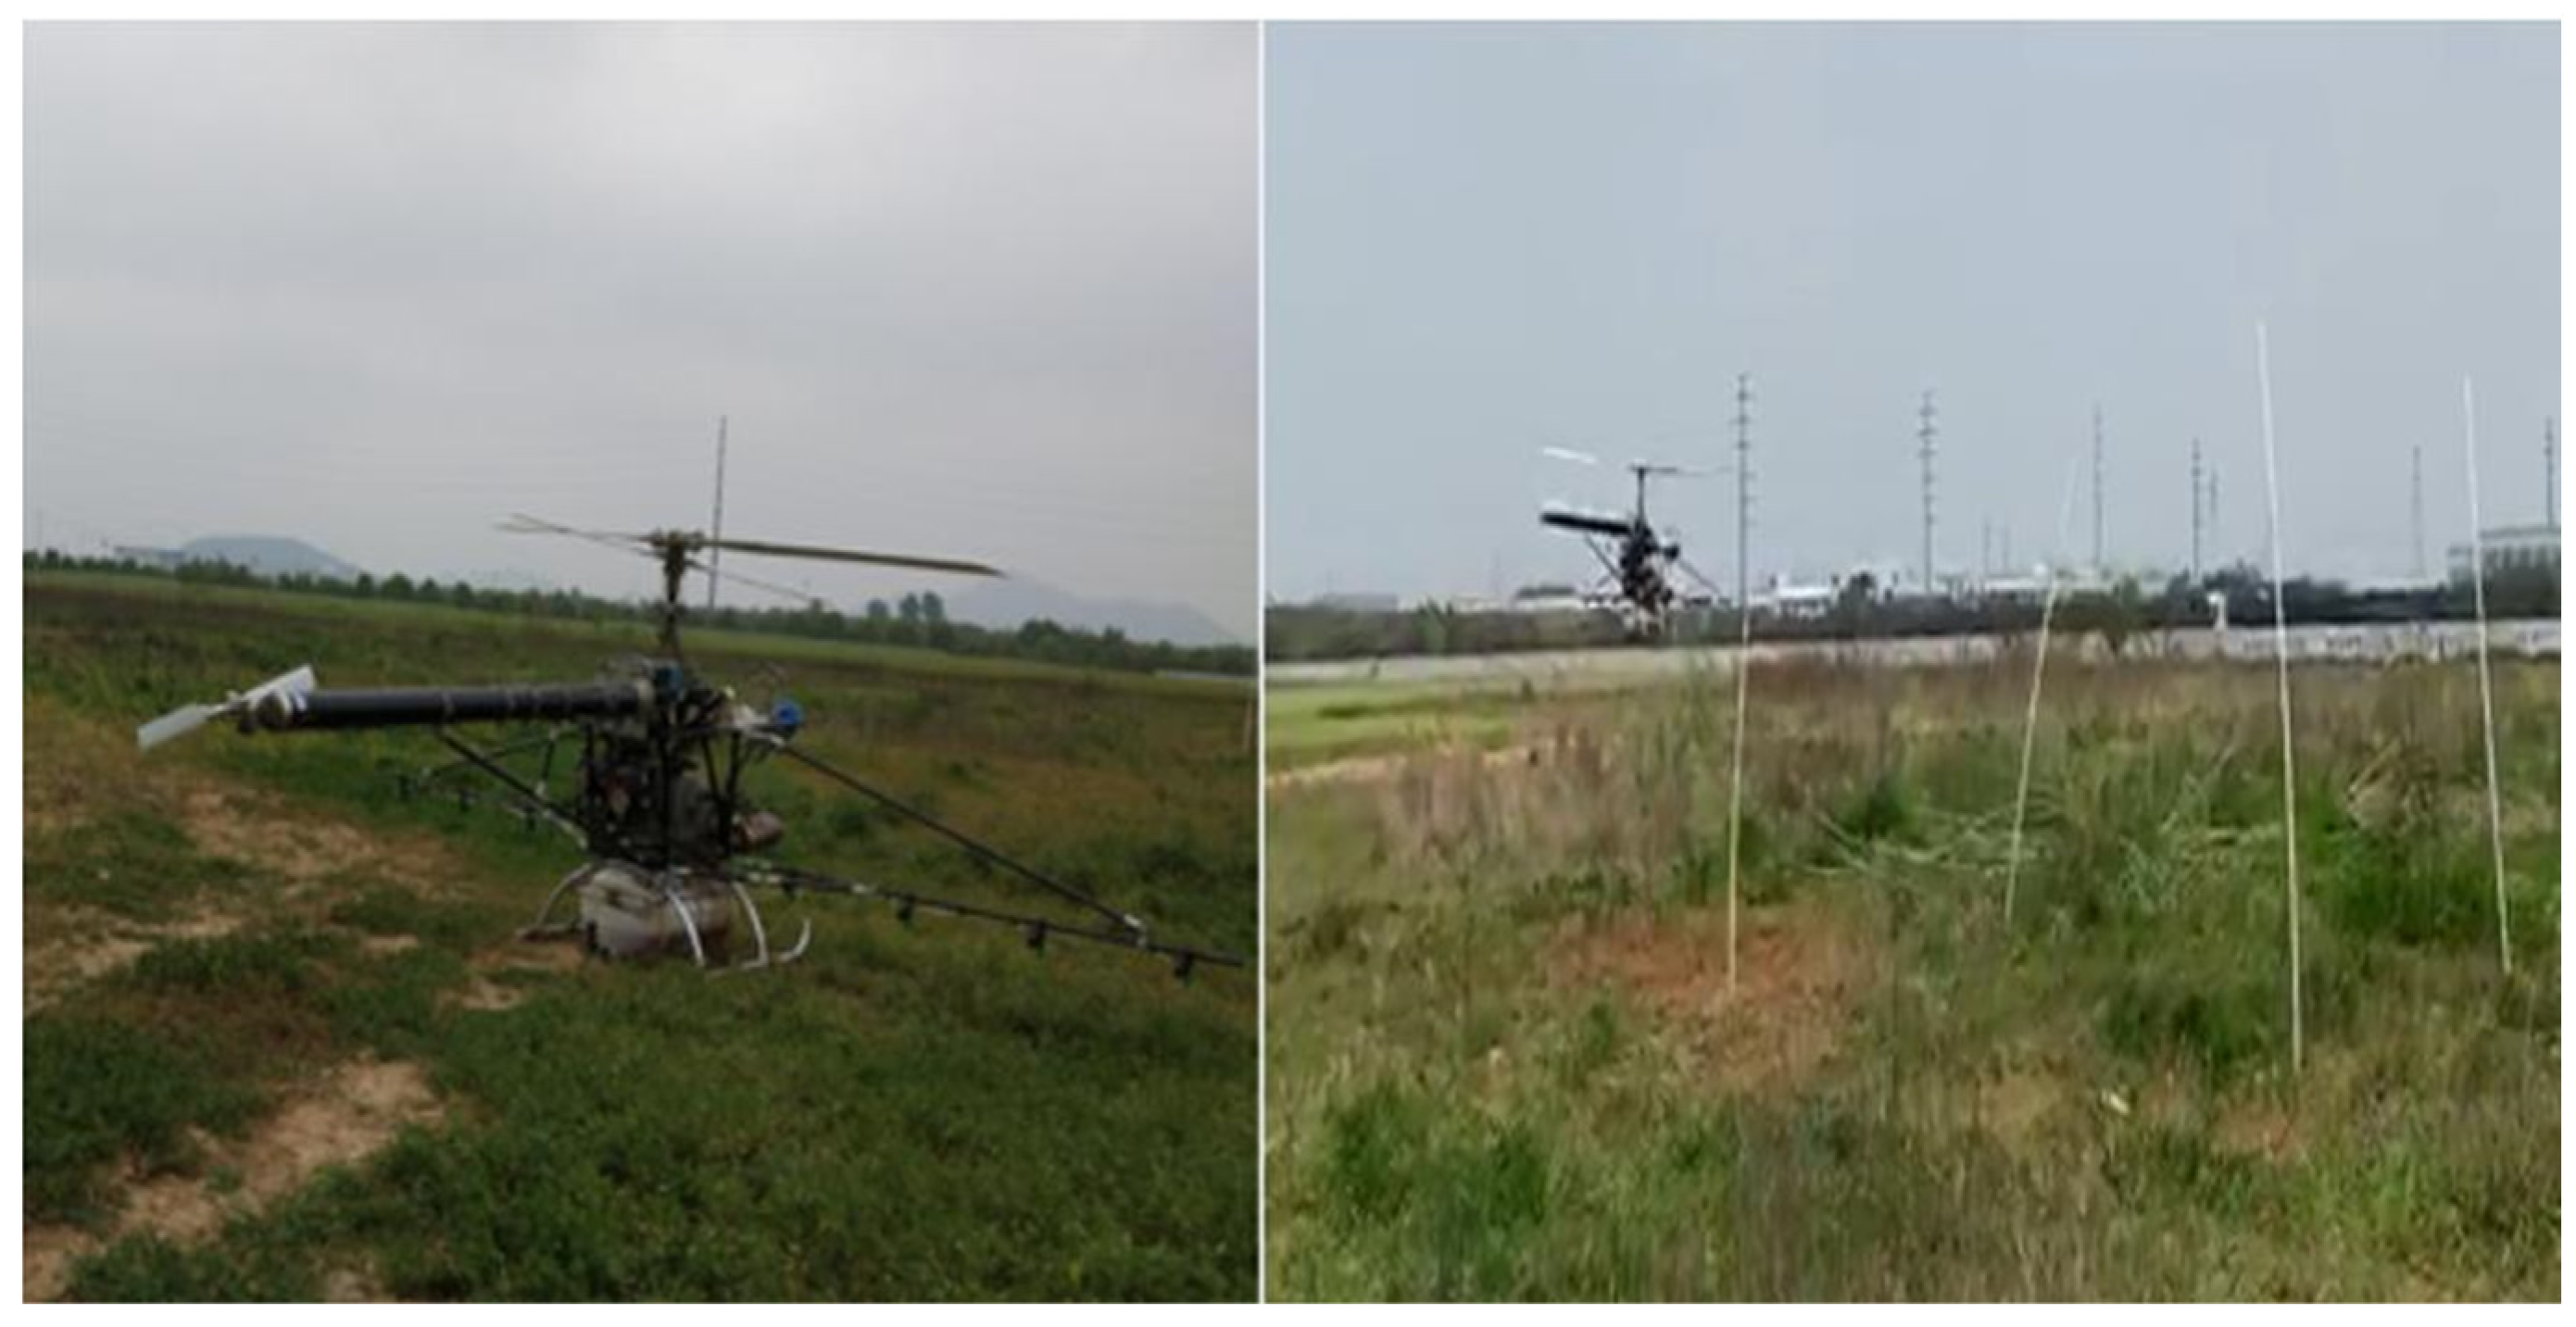
Keeping in view the sampling plan, a total of 34 spray sampling positions were allocated for each replication. WSP samplers (26 × 76 mm) and microscopic glass strip samplers (26 × 76 mm) were arranged horizontally in the remoteness distance of 0 m, 1 m, 2 m, 3 m, 6 m, 10 m, 15 m, 20 m, and 25 m from the line of travel on both sides and denoted as Ppi (i = 0, 1, 2,…9, −1, −2,…−8) and Pgi (i = 0, 1, 2,…9, −1, −2,…−8). The positive sign was allocated to the right-side samplers, and a negative sign was labeled to left-side samples. The WSPs and glass samplers were placed at a height of 1 m, and there were no crops in the field except weeds. Figure 2 shows the sampling set-up for the field trial, and Figure 3 shows the UAV sprayer in stationary mode and in flight.

Figure 2.
Glass slides and WSP samplers installment in the field for an experimental trial.
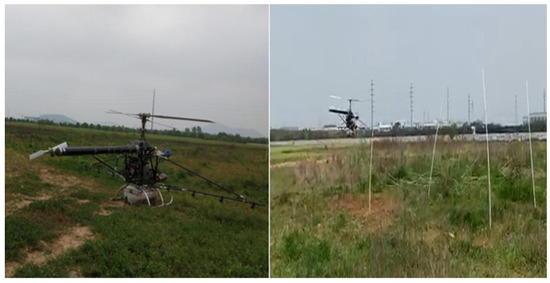
Figure 3.
UAV in static and flight mode during the test of sampler performance.
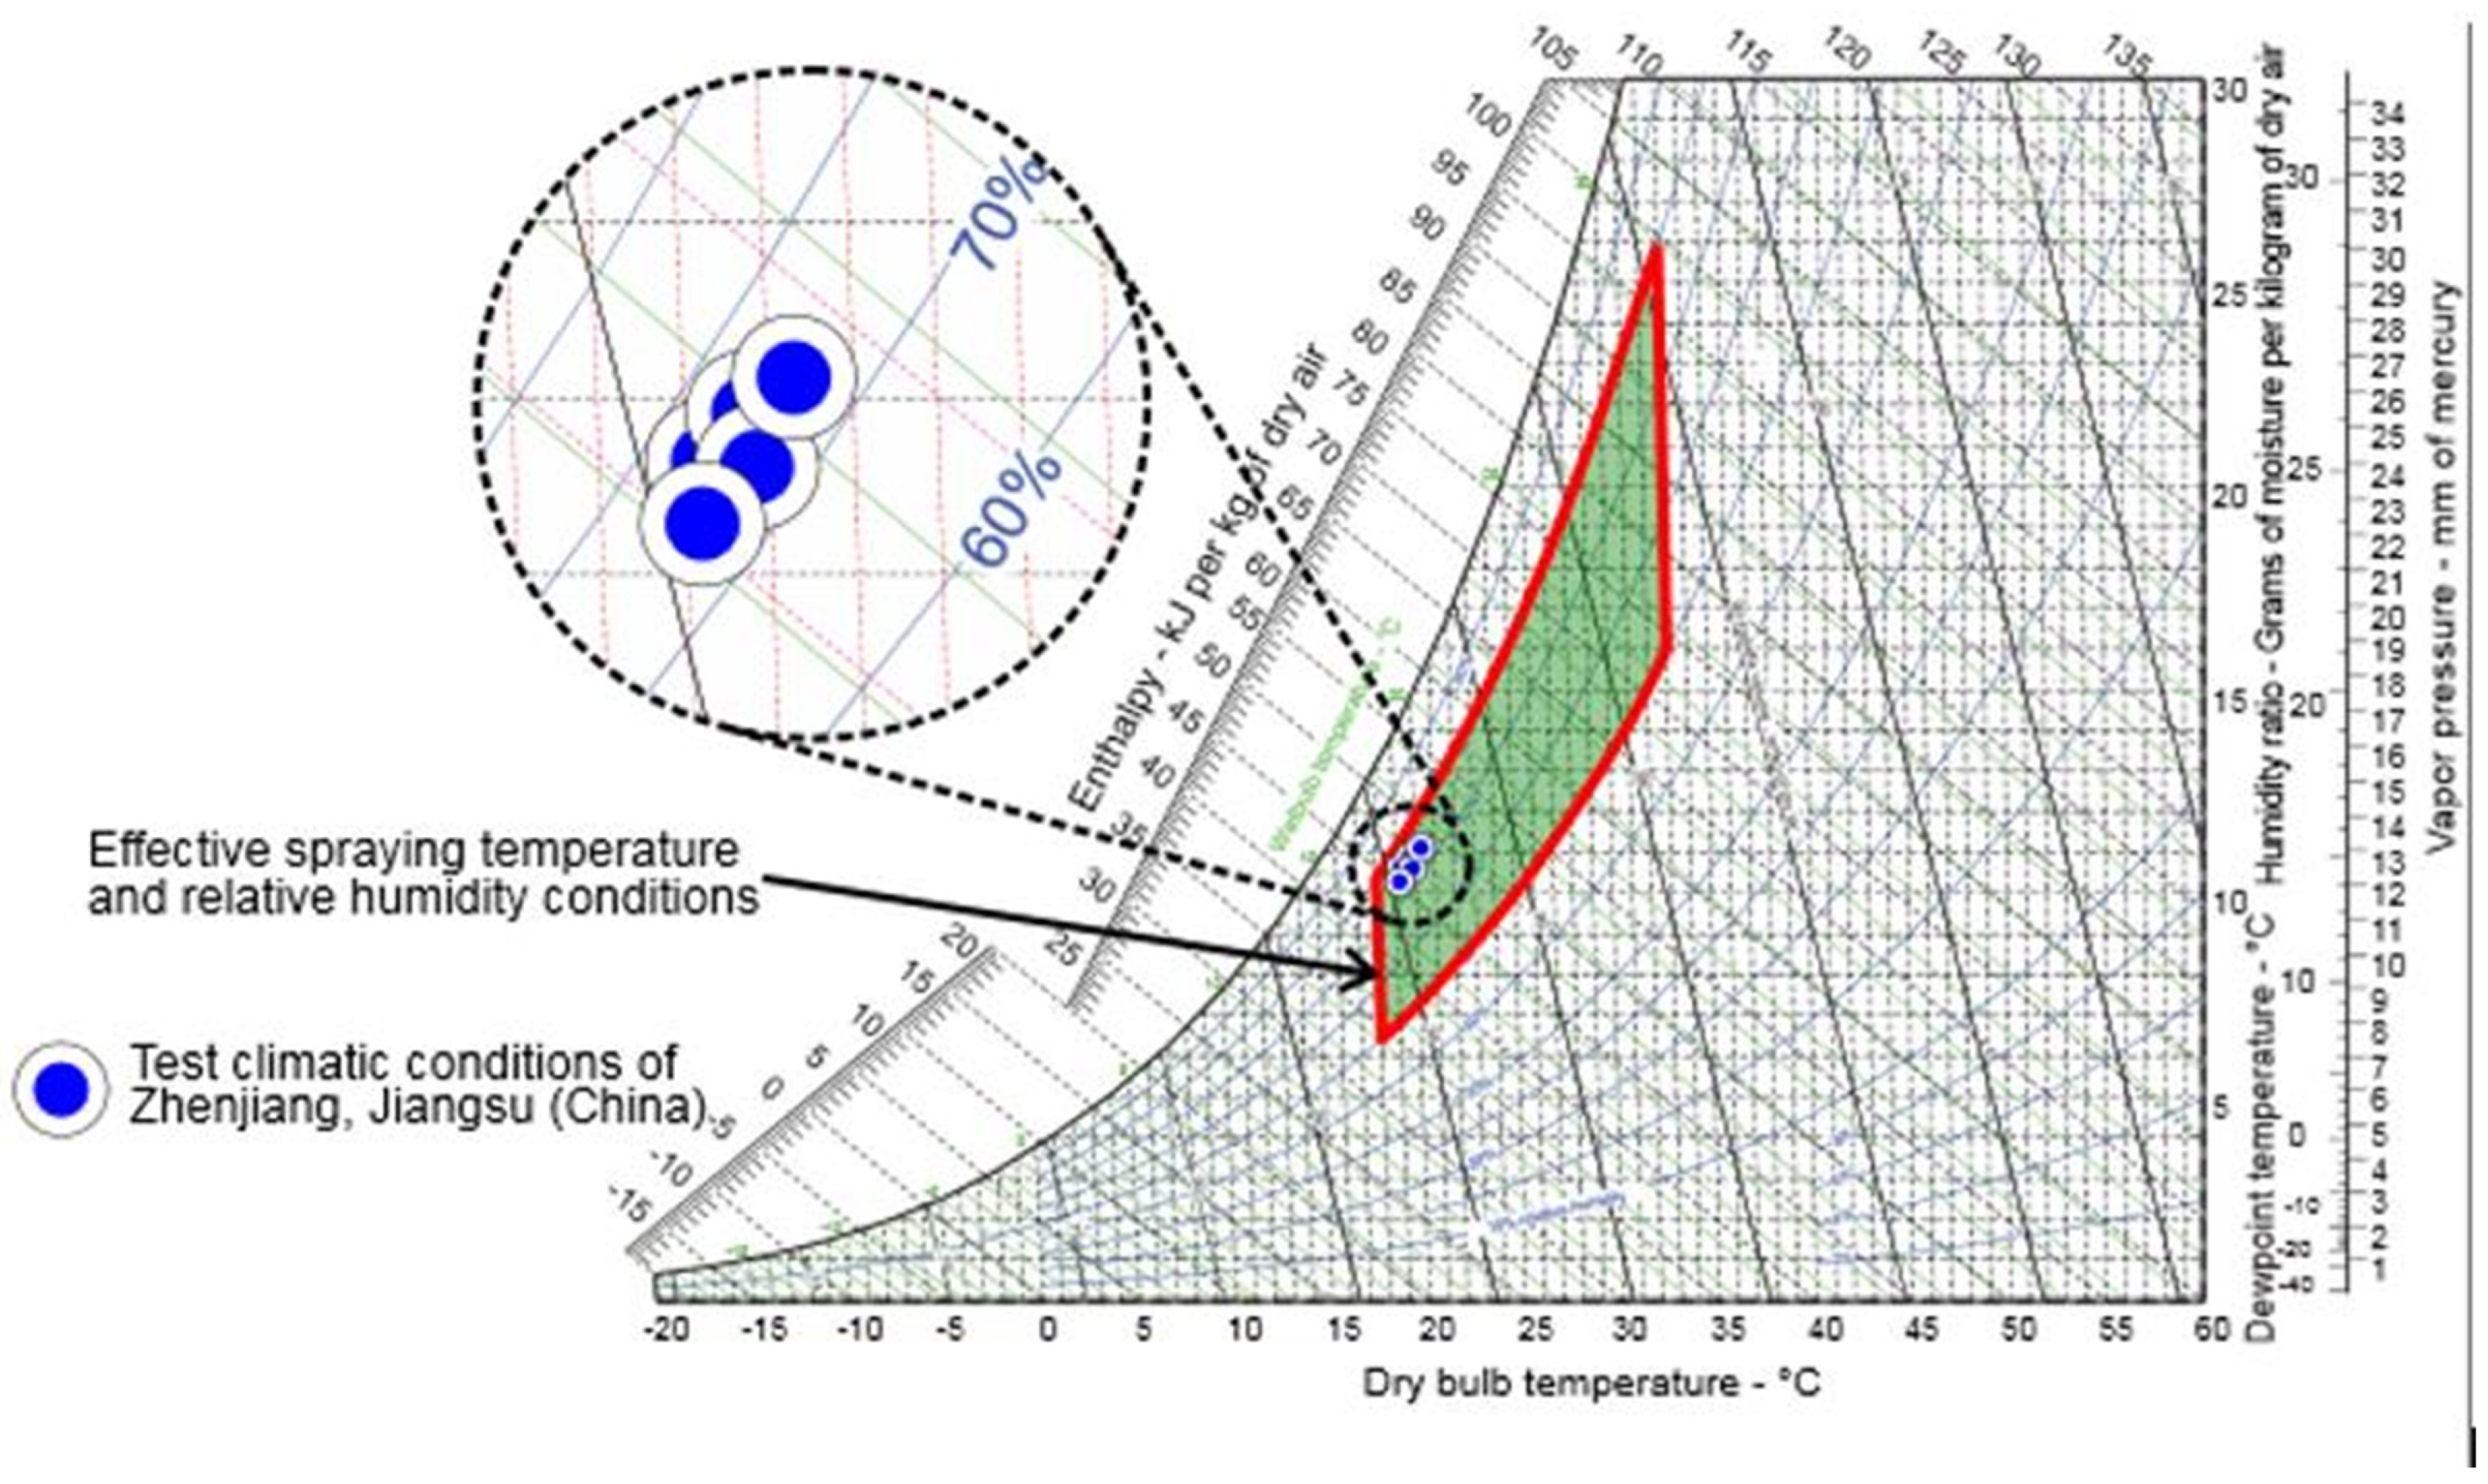
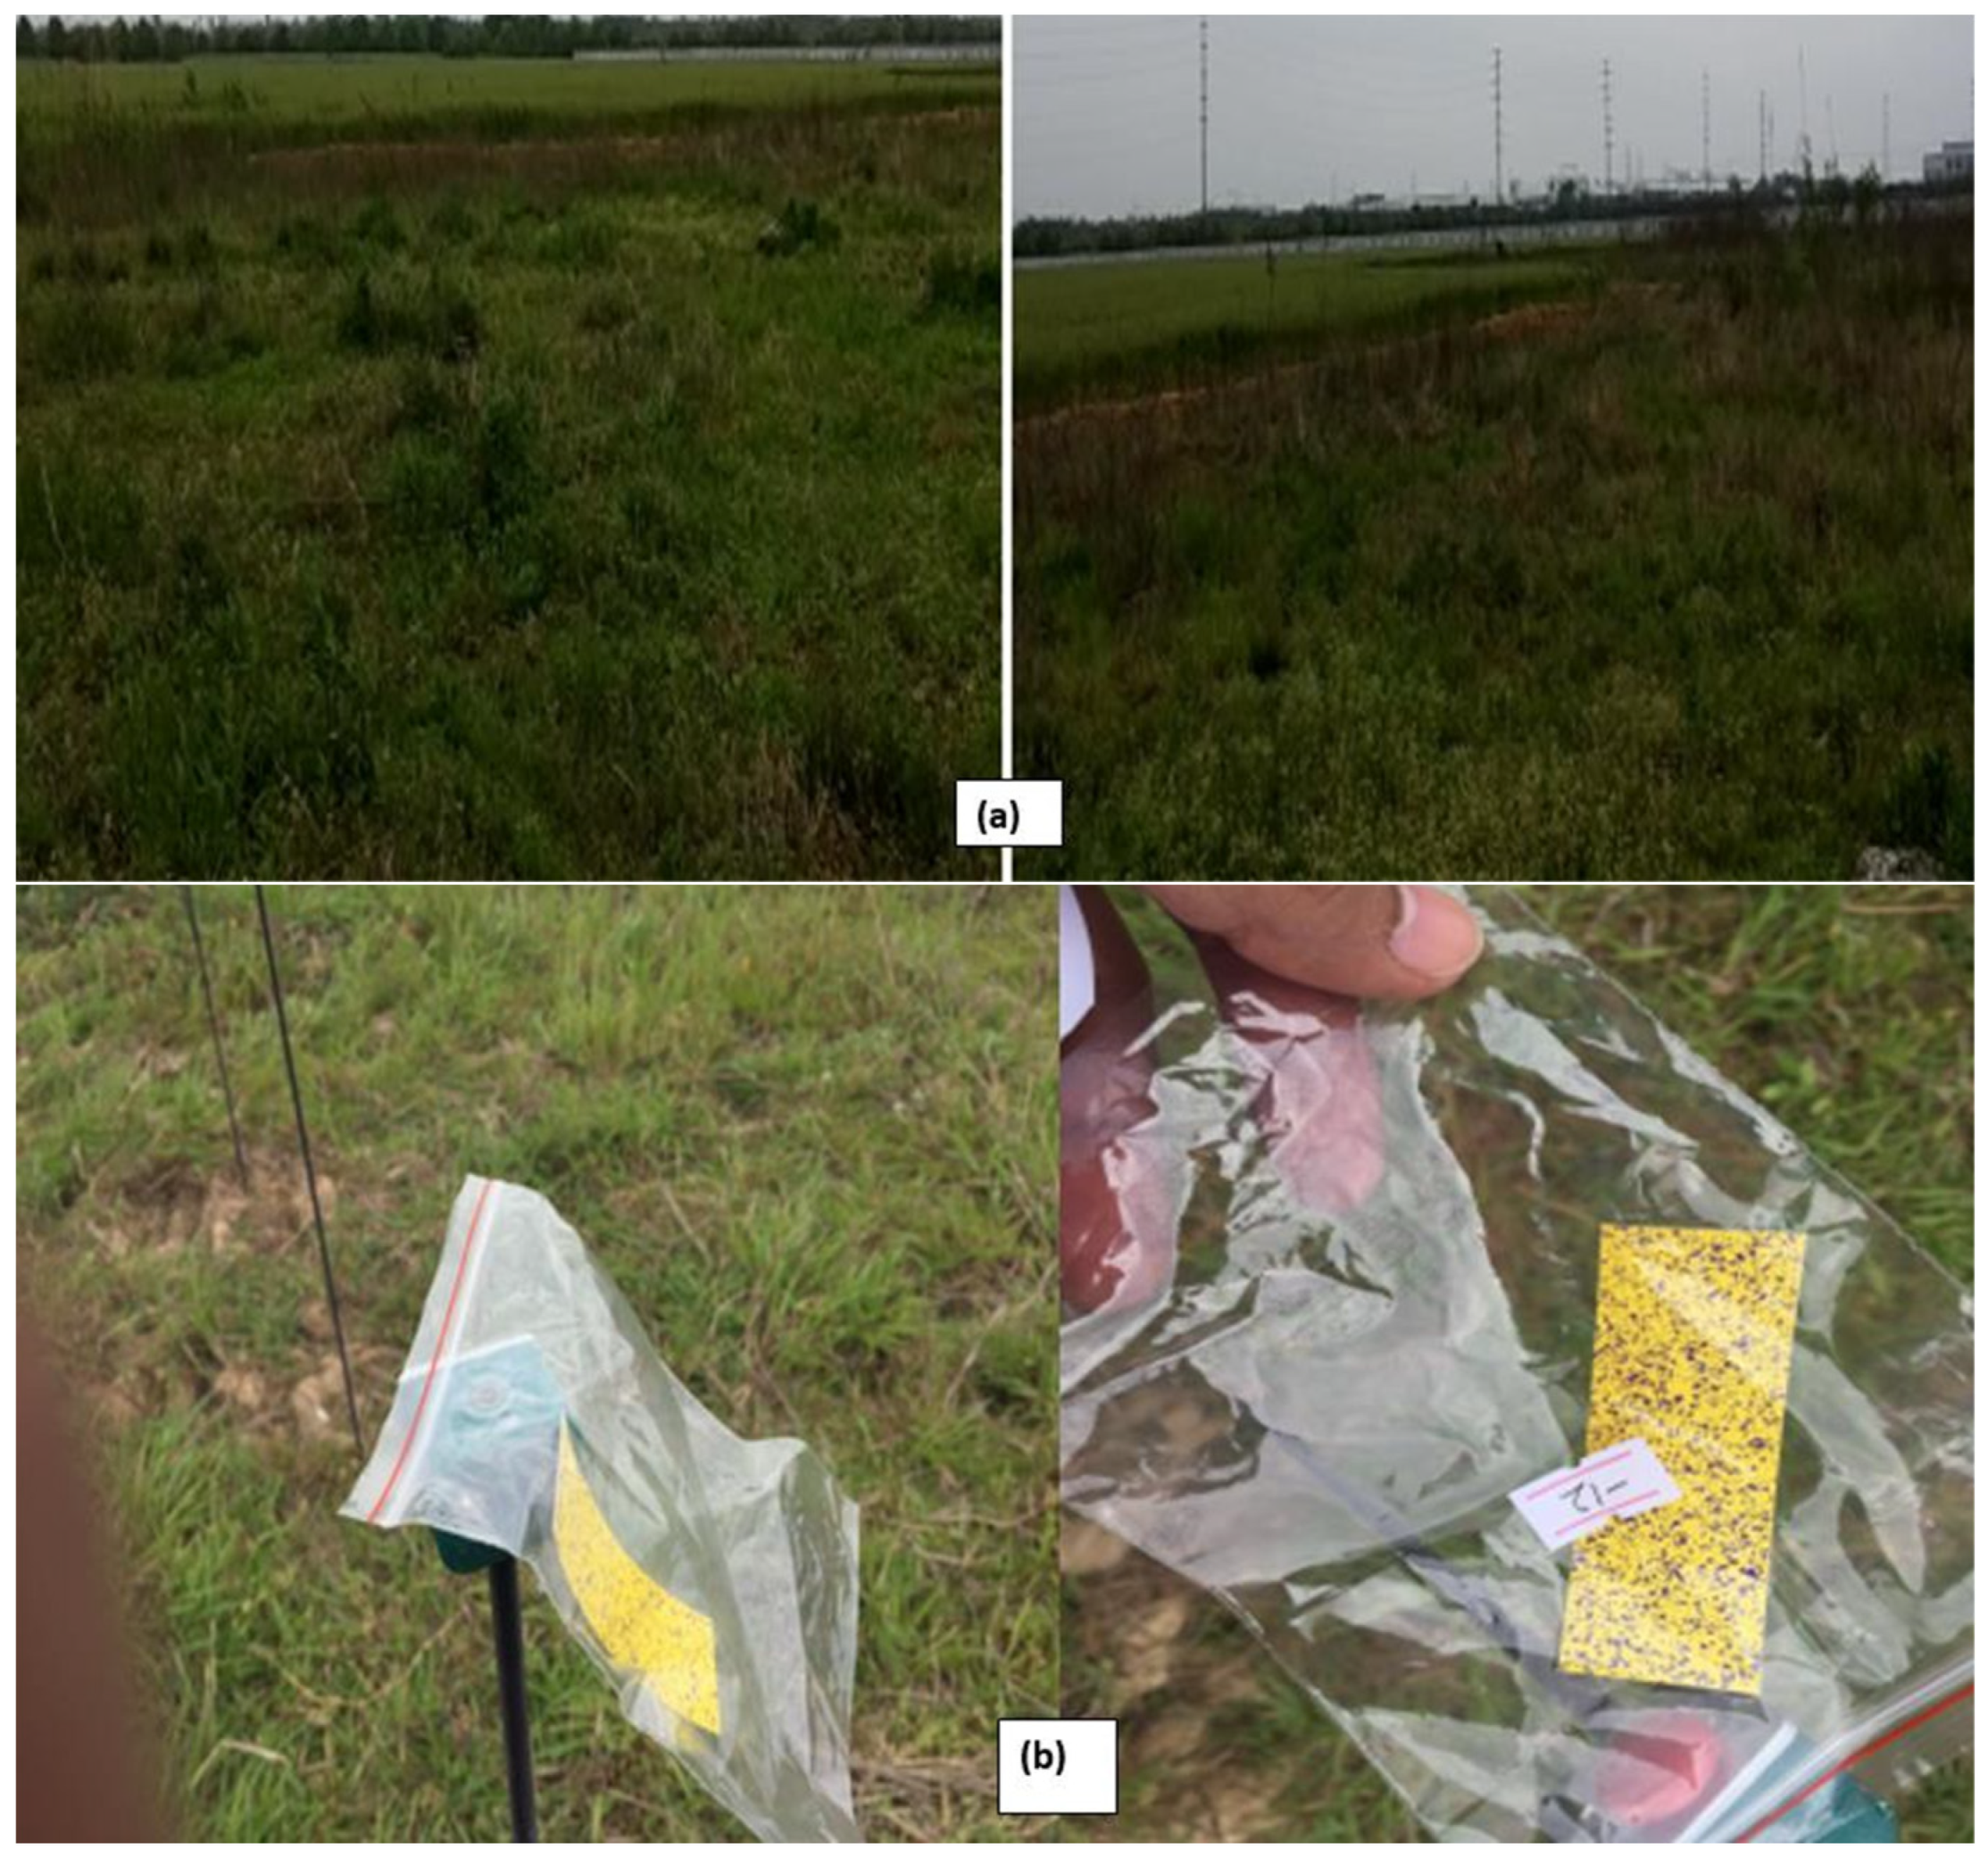
Metrological monitoring was performed by an automatic portable weather station (TYD-ZS, Beijing Hongchangxin Technology Co., Ltd., Beijing, China), which had a working height of 2.5 m. Table 3 shows the metrological situation and parameters at the experiment site. Figure 4 shows the representation of the climatic conditions on the psychrometric chart. The experimental test’s climatic conditions were present in the effective temperature and humidity zone on the psychrometric chart. The outlook of the field used for the test is shown in Figure 5.
Table 3.
Meteorological Parameters.
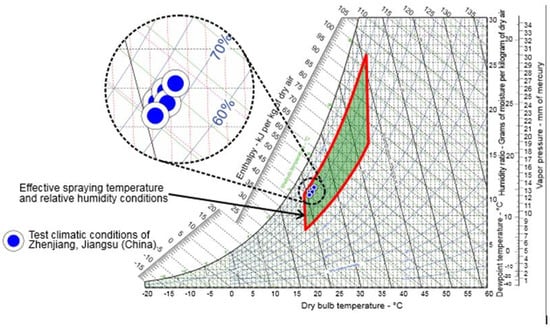
Figure 4.
Climatic conditions representation on the psychrometric chart.
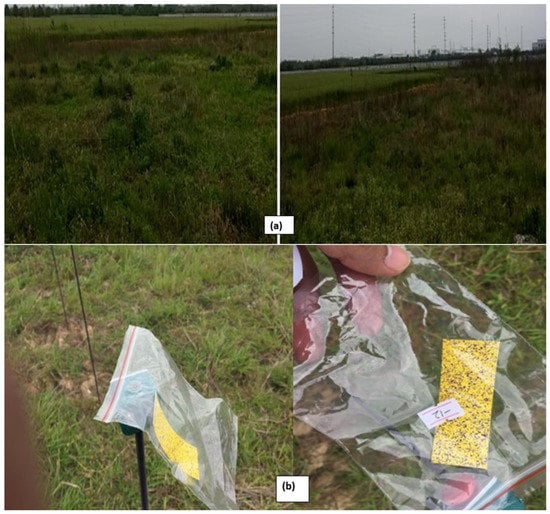
Figure 5.
(a) Outlook field used for the test; (b) WSP samplers in the zip bag.
2.5. Spray Data Acquisition and Processing
The WSP samplers were collected carefully by wearing gloves after drying, and they were then sealed and labeled in zip lock bags. After that, these samples were placed in a dry insulated box for safe transportation into the laboratory for further processing (Figure 5b). The scanning process was performed for every individual WSP sampler using the 600 dpi image setting of a high-density lab scanner. Spray deposition from the scanned WSP was determined using top-leading WSP image scanning and processing software (DepositScan software version 1, USDA ARS, Wooster, OH, USA), and followed the procedure described by researchers [12,41]. The DepositScan software can quantify the deposition, droplet density, droplet coverage, and the difference between droplet sizes. However, in this study, only deposition data were considered. For determination of the deposition from the microscopic glass, the following procedure was adopted.
After the droplets on the collector were dried in each trestle, we wore disposable gloves to collect the glass slide sampler. Then we marked them, put them in Ziplock bags, placed them in coolers, and took them back to the laboratory for analysis. We used deionized water to dilute the Rhodamine-B on each collector’s film and used the fluorescence spectrophotometer (F95) to determine each eluent’s fluorescence. Rhodamine-B deposition in the eluent could be calculated according to the “concentration fluorescence” standard curve of the Rhodamine-B standard. Fluid deposit on a unit area could be determined precisely by following the equations recommended by ISO standard 22866 [21,22].
Here, βdep is the spray drift deposit (µLcm−2), βdep% is the spray drift percentage (%), βv is the spray volume (L/ha), ρsmpl is the fluorimeter reading of the sample, ρbulk is the fluorimeter reading of the blanks (collector + dilution water), Fcal is the calibration factor, Vdii is the volume of dilution liquid used to dilute tracer from the collector (L), ρspray is the spray concentration or amount of tracer solute in the spray liquid sampled at the nozzle (g/L), and Acal is the projected area of the collector for catching the spray drift (cm2).
2.6. Statistical Analysis
A software package, Satistix (version 8.1, Analytical Software, Tallahassee, FL, USA), was used for analysis of variance (ANOVA) and the average. There were eight groups of treatment in total.
3. Results and Discussion
3.1. Effect of the Operative Parameters on Spraying Deposition Determined by Samplers
The sprayer performance and efficiency are determined by droplet deposition, distribution, and penetration in the plant canopy, as these are considered vital parameters. Figure 6 shows the spray deposition in target and off-target areas at different operational speeds and heights collected by both types of samplers.
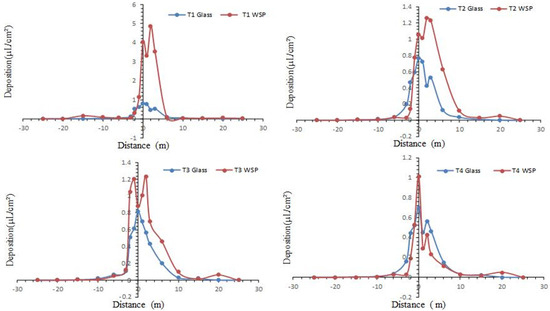
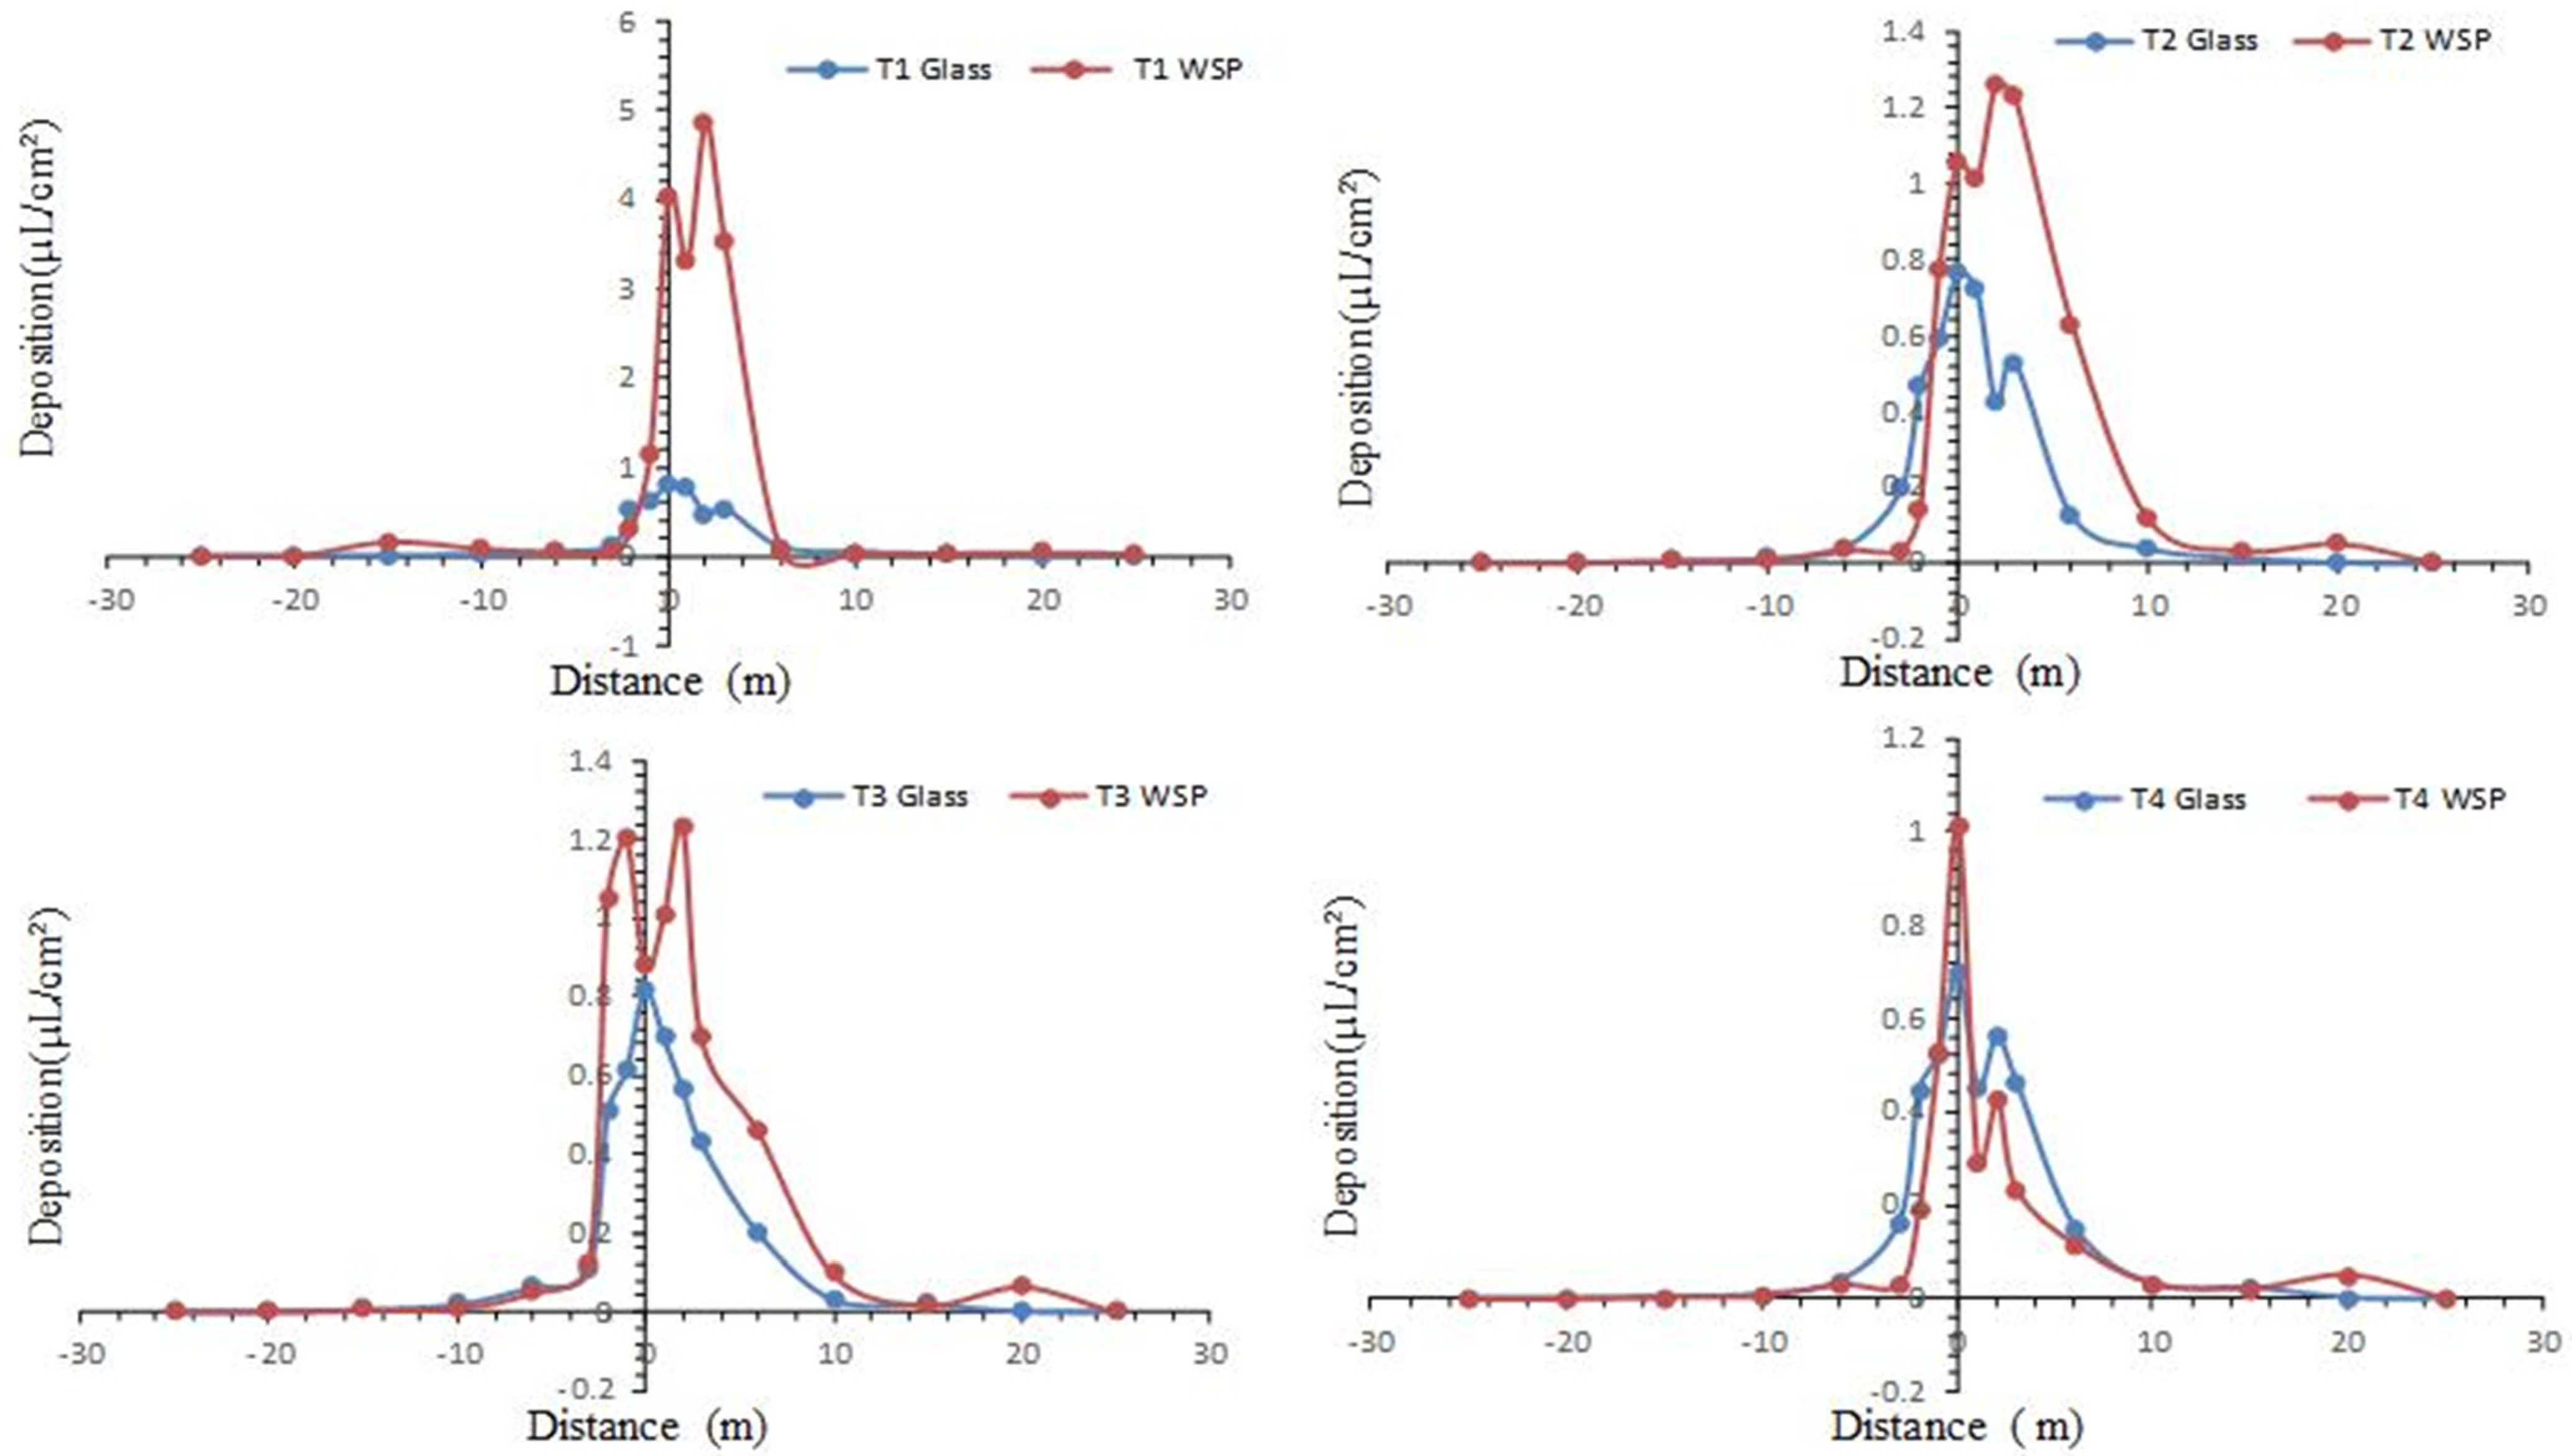
Figure 6.
Spray deposition in target and off-target zones on WSP and Glass strip.
The higher droplet deposition was achieved along the central line (flight line), while their values decreased with the increase in distance from the central line (flight line), and water-sensitive papers in the off-target zone recorded the irregular distribution. Due to the spray droplets’ higher kinetic energy at the moment of fluid discharge from the nozzle, the deposition on the zero-position recorded was higher [11,41]. As the airflow underneath the frame of the UAV formed by the rotor-wing [13,35] assisted the droplets with greater diameter to deposit comparatively quickly on the surface of the WSP in the target zone. However, this higher downwash wind pressure causes lower deposition on the tiny glass strip, as the glass strip has no absorption capacity and the smooth surface of the glass facilitated the droplets to escape from deposition. The water-sensitive paper recorded the droplet deposition in the target zone, ranging from 0.049 to 4.866 µLcm−2, where the glass strip recorded by 0.11 to 0.793 µLcm−2 at the treatment T1. The water-sensitive paper recorded a 80.3% higher deposition than the glass strip at zero position during the driving flight height of 2 m and flight speed of 2 ms−1. However, as the remoteness increased from the central line towards the left side of the flight direction, a difference in the deposition was recorded at the line; for example, a glass sampler showed a higher deposition than WSP but on the right side of the direction of flight. This trend in favor of the water-sensitive paper may be because of the wind direction, as droplets primarily deposit along the wind direction, and coarse droplets did not stay on the glass strip, as they drained from the strip area. The water-sensitive paper samplers collected higher deposition and drifted to the right side of the travel line rather than to the left side of the travel line for all UAV operation test levels. The phenomenon mainly happened because of the crosswind wind field influence as the external wind flow was blowing from the left side to the right side of the flight route from 49° to 81°. However, the glass strip sampler recorded relatively uniform deposition on both sides of the UAV line of travel.
As the flight speed and height increase, the droplet deposition difference between WSP and glass strip significantly decrease at zero position during the treatment T4. The glass strip recorded high deposition in the target zone with a range of 0.164 to 0.699 µLcm−2, whereas in the same condition, WSP recorded from 0.031 to 1.013 µLcm−2. At the line of travel, the glass slides sampler recorded the spray deposition 0.79, 0.76, 0.81, and 0.70 µLcm−2 for treatment T1, T3, and T4 respectively, whereas the WSP sampler recorded 4.03, 1.0.1, 0.88, and 1.03 µLcm−2. As the flight height and flight speed increased, the droplet split and lost more energy due to this lower performance to escape from the glass strip and provide a better result.
3.2. Effect of Sampler Type on the Droplet Deposition Measurement
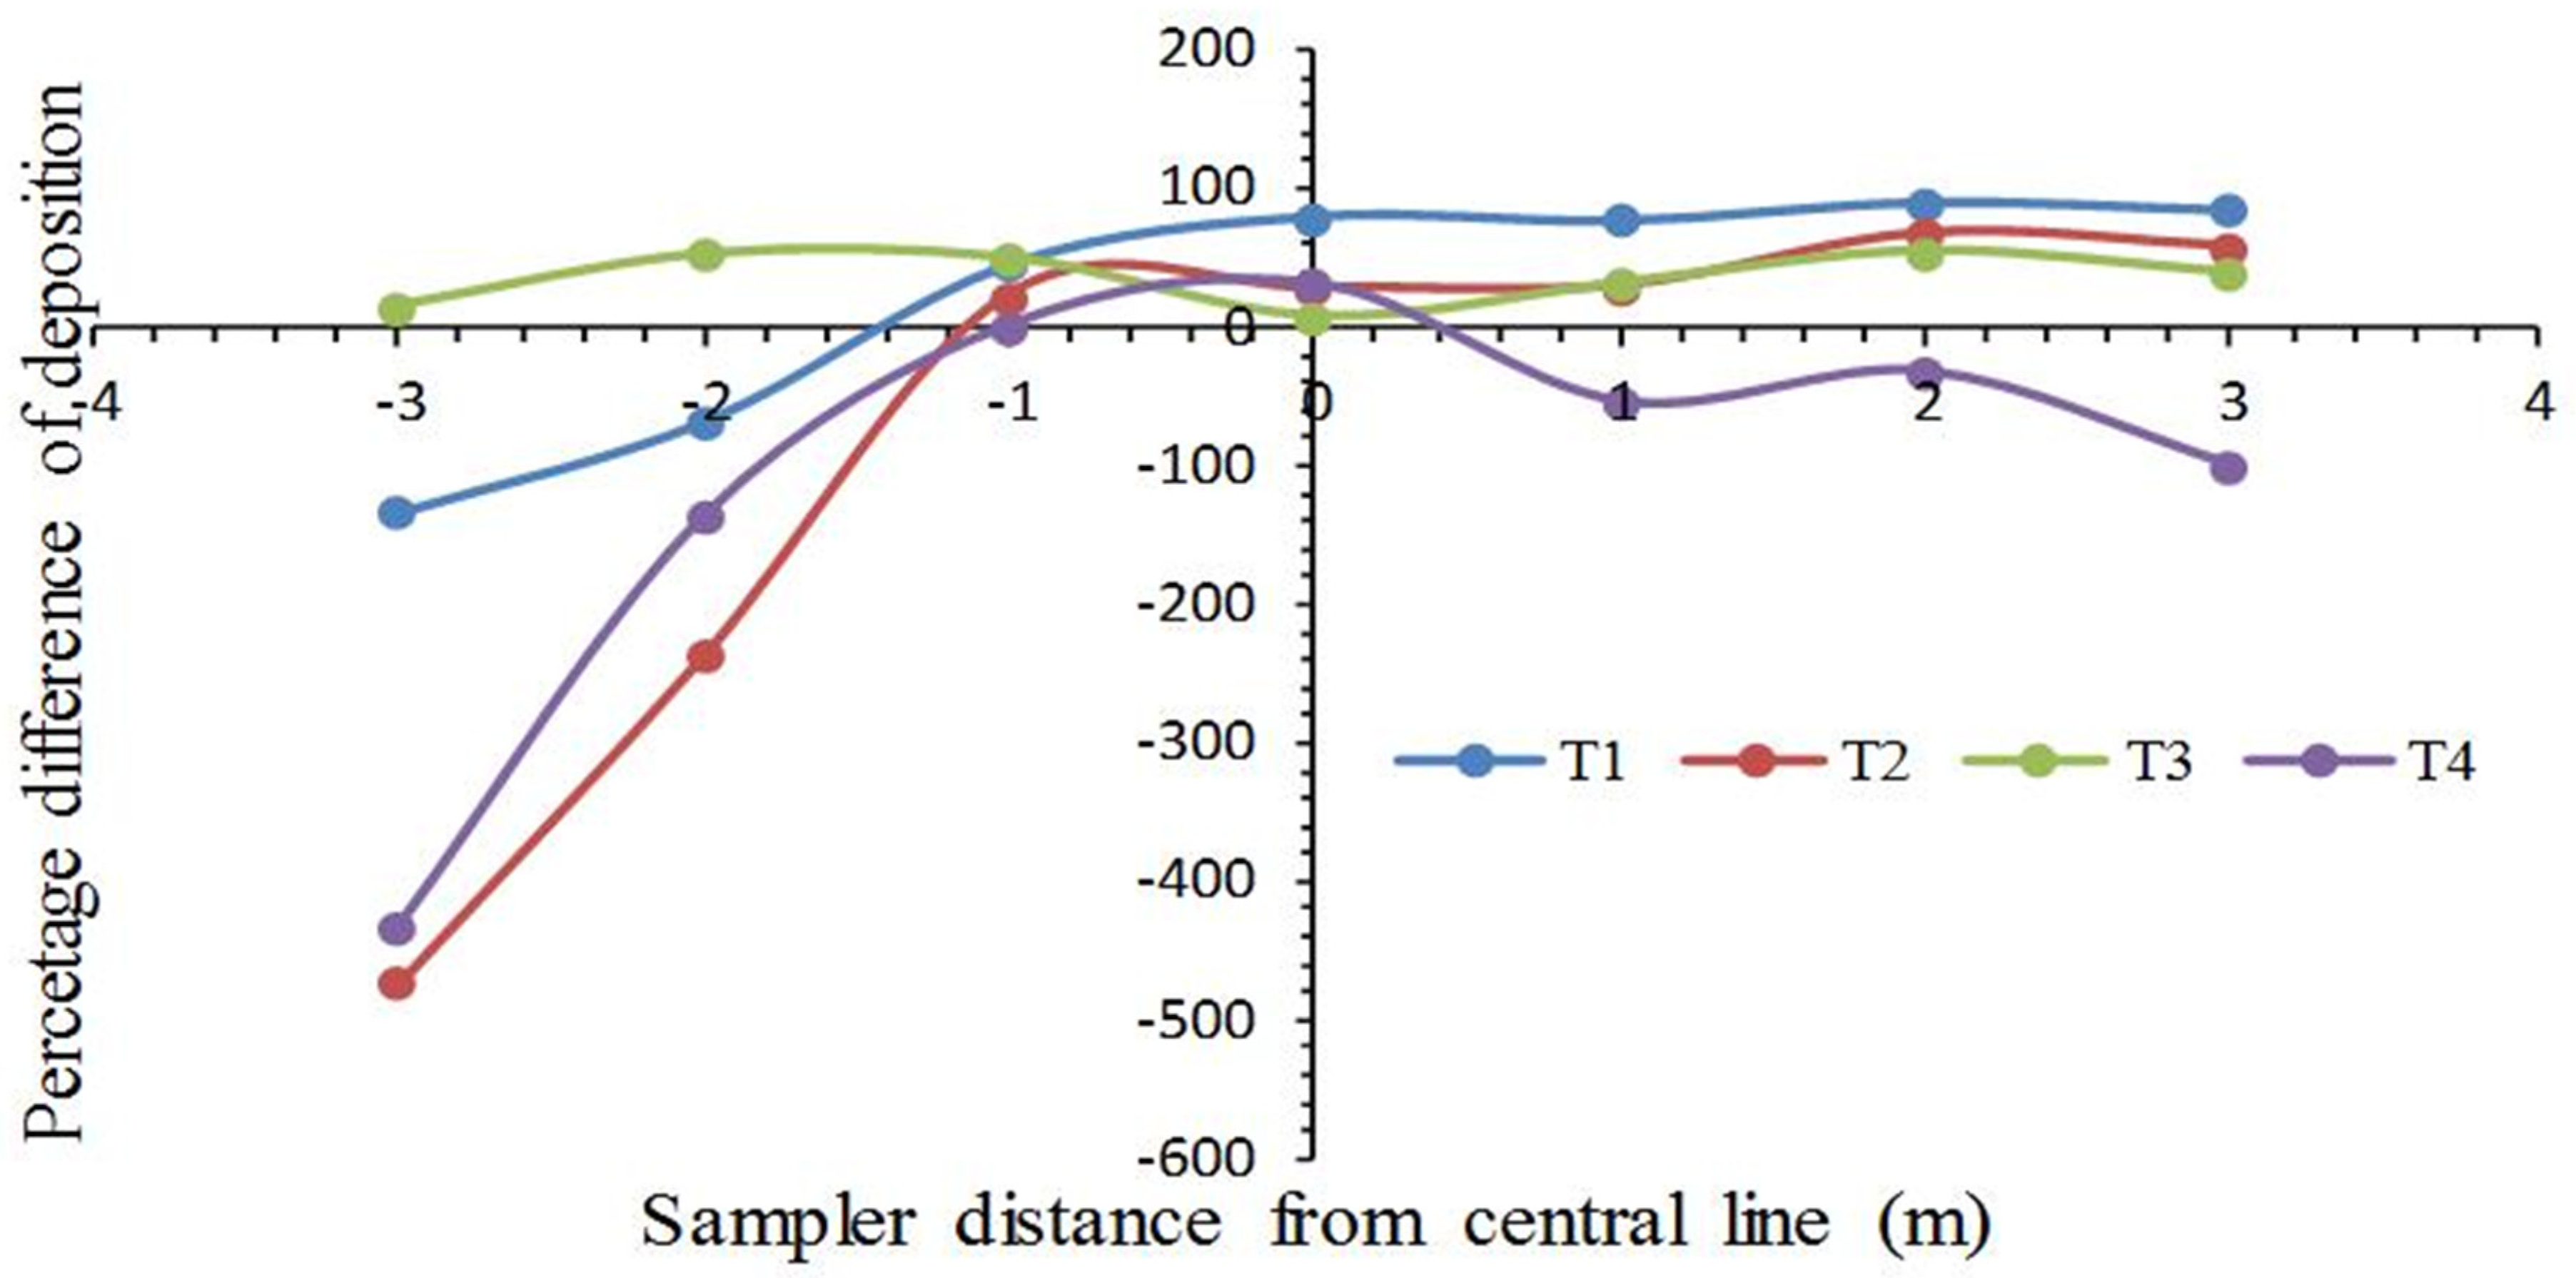
Figure 7 presents the percentage difference of deposition of water-sensitive paper sampler and glass microscopic strip sampler in a target zone. At T3, the percentage difference of deposition recorded by both types of sampler outcomes is relatively close to each other, and the difference ranges from 14% to 55%. This shows that both samplers gave somewhat similar outcomes at 5 m flight height and 2 ms−1 speed. The glass strip recorded a high deposition in the target zone with a range of 99% to 493%, whereas the WSP recorded from 0.031 to 1.013 µLcm−2 during the treatment T4. Only at x = 0, WSP recorded a 30% higher deposition than the glass slide sampler. The water-sensitive scanning software also influences the final deposition results as DepositScan software neglects the droplets having a diameter less than 42.3 µm [41].
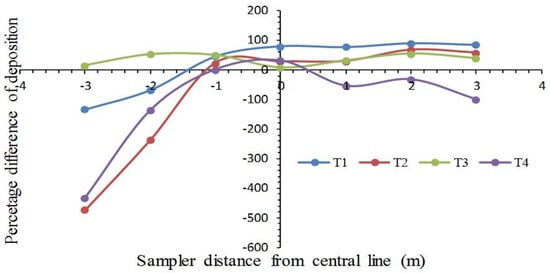
Figure 7.
Percentage difference of deposition at WSP and glass microscopic strip sampler in the target zone.
Table 4 shows that the average deposition in the target zone was recorded by the two types of sampler. The analysis of variance (ANOVA) shows that the kind of sampler significantly (p = 0.05) affected the deposition recording in the target zone. Average deposition in the target zone 2.643 µLcm−2 and 0.543 µLcm−2 was recorded by WSP and glass slide, respectively, during treatment T1. Cerruto et.al. [43] conducted a study to determine the correlation among deposits on Petri dishes and a fraction of covered surface on WSPs and assess the WSP behavior by simulating their coverage and found that the WSP assessment model has a significant influence on the deposition outcomes. Thus, the sampling techniques are responsible for over-measuring or under-measuring the spray deposition. Munjanja et al. [30] also highlighted the significance of the standardization of spray deposition monitoring approaches, including selecting the utmost suitable sampler for a specific situation to obtain truthful and precise data. This gains more importance for deposition monitoring from UAVs, as currently, there is no standard procedure and sampler available that counters the effect of airflow field and crosswind on the deposition.
Table 4.
Average deposition (µLcm−2) in the target zone recorded by samplers.
However, from the above results, it is clearly shown that with the lower flight height and speed, the glass strip sampler gave a poor performance compared with the water-sensitive paper. So, the results recorded by the glass strip samplers do not show the true performance of the UAV.
This study also revealed that sampler selection also performs a significant role in the testing of UAV performance. The vortex activated by the rotor wing along the spray lance reformed the morphology and trajectory of droplets, facilitating the maximum concentration of coarse droplets molded along with the spray lance [14]. However, the crosswind influences the droplet trajectory. Teske and Wachpress [13] reported that the expected maximum droplet deposition concentration did not occur along the centerline directly behind the aerial vehicle due to the crosswind effects on the droplets’ trajectory, though spray nozzles released the liquid in symmetrical patterns. Similarly, Shi et al. [35] also reported that the droplet deposition concentration occurred in the horizontal range of a distance from −1.3 to 1.3 m without downwash working conditions of the UAV, and deposition concentration was in the distance range from −6.4 to 6.4 m, with downwash working conditions of UAVs, based on findings using a numerical simulation approach. It was determined that 90% of the droplet deposition occurred in the target zone. However, the oscillation pattern between 0 and 2 m horizontal distance from the central line is because of the downwash velocity profile established by the UAV rotors. The decreasing pattern confirms the obstruction of the downwash beneath the belly of the UAV.
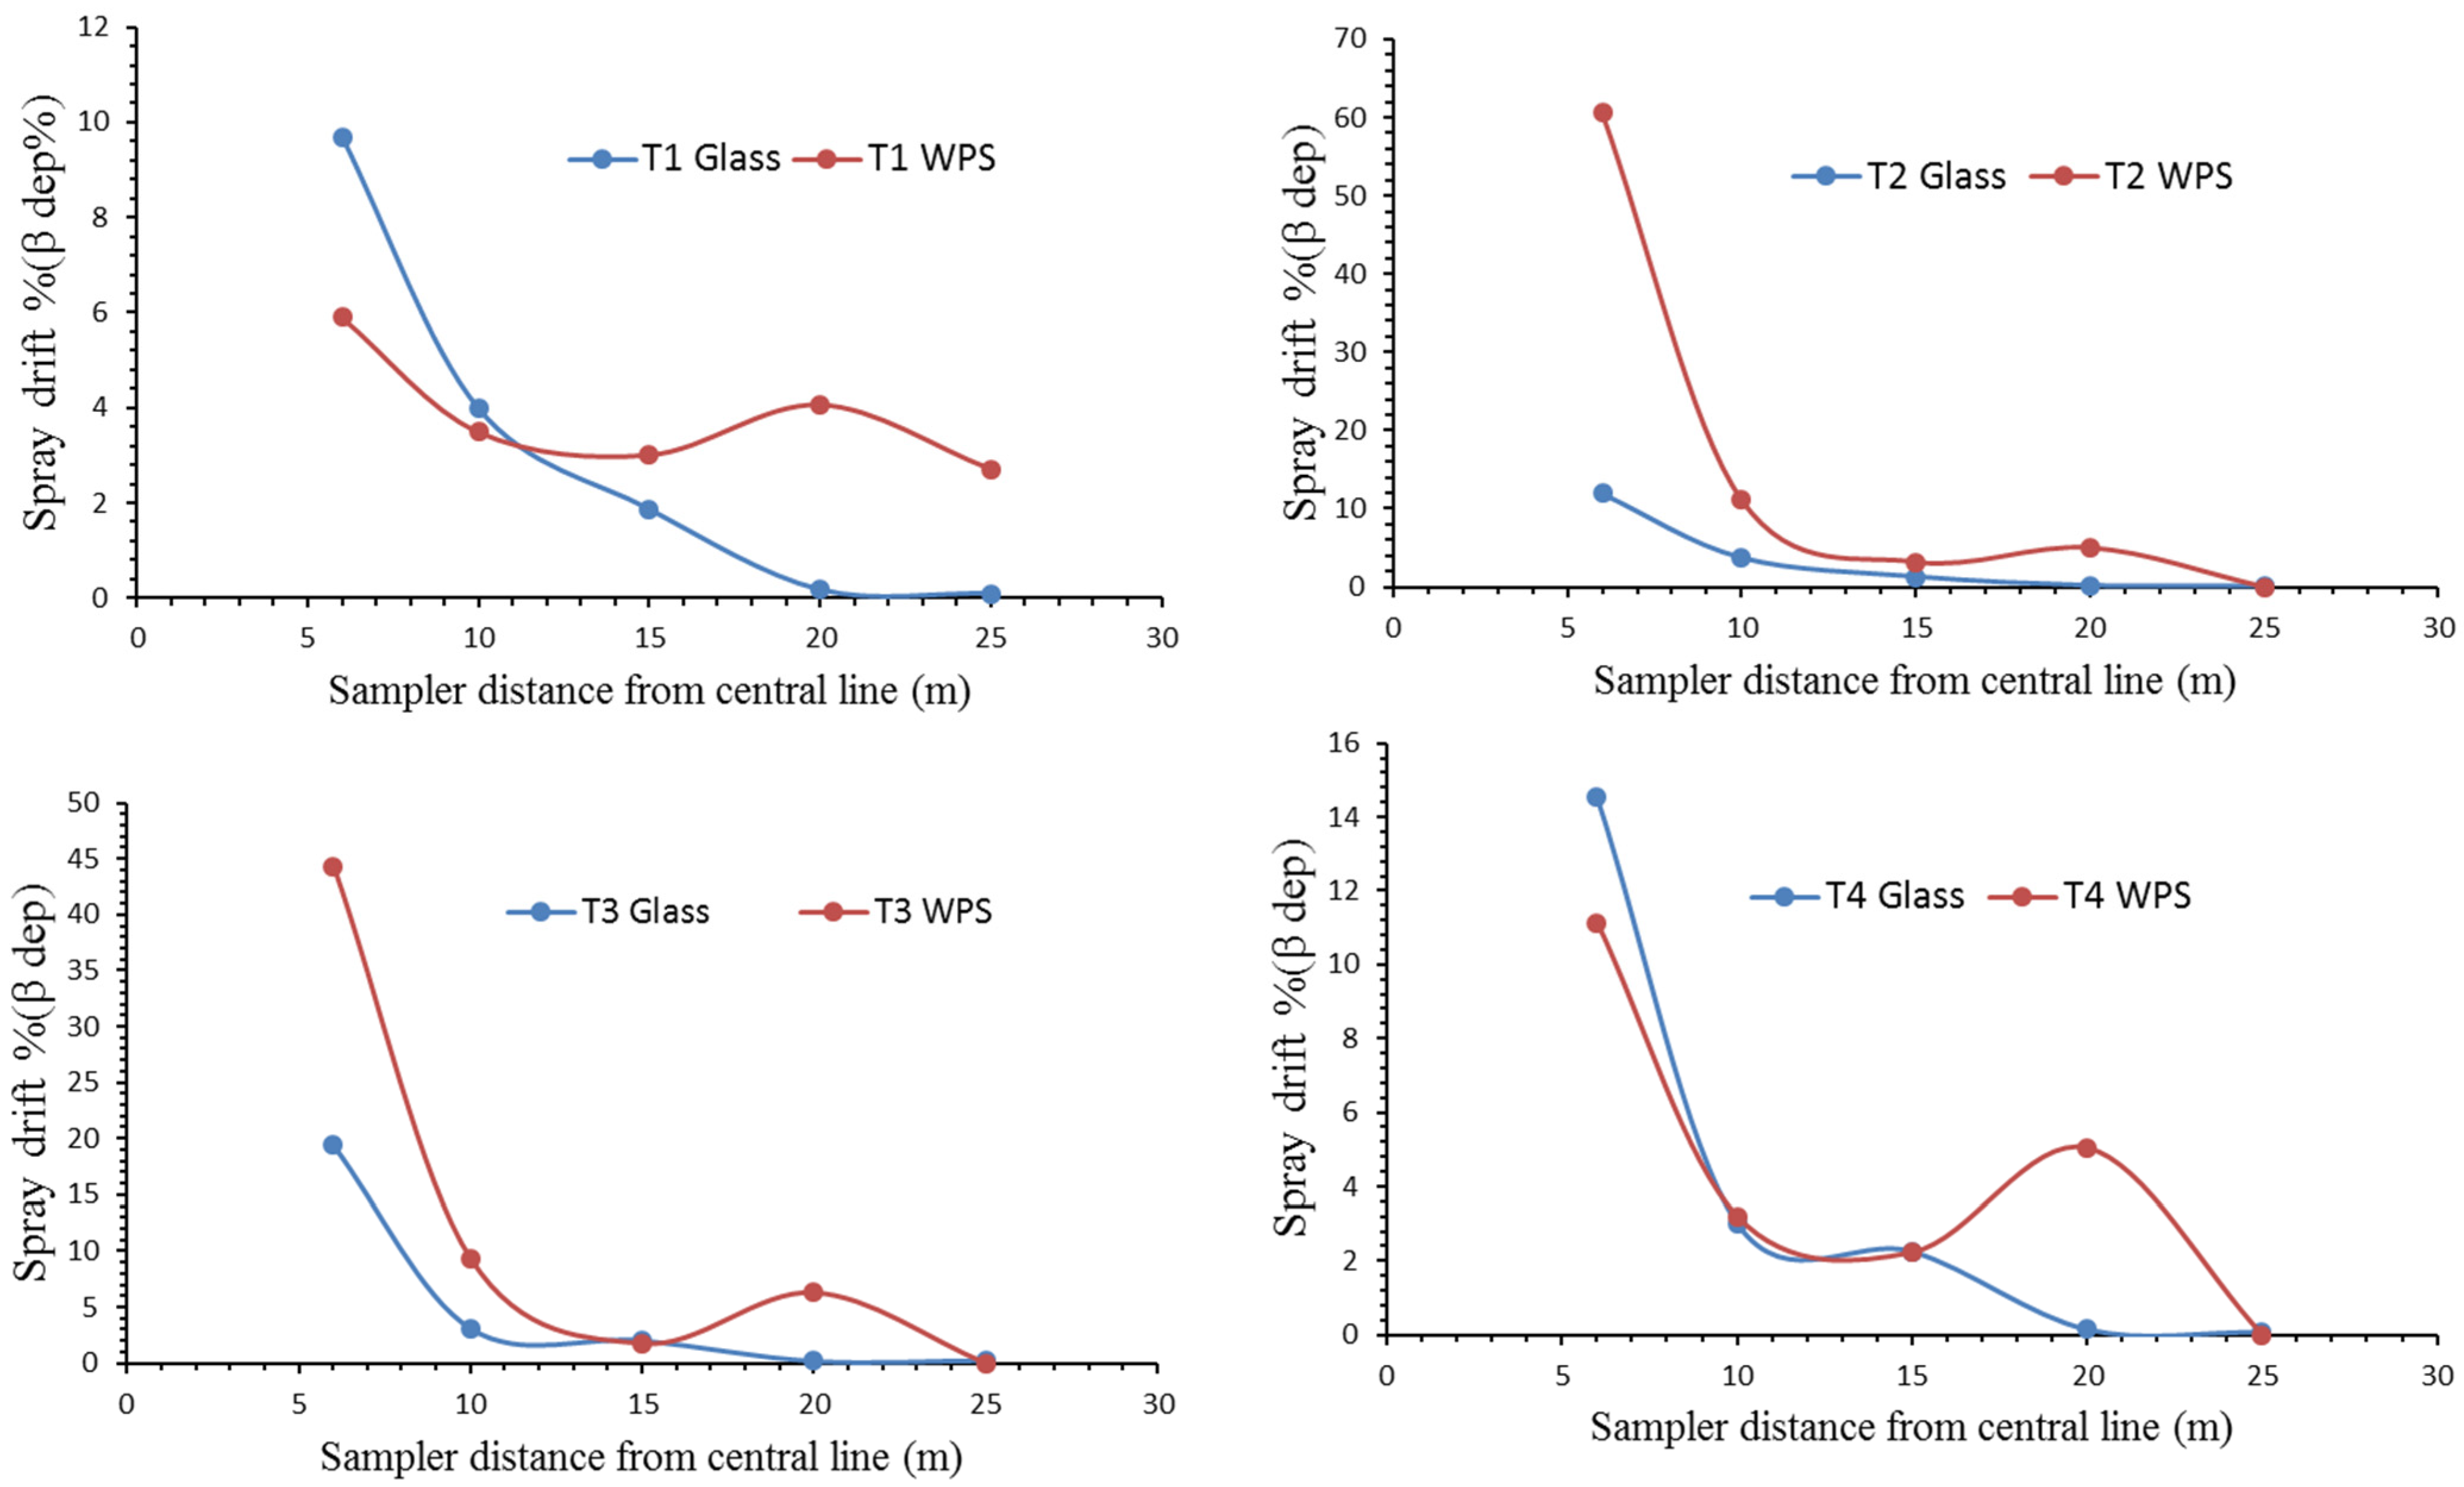
Figure 8 shows the spray drift percentage for various tests on the right side of the UAV sprayer route recorded by WSP samplers and glass strip samplers. The WSP sampler showed a higher percentage drift than the glass slide sampler on the right side of the line of travel. For T2 and T3, the WSP sampler recorded about 60% and 44% at 6 m; however, the same position and trail glass slides were recorded at 11% and 14%, respectively. This may be due to the crosswind effect along with the increase in flight height.
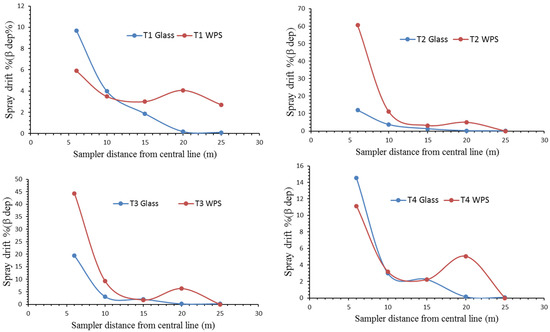
Figure 8.
Spray drift percentage for various tests on the right side of the UAV sprayer route recorded by WSP samplers and glass strip sampler.
Cerruto et al. [43] developed a model to assess the spray deposit by applying a WSP sampler, and concluded that strain expansion factors need to consider for actual calculation, as the image processing software has limitations [31,44,45]. Thus, Munjanja et al. [30] conclude that more research studies need to be conducted to standardize deposition monitoring methodology, including selecting the most appropriate sampler for a specific condition, to gain accurate and comparable data. Now, standard testing materials and methods are more important in the case of UAV sprayer evaluation. Thus, more work is needed to develop a standard procedure and sampling equipment for the evaluation of spraying performance by UAVs in the future.
4. Conclusions
A decisive stage in the measurement of spray deposition and drift is selecting an appropriate sampling approach under field conditions. Sampling methods play a key role in finding accurate and precise droplet deposition results that are significant for the design and operation of the spraying machinery. The results showed a difference in the estimation of the spray deposits among the two applied sampling methods. The WSP recorded an 80.3% higher deposition than the glass strip at zero position during the driving flight height of 2 m and flight speed 2 ms−1. Average deposition in the target zone 2.643 µLcm−2 and 0.543 µLcm−2 was recorded by WSP and glass slide, respectively, during treatment T1. It can be concluded that variation in recorded depositing is due to the sampling material. The WSP samplers presented better results than the glass strip samplers. It is suggested that, to determine confident deposition outcomes, measurement methods and sampling approaches must be standardized for UAV sprayers according to the field conditions and controlled within artificial assessments.
Author Contributions
Conceptualization, F.A., S.Z. and B.Q.; methodology, F.A., B.Q., S.A. and J.M.; formal analysis, F.A., B.Q., S.A., J.M., H.X., W.Q. and F.A.C.; writing—original draft preparation, F.A., S.Z. and J.M.; writing—review and editing, F.A., W.Q., F.A.C. and A.K.; supervision, B.Q. visualization, F.A., S.A. and A.K.; funding acquisition, F.A. and S.Z. All authors have read and agreed to the published version of the manuscript.
Funding
This research was funded by the China Agriculture Research System of MOF and MARA (grant no. CARS-12), the Agricultural Science and Technology Innovation Project of the Chinese Academy of Agricultural Sciences, Crop Protection Machinery Team (grant no. CAAS-ASTIP-CPMT and the Jiangsu Science & Technology Development Plan (BE2019305) for study.
Institutional Review Board Statement
Not applicable.
Informed Consent Statement
Not applicable.
Data Availability Statement
The data presented in the study are available on request from the corresponding authors.
Acknowledgments
We are thankful to Department of Agricultural Engineering Bahuadiin Zakariya University, Multan, Pakistan and acknowledge the support of the School of Agricultural Engineering, Jiangsu University, China. We are also thankful to the Karen Worley, Franklin Furnace city, Ohio, USA for manuscript language proofreading.
Conflicts of Interest
The authors declare no conflict of interest.
References
- Chao, X.G.; ChenN, S.; Qiu, W.; Lv, X.L.; Li, H.; Han, C.J.; Ahmad, F. Simulation and validation of the air flow generated by a multi-channel air-assisted sprayer. IEEE Access 2019, 7, 94848–94857. [Google Scholar] [CrossRef]
- Hussain, S.; Cheema, M.J.M.; Arshad, M.; Ahmad, A.; Latifm, M.A.; Ashraf, S.; Ahmad, S. Spraying Uniformity Test ing of Unmanned Aerial Spraying System for Precision Agro-chemical Applications. Pak. J. Agric. Sci. 2019, 56, 897–903. [Google Scholar] [CrossRef]
- Lan, Y.; Chen, S. Current status and trends of plant protection UAV and its spraying technology in China. Int. J. Precis. Agric. Aviat. 2018, 1, 1–9. [Google Scholar] [CrossRef]
- Liao, J.; Zang, Y.; Luo, X.; Zhou, Z.; Lan, Y.; Zang, Y.; Gu, X.; Xu, W.; John Hewitt, A. Optimization of variables for maximizing efficacy and efficiency in aerial spray application to cotton using unmanned aerial systems. Int. J. Agric. Biol. Eng. 2019, 12, 10–17. [Google Scholar] [CrossRef]
- Lv, M.; Xiao, S.; Yu, T.; He, Y. Influence of UAV flight speed on droplet deposition characteristics with the application of infrared thermal imaging. Int. J. Agric. Biol. Eng. 2019, 12, 10–17. [Google Scholar] [CrossRef] [Green Version]
- Abd Kharim, M.N.; Wayayok, A.; Mohamed Shariff, A.R.; Abdullah, A.F.; Husin, E.M. Droplet deposition density of organic liquid fertilizer at low altitude UAV aerial spraying in rice cultivation. Comput. Electron. Agric. 2019, 167, 105045. [Google Scholar] [CrossRef]
- Zhang, P.; Deng, L.; Lyu, Q.; He, S.L.; Yi, S.L.; Liu, Y.D.; Yu, Y.G.; Pan, H.Y. Effects of citrus tree shape and spraying height of small unmanned aerial vehicle on droplet distribution. Int. J. Agric. Biol. Eng. 2016, 9, 45–52. [Google Scholar] [CrossRef]
- Wang, S.; Li, X.; Zeng, A.; Song, J.; Xu, T.; Lv, X.; He, X. Effects of Adjuvants on Spraying Characteristics and Control Efficacy in Unmanned Aerial Application. Agriculture 2022, 12, 138. [Google Scholar] [CrossRef]
- Ahmed, S.; Xin, H.; Faheem, M.; Qiu, B. Stability Analysis of a Sprayer UAV with a Liquid Tank with Different Outer Shapes and Inner Structures. Agriculture 2022, 12, 379. [Google Scholar] [CrossRef]
- Ahmed, S.; Qiu, B.; Ahmad, F.; Kong, C.-W.; Xin, H. A State-of-the-Art Analysis of Obstacle Avoidance Methods from the Perspective of an Agricultural Sprayer UAV’s Operation Scenario. Agronomy 2021, 11, 1069. [Google Scholar] [CrossRef]
- Qin, W.-C.; Qiu, B.-J.; Xue, X.-Y.; Chen, C.; Xu, Z.-F.; Zhou, Q.-Q. Droplet deposition and control effect of insecticides sprayed with an unmanned aerial vehicle against plant hoppers. Crop Prot. 2016, 85, 79–88. [Google Scholar] [CrossRef]
- Ahmad, F.; Qiu, B.; Dong, X.; Ma, J.; Huang, X.; Ahmed, S.; Ali Chandio, F. Effect of operational parameters of UAV sprayer on spray deposition pattern in target and off-target zones during outer field weed control application. Comput. Electron. Agric. 2020, 172, 105350. [Google Scholar] [CrossRef]
- Teske, M.E.; Wachspress, D.A.; Thistle, H.W. Prediction of Aerial Spray Release from UAVs. Trans. Asabe 2018, 61, 909–918. [Google Scholar] [CrossRef] [Green Version]
- Sunada, S.; Tanaka, K.; Kawashima, K. Maximization of thrust-torque ratio of a coaxial rotor. J. Aircr. 2005, 42, 570–572. [Google Scholar] [CrossRef]
- Martin, D.; Singh, V.; Latheef, M.A.; Bagavathiannan, M. Spray Deposition on Weeds (Palmer Amaranth and Morningglory) from a Remotely Piloted Aerial Application System and Backpack Sprayer. Drones 2020, 4, 59. [Google Scholar] [CrossRef]
- Astaoui, G.; Dadaiss, J.E.; Sebari, I.; Benmansour, S.; Mohamed, E. Mapping Wheat Dry Matter and Nitrogen Content Dynamics and Estimation of Wheat Yield Using UAV Multispectral Imagery Machine Learning and a Variety-Based Approach: Case Study of Morocco. AgriEngineering 2021, 3, 29–49. [Google Scholar] [CrossRef]
- Lou, Z.X.; Xin, F.; Han, X.Q.; Lan, Y.B.; Duan, T.Z.; Fu, W. Effect of unmanned aerial vehicle flight height on droplet distribution, drift and control of cotton aphids and spider mites. Agronomy 2018, 8, 187. [Google Scholar] [CrossRef] [Green Version]
- Xiao, Q.; Xin, F.; Lou, Z.; Zhou, T.; Wang, G.; Han, X.; Lan, Y.; Fu, W. Effect of Aviation Spray Adjuvants on Defoliant Droplet Deposition and Cotton Defoliation Efficacy Sprayed by Unmanned Aerial Vehicles. Agronomy 2019, 9, 217. [Google Scholar] [CrossRef] [Green Version]
- He, X.; Bonds, J.; Herbst, A.; Langenakens, J. Recent development of unmanned aerial vehicle for plant protection in East Asia. Int. J. Agric. Biol. Eng. 2017, 10, 18–30. [Google Scholar] [CrossRef]
- Wang, S.L.; Song, J.L.; He, X.K.; Song, L.; Wang, X.N.; Wang, C.L.; Wang, Z.C.; Ling, Y. Performances evaluation of four typical unmanned aerial vehicles used for pesticide application in China. Int. J. Agric. Biol. Eng. 2017, 10, 22–31. [Google Scholar]
- Wang, C.; He, X.; Wang, X.; Wang, Z.; Wang, S.; Li, L.; Bonds, J.; Herbst, A.; Wang, Z. Testing method and distribution characteristics of spatial pesticide spraying deposition quality balance for unmanned aerial vehicle. Int. J. Agric. Biol. Eng. 2018, 11, 18–26. [Google Scholar] [CrossRef] [Green Version]
- Xue, X.Y.; Tu, K.; Qin, W.C.; Lan, Y.B.; Zhang, H.H. Drift and deposition of ultra-low altitude and low volume application in paddy field. Int. J. Agric. Biol. Eng. 2014, 7, 23–28. [Google Scholar] [CrossRef]
- Yang, F.; Xue, X.; Cai, C.; Sun, Z.; Zhou, Q. Numerical simulation and analysis on spray driftmovement of multirotor plant protection unmannedaerial vehicl. Energies 2018, 11, 2399. [Google Scholar] [CrossRef] [Green Version]
- Zhang, B.; Tang, Q.; Chen, L.-P.; Zhang, R.-R.; Xu, M. Numerical simulation of spray drift and deposition from a crop spraying aircraft using a CFD approach. Biosyst. Eng. 2018, 166, 184–199. [Google Scholar] [CrossRef]
- Zhang, S.; Xue, X.; Sun, Z.; Zhou, L.; Jin, Y. Downwash distribution of single-rotor unmanned agricultural helicopter on hovering state. Int. J. Agric. Biol. Eng. 2017, 10, 14–24. [Google Scholar] [CrossRef] [Green Version]
- Gregorio, E.; Rosell-Polo, J.R.; Sanz, R.; Rocadenbosch, F.; Solanelles, F.; Garcerá, C.; Chueca, P.; Arnó, J.; del Moral, I.; Masip, J.; et al. LIDAR as an alternative to passive collectors to measure pesticide spray drift. Atmos. Environ. 2014, 82, 83–93. [Google Scholar] [CrossRef] [Green Version]
- Butler Ellis, M.C.; Alanis, R.; Lane, A.G.; Tuck, C.R.; Nuyttens, D.; van de Zande, J.C. Wind tunnel measurements and model predictions for estimating spray drift reduction under field conditions. Biosyst. Eng. 2017, 154, 25–34. [Google Scholar] [CrossRef]
- Balsari, P.; Gil, E.; Marucco, P.; van de Zande, J.C.; Nuyttens, D.; Herbst, A.; Gallart, M. Field-crop-sprayer potential drift measured using test bench: Effects of boom height and nozzle type. Biosyst. Eng. 2017, 154, 3–13. [Google Scholar] [CrossRef] [Green Version]
- Wen, Y.; Zhang, R.; Chen, L.; Huang, Y.; Yi, T.; Xu, G.; Li, L.; Hewitt, A.J. A new spray deposition pattern measurement system based on spectral analysis of a fluorescent tracer. Comput. Electron. Agric. 2019, 160, 14–22. [Google Scholar] [CrossRef]
- Munjanja, B.K.; Naudé, Y.; Forbes, P.B.C. A review of sampling approaches to off-target pesticide deposition. Trends Environ. Anal. Chem. 2020, 25, e00075. [Google Scholar] [CrossRef]
- Cunha, M.; Carvalho, C.; Marcal, A.R.S. Assessing the ability of image processing software to analyse spray quality on water-sensitive papers used as artificial targets. Biosyst. Eng. 2012, 111, 11–23. [Google Scholar] [CrossRef] [Green Version]
- Donkersley, P.; Nuyttens, D. A meta analysis of spray drift sampling. Crop Prot. 2011, 30, 931–936. [Google Scholar] [CrossRef]
- Zwertvaegher, I.; Verhaeghe, M.; Brusselman, E.; Verboven, P.; Lebeau, F.; Massinon, M.; Nicolaï, B.; Nuyttens, D. The impact and retention of spray droplets on a horizontal hydrophobic surface. Biosyst. Eng. 2014, 126, 82–91. [Google Scholar] [CrossRef] [Green Version]
- Carlsen, S.C.K.; Spliid, N.H.; Svensmark, B. Drift of 10 herbicides after tractor spray application. 1. Secondary drift (evaporation). Chemosphere 2006, 64, 787–794. [Google Scholar] [CrossRef]
- Shi, Q.; Mao, H.; Guan, X. Numerical Simulation and Experimental Verification of the Deposition Concentration of an Unmanned Aerial Vehicle. Appl. Eng. Agric. 2019, 35, 367–376. [Google Scholar] [CrossRef]
- Caldwell, B.C.; Wolf, T. Measurement of long-distance particle drift using a fluorescent tracer- samplers, sensitivity, detection limits, and background. Asp. Appl. Biol. 2006, 77, 371–378. [Google Scholar]
- Ravier, I.; Haouisee, E.; Clément, M.; Seux, R.; Briand, O. Field experiments for the evaluation of pesticide spray-drift on arable crops. Pest Manag. Sci. 2005, 61, 728–736. [Google Scholar] [CrossRef]
- Al Heidary, M.; Douzals, J.P.; Sinfort, C.; Vallet, A. Influence of spray characteristics on potential spray drift of field crop sprayers: A literature review. Crop Prot. 2014, 63, 120–130. [Google Scholar] [CrossRef]
- Celen, I. The effect of spray mix adjuvants on spray drift. Bulg. J. Agric. Sci. 2010, 16, 105–110. [Google Scholar]
- Dekeyser, D.; Foqué, D.; Duga, A.T.; Verboven, P.; Hendrickx, N.; Nuyttens, D. Spray deposition assessment using different application techniques in artificial orchard trees. Crop Prot. 2014, 64, 187–197. [Google Scholar] [CrossRef]
- Zhu, H.; Salyani, M.; Fox, R.D. A portable scanning system for evaluation of spray deposit distribution. Comput. Electron. Agric. 2011, 76, 38–43. [Google Scholar] [CrossRef]
- Cerruto, E.; Failla, S.; Longo, D.; Manetto, G. Simulation of water sensitive papers for spray analysis. AgricEngInt CIGR J. 2016, 18, 22–29. [Google Scholar]
- Cerruto, E.; Manetto, G.; Longo, D.; Failla, S.; Papa, R. A model to estimate the spray deposit by simulated water sensitive papers. Crop Prot. 2019, 124, 104861. [Google Scholar] [CrossRef]
- Brandoli, B.; Spadon, G.; Esau, T.; Hennessy, P.; Carvalho, A.C.P.L.; Amer-Yahia, S.; Rodrigues, J.F., Jr. DropLeaf: A precision farming smartphone tool for real-time quantification of pesticide application coverage. Comput. Electron. Agric. 2021, 180, 105906. [Google Scholar] [CrossRef]
- Cunha, J.P.A.R.; Farnese, A.C.; Olivet, J.J. Computer Programs for Analysis of Droplets sprayed on water Senstive Papers. Planta Daninha 2013, 31, 715–720. [Google Scholar] [CrossRef] [Green Version]
- Hoffmann, W.C.; Hewitt, A.J. Comparasion of three imaging systems for water senstive papers. Appl. Eng. Agric. 2005, 21, 961–964. [Google Scholar] [CrossRef]
- Arvidsson, T.; Bergstrom, L.; Kreuger, J. Spray drift as influenced by meteorological and technical factors. Pest Manag. Sci. 2011, 67, 586–598. [Google Scholar] [CrossRef]
Publisher’s Note: MDPI stays neutral with regard to jurisdictional claims in published maps and institutional affiliations. |
© 2022 by the authors. Licensee MDPI, Basel, Switzerland. This article is an open access article distributed under the terms and conditions of the Creative Commons Attribution (CC BY) license (https://creativecommons.org/licenses/by/4.0/).