Abstract
The present study explored the effects of sodium benzoate (SB), relocation, and storage time on the quality of sugarcane silage. The experiments followed a completely randomized design with a 2 × 4 × 2 factorial arrangement and four replicates. The treatments were as follows: (i) with (SB+) or without (SB−) SB (2 g∙kg−1 on a fresh matter basis); (ii) with (R) or without (R0) relocation for 12, 48, and 72 h (R12, R48, and R72, respectively); and (iii) storage for 10 or 60 days after relocation. SB− silage showed a lower (p < 0.05) dry matter loss (DML = 155 g·kg−1) without relocation (R0). SB+ silage showed the highest (p < 0.05) DML (257 g·kg−1) with R72. SB use reduced (p < 0.05) the yeast count in silage that was stored for 10 days (SB+: 4.63 CFU·g−1; SB−: 5.58 CFU·g−1). The yeast count was higher (p < 0.05) in silage that was stored for 10 days after relocation, regardless of the relocation time. SB use increased the aerobic stability of silage after 10 days of storage. Thus, SB application is effective for the inhibition of yeast in relocated sugarcane silage. We recommend the use of SB when silage is relocated for 12 h and stored for 60 days after relocation.
1. Introduction
Silage relocation involves unloading silage and moving it to a new silo, where it is packed and re-sealed [1]. This is a common practice among farmers because of an underestimation of forage demand, field losses due to climate, pests or diseases, a shortage of area for crop cultivation, a lack of machinery for silage production, a long distance from the silo to the feed barn or a need to feed animals during exposition and long-distance transportation [1,2,3,4]. In addition, these reasons render silage sales a commercial strategy for farmers with extra product and for those who specialize in silage production for commercialization.
The effects of relocation on the preservation quality of corn [1,3,5], sorghum [2,4], and wheat [1] silage have been explored previously [2]. It has been found that silage relocation (up to 48 h) increases dry matter (DM) content [1,3], effluent loss (EL) [2,3,4], and acetic [2,3] and propionic acid concentrations [2,3,4] but decreases in vitro DM digestibility (IVDMD) [2,3].
Most previous studies on silage relocation have focused on corn, sorghum, and temperate grasses because these crops are more susceptible to aerobic deterioration. However, sugarcane (Saccharum officinarum) silage can also undergo significant changes during relocation because of its high concentration of residual water-soluble carbohydrates (WSCs), which vary from 16.5 to 90.5 [6]. During fermentation, yeasts metabolize WSCs into ethanol under acidic conditions, thereby increasing DM loss and decreasing nutritive value [7]. Consequently, sugarcane silage can rapidly spoil upon exposure to air because of its high concentration of WSCs following fermentation and its large amount of yeasts. The aerobic stability (AS) of sugarcane silage is lower than that of corn silage and can vary from 19 [6] to 70 h [8].
These unique characteristics of sugarcane fermentation compromise silage quality during relocation. In this context, the use of microbial and chemical additives is a suitable option for minimizing the adverse effects of aerobic deterioration. Chemical additives, such as sodium benzoate (SB), are used to inhibit yeast growth [9,10]. Their antifungal properties are due to lower pH values. These organic acids, when in undissociated form, have the potential to act on multiple species and may interfere with different metabolic pathways within the same species, thereby increasing their overall inhibitory effects [11,12]. The effectiveness of SB is also dependent on the quantify that is applied. Studies using 2 g·kg−1 have shown some positive effects of this additive on the improvement of dry matter recovery and the increase in the aerobic stability of silage [13,14]. However, whether these chemical additives remain effective after relocation and how long their effects last, which may depend on the relocation and storage time of the relocated silage, remain unknown.
Thus, we hypothesized that relocation affects the fermentative quality, AS, and chemical composition of sugarcane silage and that SB can mitigate the effects of air exposure during relocation and after the silo is reopened. Furthermore, we hypothesized that the storage time after relocation affects the preservation quality of the relocated silage and the effectiveness of SB. To this end, the objective of the present study was to evaluate the effects of SB application, relocation, and storage time on the preservation quality of sugarcane silage.
2. Materials and Methods
2.1. Experimental Design and Ensiling Conditions
The experiment followed a completely randomized design with a 2 × 4 × 2 factorial arrangement and four replicates. The following treatments were included: (i) with (SB+) or without (SB−) SB (2 g·kg−1 on a fresh matter basis); (ii) with (R) or without (R0) relocation for 12, 48, and 72 h (R12, R48, and R72, respectively); and (iii) storage times (ST*) of 10 (short) or 60 days (long) after relocation. Note that in non-relocated silage, the total storage time was 130 (10 days of ST treatment) or 180 (60 days of ST treatment) days. The timelines of the storage and relocation combinations are illustrated in Figure 1. For each treatment described in Figure 1, the presence or absence of the additive is denoted by the prefixes “SB+” or “SB−”, respectively.
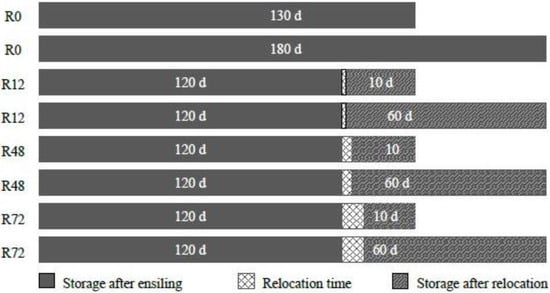
Figure 1.
Timelines for sugarcane silage without (R0) or with relocation for 12 (R12), 24 (R24) or 72 h (R72) that is stored for a total of 130 or 180 days.
Sugarcane with approximately 12 months of regrowth (Table 1) was harvested and chopped at a theoretical cut length of 1–2 cm using a conventional harvester (JF C120®, JF, Itapira, Brazil). The degree Brix was determined from the juice that was extracted by grinding the sugarcane. Samples that were randomly taken from 10 whole plants were ground separately. The juice of the samples was used to determining the degree Brix using a field refractometer (ATAGO N-1a model) and later, a general average of the degree Brix of the plant was used. To assess the chemical composition and epiphytic microbiota of the sugarcane, fresh samples (n = 4) were collected immediately after harvesting. Then, they were taken to the laboratory for chemical and microbiological analysis.

Table 1.
The characterization of the sugarcane samples and silage at the first opening and after exposure during relocation without (SB−) or with sodium benzoate (SB+; 2 g·kg−1 on a fresh matter basis).
Next, the ensiling was conducted by replicate and the treatments were applied to forage piles for each experimental unit. SB was diluted in distilled water (135 g L−1, w/v) and mixed with the sugarcane for the treatment with the additive. Following homogenization, the forage was ensiled in PVC buckets with a capacity of 15.7 L (radius = 14 cm and height = 25.5 cm) and a packing density of 476 ± 35 kg·m−³ (fresh matter basis). Extra buckets without (n = 5) and with SB (n = 5; 2 g·kg−1 on a fresh matter basis) were used to replace the silage that was removed from the buckets in the first test of AS. The buckets were stored in covered barns.
For the relocation treatments, the silos were opened (after 120 days of storage) and re-ensiled. The silos were opened in a shed and the material was removed and re-ensiled into the original silo after 12, 48 or 72 h (R) of air exposure. The silos were opened 10 or 60 days after relocation, totaling 130 and 180 days of storage in R0 treatments, respectively (Figure 1). Samples were collected before ensiling, at the first silo opening, after the exposure time during relocation, at the opening of the relocated and non-relocated silage, and during aerobic exposure for evaluation and laboratory analysis.
2.2. Evaluation and Analysis
2.2.1. Silage Microbiology and Fermentation
The concentrations of lactic acid bacteria (LAB), yeasts, and molds were analyzed in all collected samples. Aqueous extracts (1:10) of samples (25 g) were prepared with the addition of sterile peptone water (0.1%, w/v), followed by homogenization for 3 min in a sterile bag. To determine the microbial counts, 10-fold serial dilutions (five per sample) of the extract were pour-plated on a De Man, Rogosa, and Sharpe (MRS) agar with nystatin (4 mL L−1) for LAB and on a potato dextrose agar (Sigma-Aldrich, Brazil, LTDA) with 10% (v/v) tartaric acid (15 mL L−1) for yeasts and molds. They were then incubated at 35 °C for 48 h (LAB) or at 28 °C for 72 h (yeasts) and 120 h (molds). The yeast and mold colonies were counted separately. The yeasts were distinguished from the molds based on colony appearance and cell morphology. The pH of each sample was determined using a digital potentiometer (T-1000®, Tekna, São Bernardo do Campo, Brazil) in the same aqueous extract. Next, 2 mL of the aqueous extract was acidified with 10 μL of 50% (v/v) H2SO4 and frozen prior to high-performance liquid chromatography (HPLC). HPLC was used to determine the lactic, acetic, propionic, and butyric acid contents of the aqueous extracts. The apparatus (Shimadzu Corp., Tokyo, Japan) was equipped with a dual-detection system, comprising an ultraviolet detector (UV-Vis SPD-10Ai) and a refractive index detector (RID 10A). A Shimadzu ion-exclusion column (Shim-pack SCR-101H; 79 mm × 30 cm) operating at 50 °C was used for the chromatographic separation of the acids. The acids were detected based on UV absorbance (210 nm).
2.2.2. DML and EL
Sand (3 kg) was placed at the bottom of the experimental silos, along with a non-woven fabric (TNT®) to separate the forage and determine effluent production. The silos were weighed before the experiment to determine the amount of effluent that was produced by the silage based on the weight difference at the end of the experiment. At each opening and before relocation, the weight of the silos was recorded to determine the loss of DM and effluents. The EL and DML values were obtained using the equations that have been described previously [15,16].
2.2.3. AS
AS tests were performed at two time points: at the first and second openings of the silos. At the first opening, only the effects of SB were evaluated. Five silos without additives and five silos with SB were randomly selected from the treatment (n = 10) and the silage that was removed for the stability test was replaced with the extra silage buckets. After relocation, the second test was performed after 10 and 60 days of storage on all treatments and replicates (n = 64).
For AS evaluation, the silage samples (1.5 kg) were weighed in each bucket, totaling two buckets per experimental unit: one for temperature analysis and another for sample removal to analyze pH and microbiology. The buckets were maintained in an air-conditioned room at 21 ± 1.6 °C for 7 days and then the room and silage temperatures were recorded every 4 h using a thermometer (MV-363, Minipa, São Paulo, Brazil). AS was defined as the duration in hours that was required for the silage temperature to reach 2 °C above room temperature [17]. For the pH and microbial analyses, samples were obtained at 0, 48, 96, and 168 h during the AS tests of the sugarcane silage.
2.2.4. Chemical Composition
The samples were dried in a forced circulation oven for 72 h and ground in a Willey mill with a 1-mm sieve to determine DM (method 950.15, AOAC, 2000 [18]), ash (method 942.05, AOAC, 2000 [18]), and crude protein (CP) (Kjeldahl method, N × 6.25; method 984.13, AOAC, 2000 [18]). The neutral detergent fiber (NDF) was determined according to the methodology that has been described previously [19], but without the use of α-amylase and sodium sulfite.
2.3. Statistical Analysis
The data on the chemical composition, epiphytic microbiota, and degree Brix of the sugarcane were not statistically analyzed. The microbial count data were log10-transformed for the statistical analysis. For the statistical analysis of DML, EL, AS, pH, microbiology, and chemical composition, a 2 × 4 × 2 factorial arrangement was used with the MIXED procedure in SAS (version 9.0, SAS Inst. Inc., Cary, NC, USA), considering additive application (SB), relocation time (R), storage time (ST), and their interactions (SB × R, SB × ST, R × ST, and SB × R × ST) as the fixed effects and experimental error as the random effect.
For the pH and microbiology evaluation during the AS tests, two statistical analyses were performed separately: one for silage that was stored for 10 days and another for silage that was stored for 60 days. The variables were analyzed in a 2 × 4 factorial arrangement with repeated measures of time (0, 48, 96, and 168 h) using the MIXED procedure in SAS (version 9.0, SAS Inst. Inc.), considering additive application (SB), relocation time (R), aerobic exposure (AE), and their interactions (SB × R, SB × AE, R × AE, and SB× R × AE) as the fixed effects and experimental error as the random effect.
For all evaluated statistical models, the slice option was used for significant interactions and the means were compared using Tukey’s test. An α = 0.05 was adopted.
3. Results
3.1. Fresh and Ensiled Sugarcane
Table 1 presents the results of the characterization of the sugarcane samples before ensiling and the sugarcane silage after the first opening and relocation.
3.2. Relocated Sugarcane Silage
SB+ increased pH but decreased lactic acid, acetic acid, and NDF contents. R12 and R48 showed greater EL values than R0 and R72 (p < 0.05) (Table 2). Longer storage times after relocation increased the EL and NDF contents of the sugarcane silage.
Table 2.
The effects of sodium benzoate application (at 2 g∙kg−1 on a fresh matter basis), relocation time, storage time, and their interactions on the chemical composition, fermentative losses, microbiology, and aerobic stability of sugarcane silage.
The additive (SB) × relocation time ® interaction affected the propionic acid content, DML, DM content, and CP concentration (p < 0.05) (Table 3). SB+ silage showed a higher propionic acid concentration in R0 treatment than in R12 and R48 (Table 3).
Table 3.
The effects of the additive application and relocation time interaction (SB × R) on sugarcane silage.
SB− silage showed lower (p < 0.05) DML values when it was not relocated (R0) than when it was relocated for 48 h. In SB+ silage, the highest (p < 0.05) DML was in the R12 and R72 treatments. When relocated for 48 h, SB+ silage had lower (p < 0.05) DML values.
In the R0 and R72 treatments, SB+ silage showed a lower (p < 0.05) CP concentration than SB− silage.
The additive (SB) × storage time (ST) interaction affected the yeast and LAB counts, as well as the concentrations of DM and CP. Both SB− and SB+ silage that was stored for 60 days showed (p < 0.05) higher LAB counts than that stored for 10 days (Table 4). SB+ silage that was stored for 10 days showed the lowest LAB count (p < 0.05). SB application reduced (p < 0.05) the yeast count in sugarcane silage that was stored for 10 days but showed no difference after storage for 60 days.
Table 4.
The effects of the additive application and storage time interaction (SB × ST) on sugarcane silage.
The DM content of SB− silage decreased (p < 0.05) with an increase in ST from 10 to 60 days. Similarly, the CP concentration of SB− silage decreased (p < 0.05) with an increase in ST from 10 to 60 days. SB− silage that was stored for 10 or 60 days showed (p < 0.05) higher CP concentrations than SB+ silage.
The relocation time (R) × storage time (ST) interaction (R × ST) affected the yeast and LAB counts (Table 5), as well as the concentrations of DM, CP, and lactic acid. R0 silage that was stored for 10 days showed the lowest LAB counts (p < 0.05). The LAB counts increased with an increase in ST (p < 0.05) from 10 to 60 days. There were no differences (p < 0.05) observed for relocated silage that was stored for 60 days. The yeast count was higher (p < 0.05) in silage that was stored for 10 days after relocation, regardless of the relocation time.
Table 5.
The effects of the relocation time and storage time interaction (R × ST) on sugarcane silage.
When stored for 10 days, the R48 silage showed the lowest lactic acid concentration. When stored for 60 days, the R0 and R72 silage showed lower lactic acid concentrations (p < 0.05). The R0 silage that was stored for 60 days showed a lower DM content than that stored for 10 days. The DM content of relocated silage did not change (p < 0.05) with storage time. The relocated silage showed the highest DM contents (p < 0.05), regardless of ST. The CP content was reduced (p < 0.05) in R72 silage that was stored for 60 days.
The three-way additive application, relocation time, and storage time interaction (SB × R × ST) affected the AS of the silage (p < 0.05) (Figure 2). The R0 silage that was stored for 60 days (180 days in total) showed (p < 0.05) a higher AS than that stored for 10 days (130 days in total), regardless of the additive application. The R12 and R48 silage showed lower AS (p < 0.05) than the R0 silage. The R72 silage without additive application that was stored for 10 days showed the lowest AS (p < 0.05).
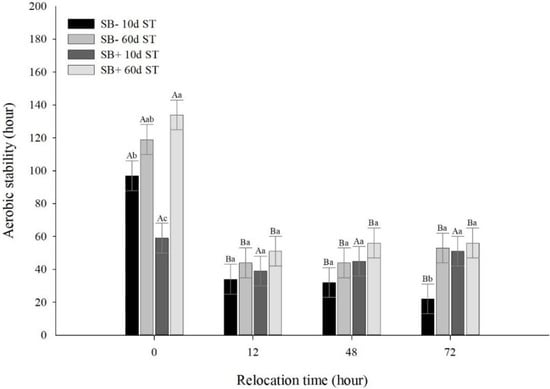
Figure 2.
The effects of the additive application (SB) × relocation time (R) × storage time (ST) interaction (SB × R × ST) on the aerobic stability (AS) of sugarcane silage. SB−, without additive; SB+, with sodium benzoate at 2 g∙kg−1 on a fresh matter basis. Means followed by lowercase letters differ from each other within each relocation time according to Tukey’s test (p > 0.05). Means followed by uppercase letters differ between relocation times according to Tukey’s test (p > 0.05).
SB application increased (p < 0.05) the AS of the R0 silage that was stored for 60 days, although it did not affect the AS of the R12 or R48 silage. The R72 silage with SB application that was stored for 10 days showed higher AS, although the additive application did not affect the AS of silage that was stored for 60 days.
3.3. Effects of Aerobic Exposure on Relocated Sugarcane Silage
Aerobic exposure during the AS test affected (p < 0.05) the amount of mold in silage that was stored for 60 days. The SB × AE interaction affected the yeast count in silage that was stored for 60 days. In addition, the R × AE interaction affected (p < 0.05) the mold count in silage that was stored for 10 days and the yeast count in silage that was stored for 60 days (Table 6). There was an effect (p < 0.05) of the additive (SB), relocation time, and aerobic exposure (A × R × AE) interaction on the pH of silage that was stored for 10 or 60 days and the yeast count of silage that was stored for 10 days.
Table 6.
The effects of sodium benzoate application (at 2 g·kg−1 on a fresh matter basis), relocation time, aerobic exposure, and their interactions on the pH and microbiology of sugarcane silage that was stored for 10 or 60 days.
The SB × AE interaction (Table 7) affected the yeast count in the silage. As such, in silage that was stored for 60 days, the yeast count increased with an increase in AE duration, regardless of the additive application. However, the yeast count in SB+ silage was lower than that in SB− silage with an AE of 96 and 168 h.
Table 7.
The effects of the additive application and aerobic exposure time interaction (SB × AE) on yeast count (cfu∙g−1) in sugarcane silage.
The R × AE interaction affected the microbial counts in silage (Table 8). The silage without aerobic exposure that was stored for 10 days showed the lowest mold counts (p < 0.05). Following 96 h of aerobic exposure, the R0 silage showed elevated (p < 0.05) mold counts. The R0 and R12 silage that was exposed for 168 h showed the highest mold counts (p < 0.05) (Table 8).
Table 8.
The effects of the relocation time and aerobic exposure time interaction (R × AE) on the mold and yeast counts (cfu∙g−1) in sugarcane silage.
In silage that was stored for 60 days (Table 8), the yeast count increased (p < 0.05) with an increase in relocation time and aerobic exposure time. All unexposed silage showed lower yeast counts (p < 0.05) (3.00 cfu∙g−1), while the R72 silage showed the highest yeast count (p < 0.05) (4.30 cfu∙g−1). Following 96 and 168 h of EA, the R0 silage showed the lowest yeast count (p < 0.05).
The SB × R × AE interaction affected the pH of silage that was stored for 10 days. Unexposed SB− silage showed a pH of ~4.0 (p < 0.05), regardless of relocation time (Figure 3). After 48 h of aerobic exposure, the pH of the SB− and R0 silage increased (p < 0.05). After 96 h of aerobic exposure, the pH of the relocated SB− silage increased (p < 0.05), while the R0 silage showed the lowest pH value. After 168 h of aerobic exposure, the SB− and R0 silage showed the lowest pH value at 5.28 (p < 0.05), whereas the pH of the other silage approached 7.0.
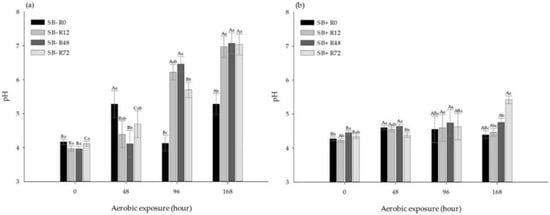
Figure 3.
(a) The effects of the additive application (SB) × relocation time × aerobic exposure time (SB × R × AE) interaction on the pH of sugarcane silage that was stored for 10 days: SB−, without additive; (b) the effects of the additive application (SB) × relocation time × aerobic exposure time (SB × R × AE) interaction on the pH of sugarcane silage that was stored for 10 days: SB+, with additive (sodium benzoate at 2 g∙kg−1 on a fresh matter basis). Means followed by lowercase letters differ from each other within each aerobic exposure time according to Tukey’s test (p > 0.05). Means followed by uppercase letters differ between aerobic exposure times according to Tukey’s test (p > 0.05).
There were no differences (p > 0.05) in the pH values of SB+ silage up to 96 h of AE and 10 days of storage, regardless of the relocation time (Figure 3). After 168 h of AE (p < 0.05), the pH of the SB+ silage that was relocated for 12 and 72 h increased, but that of the R0 and R48 silage decreased. However, the maximum pH of both SB− and SB + silage remained below 6.0 (p < 0.05).
The unexposed SB− and R72 silage showed the highest (p < 0.05) yeast counts (Figure 4). The R0 and SB− silage showed reduced (p < 0.05) yeast counts compared to the other silage when exposed for 48 or 96 h. All silage showed yeast counts of ~9.00 cfu·g−1 (p < 0.05) when stored for 10 days and exposed for 168 h, regardless of the relocation time. The yeast counts in both non-relocated and relocated SB− silage increased with an increase in aerobic exposure time (from 5.00 to 9.00 cfu∙g−1). However, the magnitude of the increase was smaller in non-relocated silage than for relocated silage after 96 h of AE.
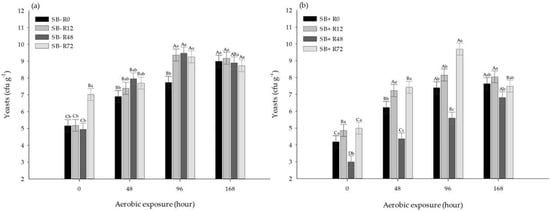
Figure 4.
(a) The effects of the additive application (SB), relocation time, and aerobic exposure time interaction (SB × R × AE) on the yeast count in sugarcane silage that was stored for 10 days: SB−, without additive; (b) the effects of the additive application (SB), relocation time, and aerobic exposure time interaction (SB × R × AE) on the yeast count in sugarcane silage that was stored for 10 days: SB+, with sodium benzoate (at 2 g·kg−1 on a fresh matter basis). Means followed by lowercase letters differ from each other within each aerobic exposure time according to Tukey’s test (p > 0.05). Means followed by uppercase letters differ between aerobic exposure times according to Tukey’s test (p > 0.05).
The SB+ silage that was relocated for 48 h and stored for 10 days showed (p < 0.05) reduced yeast counts for all AE times (Figure 4). The R0, R12, and R72 silage with SB showed similar counts except when exposed for 96 h, in which case the R72 silage showed a higher yeast count (p < 0.05). In both non-relocated and relocated silage without additive application, the yeast count increased with an increase in the aerobic exposure time; however, their magnitude of increase was smaller except for the R72 silage, in which case the trend was similar to that of SB− silage.
The pH of the SB− silage that was stored for 60 days remained unaffected (at 4.3), regardless of the relocation time (p > 0.05) (Figure 5). After 48 h of EA, the R12 silage showed a higher pH (p < 0.05) than the other silage. After 96 and 168 h of AE, only the R0 silage showed a lower pH (p < 0.05), while the pH values of the other silage exceeded 7.0.
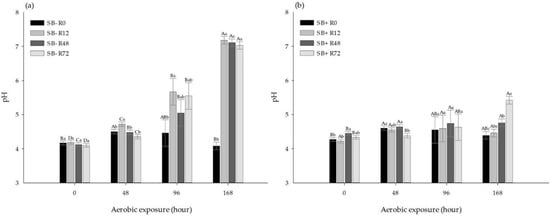
Figure 5.
(a) The effects of the additive application (SB) × relocation time × aerobic exposure time interaction (A × R × AE) on the pH of sugarcane silage that was stored for 60 days: SB−, without additive; (b) the effects of the additive application (SB) × relocation time × aerobic exposure time interaction (A × R × AE) on the pH of sugarcane silage that was stored for 60 days: SB+, with additive (sodium benzoate at 2 g·kg−1 on a fresh matter basis). Means followed by lowercase letters differ from each other within each aerobic exposure time according to Tukey’s test (p > 0.05). Means followed by uppercase letters differ between aerobic exposure times according to Tukey’s test (p > 0.05).
The unexposed SB+ silage that was relocated for 48 h showed a higher pH (p < 0.05) (Figure 5) than the other silage. After 48 h of AE, the R72 silage showed a lower pH value. After 96 h of AE, all silage showed similar pH values. However, after 168 h of AE, the R72 silage showed a higher pH value (5.42), followed by the R48 (4.76) and R12 silage. The R0 silage showed lower pH values after both 96 h (4.38) and 168 h (4.46) of AE.
4. Discussion
4.1. Relocated Sugarcane Silage
4.1.1. Microbiology and Fermentation
SB application reduces bacterial populations [20]. This result was confirmed by the low concentration of acetic acid in SB+ silage. After storage for 60 days, the LAB populations in the SB+ silage increased. This could be because at 60 days of storage, the yeast count in the silage was significantly reduced, thereby alleviating the competition among these microorganisms for substrate. Furthermore, relocation increased the LAB populations in silage, regardless of the storage time. Different species of bacteria, possibly the heterofermentative bacteria that produce acetic acid, may be the first to develop (with yeasts) when silage is exposed to air [21]. This could explain the increase in acetic acid concentration in silage that was relocated for 48 and 72 h.
The reduction in the yeast count of SB+ silage that was stored for 10 days was linked to the potential inhibition of these microorganisms by the additive. The non-dissociated form of this salt passes through yeast and mold membranes and releases protons into cytoplasm, acidifying their intracellular environments and inducing an inhibitory effect [22]. In a previous study, Zhang et al. [23] observed a reduction in yeast population following SB (0.1% NM) addition to Leymus chinensis silage. After 60 days of storage, the yeast populations in the silage both without and with sodium benzoate decreased. This could be due to the production of other acids, such as acetic acid, by heterofermentative bacteria, which can also inhibit yeast and mold growth. However, silage that was relocated for 48 and 72 h and stored for 10 days showed high yeast counts. Yeasts are facultative anaerobic microorganisms that act as the precursors of aerobic deterioration and they possess the potential to grow after exposure to air [24]. Michel et al. [2] and Dos Anjos et al. [4] exposed sorghum silage to 12 and 24 h of relocation but observed no increase in the population of yeasts. This finding corroborates the results of the present study, in which the yeast counts did not increase either in the first 12 h. The yeast growth only increased after 48 or 72 h of relocation.
The differences in the pH values of the silage were small (0.1) and could not be attributed to the effects of SB or storage time after relocation. The lactic acid concentrations followed the same trend as the LAB counts in the present study (Table 4).
4.1.2. DML and EL
SB application did not alter effluent production from sugarcane silage. However, the relocation and storage time after relocation affected these losses. Silage that was relocated for 12 and 48 h showed higher ELs (>25 g∙kg−1). Relocated silage produces more effluent because it undergoes compaction two times, which allows the removal of any water that is present within the forage cells and produces greater effluent volumes [2]. In addition, ELs may result from the conversion of substrate into water during the ethanol production of yeast [25]. However, the EL of silage that was stored for 60 days after relocation was approximately 33 g∙kg−1. These losses could have resulted primarily from variations in the rate of effluent accumulation during the second silage period. According to McDonald et al. [25], silage accumulation during the first 90 days of storage is around 0.14 g∙kg−1 per day. Thus, silage that is stored for a longer period after relocation accumulates more effluents. Further, the observed losses can directly affect the DM digestibility of the silage [24].
The non-relocated silage showed lower losses. According to Siqueira et al. [15], the major microorganisms that are responsible for losses during sugarcane fermentation are yeasts, which consume soluble carbohydrates to produce carbon dioxide (CO2) and ethanol, thereby generating DMLs of up to 48% [25]. Therefore, the increase in DML with relocation time could be related to the increase in yeast population, which also increased with relocation time. Chen and Weinberg [1] reported that the quality of corn and wheat silage that was relocated for up to 48 h did not differ. Similarly, in another recent study, the relocation time did not affect the DML of sorghum silage [2].
The increase in DML affects the costs of the sugarcane silage production, thus increasing the cost per unit of the nutrients of the silage and, ultimately, rendering the use of this silage challenging within a competitive market. The lack of an effect of the additive on DML indicated that the additive must be used at the ensiling stage to produce well-preserved silage, considering its effects on AS. Although the additive showed no effects after the second fermentation process, it reduced sugarcane silage losses during storage for 120 days (Table 2). Over time, however, yeasts may develop. According to Lambert and Stratford [26], the effects of the additive are temporary, specifically in sugarcane silage, which contains adequate substrate for sustained yeast growth.
4.1.3. Chemical Composition
The DM content of the relocated silage was higher. According to Chen and Weinberg [1], this increase in DM content is because of silage dehydration upon exposure to air for over 48 h. However, Michel et al. [2] did not observe an increase in the DM content of silage that was relocated for up to 24 h. After 60 days of storage, the silage without additive application showed a lower DM content due to a greater (numerically) DML. Da Silva et al. [27] reported that SB application at 0.2% NM was efficient for promoting fermentation and reducing the DML of corn silage. According to Evangelista et al. [28], the DM content of corn silage decreased from 36% to 22% after 45 days of fermentation. Here, this effect was the most prominent when silage was stored for 60 days after relocation, which allowed an adequate fermentation time in order to observe the effects of the additive. The non-relocated silage that was stored for 60 days showed a lower DM content that that stored for 10 days because the former was stored for a total of 120 days without relocation plus 60 days of storage (totaling 180 days) compared to 130 days (120 days plus 10 days of storage) for the latter. In silage that is stored for longer periods of time, the residual substrates may be completely consumed, which may proportionally modify the DM content [28].
Sugarcane silage contains low protein levels because the protein content of fresh forage changes proportionally with the DM content of silage. The differences in protein content did not follow a biological pattern and these changes were related to the small SEM for this variable (Table 3), which was sensitive to any numerical variations.
The difference in NDF content reflected the overuse of fermentable carbohydrates. As such, in the silage with SB, the growth of yeasts and molds was inhibited and a greater amount of residual soluble carbohydrates was retained in the silage [27]. Thus, NDF increased proportionally with a decrease in the DM content of silage. The silage that was stored for 60 days after relocation showed a greater NDF value with a difference of 1.3 percentage units, which could be explained by the lower DM content (Table 3) and, therefore, a proportionally higher NDF concentration in this silage.
4.1.4. AS
Based on the increase in AS of silage with the additive, Da Silva et al. [27] suggested that SB is effective for increasing the AS and reducing the aerobic deterioration of corn silage. The authors attributed this impact on AS to the direct inhibitory effect of SB on lactate-assimilating yeasts, which are usually the first organisms to initiate aerobic deterioration. During silage opening and air exposure, these organisms become active, thereby increasing the silage temperature [29,30].
In the present study, the silage that was stored for 60 days showed smaller yeast populations and higher acetic acid concentrations. Higher concentrations of this acid increase the AS of silage by acting on the metabolism of the deteriorating microorganisms, particularly yeasts, which are the predictors of deterioration [21,31]. The lower AS of the SB+ silage could be attributed to the excellent fermentation and maintenance of silage substrates with SB application, which preserve the nutritional value of the silage and allow a faster deterioration of mass upon exposure to air. Aerobic deterioration occurs due to the exposure of silage to air, in which case undesirable microorganisms consume residual soluble carbohydrates (or organic acids) to produce heat [24]. All relocated silage, particularly the R12 and R48 silage, showed decreased AS and increased deterioration rates. This is because during relocation, silage is inevitably exposed to air, which allows the growth of yeasts [1], as evidenced by the increased yeast counts in the relocated silage.
4.2. Aerobic Exposure of Relocated Sugarcane Silage
The pH of the sugarcane silage that was stored for 10 days at the time of the second opening of the experimental silos (0 h of aerobic exposure) was ~4.2, which is considered ideal for an adequate fermentation profile. Evangelista et al. [28] observed that silage that was stored for more than 70 days showed an increased buffering capacity, which justified the slow change in the pH values of the silage that was stored for 130 or 180 days without relocation. The application of SB was effective for controlling yeast growth and, consequently, maintaining the pH of the sugarcane silage. Meanwhile, the pH of the silage without SB exceeded 7.0 and the yeast count was above 9.0 cfu∙g−1 within the first 96 h. Lactic acid degradation increases pH, thereby allowing the development of other groups of microorganisms [30,32]. SB is the sodium salt of a weak organic acid that produces a fungistatic effect, resulting in slower rates of yeast growth (prolonged growth phases) at low concentrations [12] and, consequently, lower rates of pH increase. Typically, the growth of molds is strongly affected by the pH of silage, with optimum growth occurring at pH values that exceed 5 [24], which explains the growth of these microorganisms after 48 h of aerobic exposure in the silage without the additive. In the SB+ silage, the yeast growth was significant after 96 h of aerobic exposure.
The SB− silage that was stored for 60 days showed a higher pH value following exposure to air due to the action of the yeasts in its mass. However, this did not occur in the SB+ silage, in which the additive suppressed the activity of the yeasts during storage for 60 days. Prolonged storage periods stabilize yeast counts [28]. Furthermore, the maintenance of the pH of the SB+ silage contributed to the effectiveness of this organic acid additive as an antifungal agent. Overall, the use of SB depended on the pH of the silage and it was the most effective at pH values that were lower than its pKa [12]. These results were inconsistent with previous reports that relocation does not affect the fermentative qualities of silage [1,2,4,5].
5. Conclusions
Relocation and storage times affect the preservation quality of sugarcane silage but do not compromise it and allow it to retain its suitability for transportation to a new silo. However, relocated silage is more prone to aerobic deterioration, which is a concern when relocating sugarcane silage. In this context, the application of SB (at 2 g kg−1 on a fresh matter basis) is effective for the inhibition of yeast growth and for maintaining the pH of relocated sugarcane silage. To achieve an adequate preservation quality of relocated sugarcane silage, we recommend the use of SB at ensiling with a relocation time of 12 h and a storage time of 60 days after relocation.
Author Contributions
Conceptualization, T.C.d.S. and A.C.d.R.; methodology, M.S.S. and A.C.M.d.Q.; software, M.S.S. and J.P.P.R.; validation, T.C.d.S., A.C.d.R. and T.F.B.; formal analysis, M.S.S. and J.P.P.R.; investigation, M.S.S., A.C.M.d.Q. and T.C.d.S.; resources, A.C.d.R., F.N.D. and T.F.B.; data curation, M.S.S. and A.C.M.d.Q.; writing—original draft preparation, M.S.S.; writing—review and editing, A.C.d.R. and T.C.d.S.; visualization, C.F. and F.N.D.; supervision, T.C.d.S.; project administration, A.C.d.R.; funding acquisition, A.C.d.R. All authors have read and agreed to the published version of the manuscript.
Funding
This study was financed in part by the Coordenação de Aperfeiçoamento de Pessoal de Nível Superior—Brasil (CAPES)—Finance Code 001 providing granting scholarships to the first and second authors and supported by the Brazilian research agencie CNPq.
Institutional Review Board Statement
Not applicable.
Data Availability Statement
The data presented in this study are available upon request from the corresponding author.
Acknowledgments
The authors would like to thank the undergraduate and graduate students from the Study Group on Ruminants and Forage in the Amazon (GERFAM) for their technical support.
Conflicts of Interest
The authors declare no conflict of interest.
References
- Chen, Y.; Weinberg, Z.G. The effect of relocation of whole-crop wheat and corn silages on their quality. J. Dairy Sci. 2014, 97, 406–410. [Google Scholar] [CrossRef] [PubMed]
- Michel, P.H.F.; Gonçalves, L.C.; Rodrigues, J.A.S.; Keller, K.M.; Raposo, V.S.; Lima, E.M.; Santos, F.P.C.; Jayme, D.G. Re-ensiling and inoculant application with Lactobacillus plantarum and Propionibacterium acidipropionici on sorghum silages. Grass Forage Sci. 2016, 72, 432–440. [Google Scholar] [CrossRef]
- Coelho, M.M.; Gonçalves, L.C.; Rodrigues, J.A.S.; Keller, K.M.; Dos Anjos, G.V.S.; Ottoni, D.; Michel, P.H.F.; Jayme, D.G. Chemical characteristics, aerobic stability, and microbiological counts in corn silage re-ensiled with bacterial inoculant. Pesqui. Agropecu. Bras. 2018, 53, 1045–1052. [Google Scholar] [CrossRef]
- Dos Anjos, G.V.S.; Gonçalves, L.C.; Rodrigues, J.A.S.; Keller, K.M.; Coelho, M.M.; Michel PH, F.; Ottoni, D.; Jayme, D.G. Effect of re-ensiling on the quality of sorghum silage. J. Dairy Sci. 2018, 101, 6047–6054. [Google Scholar] [CrossRef] [PubMed]
- Lima, E.M.; Gonçalves, L.C.; Keller, K.M.; Rodrigues, J.A.S.; Santos, F.P.C.; Michel, P.H.F.; Raposo, V.S.; Jayme, D.G. Re-ensiling and its effects on chemical composition, in vitro digestibility, and quality of corn silage after different lengths of exposure to air. Can. J. Anim. Sci. 2016, 97, 250–257. [Google Scholar] [CrossRef]
- Rabelo, C.H.S.; Harter, C.J.; Ávila, C.L.S.; Reis, R.A. Meta-analysis of the effects of Lactobacillus plantarum and Lactobacillus buchneri on fermentation, chemical composition, and aerobic stability of sugarcane silage. Grassl. Sci. 2019, 65, 3–12. [Google Scholar] [CrossRef]
- Pedroso, A.F.; Nussio, L.G.; Paziani, S.F.; Loures, D.R.S.; Igarasi, M.S.; Coelho, R.M.; Packer, I.H.; Horri, J.; Gomes, L.H. Fermentation and epiphytic microflora dynamics in sugar cane silage. Sci. Agric. 2005, 62, 427–432. [Google Scholar] [CrossRef]
- Siqueira, G.R.; Reis, R.A.; Schocken-Iturrino Roth, M.T.P. Queima e aditivos químicos e bacterianos na ensilagem de cana-de-açúcar. Rev. Bras. Zootec. 2010, 39, 103–112. [Google Scholar] [CrossRef][Green Version]
- Auerbach, H.; Weiss, K.; Nadeau, E. Benefits of using silage additives. In Proc. 1st Int. Silage Summit; Auerbach, H., Luckstadt, C., Weissbach, F., Eds.; Anytime Publishing Services: Worthington, UK; Leipzig, Germany, 2012; pp. 75–144. [Google Scholar]
- Bernardes, T.F.; Daniel, J.L.P.; Adesogan, A.T.; McAllister, T.A.; Drouin, P.; Nussio, L.G.; Huhtanen, P.; Tremblay, G.F.; Bélanger, G.; Cai, Y. Silage review: Unique challenges of silages made in hot and cold regions. J. Dairy Sci. 2018, 101, 4001–4019. [Google Scholar] [CrossRef]
- Dai, Y.; Normand, M.D.; Weiss, J.; Peleg, M. Modeling the efficacy of triplet antimicrobial combinations: Yeast suppression by lauric arginate, cinnamic acid, and sodium benzoate or potassium sorbate as a case study. J. Food Prot. 2010, 73, 515–523. [Google Scholar] [CrossRef]
- Ullah, A.; Orij, R.; Brul, S.; Smits, G.J. Quantitative analysis of the modes of growth inhibition by weak organic acids in Saccharomyces cerevisiae. Appl. Environ. Microbiol. 2012, 78, 8377–8387. [Google Scholar] [CrossRef] [PubMed]
- Santos, W.P.; Salvati, G.G.S.; Arthur, B.A.V.; Daniel, J.L.P.; Nussio, L.G. The effect of sodium benzoate on the nutritive value of rehydrated sorghum grain silage for dairy cows. Anim. Feed Sci. Technol. 2019, 256, 114267. [Google Scholar] [CrossRef]
- Bernardes, T.F.; De Oliveira, I.L.; Lara, M.A.S.; Cassgrande, D.R.; Avila, C.L.S.; Pereira, O.G. Effects of potassium sorbate and sodium benzoate at two application rates on fermentation and aerobic stability of maize silage. Grass Forage Sci. 2015, 70, 491–498. [Google Scholar] [CrossRef]
- Siqueira, G.R.; Reis, R.A.; Schocken-Iturrino, R.P.; Pires, A.J.V.; Bernardes, T.F.; Amaral, R.C. Perdas de silagens de cana-de-açúcar tratadas com aditivos químicos e bacterianos. Rev. Bras. Zootec. 2007, 36, 2000–2009. [Google Scholar] [CrossRef]
- Jobim, C.C.; Nussio, L.G.; Reis, A.R.; Schmidt, P. Avanços metodológicos na avaliação da qualidade da forragem conservada. Rev. Bras. Zootec. 2007, 36, 101–119. [Google Scholar] [CrossRef]
- Ranjit, N.K.; Kung, L. The Effect of Lactobacillus buchneri, Lactobacillus plantarum, or a Chemical Preservative on the Fermentation and Aerobic Stability of Corn Silage. J. Dairy Sci. 2000, 83, 526–535. [Google Scholar] [CrossRef]
- AOAC. Official Methods of Analysis of AOAC International. In Official Methods of Analysis, 17th ed.; Association of Official Analytical Chemists: Gaithersburg, MD, USA, 2000. [Google Scholar]
- Mertens, D.R. Gravimetric determination of amylase-treated neutral detergent fiber in feeds with refluxing in beaker or crucibles: Collaborative study. J. AOAC Int. 2002, 85, 1217–1240. [Google Scholar]
- Woolford, M.K. Microbial screening of food preservatives, cold sterilants and specific antimicrobial agents as potential silage additives. J. Sci. Food Agric. 1975, 26, 229–237. [Google Scholar] [CrossRef]
- Muck, R.E. Silage microbiology and its control through additives. Rev. Bras. Zootec. 2010, 39, 183–191. [Google Scholar] [CrossRef]
- Kung, L.J.; Stokes, M.R.; Lin, C.J. Silage additives. In Silage Science and Technology; Buxton, D.R., Muck, R.E., Harrison, J.H., Eds.; American Society of Agronomy, Crop Science Society of America, Soil Science Society of America: Madison, WI, USA, 2003; pp. 251–304. [Google Scholar]
- Zhang, Y.; Kang, X.; Wang, Z.; Kong, X.; Li, L.; Sun, Y.; Zhu, S.; Feng, S.; Luo, X.; Lv, P. Enhancement of the energy yield from microalgae via enzymatic pretreatment and anaerobic co-digestion. Energy 2018, 164, 400–407. [Google Scholar] [CrossRef]
- Pahlow, G.; Muck, R.E.; Driehuis, F.; Oude Elferink, S.J.W.H.; Spoelstra, S.F. Microbiology of ensiling. In Silage Science and Technology; Buxton, D.R., Muck, R.E., Harrison, J.H., Eds.; ASA, CSSA, SSSA: Madison, WI, USA, 2003; Volume 42, pp. 31–93. [Google Scholar]
- McDonald, P.; Henderson, A.R.; Heron, S.J.E. The Biochemistry of Silage, 2nd ed.; Chalcombe Publications: Marlow, UK, 1991. [Google Scholar]
- Lambert, R.T.; Stratford, M. Weak-acid preservatives: Modelling microbial inhibition and response. J. Appl. Microbiol. 1999, 86, 157–164. [Google Scholar] [CrossRef] [PubMed]
- Da Silva, N.C.; Dos Santos, J.P.; Ávila, C.L.S.; Evangelista, A.R.; Casagrande, D.R.; Bernardes, T.F. Evaluation of the effects of two Lactobacillus buchneri strains and sodium benzoate on the characteristics of corn silage in a hot-climate environment. Grassl. Sci. 2014, 60, 169–177. [Google Scholar] [CrossRef]
- Evangelista, A.R.; Siqueira, G.R.; Lima, J.A.; Lopes, J.; Rezende, A.V. Alterações bromatológicas e fermentativas durante o armazenamento de silagens de cana-de-açúcar com e sem milho desintegrado com palha e sabugo. Rev. Bras. Zootec. 2009, 38, 20–26. [Google Scholar] [CrossRef]
- Li, Y.; Nishino, N. Bacterial and fungal communities of wilted Italian ryegrass silage inoculated with and without Lactobacillus rhamnosus or Lactobacillus buchneri. Lett. Appl. Microbiol. 2011, 52, 314–321. [Google Scholar] [CrossRef]
- Borreani, G.; Dolci, P.; Tabacco, E.; Cocolin, L. Aerobic deterioration stimulates outgrowth of spore-forming Paenibacillus in corn silage stored under oxygen-barrier or polyethylene films. J. Dairy Sci. 2013, 96, 5206–5216. [Google Scholar] [CrossRef] [PubMed]
- Danner, H.; Holzer, M.; Mayrhuber, E.; Braun, R. Acetic acid increases stability of silage under aerobic conditions. Appl. Environ. Microbiol. 2003, 69, 562–567. [Google Scholar] [CrossRef]
- Lindgren, S.; Oldenburg, E.; Pahlow, G. “Influence of microbes and their metabolites on feed and food quality.” Multi-function grasslands: Quality forages, animal products and landscapes. In Proceedings of the 19th General Meeting of the European Grassland Federation, La Rochelle, France, 27–30 May 2002. [Google Scholar]


Publisher’s Note: MDPI stays neutral with regard to jurisdictional claims in published maps and institutional affiliations. |
© 2022 by the authors. Licensee MDPI, Basel, Switzerland. This article is an open access article distributed under the terms and conditions of the Creative Commons Attribution (CC BY) license (https://creativecommons.org/licenses/by/4.0/).