Article

Short-Term Effects of Tillage Systems, Fertilization, and Cropping Patterns on Soil Chemical Properties and Maize Yields in a Loamy Sand Soil in Southern Mozambique

1
Mozambique Agricultural Research Institute (IIAM), Maputo P.O. Box 3658, Mozambique
2
Department of Soil, Crop and Climate Sciences, University of the Free State, Bloemfontein 9300, South Africa
*
Author to whom correspondence should be addressed.
Agronomy 2022, 12(7), 1534; https://doi.org/10.3390/agronomy12071534
Submission received: 1 June 2022 / Revised: 21 June 2022 / Accepted: 21 June 2022 / Published: 27 June 2022
(This article belongs to the Section Farming Sustainability)

Abstract

:
Sub-Saharan Africa (SSA) agriculture is characterized by dependence on erratic rainfall, inadequate conservation practices, and a decline in soil fertility resulting in low crop productivity. Therefore, conservation agriculture (CA) has been proposed as an alternative to improve soil fertility and productivity. Hence the aim was to investigate the effects of tillage systems, fertilization, and cropping patterns on selected soil chemical properties (pH, organic carbon, total nitrogen, extractable phosphorus, exchangeable cations, and cation exchange capacity) and identify which cropping pattern maximizes stover and grain maize–legume productivity and land use. A two-year (2016/17–2017/18) field experiment in a loamy sand soil was conducted at Nhacoongo Research Station, southern Mozambique. Two tillage systems (conservation (CA) and conventional tillage (CT)), two fertilization treatments (fertilized and unfertilized), and seven cropping patterns (four sole crops and three maize–legume intercrops) were evaluated in a randomized complete block design with split–split plot arrangement and replicated four times. CA practices resulted in significantly higher soil chemical properties and increased stover and grain yields as compared to CT practices, but fertilization demonstrated insignificant effects on soil chemical properties and significant influences on stover and grain yield of maize and legumes. Cropping patterns induced no significant effect on soil chemical properties and either stover or grain yield. Estimated indices like land equivalent ratio (1.18–2.67) and competitive ratio index (0.01–1.72) confirmed the advantage of intercropping against sole cropping. This is largely supported by the estimated values of aggressivity and relative crowding coefficient. Smallholder farmers can therefore benefit by adopting CA.

1. Introduction

The continued use of unsuitable crop management practices in most sub-Saharan Africa (SSA) countries has caused a decline in soil fertility, contributing to lower yields and impairing food security [1,2]. There is a need to develop and establish sustainable alternative technologies to improve soil fertility and crop productivity. Conservation agriculture (CA) practices were proposed to overcome these production constraints, minimize the impacts of drought and improve crop productivity [3,4]. Conservation agriculture is defined by integrating three principles, namely minimal soil disturbance, crop residue retention, and crop diversification through rotation or intercropping [4,5]. Such principles are trusted to promote the physical, chemical, and biological properties of the soil, which is perceived by increased crop productivity. The CA practices are being proposed as a feasible method for improving soil quality by increasing organic carbon (OC) and cation exchange capacity (CEC), reducing total nitrogen (N) loss through the decomposition of organic matter [6], and increasing exchangeable cations [7]. In Ghana, a maize yield of 2.0 tonnes per hectare (t ha−1) was obtained in no-tillage, which was higher than the 1.4 t ha−1 in conventional tillage in a two-year study [8]. No-tillage in India also caused a significant positive impact on maize yields compared to conventional practices [9].
Soil fertility degradation is one of the main reasons for low productivity in maize-based cropping systems. Degraded soil can be recovered by amelioration with external inputs [10] and the positive relationship between fertilizer and crop yields is well established. However, smallholder farmers are resource-poor and the cost of inorganic fertilizer, as well as the scarce availability of organic fertilizers, restrict fertilization. The alternative is the adoption of other practices, such as maize and legume intercropping that promotes soil N fertility recovery and increases crop productivity. Intercropping is the cultivation of two or more crops planted simultaneously in the same field that provides the possibility of yield benefit compared to sole cropping [11]. The yield benefit is ascribed to the more efficient use of resources such as water, nutrients, and solar energy [12].
The practice of cereal and legume intercropping is considered the best alternative for the sustainability of the smallholder farming system, improving soil chemical properties, reducing the use of inorganic fertilizers, and increasing land-use efficiency contributing to increased crop yields [12]. The inclusion of legumes, through their biological N fixation, provides more significant amounts of N remobilized to the soil for the current and next crop, thus maintaining soil fertility levels and increasing P mobilization [13]. Increased maize yield in Ghana was reported when maize was intercropped with pigeon pea (7.0 t ha−1) as compared to sole maize cropping (2.0 t ha−1) [14]. Accumulated crop residues from legumes present in intercropping provide higher production of dry matter, which promotes changes in soil quality by increasing organic matter and improving the carbon to nitrogen (C:N) ratio. The selection of a suitable legume in a maize–dominated system is critical for increasing N fixation and biomass production.
For smallholder farmers, legumes, with their adaptability to different cropping patterns and their ability to fix N, may offer opportunities to sustain and even improve cereal productivity like maize [14,15]. Legumes, both sole and as an intercrop with cereals, have been advocated not only for yield augmentation but also for maintenance of soil quality, particularly in degraded soil [16]. The estimation of competition indices is often used to evaluate the behavior of component crops in intercropping systems [17]. Indices of this nature included inter alia land equivalent ratio (LER: indicating the amount of interspecific competition in an intercropping system), aggressivity index (A: comparing the yields between intercropping and sole cropping), relative crowding coefficient (K: showing the competitive ability of one species to the other in an intercropping system), and competitive ratio (CR: evaluating which one crop competes with the other in an intercropping system).
In Mozambique, the average maize yield is less than 1.5 t ha−1 of the estimated potential of 5 t ha−1 [18] on fields smaller than 2 ha [15,19], thus emphasizing a considerable yield gap. Here, research about the effect of the tillage system, fertilization, and cropping pattern alone on maize and legume stover and grain yield [3,20] and soil physical properties [21] have been conducted. However, there is a paucity of information concerning the combined effects of tillage system, fertilization, and cropping pattern on soil chemical properties, maize and legume stover and grain yield, as well as competition indices of intercropping systems. Therefore, the objective of this work was to evaluate the impact of tillage systems, fertilization, and cropping patterns, and their interaction on selected soil chemical properties, maize stover, and grain yield, and competition indices of intercropping systems in loamy sand soil of Mozambique.

2. Material and Methods

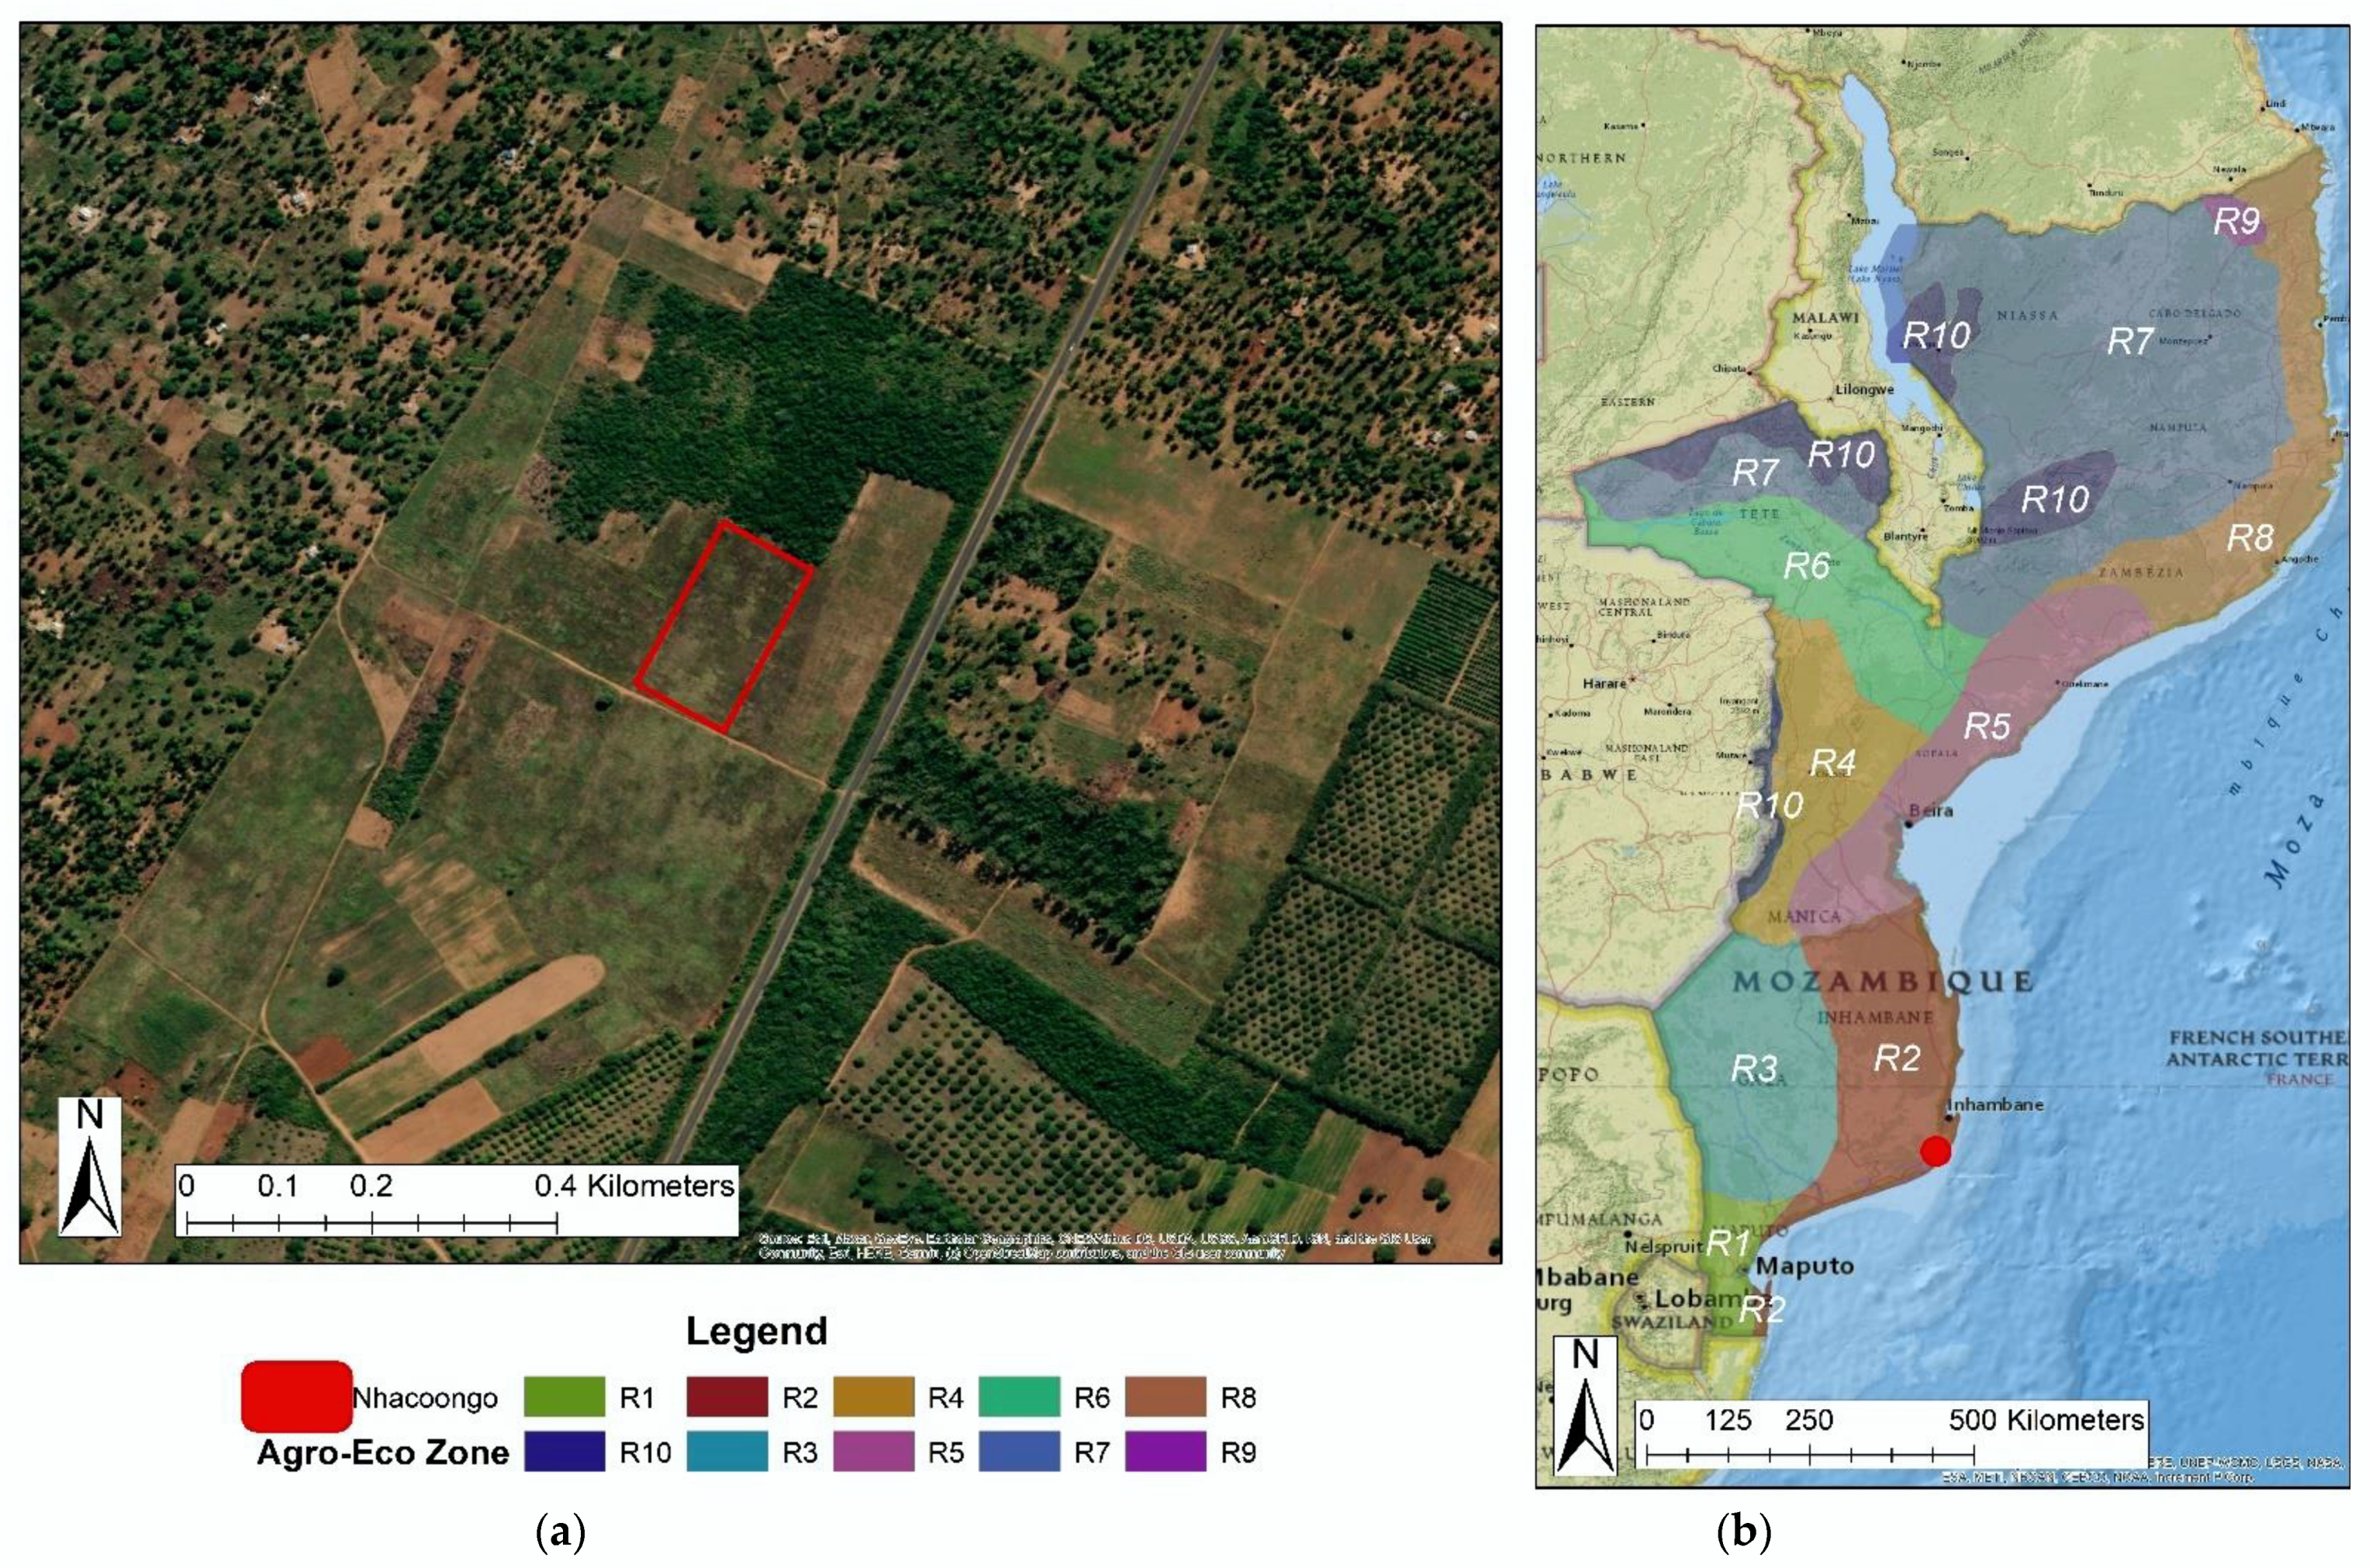
2.1. Site Description

This study was conducted at the Nhacoongo Research Station experimental farm of the Agricultural Research Institute of Mozambique (IIAM). Nhacoongo Research Station is located in Inharrime District (Inhambane Province) along the coastal zone, in the southern region of Mozambique, within R2 agro-ecological zone (Figure 1). The research station lies between 24°19′49″ S and 35°12′55″ E with an elevation of 70 m.a.s.l. Prior to the experiment the land was sole cropped to maize for many years and then fallowed for at least five years. Temperatures range between 18 °C and 33 °C, and annual rainfall range from 800 mm to 1200 mm, with a unimodal rainfall pattern starting in November and lasting until the end of March [22]. Agricultural production is predominantly rainfed, with smallholder farmers relying on subsistence agriculture, with the main food crops being maize, sorghum, millet, cassava, cowpea, and groundnut. The dominant soils are loamy sand arenosols [23] with 8.8% clay, 5.3% silt and 85.4% sand in the upper 5 cm layer. Chemical properties of this layer are: pH = 5.45, C = 0.50%, N = 0.05%, P = 9.84 mg kg−1, Ca = 1.06 cmol kg−1, Mg = 0.46 cmol kg−1, K = 0.25 cmol kg−1, and Na = 0.37 cmol kg−1.

2.2. Experimental Design and Treatments

A two-year (2016/17–2017/18) cropping field experiment was conducted under rainfed conditions to evaluate the effects of tillage systems, fertilization, and cropping patterns on selected soil chemical properties and on stover and grain yield of maize and legumes cultivated either in a sole or intercrop system. The experimental design was a randomized complete block design with a split–split plot arrangement, replicated four times. Two tillage systems were applied in the main plots (conservation (CA) and conventional (CT) tillage), seven cropping patterns in the sub plots (four sole croppings and three intercroppings), and two fertilization rates in the sub-sub plots (fertilized and unfertilized) (Table 1). Main plots (tillage system) dimensions were 26.0 m × 31.5 m (819 m2), sub plots (cropping pattern) dimensions were 5.0 m × 4.5 m (22.5 m2), and sub-sub plot (fertilization) dimensions were 5.0 m × 2.25 m (11.25 m2).
After harvesting, the CA plots (819 m2) were not disturbed at all and, therefore, at least 30% of the crop residues remained on the soil surface. Glyphosate was applied at a rate of 2.5 L ha−1 two weeks before planting. In the CT plots (819 m2), the crop residues were removed after harvesting and plowing to mimic animal grazing. For seedbed preparation, the soil was hand hoed to a depth of approximately 150 mm. Post-emergence weeds were controlled with hand hoeing. Over the two years of the study, the treatments were applied to the same plots, which had buffer zones of 5.0 m between the tillage systems, 2.0 m between blocks, and 1.0 m within plots.
Sub plots (22.5 m2) within which cropping pattern was studied consisted of four sole crops (maize, pigeon pea, cowpea, and groundnut) and three maize–legume intercrops (maize–pigeon pea, maize–cowpea, and maize–groundnut). Maize–pigeon pea seed was sown at the recommended spacing of 75 cm between rows and 30 cm within rows, while other legumes varied from 50 cm × 30 cm for common beans, cowpea, and groundnut and 50 cm × 10 cm for soybean. Maize and legumes were sown simultaneously as a sole crop or intercropped in alternate rows. Two seeds were sown per hill and thinned to one five days after emergence.
The response of the soil to either the tillage system or cropping pattern with and without fertilization was studied in the sub-sub plots (11.25 m2). At planting, an NPK (12:24:12) fertilizer mixture was applied at 300 kg ha−1 and 150 kg ha−1 for maize and legumes, respectively. The maize was top-dressed with urea (46% N) at the recommended rate of 200 kg ha−1. Legumes received no top dressing and were not inoculated.

2.3. Soil Sampling and Analysis

Soil samples were taken from 0–5 cm depths at six points on each sub plot and mixed thoroughly to provide a representative sample of each sub plot, i.e., a total of 112 composite soil samples for the two tillage systems (56 samples for CA practices + 56 samples for CT practices). Changes in soil chemical properties within two years are most likely to manifest in this layer, which was defined as the pedoderm [24]. The samples were air-dried and sieved through a 2 mm sieve and then analyzed in the soil science laboratory of the University of the Free State, South Africa. Soil samples were analyzed following standard procedures [25]: pH in 1:2.5 soil and water suspension, organic C by Walkley-Black wet combustion, total N by Kjeldahl digestion and distillation, and extractable P Olsen soil test. Exchangeable cations (Ca, Mg, K, and Na) and cation exchange capacity (CEC) were determined using ammonium acetate (NH4OAc) buffered at pH 7 extraction.

2.4. Stover and Grain Yield Determination

At harvesting, the stover and grain yield of the crops were determined from an area of 11.25 m2 per sub-sub plot. Plants were cut at ground level and sun-dried until the moisture content of the grain reached 12.5%, measured with a moisture meter. The cobs of maize and pods of legumes were threshed, and the grain and stover were weighed. Both the stover and grain yields were converted to tonnes per hectare (t ha−1).

2.5. Competition Indices

Equations (1)–(5) were suggested by [17] to calculate the land equivalent ratio, aggressivity, relative crowding coefficient (maize–legume), relative crowding coefficient (legume–maize), and competitive ratio, respectively.
L E R ( T ) = L E R ( m ) + L E R ( l ) = Y ( i m ) Y ( s m ) + Y ( i l ) Y ( s l )
A ( M L ) =   Y ( i m ) Y ( s m ) × Z ( i m )   Y ( i l ) Y ( s l ) × Z ( i l )
K ( M L ) = ( Y ( i m ) × Z ( l ) Y ( s m ) Y ( i m ) × Z ( m ) )
K ( L M ) = ( Y ( i l ) × Z ( m ) Y ( s l ) Y ( i l )   ×   Z ( l ) )
C R ( M ) = Y ( i m ) Y ( s m ) × Z ( m ) Y ( i l ) Y ( s l ) × Z ( l )
where LER(T) is the total land equivalent ratio, A(ML) is the aggressivity index of maize relative to that of the legume crop, K(ML) is the relative crowding coefficient index of maize against the legume crop, K(LM) is the relative crowding coefficient index of the legume crop against maize, and CR(M) is the competition ratio index of maize against the legume crop. The other components in the equations represent inter alia the following: LER(m) is maize partial LER and LER(l) is the legume crop partial LER, Y(im) and Y(il) are yields of maize and the legume crop in intercropping, Y(sm) and Y(sl) are yields of maize and the legume crop in sole cropping, and Z(im) and Z(il) are the proportions of the area occupied by maize and the legume crop.
The interpretation of the competition indices is based on specified criteria. A LER(T) value of >1 indicates intercropping advantage over sole cropping [16], while a A(ML) value >0 indicates maize was more aggressive than the legume crop [17]. Maize is more competitive than the legume crop when K(ML) is larger than K(LM) and vice versa [11]. A CR(M) value >1 indicates that maize is more competitive than the legume crop [16].

2.6. Data Processing

The data were analyzed statistically using analysis of variance (ANOVA) in the XLSTAT v 17.3 [26] statistical software for Excel. Treatment means were separated by Tukey’s multicomparison test, and differences were reported at a 5% probability level. The interaction effects between tillage system, fertilization, and cropping pattern were given separately only for those attributes that were significantly influenced. Indices of competition between crops were calculated with grain yield data using the equations given earlier.

3. Results

3.1. Soil Chemical Properties

3.1.1. pH

Tillage practices only significantly (p ≤ 0.05) affected pH, with a higher pH under CA (5.93) than CT (5.45) (Table 2). Only the tillage system by fertilization, as well as the tillage system by cropping pattern interactions, significantly affected pH (p ≤ 0.05).

3.1.2. Organic Carbon

The tillage system only had a significant effect on OC (Table 2). Organic C was higher under CA (0.74%) compared to CT (0.50%). Similar to pH, the tillage system and fertilization interaction, as well as the tillage system and cropping pattern interaction, significantly influenced OC.

3.1.3. Total Nitrogen

Total N was significantly (p ≤ 0.05) affected by the tillage system and cropping pattern, while fertilization had no significant influence on total N (Table 2). A higher total N was observed under CA (0.08%) as compared to CT (0.05%).
The interaction effects between the tillage system and fertilization, as well as the interaction effects between the tillage system and cropping pattern, had a significant influence on total N, and the values ranged from 0.04% to 0.09%, while the interaction effects between fertilization and cropping pattern had no significant influence on total N.

3.1.4. Carbon: Nitrogen Ratio

The effect of the tillage system, cropping pattern, and fertilization alone on C:N ratio was not significant (Table 2). The interaction effects had a significant influence on the C:N ratio.

3.1.5. Extractable Phosphorus

The extractable P content was influenced by the tillage system and fertilization but not by the cropping pattern (Table 2). Higher values of extractable P were found under CA (14.7 mg kg−1) than under CT (9.8 mg kg−1). Fertilized soil had higher extractable P (14.1 mg kg−1) than unfertilized soil (10.4 mg kg−1).
The interactions of tillage system and fertilization, fertilization and cropping pattern, and tillage system and cropping pattern had significant effects on extractable P with values ranging from 6.5 mg kg−1 to 21.1 mg kg−1.

3.1.6. Exchangeable Cations

The concentrations of the exchangeable cations (Ca, Mg, K, and Na) were significantly affected by the tillage system only (Table 2). Higher values of Ca, Mg, and K under CA (1.76, 0.83, and 0.29 cmol kg−1, respectively) than under CT (1.06, 0.46, and 0.25 cmol kg−1, respectively) were recorded. Noteworthy, exchangeable Na was higher (0.37 cmol kg−1) under CT than CA (0.27 cmol kg−1).
The interaction between the tillage system and fertilization, as well as the interaction between the tillage system and cropping pattern, had a significant influence on exchangeable Ca, Mg, and Na concentrations, while no significant interaction effects on exchangeable K concentration were recorded.

3.1.7. Cation Exchange Capacity

Cation exchange capacity was influenced by the tillage system, and higher values were observed under CA (5.94 cmol kg−1) than under CT (3.25 cmol kg−1) (Table 2). Fertilization and cropping patterns had no significant effects on CEC.
The interaction effects between the tillage system and fertilization, as well as the tillage system and cropping pattern, were significant, with CEC values ranging from 2.44 cmol kg−1 to 7.06 cmol kg−1 while no significant influences were recorded for the interaction effect between fertilization and cropping pattern with CEC values varying from 3.69 cmol kg−1 to 5.15 cmol kg−1.

3.2. Maize Stover and Grain Yield

3.2.1. Stover Yield

Stover yield across the two cropping seasons was significantly influenced by the tillage systems, cropping pattern, fertilization, and their two-way interaction effects (Table 3). Among the tillage systems for the 2016/17 and 2017/18 cropping seasons, a higher stover yield was obtained under CA (3.02 and 3.80 t ha−1) compared to CT (1.76 t ha−1 and 2.73 t ha−1). Higher stover yields were realized with the fertilized treatments (2.71 t ha−1 and 3.74 t ha−1) than with the unfertilized treatments (2.08 t ha−1 and 2.79 t ha−1) in both cropping seasons. Across cropping patterns, the highest stover yield in the first season was recorded with maize–groundnut intercropping (3.84 t ha−1). In the second cropping season, the highest stover yield was observed with maize–cowpea intercropping (5.67 t ha−1). The lowest stover yield was obtained with sole groundnut for the first (0.51 t ha−1) and second (1.70 t ha−1) cropping seasons.
In the interaction between the tillage system and fertilization, the highest stover yield was observed in the fertilized plots under CA (3.42 t ha−1 in 2016/17 and 4.23 t ha−1 in 2017/18), and the lowest stover yield in unfertilized plots under CT (1.54 t ha−1 in 2016/17 and 2.21 t ha−1 in 2017/18). The CA plots had significantly higher stover yields than the CT plots when either fertilized or unfertilized for both cropping seasons.
In the interaction between tillage and cropping pattern, the highest values were recorded in the maize–groundnut intercropping and maize–cowpea intercropping systems (5.34 t ha−1 and 5.97 t ha−1, respectively, under CA), and the lowest values in the sole groundnut system (0.32 and 1.48 t ha−1, respectively, under CT) across both seasons.
In the interaction between cropping pattern and fertilization, stover yield was highest in maize–groundnut intercropping and maize–cowpea intercropping when fertilized (4.19 t ha−1 and 6.39 t ha−1 in 2016/17 and 2017/18, respectively) and lowest in unfertilized sole groundnut (0.47 t ha−1 and 1.46 t ha−1 in 2016/17 and 2017/18, respectively).

3.2.2. Grain Yield

During the two cropping seasons, the tillage system, cropping pattern, fertilization and their two-way interaction effects showed significant differences in grain yield (Table 3). However, the Tillage system alone significantly influenced grain yield only in 2016/17. Grain yield was greater under CA (1.32 t ha−1 and 1.48 t ha−1) than under CT (0.81 and 1.38 t ha−1) in 2016/17 and 2017/18, respectively. Higher grain yields were recorded in fertilized plots (1.25 t ha−1 and 1.75 t ha−1) than in unfertilized plots (0.87 t ha−1 and 1.11 t ha−1) in both cropping seasons. Across cropping pattern, the highest grain yields were recorded with maize–pigeon pea intercropping (1.70 t ha−1) in the first cropping season and sole maize (2.04 t ha−1) in the second cropping season, while the lowest grain yields were recorded with sole groundnut (0.11 t ha−1 and 0.64 t ha−1) across the two cropping seasons, respectively.
The highest grain yields among fertilization by tillage system interaction were recorded on fertilized plots under CA (1.52 t ha−1 and 1.86 t ha−1) in both cropping seasons. On the other hand, the lowest grain yields were observed in unfertilized plots (0.63 t ha−1) under CT in the first cropping season and unexpectedly under CA (1.10 t ha−1) in the second cropping season.
For the interaction between the tillage system and cropping pattern, grain yield was highest in maize–pigeon pea intercropping (2.01 t ha−1) in the first cropping season and sole maize (2.29 t ha−1) in the second cropping season, under CA. This was followed by maize–cowpea intercropping under CA (1.80 t ha−1) in the first cropping season and maize–groundnut intercropping under CT (2.18 t ha−1) in the second cropping season. However, the lowest grain yield was observed in maize–groundnut intercropping (0.04 t ha−1) under CT, and unexpectedly, in the second cropping season, the lowest grain yield was observed in maize–groundnut intercropping (0.32 t ha−1) under CA.
The interaction between CA by intercropping recorded higher grain yields compared with CT by intercropping for both cropping seasons, with the exception of CT by maize–groundnut intercropping during the second cropping season. There was no clear trend between the interactions of the tillage system by sole cropping on grain yield in both cropping seasons.
The interaction between fertilization and cropping pattern gave the highest grain yields in maize–pigeon pea and maize–cowpea intercropping for fertilized plots, namely 1.87 t ha−1 and 2.54 t ha−1 in 2016/17 and 2017/18, respectively. This was followed by unfertilized sole maize with 1.57 t ha−1 in 2016/17 and 2.49 t ha−1 in 2017/18. The lowest grain yield was recorded in unfertilized sole groundnut (0.10 t ha−1 and 0.56 t ha−1) in both cropping seasons. The interaction between fertilization and intercropping pattern showed a clearer trend compared to fertilization and sole cropping pattern in both cropping seasons. Higher grain yields were obtained from fertilized plots under intercropping than from unfertilized plots under intercropping.

3.3. Competition Indices

3.3.1. Land Equivalent Ratio (LER)

In general, LER values with both intercropping patterns were greater than 1.0, which indicates a higher efficiency due to intercropping patterns on the production of grain over sole cropping, irrespective of fertilization and tillage practice (Table 4). The LER values recorded with maize and pigeon pea (2.01 and 1.72) as well as maize and groundnut (2.19 and 2.30) intercropping were consistently higher under CT, while for maize and cowpea (2.45 and 2.34), the LER values were greater under CA, either fertilized or not in both cropping seasons.

3.3.2. Aggressivity Index (A)

Values of A, indicating the aggressivity of maize to a legume, are summarized for all treatment combinations in Table 4. In 2016/17, A values exceeded 0 for intercropping of maize and pigeon pea under CA, and for maize and groundnut under CT despite fertilization or not. The dominance indicated that CA practices were more appropriate for maize and pigeon pea combination, while CT practices favored maize and groundnut intercropping, either fertilized or not.

3.3.3. Relative Crowding Coefficient (K)

The K values for each crop in each of the three intercropping systems are given in Table 5. Referring to K values of all intercropping concerning maize and cowpea intercropping, maize values were greater than those of cowpea, but in the maize and pigeon pea as well as maize and groundnut, no clear trend was observed. In all the other cropping systems, maize was more dominant than cowpea. However, groundnut and pigeon pea was more competitive than maize, except under CT when fertilized.

3.3.4. Competitive Ratio (CR)

The CR values for maize relative to the three legumes are presented in Table 5. Maize was more competitive than pigeon pea and groundnut under CA, irrespective of fertilization or not, as the mean CRs for 2016/17 and 2017/18 exceeded 1, indicating its superior ability of competition as compared to the legume. This also applies to maize and groundnut intercropping under CT when fertilized. On the other hand, the other intercropping systems were less than 1 and revealed that the legume crops were more competitive than maize.

4. Discussion

4.1. Soil Chemical Properties

4.1.1. pH

The pH increased by 8.1% in CA as compared to CT, which agrees with other studies [27] with a significantly higher pH under minimum tillage (CA) as compared to CT. These results suggest that applying CA practices would decrease soil acidity due to increased base cation concentrations which was the case in our study (with the exception of Na). This implies that CA practices have the capacity to ameliorate soil acidity. After two years, the difference in pH between the CA and CT tillage systems was small, being 0.48. The pH varied insignificantly among the fertilization treatments and cropping patterns alone. A similar result was reported [28], where fertilization of P had no significant changes in pH. After two years, for the cropping pattern, increased pH of 2.6% was observed under sole cowpea (5.78) as compared to sole pigeon pea (5).
The interaction between the tillage system and fertilization had a significant effect on pH (P ≤ 0.05). Accordingly, CA in combination with fertilization (fertilized = 5.92 and unfertilized = 5.95) increased pH levels compared to CT in combination with fertilization (fertilized = 5.46 and unfertilized = 5.44). These findings agree with other studies [29], namely a significant influence by the tillage system in combination with N fertilization on pH, where higher values were recorded under CA than CT.
Significant interaction effects between the tillage system and cropping pattern on pH were also evident. The pH was highest in sole cowpea under CA (6.01) and lowest in maize–pigeon pea intercropping under CT (5.34). Interaction effects between fertilization and cropping pattern were not significantly different.

4.1.2. Organic Carbon

The significant increase of 32.4% in OC in the CA plots as compared to CT practices showed that CA practices might be effective, even in the short term. These findings agree with those of other researchers [6,30], who reported higher OC under CA, which can be attributed to no-tillage and the presence of crop residue that improved soil structure, alter organic matter decomposition, and hence C mineralization. On the other hand, CT practices contribute to increased loss of OM due to soil aeration. Fertilization and cropping pattern factors alone had no significant effects on OC. It is noteworthy that no significant N and P fertilization effects on OC were observed [28]. Although no significant effects were recorded for cropping pattern, the highest OC was noted in sole pigeon pea and maize–cowpea intercropping (0.64%) and the lowest under sole groundnut and maize–pigeon pea intercropping (0.60%).
The results show that the tillage system and fertilization interactions do affect OC. CA practices combined with fertilization (fertilized = 0.74% and unfertilized =0.73%) had higher OC than CT practices combined with fertilization (fertilized = 0.51 and unfertilized = 0.49%). Small differences between fertilized and unfertilized treatments in this interaction clearly demonstrate that tillage practices are the main cause of OC gains or losses. The findings corroborate with those of other investigators [31,32], who reported a significant influence on OC by the interaction of the tillage system and N fertilization. A decrease in organic matter under CT and N fertilization interaction was also reported [29].
Organic carbon was significantly influenced by the tillage system and cropping pattern interaction. The highest OC (0.81%) was observed under CA with pigeon pea, while the lowest OC (0.47%) was observed under CT with pigeon pea. These findings concur with other researchers [33], showing significant interaction effects on OC in the surface soil layer, with tillage systems and cropping patterns.

4.1.3. Total Nitrogen

The CA practices tended to increase the total N (38%) as compared to CT, which is in agreement with other studies. Several researchers [6,10,30] reported more total N under CA as compared to CT due to increased accumulation of organic matter under CA that contributed to increased N immobilization. For cropping patterns, the highest total N was observed under sole cowpea (0.08%), while the lowest total N was observed under maize–groundnut intercropping (0.06%). Results from field experiments [31] showed significant cropping patterns (sole cropping and rotation) influence on total N in the surface soil layer (0–10 cm). No significant response of total N was detected due to fertilization because the application of inorganic N was minuscule compared to total soil N.
The interaction effect between the tillage system and fertilization favored total N. The CA, either fertilized or unfertilized interactions, reported increased total N content of 38% and 25% compared to fertilized versus unfertilized plots under CT, respectively. Similar findings were reported [34], indicating a significant tillage system and fertilization interaction influence on total N.
The interaction effects between the tillage system and cropping pattern had a significant influence on total N, and the values ranged from 0.04% to 0.09%.

4.1.4. Carbon: Nitrogen Ratio

Interestingly the C:N ratio did not show any differences between treatments or their interactions. The relative increase of both C and N were very similar and explain why differences were not observed. Other studies also found a lack of differences, even after more than a decade of practicing CA [32].

4.1.5. Extractable Phosphorus

Changes in the amount of extractable P content occurred as a result of the tillage system and fertilization but not by cropping pattern (Table 2). An increase (33%) in the amount of extractable P in the soil from CA was noted over CT. Similar results were reported [10,34], indicating significantly higher extractable P in the surface layer under CA as compared to CT. The extractable P varied significantly (p > 0.05) among the fertilized and unfertilized treatments, which agrees with other studies [10,28] where a significant N fertilization effect on extractable P was observed. This was expected because of P fertilization. Despite that cropping pattern had no significant effects on extractable P, maize–groundnut intercropping had significantly higher extractable P (15.8 mg kg−1), and maize–cowpea intercropping had the lowest extractable P (10.3 mg kg−1).
The level of extractable P in the soil was influenced by the interactions of the tillage system and fertilization, fertilization and cropping pattern, and tillage system and cropping pattern. The CA practices resulted in increased (50%) extractable P as compared to CT practices when fertilized. In the surface layer, the interaction between the tillage system and P fertilization increased extractable P [35]. For the interaction between the tillage system and cropping pattern, the highest value of extractable P was observed in maize–groundnut intercropping (21.1 mg kg−1) under CA, and the lowest value was noted in maize–cowpea intercropping (6.5 mg kg−1) under CT. The interaction between fertilization and cropping pattern resulted in the highest extractable P with maize–groundnuts intercropping (20.6 mg kg−1) and the lowest extractable P with maize–pigeon pea intercropping (7.6 mg kg−1).

4.1.6. Exchangeable Cations

CA had the highest values of Ca, Mg, and K (1.76 cmol kg−1, 0.83 cmol kg−1, and 0.29 cmol kg−1, respectively) over CT (1.06 cmol kg−1, 0.46 cmol kg−1, and 0.25 cmol kg−1, respectively) and concurs with findings of other studies [7,27]. The low values of exchangeable Ca, Mg, and K observed for CT might be attributed to intensive tillage, which brought less fertile subsoil to the surface layer, and also may be due to increased leaching [34]. However, exchangeable Na was reduced by 27% in CA over CT. Similarly, higher exchangeable Na under CT as compared to CA practices was also observed [36]. The fertilization and cropping pattern alone did not influence the exchangeable cation concentrations (Table 2). Compared to the exchangeable K in the soil, the application of fertilizer K was negligible.
Higher exchangeable cation values were also recorded in CA practices, either fertilized or unfertilized, while no significant interaction effects on exchangeable K concentration were recorded. This is consistent with the results from a 4-year study on Nitisols that showed no significant tillage and N fertilization interaction effect on exchangeable K [34].

4.1.7. Cations Exchange Capacity

In our study, the soils under CA practices showed a 45% increase in CEC when compared to CT (Table 2). The higher values of CEC under CA are associated with greater organic matter accumulation under CA than CT, which is in agreement with similar studies [27]. Neither fertilization nor cropping pattern alone impacted CEC significantly.
The interaction effects between tillage system and fertilization, tillage system, and cropping pattern, tillage system, fertilization and cropping pattern were significant, with CEC values ranging from 2.44 cmol kg−1 to 7.06 cmol kg−1, while no significant effects were recorded for the interaction effect between fertilization and cropping pattern with CEC values varying from 3.69 cmol kg−1 to 5.15 cmol kg−1.

4.2. Maize Stover and Grain Yield

4.2.1. Stover Yield

The effect of the tillage system, fertilization, cropping pattern, and their interaction on stover yield across the two cropping seasons varied significantly (Table 3). For the 2016/17 and 2017/18 cropping seasons, stover yield increased by 42% and 28% under CA, as compared to CT. Similar results were reported [37]; the higher stover yield under CA tillage may be related to the presence of crop residue leading to more release of N in the soil and a positive effect on C stock [5]. Crop residue retention prevents crusting, increases water infiltration, and reduces evaporation leading to increased available water for crop development resulting in higher stover yield. On the other hand, the higher stover yield recorded under CA during the second cropping season indicates that crop residues added before the first cropping season decomposed, resulting in higher organic matter under CA than CT.
Higher stover yields of 32% were realized with the fertilized than with the unfertilized treatments in both cropping seasons. Similar results were reported for other studies [9,38].
A positive stover yield response to the cropping pattern was recorded in the first season with maize–groundnut intercropping (3.84 t ha−1), which was 26% greater compared to sole maize. In the second cropping season, the highest stover yield was observed with maize–cowpea intercropping (5.67 t ha−1), representing a 100% increase compared to sole maize. The lowest stover yield was obtained with sole groundnut for the first (0.51 t ha−1) and second (1.70 t ha−1) cropping seasons. The presence of legumes in an intercropping system with maize generally improved stover yield as compared to any sole cropping system. Furthermore, sole legume cultivation resulted in a very low stover yield. The above-mentioned stover yield improvement with intercropping systems also relates favorably with the findings of other studies [39,40]. These results confirm the beneficial effect of intercropping legumes with maize in terms of biological nitrogen fixation and water availability through canopy cover [12].
The highest stover yield was observed in fertilized plots under CA (3.42 t ha−1 in 2016/17 and 4.23 t ha−1 in 2017/18), and the lowest stover yield in unfertilized plots under CT (1.54 t ha−1 in 2016/17 and 2.21 t ha−1 in 2017/18). The CA plots had significantly higher stover yields than the CT plots when either fertilized or unfertilized for both cropping seasons. The increased stover yield from fertilization might be due to the additional N, P, and K applied by fertilization (see Table 3) that favored these interactions. Similar results were recorded [41], showing increased stover yield by minimum tillage and N fertilization interaction compared to unfertilized crops under CT.
In the interactions between tillage and cropping pattern, the highest values were recorded in the maize–groundnut intercropping and maize–cowpea intercropping systems (5.34–5.97 t ha−1, respectively under CA) and the lowest values in the sole groundnut system (0.32 t ha−1 and 1.48 t ha−1, respectively under CT) across both seasons. Generally, the CA by cropping systems produced more stover than the CT by cropping systems. This could be ascribed to the presence of crop residue under CA that decomposed and released nutrients for utilization. These results are in agreement with other researchers [8,9,42], who noted the significant effect of the tillage system on maize and soybean stover yields.
Stover yield was highest in maize–groundnut intercropping and maize–cowpea intercropping when fertilized (4.19 t ha−1 and 6.39 t ha−1 in 2016/17 and 2017/18, respectively) and lowest in unfertilized sole groundnut (0.47 t ha−1 and 1.46 t ha−1 in 2016/17 and 2017/18, respectively). The fertilized plots, in general, produced higher stover yields than the unfertilized plots for all cropping patterns, thus confirming the contribution of fertilizer to stover production. The increased stover yield can be attributed to a better supply of N, P, and K, which contributed to increased carbohydrate synthesis, promoting crop growth. A significant effect on maize stover yield due to the interaction of fertilization and cropping pattern was also recorded [40,43].

4.2.2. Grain Yield

After two cropping seasons, significant differences in grain yield as influenced by the tillage system, fertilization, cropping pattern, and their interaction were found (Table 3). Grain yield increased by 38% and 7% under CA compared to CT in 2016/17 and 2017/18, respectively. The greater grain yield under CA might be associated with better grain weight as a result of better soil conditions associated with this tillage system, e.g., less runoff and lower evaporation, resulting in higher water content [5,37,39] compared to CT. In line with this, several studies [8,38,44] also reported increasing trends in maize–soybean grain yield under CA.
Higher grain yields were recorded in fertilized plots (51%) than in unfertilized plots in both cropping seasons and concurs with findings of other investigations [8,38,45]. Cropping patterns showed no clear trend. The only consistency was that either maize with any combination of legume crop and/or maize sole crop produced the highest grain yield compared to sole legume crops producing the lowest grain yields.
For the interaction between tillage system and cropping pattern, grain yield was highest in maize–pigeon pea intercropping (2.01 t ha−1) in the first cropping season and sole maize (2.29 t ha−1) in the second cropping season, under CA. This was followed by maize–cowpea intercropping under CA (1.80 t ha−1), in the first cropping season and maize–groundnut intercropping under CT (2.18 t ha−1) in the second cropping season. However, the lowest grain yield was observed in maize–groundnut intercropping (0.04 t ha−1) under CT, and unexpectedly in the second cropping season, the lowest grain yield was observed in maize–groundnut intercropping (0.32 t ha−1) under CA. Similarly, some researchers [42,44] recorded a significant tillage system by cropping pattern interaction on grain yield.
The interactions between CA by intercropping recorded higher grain yields compared with CT by intercropping for both cropping seasons, with the exception of CT by maize–groundnut intercropping during the second cropping season. There was no clear trend between the interactions of the tillage system by sole cropping on grain yield in both cropping seasons. A possible explanation for this might be the short trial period of only two cropping seasons. The effects of intercropping versus sole cropping on grain yield may only be visible in long-term trials. Increases in maize and legume yields take at least five years to become significant [46]. Despite the variations observed between cropping season and sites, maize yields were occasionally higher when maize was intercropped with a legume. Hence an intercropping system increases maize yields and is an optional crop management system for smallholder farmers to ensure food and nutritional security as two crops are harvested [39,43]. The inclusion of legumes in cropping patterns resulted in increased maize yield compared to sole maize cropping and countered a reduction in the intensity of nutrient deficiencies, especially N.
The highest grain yields among fertilization by tillage system interactions were recorded on fertilized plots under CA (1.52 t ha−1 and 1.86 t ha−1) in both cropping seasons. On the other hand, the lowest grain yields were observed in unfertilized plots (0.63 t ha−1) under CT in the first cropping season and unexpectedly under CA (1.10 t ha−1) in the second cropping season. Some studies [41,45] also observed significant differences between reduced tillage (CA) and fertilization (N and P) interactions on maize grain yield over four cropping seasons. This phenomenon is ascribed to improved soil structure under CA due to the presence of crop residue, which contributed to enhanced soil quality.
The interactions between fertilization and cropping pattern gave the highest grain yields in maize–pigeon pea and maize–cowpea intercropping for fertilized plots, namely 1.87 t ha−1 and 2.54 t ha−1 in 2016/17 and 2017/18, respectively. This was followed by unfertilized sole maize with 1.57 t ha−1 in 2016/17 and 2.49 t ha−1 in 2017/18. The lowest grain yield was recorded in unfertilized sole groundnut (0.10 t ha−1 and 0.56 t ha−1) in both cropping seasons. The interactions between fertilization and intercropping pattern showed a clearer trend compared to fertilization and sole cropping pattern in both cropping seasons. Higher grain yields were obtained from fertilized plots under intercropping than from unfertilized plots under intercropping. The increased grain yields on account of fertilization could be attributed to the additional N, P, and K application which improved crop performance and, ultimately, grain production. This indicated that fertilization played a critical role in determining the actual grain yield and clearly emphasized the sensitivity of maize to fertilization. Similarly, significant fertilization by cropping pattern interaction effects on maize grain yield with higher values had been observed with fertilized maize–legume intercropping [40]. In contrast, no clear conclusion can be made between fertilized and unfertilized sole cropping across both cropping seasons.

4.3. Competition Indices

4.3.1. Land Equivalent Ratio (LER)

All LER values are greater than 1, which indicates an intercropping advantage over sole cropping, irrespective of fertilization and tillage practice (Table 4). Similar results were observed for mix-proportions of bean–wheat [47] and maize–faba bean [13]. In this study, interspecific facilitation was, therefore, higher than the interspecific competition, resulting in better land-use efficiency.

4.3.2. Aggressivity Index (A)

In 2016/17, A values exceeded 0 for intercropping of maize and pigeon pea under CA, and for maize and groundnut under CT despite fertilization or not (Table 4). Maize was, therefore, the more aggressive crop, the same as the maize and groundnut intercropping system under CT with no fertilization in 2017/18. This result was expected, taking into consideration that cereal crops are more competitive than grain legumes and the shading of the maize may have contributed to the reduction in the yield of the intercropped legume. These results are consistent with previous studies [17]. However, the legumes revealed a greater aggressivity than maize for the other intercropping systems with A values of less than 0.

4.3.3. Relative Crowding Coefficient (K)

A crop with the largest coefficient is the most competitive one of the two. On the basis of the means of the two years, pigeon pea was more competitive than maize under CA, and under CT, maize was more competitive than pigeon pea, irrespective of fertilization or not (Table 5). In all the other cropping systems, maize was more dominant than cowpea. Similar results were observed by other researchers [11,16]. However, groundnut was more competitive than maize, except under CT when fertilized.

4.3.4. Competitive Ratio (CR)

Considering the planted seed densities of each of the intercropping patterns and fertilization, maize was more competitive than pigeon pea and groundnut under CA, irrespective of fertilization or not, as the mean CRs for 2016/17 and 2017/18 exceeded 1 (Table 5) as confirmed by other studies [17]. This also applies for maize and groundnut intercropping under CT when fertilized. In the other intercropping systems, the legume crops were more competitive than maize.

5. Conclusions

Based on our results, significant differences were observed in soil chemical properties and maize stover and grain yield as a function of the tillage system. The soil chemical properties and stover and grain yields were consistently higher under CA than CT. This suggests that the implementation of CA in the loamy sand soil of Nhacoongo has the potential to improve soil fertility status leading to increased stover and higher grain yield for maize. There were pronounced higher stover and grain yields in the second cropping season as compared to the first cropping season.
The interactions between the tillage system and fertilization, as well as the tillage system and cropping pattern, have proven to be an appropriate combination for improving soil chemical properties and stover and grain yields. The CA practice with NPK application was a good alternative for CT to realize higher stover and grain yield in both cropping seasons. However, smallholder farmers who cannot afford inorganic fertilization could apply an intercropping system under CA to increase grain yield.
Estimated land equivalent ratios confirmed that intercropping resulted in more efficient use of land than sole cropping. Compared to sole cropping, thry favored the other calculated competition indices; mostly also intercropping.

Author Contributions

Conceptualization, Ó.C., J.J.v.T., C.C.d.P. and G.M.C.; field and laboratory analyses, Ó.C., J.J.v.T. and E.K.; writing—original draft preparation, Ó.C.; writing—review and editing, J.J.v.T., C.C.d.P., G.M.C. and E.K.; project administration, Ó.C.; funding acquisition, Ó.C. All authors have read and agreed to the published version of the manuscript.

Funding

This research was funded by the Agricultural Productivity Program for Southern Africa (APPSA) sub-project financed by the World Bank (IDA-5204-MZ). Any opinions, findings, conclusions, or recommendations expressed in this publication are those of the authors and do not necessarily reflect the view of the donors mentioned previously.

Institutional Review Board Statement

Not applicable.

Informed Consent Statement

Not applicable.

Data Availability Statement

Data supporting reported results can be provided on request.

Acknowledgments

The authors acknowledged the staff of Nhacoongo research station for their assistance in the course of the experiment and data collection.

Conflicts of Interest

The authors declare no conflict of interest. The funders had no role in the design of the study; in the collection, analyses, or interpretation of data; in the writing of the manuscript, or in the decision to publish the results.

References

  1. Maria, R.M.; Yost, R. A survey of soil fertility status of four agro-ecological zones of Mozambique. Soil Sci. 2006, 171, 902–914. [Google Scholar] [CrossRef] [Green Version]
  2. Thierfelder, C.; Matemba-Mutasa, R.; Bunderson, W.T.; Mutenje, M.; Nyamgumbo, I.; Mupangwa, W. Evaluating manual conservation agriculture system in Southern Africa. Agric. Ecosyst. Environ. 2016, 222, 112–224. [Google Scholar] [CrossRef]
  3. Famba, S.I.; Loiskandl, W.; Thierfelder, C.; Wall, P. Conservation agriculture for increasing maize yield in vulnerable production systems in Central Mozambique. Afr. Crop. Sci. Conf. Proc. 2011, 10, 255–262. [Google Scholar]
  4. Thierfelder, C.; Matemba-Mutasa, R.; Runinamhodzi, L. Yield response of maize (Zea mays L.) to conservation agriculture cropping system in Southern Africa. Soil Tillage Res. 2014, 146, 230–242. [Google Scholar] [CrossRef]
  5. Mupangwa, W.; Twomlow, S.; Walker, S.; Hove, L. Effect of minimum tillage and mulching on maize (Zea mays L.) yield and water content of clayey and sandy soils. Phys. Chem. Earth 2007, 32, 1127–1134. [Google Scholar] [CrossRef]
  6. Aziz, I.; Bangash, N.; Mahmood, T.; Islam, K.R. Impact of no till and conventional tillage practices on soil chemical properties. Pak. J. Bot. 2015, 47, 297–303. [Google Scholar]
  7. Rahman, M.H.; Okubo, O.; Sugiyama, S.; Mayland, H.F. Physical, chemical and microbiological properties of an Andisol as related to land use and tillage practice. Soil Tillage Res. 2008, 101, 10–19. [Google Scholar] [CrossRef]
  8. Buah, S.S.J.; Ibrahim, H.; Derigubah, M.; Kuzie, M.; VuuroSegtaa, J.; Bayala, J.; Zougmore, R.; Ouedraogo, M. Tillage and fertilizer effect on maize and soybean yields in the Guinea savanna zone of Ghana. Agric. Food Sec. 2017, 6, 17. [Google Scholar] [CrossRef] [Green Version]
  9. Kumar, P.; Kumar, M.; Kishor, K.; Kumar, R. Effect of nutrient management on yield and yield attributes of maize (Zea mays L.) under different tillage practices. J. Pharmacogn. Phytochem. 2018, 7, 807–810. [Google Scholar]
  10. Tabaglio, V.; Gavazzi, C.; Menta, C. The influence of no-till, conventional tillage and nitrogen fertilization on physico-chemical and biological indicators after three years of monoculture barley. Ital. J. Agron. 2008, 4, 233–240. [Google Scholar] [CrossRef] [Green Version]
  11. Bhatti, I.H.; Ahmad, R.I.A.Z.; Jabbar, A.B.D.U.L.; Nazar, M.S.; Mahmood, T. Competitive behaviour of component crops in different sesame-legume intercropping systems. Int. J. Agric. Biol. 2006, 8, 165–167. [Google Scholar]
  12. Franke, A.C.; van den Brand, G.J.; Vanlauwe, B.; Giller, K.E. Sustainable intensification through rotations with grain legume in sub-Saharan Africa: A review. Agric. Ecosyst. Environ. 2017, 261, 172–185. [Google Scholar] [CrossRef] [PubMed]
  13. Li, L.; Li, S.M.; Sun, J.H.; Zhou, L.L.; Bao, X.G.; Zhang, H.G.; Zhang, F.S. Diversity enhances agricultural productivity via rhizosphere phosphorus facilitation on phosphorus-deficient soil. Proc. Nat. Acad. Sci. USA 2007, 104, 11192–11196. [Google Scholar] [CrossRef] [Green Version]
  14. Adjei-Nsiah, S. Evaluating sustainable cropping sequences with cassava and three grain legume crops: Effects on soil fertility and maize yields in the semi-deciduous forest zone of Ghana. J. Soil Sci. Environ. Manage. 2012, 3, 49–55. [Google Scholar] [CrossRef]
  15. Naab, J.B.; Mahama, G.Y.; Yahaya, I.; Prasad, P.V.V. Conservation agricuklture improves soil quality, crop yield, and incomes of smallholder farmers in North Western Ghana. Front. Plant. Sci. 2017, 8, 996. [Google Scholar] [CrossRef] [Green Version]
  16. Wahla, I.H.; Ahmad, R.; Ehsanullah, A.A.; Ahmad, A.; Jabbar, A. Competitive functions of component crops in some barley based intercropping systems. Int. J. Agric. Biol. 2009, 11, 69–72. [Google Scholar]
  17. Jalilian, J.; Najafabadi, A.; Zardashti, M.R. Intercropping patterns and different farming systems affect the yield and yield components of safflower and bitter vetch. J. Plant. Interact. 2017, 12, 92–99. [Google Scholar] [CrossRef]
  18. FAOSTAT (Food Agriculture Organization of the United Nations). AQUASTAT—FAO Global CA Information; Food Agriculture Organization of the United Nations: Rome, Italy, 2019. [Google Scholar]
  19. Maculuve, T.V. Improving Dryland Water Productivity of Maize Through Cultivar Selection and Planting Date Optimization in Mozambique. Master’s Thesis, University of Pretoria, Pretoria, South Africa, 2011. [Google Scholar]
  20. Nkala, P. Assessing the Impacts of Conservation Agriculture on Farmer Livelihoods in Three Selected Communities in Central Mozambique. Ph.D. Thesis, University of Natural Resources and Applied Life Sciences, Vienna, Austria, 2012. [Google Scholar]
  21. Chichongue, O.; Van Tol, J.J.; Ceronio, G.M.; Du Preez, C.C. Effects of tillage systems and cropping patterns on soil physical properties in Mozambique. Agriculture 2020, 10, 448. [Google Scholar] [CrossRef]
  22. Ministério da Administração Estatal (MAE). Perfil do Distrito de Inharrime, Província de Inhambane; Ministério da Administração Estatal: Maputo, Mozambique, 2005.
  23. FAO (Food and Agriculture Organization of the United Nations). FAO/UNESCO Soil Map of the World; Food and Agriculture Organization of the United Nations: Rome, Italy, 2016. Available online: http://www.fao.org/fileadmin/user_upload/soils/docs/Soil_map_FAOUNESCO/acrobat/Africa_VI.pdf (accessed on 12 December 2019).
  24. Fey, M.V.; Mills, A.J.; Yaalon, D.H. The alternative meaning of pedoderm and its use for soil surface characterization. Geoderma 2006, 133, 474–477. [Google Scholar] [CrossRef]
  25. The Non-affiliated Soil Analysis Work Committee. Handbook of Standard Soil Testing for Advisory Purposes; Soil Science Society of South Africa: Pretoria, South Africa, 1990. [Google Scholar]
  26. Addinsoft. XLSTAT 17.3 Statistical: Data Analysis and Statistic Software for Microsoft Excel; Addinsoft: Paris, France, 2019. [Google Scholar]
  27. Busari, M.A.; Salako, F.K. Soil hydraulic properties and maize root growth after application of poultry manure under different tillage systems in Abeokuta, southwestern Nigeria. Arch. Agron. Soil Sci. 2015, 61, 223–237. [Google Scholar] [CrossRef]
  28. Chidowe, O.A.; Joshua, T.M.; Sunday, A.; Dawi, T.B.; Oluoch, M.; Zeyaur, K. Effect of tillage, fertilizer and sorghum/desmodium intercrop cultivation on soil quality and yield of sorghum in an Alfisol of a Northern Guinea Savanna of Nigeria. Int. J. Plant. Soil Sci. 2014, 3, 1490–1503. [Google Scholar] [CrossRef]
  29. Yagi, R. Occasional soil tillage, liming, and nitrogen fertilization on long-term no-tillage system. Pesq. Agropec. Bras. 2018, 53, 833–839. [Google Scholar] [CrossRef]
  30. Kahlon, M.S.; Gurpreet, S. Effect of tillage practices on soil physico-chemical characteristics and wheat straw yield. Indian J. Agric. Sci. 2014, 4, 289–293. [Google Scholar]
  31. Mazzoncini, M.; Sapkota, T.B.; Barberi, P.; Antichi, D.; Risaliti, R. Long term effect of tillage, nitrogen fertilization and cover crops on soil organic carbon and total nitrogen content. Soil Tillage Res. 2011, 114, 165–174. [Google Scholar] [CrossRef]
  32. Congreves, K.A.; Hooker, D.C.; Hayes, A.; Verhallen, E.A.; Van Eerd, L.L. Interactions of long-term nitrogen fertilizer application, crop rotation, and tillage system on soil carbon and nitrogen dynamics. Plant. Soil 2017, 410, 113–127. [Google Scholar] [CrossRef]
  33. Parihar, C.M.; Yadav, M.R.; Jat, S.L.; Singh, A.K.; Kumar, B.; Pooniya, V.; Pradhan, S.; Verma, R.K.; Jat, M.L.; Jat, R.K.; et al. Long-term conservation agriculture and intensified cropping systems: Effects on growth, yield, water, and energy-use efficiency of maize in Northerwestern India. Pedosphere 2018, 28, 952–963. [Google Scholar] [CrossRef]
  34. Tolessa, D.; Du Preez, C.C.; Ceronio, G.M. Effect of tillage system and nitrogen fertilization on the pH, extractable phosphorus and exchangeable potassium of Nitisols in Western Ethiopia. Afr. J. Agric. Res. 2014, 9, 2669–2680. [Google Scholar] [CrossRef] [Green Version]
  35. Rhoton, F.E. Influence of time on soil response to no-till practices. Soil Sci. Soc. Am. J. 2000, 64, 700–709. [Google Scholar] [CrossRef]
  36. Thomas, G.A.; Dalal, R.C.; Standley, J. No-till effects on oorganic matter, pH, cation exchange capacity and nutrient distribution in Luvisol in the semi-arid subtropics. Soil Tillage Res. 2007, 94, 295–304. [Google Scholar] [CrossRef]
  37. Thierfelder, C.; Wall, P.C. Effects of conservation agriculture techniques on infiltration and soil water content in Zambia and Zimbabwe. Soil Tillage Res. 2009, 105, 217–227. [Google Scholar] [CrossRef]
  38. Alemayehu, Y.; Shewarega, M. Growth and yield responses of maize (Zea mays L.) to different nitrogen rates under rainfed condition in Dilla Area, Southern Ethiopia. J. Nat. Sci. Res. 2015, 5, 40–46. [Google Scholar]
  39. Murungu, F.S.; Chiduza, C.; Muchaonyerwa, P. Productivity of maize after strip intercropping with leguminous crops under warm-temperate climate. Afr. J. Agric. Res. 2011, 6, 5405–5413. [Google Scholar] [CrossRef]
  40. Mampana, R.M. Cropping System Effects on Soil Water, Soil Temperature and Dryland Maize Productivity. Master’s Thesis, University of Pretoria, Pretoria, South Africa, 2014. [Google Scholar]
  41. Kihara, J.; Bationo, A.; Waswa, B.; Kimetu, J.M.; Vanlauwe, B.; Okeyo, J.; Mukalama, J.; Martius, C. Effect of reduced tillage and mineral fertilizer on maize and soybean productivity. J. Exp. Agric. 2012, 48, 159–175. [Google Scholar] [CrossRef]
  42. Miyazawa, K.; Tsuji, H.; Yamagat, M.; Nakano, H.; Nakamoto, T. Response of soybean, sugar beet, and spring wheat to the combination of reduced tillage and fertilization practices. Plant. Prod. Sci. 2004, 7, 77–87. [Google Scholar] [CrossRef]
  43. Munda, E. Effect of Intercropping and Phosphorus Application on the Growth and Yield of Sweetpotato, Groundnut and Soybean. Ph.D. Thesis, University of Stellenbosch, Stellenbosch, South Africa, 2017. [Google Scholar]
  44. Micheni, A.N.; Njeru, M.J.; Kanampiu, F.K.; Mburu, D.M.; Mugai, E.N.; Kitonyo, O.M. Response of soil microfauna to tillage methods and cropping systems in humic nitosols of eastern Kenya. Afr. J. Hortic. Sci. 2016, 10, 21–33. Available online: https://hdl.handle.net/10568/77150 (accessed on 20 May 2019).
  45. Baki, M.Z.I.; Haque, M.; Amin, R.; Matin, M.A. Impact of tillage intensity, fertilizer and manuring on yield contributing characters of rice. Sci. Agric. 2015, 10, 22–30. [Google Scholar] [CrossRef]
  46. Thierfelder, C.; Chisui, J.L.; Gama, M.; Cheesman, S.; Jere, Z.D.; Bunderson, W.T.; Eash, N.S.; Rusinamhodzi, L. Maize—based conservation agriculture systems in Malawi: Long—term trends in productivity. Field Crops Res. 2013, 142, 47–57. [Google Scholar] [CrossRef]
  47. Hauggaard-Nielsen, H.; Ambus, P.; Jensen, E.S. Evaluating pea and barley cultivars for complementary in intercropping at different levels of soil N availability. Field Crops Res. 2001, 72, 185–196. [Google Scholar] [CrossRef]
Figure 1. (a) Agro-ecological regions of Mozambique and (b) location of the Nhacoongo research station in Mozambique where the study was conducted. Created by the authors with adaptations from [21], with permission (Credits: ESRI, DigiGlobe, Earthstar Geographics and National Geographic).
Agronomy 12 01534 g001
Table 1. Details of treatments applied at the Nhacoongo experimental site.
Tillage System
Conservation Tillage (CA)Conventional Tillage (CT)
NrFertilizationCropping Pattern * Cropping Pattern
1FertilizedSole maize *Sole maize
2Sole groundnut Sole groundnuts
3Sole pigeon peaSole pigeon pea
4Sole cowpeaSole cowpea
5Maize − groundnuts intercroppingMaize − groundnuts intercropping
6Maize − pigeon pea intercroppingMaize + pigeon pea intercropping
7Maize − cowpea intercroppingMaize − cowpea intercropping
1UnfertilizedSole maizeSole maize
2Sole groundnuts Sole groundnuts
3Sole pigeon peaSole pigeon pea
4Sole cowpea Sole cowpea
5Maize − groundnuts intercroppingMaize − groundnuts intercropping
6Maize − pigeon pea intercroppingMaize − pigeon pea intercropping
7Maize − cowpea intercroppingMaize − cowpea intercropping
* Crops variety planted: maize (Zea mays L.)—Matuba; cowpea (Vigna unguiculata L.)—IT16; groundnut (Arachis hypogaea L.)—JL24; pigeon pea (Cajanus cajan L.)—00554′.
Table 2. Effect of tillage practices, fertilization, and cropping pattern on selected soil chemical properties at Nhacoongo.
pHCNC:N P CaMgKNaCEC
% mg kg−1cmol·kg−1
Tillage system
CA5.93 a0.74 a0.08 a9.1314.71 a 1.76 a0.83 a0.29 a0.27 b5.94 a
CT5.45 b0.50 b0.05 b10.279.84 b 1.06 b0.46 b0.25 b0.37 a3.25 b
HSD0.070.060.01ns2.710.140.050.030.030.57
Fertilization
Fertilized5.690.630.079.8214.10 a1.390.640.280.324.76
Unfertilized5.690.610.079.5610.44 b1.430.660.260.324.42
HSDnsnsnsns2.71nsnsnsnsns
Cropping pattern
Ppea5.630.640.07 ab11.4612.191.590.710.300.354.69
Cpea5.780.630.08 a8.3113.041.420.650.270.314.39
Gnuts5.750.600.07 ab8.9010.831.440.680.270.324.64
M_Cpea5.740.640.07 ab9.6810.271.280.610.300.304.97
M_Gnuts5.670.620.06 b10.7715.801.420.610.250.314.62
Maize5.650.630.07 ab9.7012.061.320.640.240.304.69
M_Ppea5.630.600.07 ab9.0611.711.420.650.260.334.14
HSDnsns0.02nsns nsnsnsns
Interaction
TS × Fertilization sssnssssnsss
TS × CP sssnssssnsss
CP × Fertilizationnsnsnsnssnsnsnsnsns
CV (%)3.2723.5722.2831.8658.7425.5021.2233.0826.6432.95
CA, conservation tillage practices; CT, conventional tillage practices; TS, tillage system; CP, cropping pattern, s, significant; ns, not significant; Ppea, sole pigeon pea; Gnuts, sole groundnut; Cpea, sole cowpea; Maize, sole maize; M_Ppea, maize–pigeon pea intercrop; M_Cpea, maize–cowpea intercrop; M_Gnuts, maize–groundnut intercrop; Means followed by different letters within a column are statistically significantly different at p ≤ 0.05.
Table 3. Treatments effects of tillage, fertilizer, and cropping pattern on maize grain yield at Nhacoongo.
DescriptionStover (t ha−1)Grain (t ha−1)
Tillage system2016/172017/182016/172017/18
CA3.02 a3.80 a1.32 a1.48 a
CT1.76 b2.73 b0.81 b1.38 a
L.S.D.0.340.640.220.29
Fertilization
Fertilized2.71 a3.74 a1.25 a1.75 a
Unfertilized2.08 b2.79 b0.87 b1.11 b
L.S.D.0.340.640.220.29
Cropping pattern
Maize3.02 a2.84 bc1.30 ab2.04 a
Cpea1.42 b2.46 bc0.86 b0.81 b
Gnut0.51 b1.70 c0.11 c0.64 b
Ppea1.32 b2.97 bc0.85 b0.79 b
M_Cpea3.13 a5.67 a1.42 ab1.90 a
M_Gnut3.83 a3.29 bc1.19 ab1.99 a
M_Ppea3.51 a3.93 ab1.70 a1.83 a
L.S.D.0.971.820.640.83
Interaction
Tillage system × fertilizationssss
Tillage system × cropping patternssss
Fertilization × cropping patternssss
CV (%)37.9952.0656.0654.45
CA, conservation agriculture; CT, conventional tillage; Ppea, sole pigeon pea; Gnut, sole groundnut; Cpea, sole cowpea; M_Ppea, maize–pigeon pea intercropping; M_Cpea, maize–cowpea intercropping; M_Gnut, maize–groundnut intercropping; Means followed by different letters within a column were statistically significant at p ≤ 0.05.
Table 4. Land equivalent ratios and aggressivity indices for intercropping of pigeon pea (P), cowpea (C), and groundnut (G) with maize (M) as affected by tillage practices and fertilization at Nhacoongo.
YearTillageFertilizationLand Equivalent RatioAggressivity Indices
Intercropping SystemIntercropping System
M-PM-CM-GM-PM-CM-G
2016/17CAyes1.472.242.440.7−1.18−0.91
no1.572.672.020.15−1.9−0.62
CTyes1.931.842.47−0.05−0.481.98
no1.741.952.33−0.95−0.61.6
2017/18CAyes1.742.651.71−0.61−1.94−2.34
no1.182.011.8−0.98−3.64−2.03
CTyes2.092.371.91−2.83−5.4−0.79
no1.71.862.26−1.72−4.150.4
MeanCAyes1.612.452.080.04−1.56−1.62
no1.382.341.91−0.41−2.77−1.33
CTyes2.012.112.19−1.43−2.940.59
no1.721.912.3−1.33−2.371
M-P = maize–pigeon pea, M-C = maize–cowpea, M-G = maize–groundnut.
Table 5. Relative crowding coefficients and competitive ratios for maize (M), pigeon pea (P), cowpea (C) and groundnut (G) for intercropping systems as affected by tillage practices and fertilization at Nhacoongo.
YearTillageFertilizationRelative Crowding Coefficients Competitive Ratios
Intercropping SystemIntercropping System
M-PM-CM-GM-PM-CM-G
2016/17CAyes−4.321.120.20.11−0.98−1.961.720.491.67
no−0.83−0.65−0.03−1.01−0.250.132.160.531.62
CTyes−0.490.280.09−1.35−4.71−4.31.20.861.18
no−0.84−3.43−0.410.62−0.39−2.740.360.730.43
2017/18CAyes−1.54−1.920.920.24−0.221.920.860.580.42
no0.721.960.26−2.5−0.251.20.50.120.42
CTyes−0.76−2.920.22−1.01−1.020.630.560.091.3
no1.08−1.340.04−3.730.121.690.630.021.33
MeanCAyes−2.93−0.40.560.18−0.6−0.021.290.541.04
no0.060.660.12−1.76−0.250.671.330.321.02
CTyes−0.63−1.320.16−1.18−2.87−1.840.880.481.24
no0.12−2.39−0.19−1.55−0.14−0.550.50.380.88
M = maize, P = pigeon pea, C = cowpea, G = groundnut, M-P = maize–pigeon pea, M-C = maize–cowpea, M-G = maize–groundnut.
Publisher’s Note: MDPI stays neutral with regard to jurisdictional claims in published maps and institutional affiliations.

