Article

Wheat Varietal Response to Relative SPAD Index (RSI) and Relative Normalized Difference Vegetation Index (RNDVI) under Variable Nitrogen Application and Terminal Heat Stress along with Yield Repercussion

1
Department of Plant Sciences, Faculty of Biological Sciences, Quaid-i-Azam University, Islamabad 45320, Pakistan
2
Plant Physiology Program, Crop Sciences Institute, National Agricultural Research Centre, Park Road, Islamabad 45500, Pakistan
3
Wheat Programme, National Agricultural Research Centre, Islamabad 44000, Pakistan
4
Department of Biology, Faculty of Sciences, Allama Iqbal Open University, Islamabad 44040, Pakistan
*
Authors to whom correspondence should be addressed.
Agronomy 2022, 12(7), 1538; https://doi.org/10.3390/agronomy12071538
Submission received: 3 June 2022 / Revised: 19 June 2022 / Accepted: 24 June 2022 / Published: 27 June 2022

Abstract

:
Nitrogen (N) deficiency and heat stress (HS) are major abiotic stresses that affect the quantity and quality of wheat grains. This study was conducted to examine wheat varietal response to RSI and RNDVI at the anthesis stage and their relationship to yield and yield-related traits under variable N supply and terminal heat stress. Twelve wheat varieties were evaluated in 2016–2017 and 2017–2018 at the National Agricultural Research Centre (NARC), Islamabad, Pakistan. The experiment was divided into three sets, i.e., N120 (120 kg N/ha), N60 (60 kg N/ha) and N0 (0 kg N/ha), based on the nitrogen fertilizer application. The physiological and yield-related parameters were recorded. Mean grain yield for all twelve varieties, averaged from two years of data, ranged between 1655.0 and 3890.1 kg/ha. Maximum RSI (0.99), RNDVI (1.03) and GY (3890.9 kg/ha) were recorded for FSD-08, while AARI-11 showed minimum RSI (0.50), RNDVI (0.56) and GY (1396.40 kg/ha). In the present study, mean CTD was lower, at N0 (3.57 °C), followed by N60 (5.07 °C) and N120 (5.47 °C) on average for the two years of data. The strong positive correlation of RSI and RNDVI with grain yield at R2 = 0.73 and R2 = 0.49 suggest that these parameters can be used as efficient and precise selection criteria for identifying nitrogen-use-efficient wheat varieties under terminal heat-stress conditions. This work will help the researchers to identify and develop nitrogen-use-efficient and thermos-tolerant wheat cultivars by minimizing the negative impacts of heat stress at the anthesis stage.

1. Introduction

Wheat crop covers 17% of the world crop cultivated area and contributes to approximately 20% of the total calories in the human diet [1]. It is a staple cereal crop for 40% of the world population [2]. Major constraints for wheat production are abiotic stresses, including low soil fertility, nutrient deficiency, heavy metal stress, moisture deficit, salinity stress, drought stress and heat stress [3]. Heat stress is one of major challenges that significantly impacts wheat yield, and it occurs repeatedly during the cropping season [4]. In current climatic conditions, rising temperatures are a serious threat that can cause tremendous decreases in wheat production [5]. It reduces crop yield through alterations in physiological processes, such as photosynthesis, protein denaturation, increased amount of fatty acids accumulation, membrane thermos-stability, and starch synthesis. It also accelerates vegetative growth, ultimately leading to decreased grain filling duration [6,7]. One important strategy to overcome losses due to heat stress is the selection of heat-tolerant genotypes that could be better adapted to high temperature, thus maintaining the desired yield [8]. Besides this breeding approach, wheat yield under heat stress could be maintained and improved through modified crop micro-climatic conditions, such as frequent irrigation, mulching and optimized nitrogen fertilization application [9].
The application of nitrogen fertilizer usually results in more above-ground biomass, seed production, flag leaf area and grain protein [10]. It is used for the synthesis of amino acids, signaling molecules, and storage molecules. It is also utilized in a number of metabolic processes [11]. Thus, the use of nitrogen fertilizer significantly improves crop performance and yield-related traits under normal climatic conditions as well as results in higher canopy temperature depression (CTD) values under heat stress conditions [12,13,14]. Canopy temperature depression (CTD) is defined as the difference between crop canopy temperatures from the ambient temperature [15]. It has a direct correlation with grain yield and other related traits, including NDVI, SPAD (special product analysis division) value, nitrogen-use efficiency (NUE) and biomass under a hot environment, including both rain-fed and irrigated crop cultivation areas [12]. Under a climate change scenario, SPAD and NDVI demonstrated a highly significant relationship with grain and yield-related traits, proving their reliability as indicators of nitrogen deficiency and selection of superior wheat varieties to ensure food security [16].
Varietal response for nitrogen-use efficiency and canopy temperature depression has already been reported and verified. However, currently, little information is known about varietal response to different N application rates under terminal heat stress and maintaining crop yield by lowering canopy temperature along with improvements in related agronomic and physiological traits. Therefore, this study aimed to investigate the varietal response for available nitrogen, categorizing wheat varieties as N-use efficient, moderately N-use efficient, moderately N-use inefficient and N-use inefficient, on the basis of the relative SPAD index (RSI), relative normalized difference vegetation index (RNDVI) and nitrogen agronomic efficiency (NAE). Additionally, the present research work reported varietal differences in utilizing available N under dry and hot rain-fed environmental conditions of Pakistan.

2. Materials and Methods

2.1. Experimental Site, Soil Properties, Weather Data and Plant Material

The field experiment was conducted during two consecutive wheat cropping seasons, i.e., from November 2016 to May 2017 and from November 2017 to May 2018 at the National Agricultural Research Centre (NARC), Islamabad, Pakistan. At different growth stages of wheat, minimum, maximum and mean temperatures were obtained from the Pakistan Meteorological Department (PMD) which was located in close proximity to the experimental sites during both cropping seasons (Table 1).
For soil analysis, samples from ten different sites of the field (n = 10) were collected and analyzed to record soil parameters by following [17]. Available N, available K, and available P were estimated by using the AB-DTPA method [18]. pH and EC values were recorded (by making a 10:1 w/v suspension of soil to d.H2O) along with clay, silt and textural class by using the hydrometer method as shown in Table 2 [19].
Twelve wheat varieties commonly cultivated due to their commercial significance in different provinces of Pakistan, i.e., Punjab, Khyber Pakhtunkhwa and Sindh, were selected. These varieties include FSD-08, NARC-09, PIRSBK-08, T-8, TD-1, PAKISTAN-13, AAS-11, CHAKWAL-50, GA-2002, INQILAB-91, SH-2002 and AARI-11. A detailed pedigree of these wheat varieties is given in Table 3, and the plant material was obtained from the Bioresources Conservation Institute (BCI), NARC, Islamabad.

2.2. Experimental Layout and Treatments

Selected wheat varieties were planted in a randomized complete block design (RCBD) with split plot arrangement having three replications, while the net plot size was 8 × 2 m2. The varieties grown in sub-plots were replicated in the field trials at different rates of N (urea) application from the main plots (no fertilization, optimum fertilization and full recommended fertilization at the sowing site). The experiment was divided into three sets, i.e., N120 (120 kg N/ha), N60 (60 kg N/ha) and N0 (0 kg N/ha), based on the application of N fertilizer. The urea fertilizers were applied as the source of nitrogen in three equal splits, i.e., before sowing, at the tillering stage and at the booting stage. Potassium (potassium sulfate) and phosphorous (single super phosphate) fertilizers were added at a rate of 60 kg/ha to ensure good plant vigor [20]. The crop was harvested on 12 May 2017 in the first year and on 16 May 2018 in the second cropping year, at physiological maturity. All other agronomic practices such as weeding, irrigation, etc., were kept standard except for the application rate of the nitrogen fertilizer.

2.3. Phenotypic Analysis

Phenotypic traits considered and evaluated in this study were: plant height (PH), tillers per plant (TpP), nitrogen agronomic efficiency (NAE), chlorophyll content in the form of relative SPAD index (RSI), canopy temperature as canopy temperature depression (CTD), normalized difference vegetative index (NDVI) as RNDVI, grains per spike (GpS), spike length (SL), thousand kernel weight (TKW), biological yield (BY), grain yield (GY) and harvest index (HI). Nitrogen-use efficiency (NUE) is calculated in terms of agronomic efficiency (kg/kg), which is GY per unit of nitrogen supply by following [21], and it was calculated as:
NAE   ( kg / kg ) = Gf   ( kg )  -  Gu   ( kg ) / Na   ( kg ) / Na   applied
where NAE is nitrogen agronomic efficiency, Gf is grain yield (GY) in fertilized plots, Gu is unfertilized plots, and Na is the amount of applied N fertilizer. The harvest index was calculated as the ratio of grain yield to biological yield, i.e.,
HI = GY BY   ×   100
where HI is harvest index, GY is grain yield, and BY is biological yield. Chlorophyll content (CC) was measured by using chlorophyll meter (Minolta SPAD-502: Minolta Camera Co., Tokyo, Japan), and averages were reported in triplicate from flag leaf at the anthesis stage. The relative SPAD index was calculated as the ratio of the SPAD value on one treatment to that of the heavily fertilized treatment of the same variety in the same trial, i.e., treatment by following [22];
SPAD   index   ( i ,   j ) = SPAD   ( i ,   j )   /   SPAD   ref   ( i )
where i is the variety and j is the nitrogen treatment. Crop vegetation index was assessed by using the handheld Green Seeker (crop sensor) to take a reading of crop vigor by following [23,24]. The sensor emits transitory bursts of red (visible spectrum) and near-infrared (NIR spectrum) light and records their reflected intensity from the plant. The Green Seeker displays the measured value as an NDVI reading, i.e., from 0.00 to 0.99, and the detected light strength is a direct indication of the nitrogen amount in the crop. The NDVI readings were taken from canopies of leaves at the anthesis stage. The NDVI was calculated by using the equation [25];
NDVI = ( NIRreflected  -  Redreflected ) / ( NIRreflected + Redreflected )
where RNDVI of each variety was calculated as a ratio of NDVI at treatment to that of the heavily fertilized treatment of the same variety in the same experimental trial by following [26]:
RNDVI ( i , j ) = NDVI ( i , j ) / NDVI   ref ( i )
where i is the variety, and j is the nitrogen treatment. Canopy temperature was measured at noon (13:00 to 14:00) in full sunshine with a handheld infrared thermometer (IRT; Everest Inter Science, INC, Tucson, AZ, USA) with 45° viewing angle at a horizontal line above the crop canopy to circumvent the perplexing effect of soil temperature [12]. The IRT (infrared thermometer) senses radiation emitted from crop canopies. Readings were taken at the anthesis stage to measure terminal heat stress, while CTD was calculated by the following expression [15]:
CTD = Ambient   Temperature   ( AT )  -  Canopy   temperature  
Readings of RSI, RNDVI and CTD were taken on the 5th day after the anthesis stage and during the grain-filling period, at the same timepoint.

2.4. Statistical Analysis

Two-way analysis of variance (ANOVA) was performed using Statistica Ver.7.0 (Stat Soft Inc., Tulsa, OK, USA) to find out the individual and combined effects of nitrogen treatments and wheat varieties on different phenotypic traits under investigation. Thus, based on the mentioned criteria, wheat varieties were classified as nitrogen-use efficient, moderately nitrogen-use efficient, moderately nitrogen-use inefficient, and nitrogen-use inefficient at an optimum N application rate (60 kg N/ha) by principal component analysis (PCA) using XLSTAT Version 2018 (Addinsoft). Further validation of PCA results was performed through the HACA (Hierarchical agglomerative cluster analysis) using Ward’s linkage technique and Euclidean distance measure.

3. Results

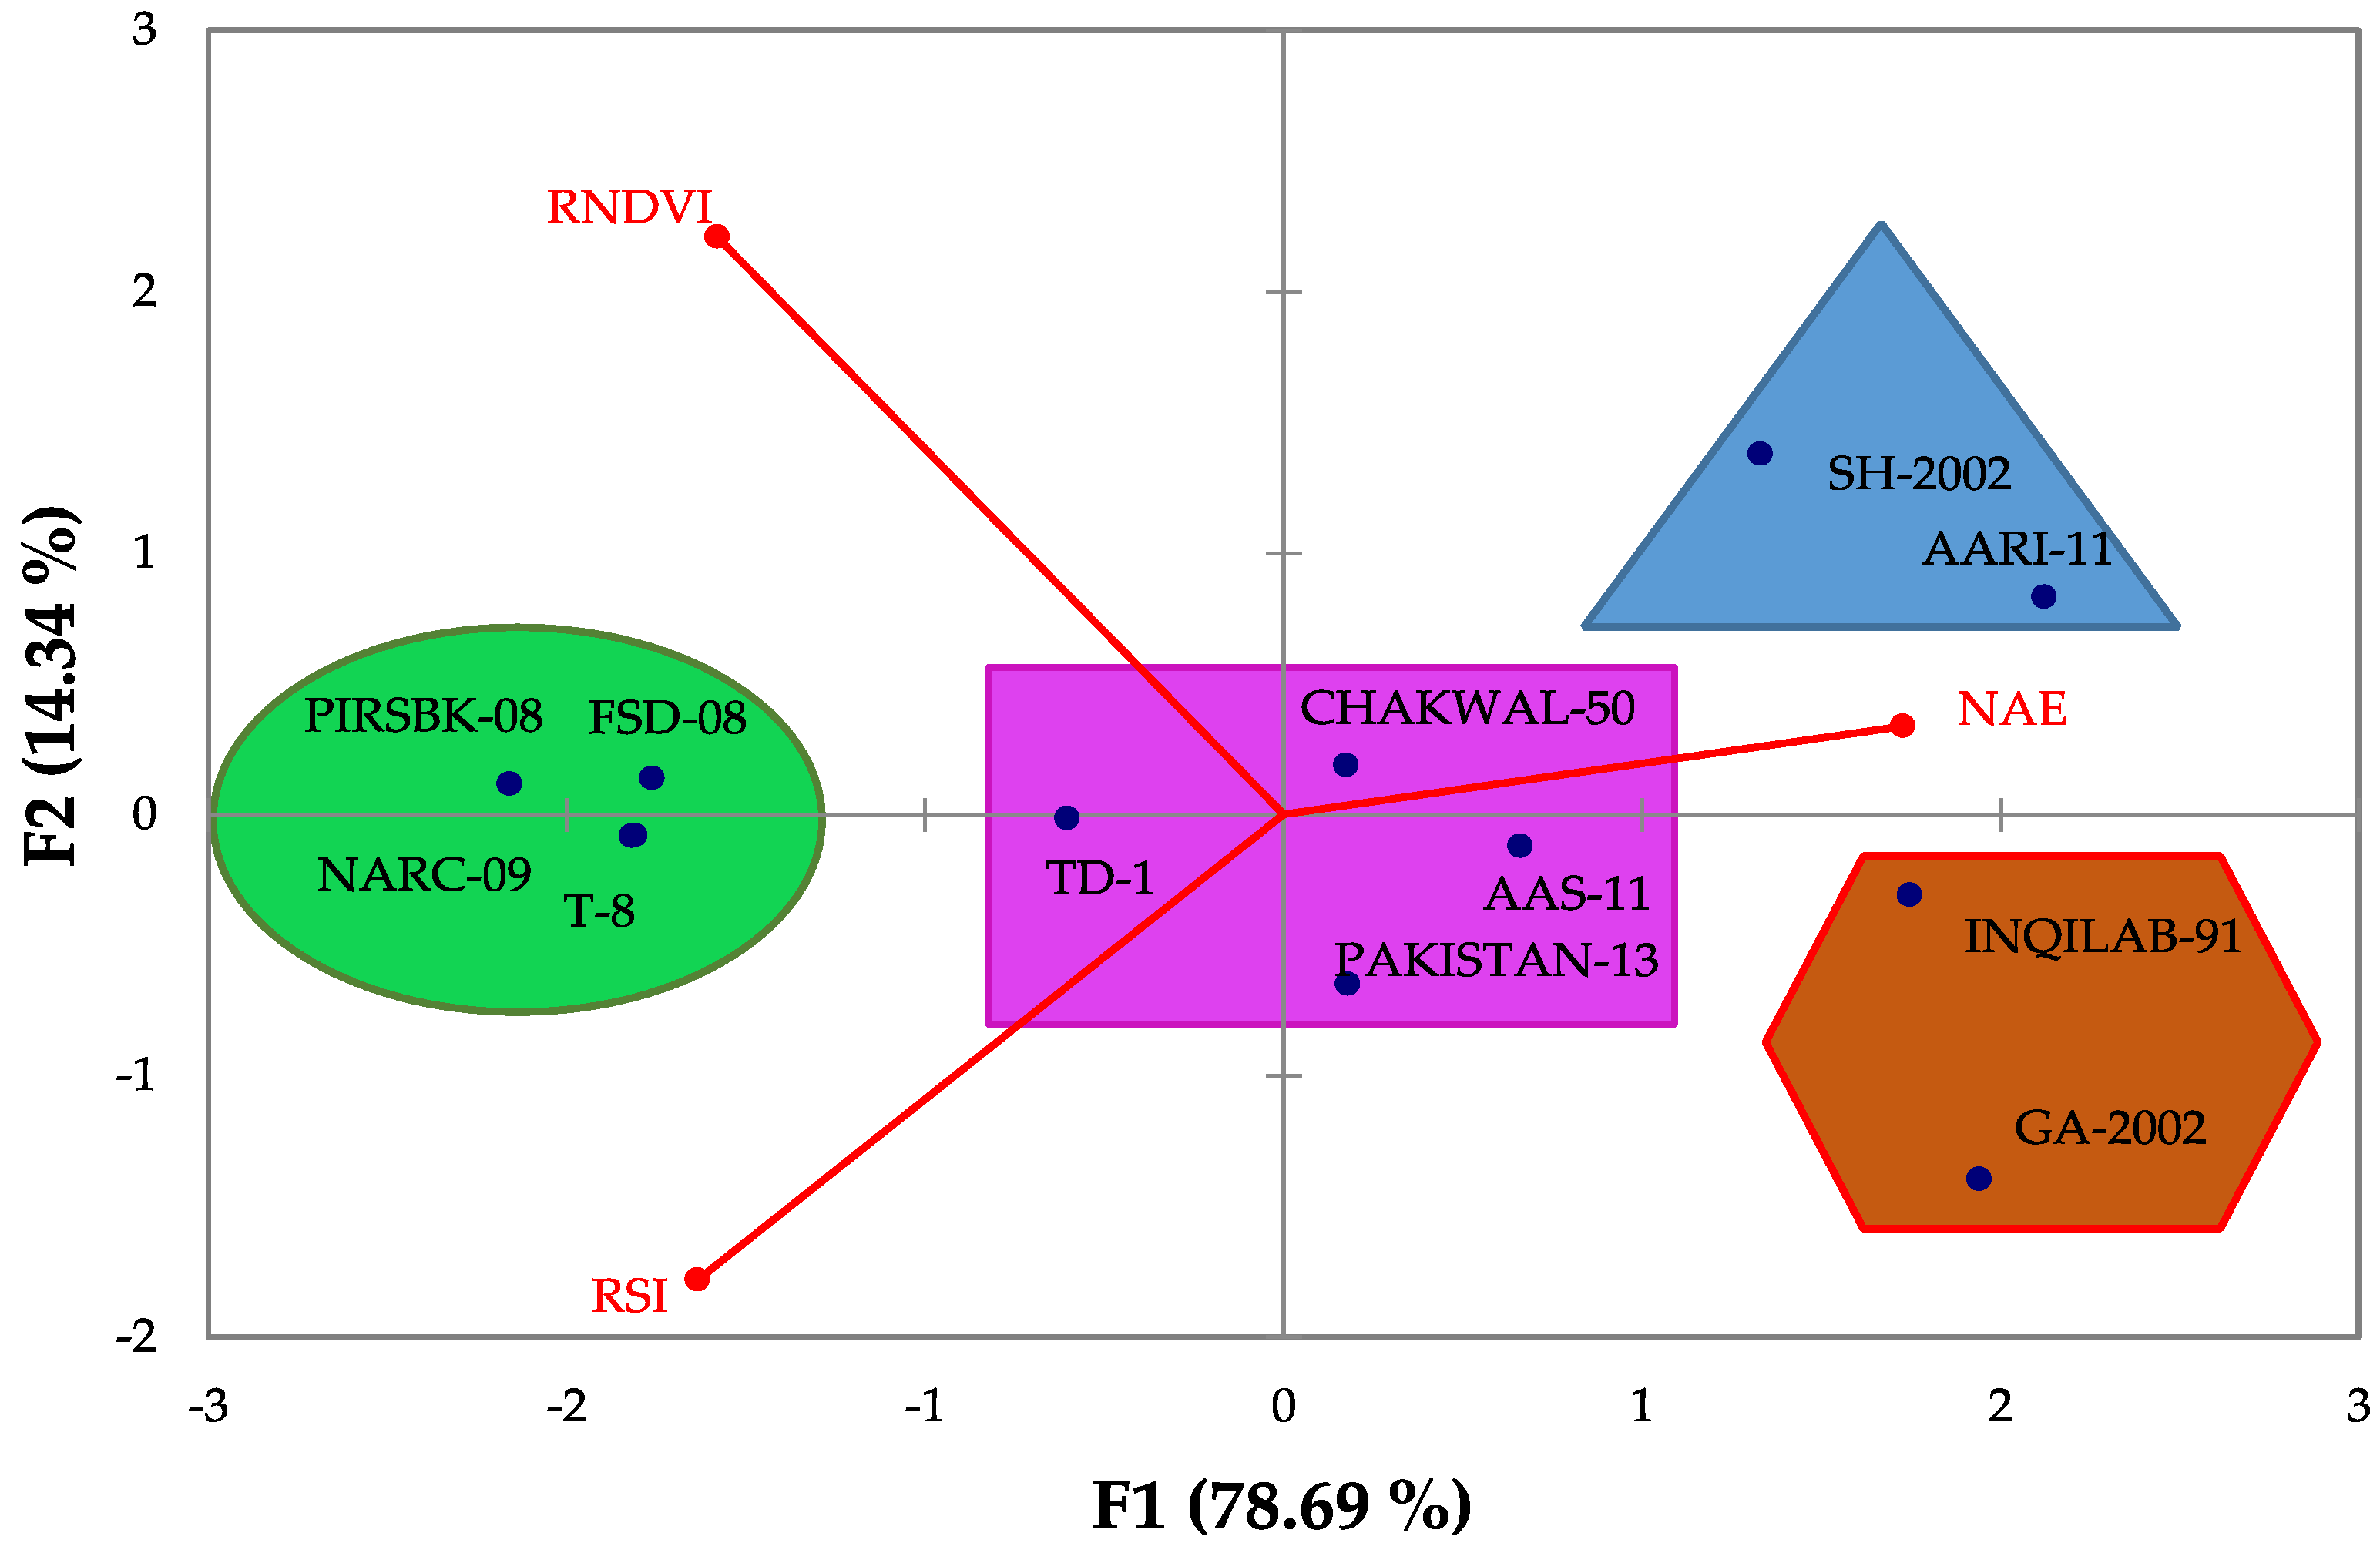
3.1. Biplot Analysis Validates Contrasting Varieties for N Response

In order to statistically validate the response of twelve wheat varieties under varied N application rates, biplot analysis was carried out on RSI, RNDVI and NAE values at an optimum N application rate, i.e., N60 averaged from two years of data by the PCA method using XLSTAT software. The biplot in Figure 1 shows the most varied wheat varieties, which account for the phenotypic variation in N response. In the PCA plot, the vectors represent agro-physiological traits, e.g., RSI, RNDVI and NAE, while their length indicated the variations of traits under consideration. The variation shown by two principal components was 78.69% (PC1) and 14.34% (PC2). From the PCA plot, it was inferred that these twelve varieties fell into four clusters and were categorized as N-use efficient, moderately N-use efficient, moderately N use-inefficient and N-use inefficient. FSD-08, PIRSBK-08, NARC-09 and T-8 are in one cluster and were positioned toward the RNDVI and RSI vectors, thus indicating impact of these traits on these four wheat varieties hence termed as nitrogen-use efficient varieties, since these parameters were good indicators of the contrasting responses of wheat varieties to N fertilizer application. These four varieties showed the highest mean RSI (0.99, 0.97, 0.94 and 0.93) and RNDVI (1.03, 1.00, 0.98 and 0.97) (Table S1). TD-1, AAS-11, PAKISTAN-13 and CHAKWAL-50 were grouped in the second cluster and were termed as moderately N-use efficient, as these were positioned in close proximity to the main axis, and these three agro-physiological vectors had moderate impact on all four varieties, with mid-ranged RSI (0.92, 0.85, 0.89 and 0.81) and RNDVI (0.95, 0.90, 0.92 and 0.85) values, as shown in Table S1. Conversely, there were two wheat varieties, i.e., GA-2002 and INQILAB-91, in the third cluster, termed as moderately N-use inefficient, as these were positioned in the opposite direction to the RSI and RNDVI vectors but are in close proximity of the NAE vector, with high mean NAE values (4.69 and 8.36 kg/kg), as shown in Table S1. The fourth cluster in the PCA plot represented N-use inefficient wheat varieties, including SH-2002 and AARI-1, and these were positioned toward the NAE vector, indicating that these varieties exhibited higher NAE values. It can also be observed from Table S1 that these N-use inefficient varieties exhibited the lowest mean values of RNDVI (SH-2002; 0.65 and AARI-11; 0.56) and RSI (SH-2002; 0.56 and AARI-11; 0.50) but revealed the highest mean values for NAE (SH-2002; 7.95 kg/kg and AARI-11; 5.66 kg/kg).

3.2. Hierarchical Agglomerative Cluster Analysis (HACA) for PCA Validation

HACA was performed on three agro-physiological parameters, including RSI, RNDVI and NAE at an optimum N application rate (N60) to categorize wheat varieties on the basis of their response to nitrogen regimes into four clusters (Figure 2). Cluster 1 (FSD-08, PIRSBK-08, NARC-09 and T-8), cluster 2 (TD-1, PAKISTAN-13, AAS-11, CHAKWAL-50), cluster 3 (INQILAB-91 and GA-2002) and cluster 4 (SH-2002 and AARI-1) were categorized as N-use efficient, moderately N-use efficient, moderately N-use inefficient and N-use inefficient varieties, respectively. The classification of 12 wheat varieties at N60 through PCA into four groups, represented by the same colors in both the PCA plot and dendrogram, was found in complete agreement with each other.

3.3. Canopy Temperature Depression under Varied Nitrogen Levels

The CTD increases with elevating N levels ultimately helped wheat varieties to lower canopy temperature to better cope with terminal heat stress. In the present study, among different N application rates, mean CTD was lower, i.e., 3.45 °C at N0 (0 kgN/ha) followed by 4.86 and 5.44 °C at N60 (60 kgN/ha) and N120 (120 kgN/ha), respectively, on an average of two years of field data of CTD for the studied varieties (Figure 3). N-use efficient varieties (FSD-08, PIRSBK-08, NARC-09 and T-8) along with one moderately N-use efficient variety, i.e., T-8, showed significant increases in CTD value with increasing N levels as compared to other studied varieties (Figure 3).

3.4. Agro-Physiological Traits

3.4.1. Plant Height (PH)

The data of PH in Table S1 revealed that PH of the crop was affected by N levels during both cropping years. Escalation in the N application rate increased PH significantly, as mean PH was 96.21 cm at N120, 94.25 cm at N60 and 91.90 cm at N0 from two years of average data. Different varieties have also shown significant variations for PH in both years. A significant increase in PH was observed for FSD-08 (112.42 cm) as compared to other varieties, while minimum PH was measured for CHAKWAL-50 (72.92 cm) in the first cropping season, and for GA-2002 (76.51 cm) in the second cropping season. Mean PH ranged from 79.49 to 112.42 cm among different varieties (Table S1).

3.4.2. Tiller per Plant (TpP)

From Table S1, it is evident that mean tiller per plant (TpP) showed non-significant variation with an upsurge in the N application rate, i.e., 4.66, 4.16 and 3.88 at N120, N60 and N0, respectively, during the first year (2016–2017), and showed a less significant level in the second year (2017–2018). Statistically significant variations have been shown by other varieties. This variation might be caused by better response of wheat varieties to the nitrogen application rate at the tillering stage, which ultimately simulates vegetative growth. At low N levels, the tillering bud remains dormant, which was evident from the data trends in this study. In both cropping seasons, FSD-08 exhibited maximum TpP versus other varieties, while minimum TpP was recorded for AARI-11 in both years (Table S1).

3.4.3. Relative SPAD Index (RSI)

Statistically significant variation was computed at different N levels, with mean values of 0.88 and 0.78 for N60 and N0, respectively, averaged from the two years of data. The relative SPAD values of wheat varieties at different N levels are illustrated in Table S1. The mean RSI values drastically increased from 0.50 to 0.99 in different wheat varieties. The highest mean RSI value was pragmatic in FSD-08, which is same (0.99) in both cropping seasons (Table S1), while the minimum mean RSI value averaged from the two years of data was detected in AARI-11.

3.4.4. Canopy Temperature Depression (CTD)

The CTD value was high at N120 in both cropping seasons. Mean values for CTD at N120, N60 and N0 were 5.44, 4.86 and 3.45 °C, respectively. Varietal response was statistically significant for CTD measurements. Mean CTD values from the two years average data ranged from 3.31 to 5.27 °C among different varieties. FSD-08 showed the maximum CTD, which was 5.22 °C in 2016–2017 and 5.31 °C in 2017–2018. Minimum CTD was calculated for AARI-11 with a mean value of 3.31 °C averaged from two years of data (Table S1).

3.4.5. Nitrogen Agronomic Efficiency (NAE)

The mean NAE values averaged from the two years of data were highest in SH-2002 (7.95 kg/kg) followed by PAKISTAN-13 (6.50 kg/kg), as both of these varieties were considered as nitrogen inefficient due to more reduction in grain yield at N0 (no fertilization) and at N60 and N120 (optimum and maximum N fertilization, respectively). FSD-08 showed a minimum mean NAE value of 2.16 Kg/kg from the two years average data due to less reduction in grain yield at N0 (no fertilization) and at N60 and N120 (optimum and maximum N fertilization, respectively) (Table S1).

3.4.6. Relative Normalized Difference Vegetation Index (RNDVI)

Statistically significant increases in RNDVI with a cumulative amount of N fertilizer was evident from Table S1, and this trend was significant in both cropping seasons, as mean values of RNDVI were 0.96 and 0.75 at N60 and N0, respectively. The significance level among varieties differed greatly for RNDVI at different N application rates. FSD-08 showed a maximum mean RNDVI value of 1.03; however, AARI-11 showed a minimum mean RNDVI value averaged from the two years of data of 0.56 (Table S1).

3.5. Yield-Related Traits

3.5.1. Grains per Spike (GpS)

GpS increased significantly with increases in N levels, as mean GpS from the two years average data were recorded as 52.44 at N120, 48.40 at N60 and 43.69 at N0, and this trend was linear for both years (Table S2). FSD-08 produced the maximum number of GpS, i.e., 64.11 (2016–2017) and 65.22 (2017–2018) as compared to other varieties. Minimum GpS was produced by AARI-11 in both years with a mean value of 38.22 (Table S2).

3.5.2. Spike Length (SL)

The differences in SL at different N levels were significant in both cropping seasons (Table S2). A significant increase in mean SL from the average of the two years of data was observed, i.e., 9.66 cm at N120 followed by 8.88 cm (N60) and 8.48 cm (N0). The studied varieties exhibited highly significant variations for SL in both years. FSD-08 showed maximum SL in both years, i.e., 11.78 cm (2016–2017) and 11.51 cm (2017–2018). T-8 and TD-1 were at par statistically with SL of 9.37 and 9.31 cm during the first cropping season, whereas a minimum SL of 7.11 and 7.32 cm was recorded for SH-2002 in both years. Mean values of SL (averaged from the two years data) ranged from 7.22 to 11.51 cm.

3.5.3. Thousand Kernel Weight (TKW)

The data of Table S2 affirmed a linear and significant increase in TKW with increases in the N application rate in both years. Mean TKW from the average of two years of data was 48.57, 44.57 and 41.24 g at N120, N60 and N0, respectively. Selected varieties showed highly significant variations for TKW in 2017–2018, while less significant variations in 2017–2018 were shown for varieties regarding N level interaction. Maximum TKW was recorded for FSD-08, i.e., 48.34 g in 2016–2017 and 48.61 g in 2017–2018. However, differences between AAS-11, PAKISTAN-13 and CHAKWAL-50 were at par statistically during the second cropping season, while minimum mean TKW was shown for AARI-11, i.e., 32.87 g from the two years average data.

3.5.4. Biological Yield (BY)

The BY was affected by N levels. The highest mean of BY from the average two years of data was calculated at N120, i.e., 11,117 kg/ha followed by N60 (10,711 kg/ha) and N0 (10,202 kg/ha). Nitrogen fertilization significantly impacted BY in both cropping seasons. Statistically significant variation was determined among different varieties in both cropping years. Maximum BY was recorded for FSD-08, i.e., 12,564 kg/ha in 2016–2017 and 13,096 kg/ha in 2017–2018. Minimum BY was chronicled for AARI-11, which is 7389 and 7383.50 kg/ha in the first cropping and second cropping season, respectively (Table S2).

3.5.5. Grain Yield (GY)

Mean GY values averaged from two years of data as 3134.15 at N120, 2662.75 at N60 and 2430.05 at N0, recorded in kg/ha, were significant (Table S2). The studied varieties exhibited highly significant variations for GY in both years. FSD-08, PIRSBK-08 and NARC-09 yielded high amounts with mean values of 3819.10, 3693.90 and 3667.90 kg/ha, respectively, as compared to other varieties in both cropping seasons. However, minimum GY was recorded for INQILAB-91, i.e., 1642.4 kg/ha in the first season and 1655 kg/ha in the second season. Mean GY from two-year averaged data ranged from 1648.70 to 3819.10 kg/ha (Table S2).

3.5.6. Harvest Index (HI)

The effects of different N levels on harvest index (HI) are presented in Table S2. HI indicated a significant increasing trend due to increases in the N application rate. The highest mean HI was computed at N120 (28.10%) followed by N60 (24.39%) and N0 (23.13%) from two-year averaged data. The studied varieties displayed significant variations for HI in both years. The highest mean for HI was calculated for T-8 (30.81%), followed by TD-1 (30.98%). The differences in HI between FSD-08, PIRSBK-08 and NARC-09 were at par statistically in both years, with less difference. In addition, minimum mean HI was recorded for INQILAB-91 and AARI-11, as both showed the same mean value of 18.51% from two-year averaged data. Mean HI values from two-year averaged data ranged 18.51 to 30.98% among studied varieties (Table S2).

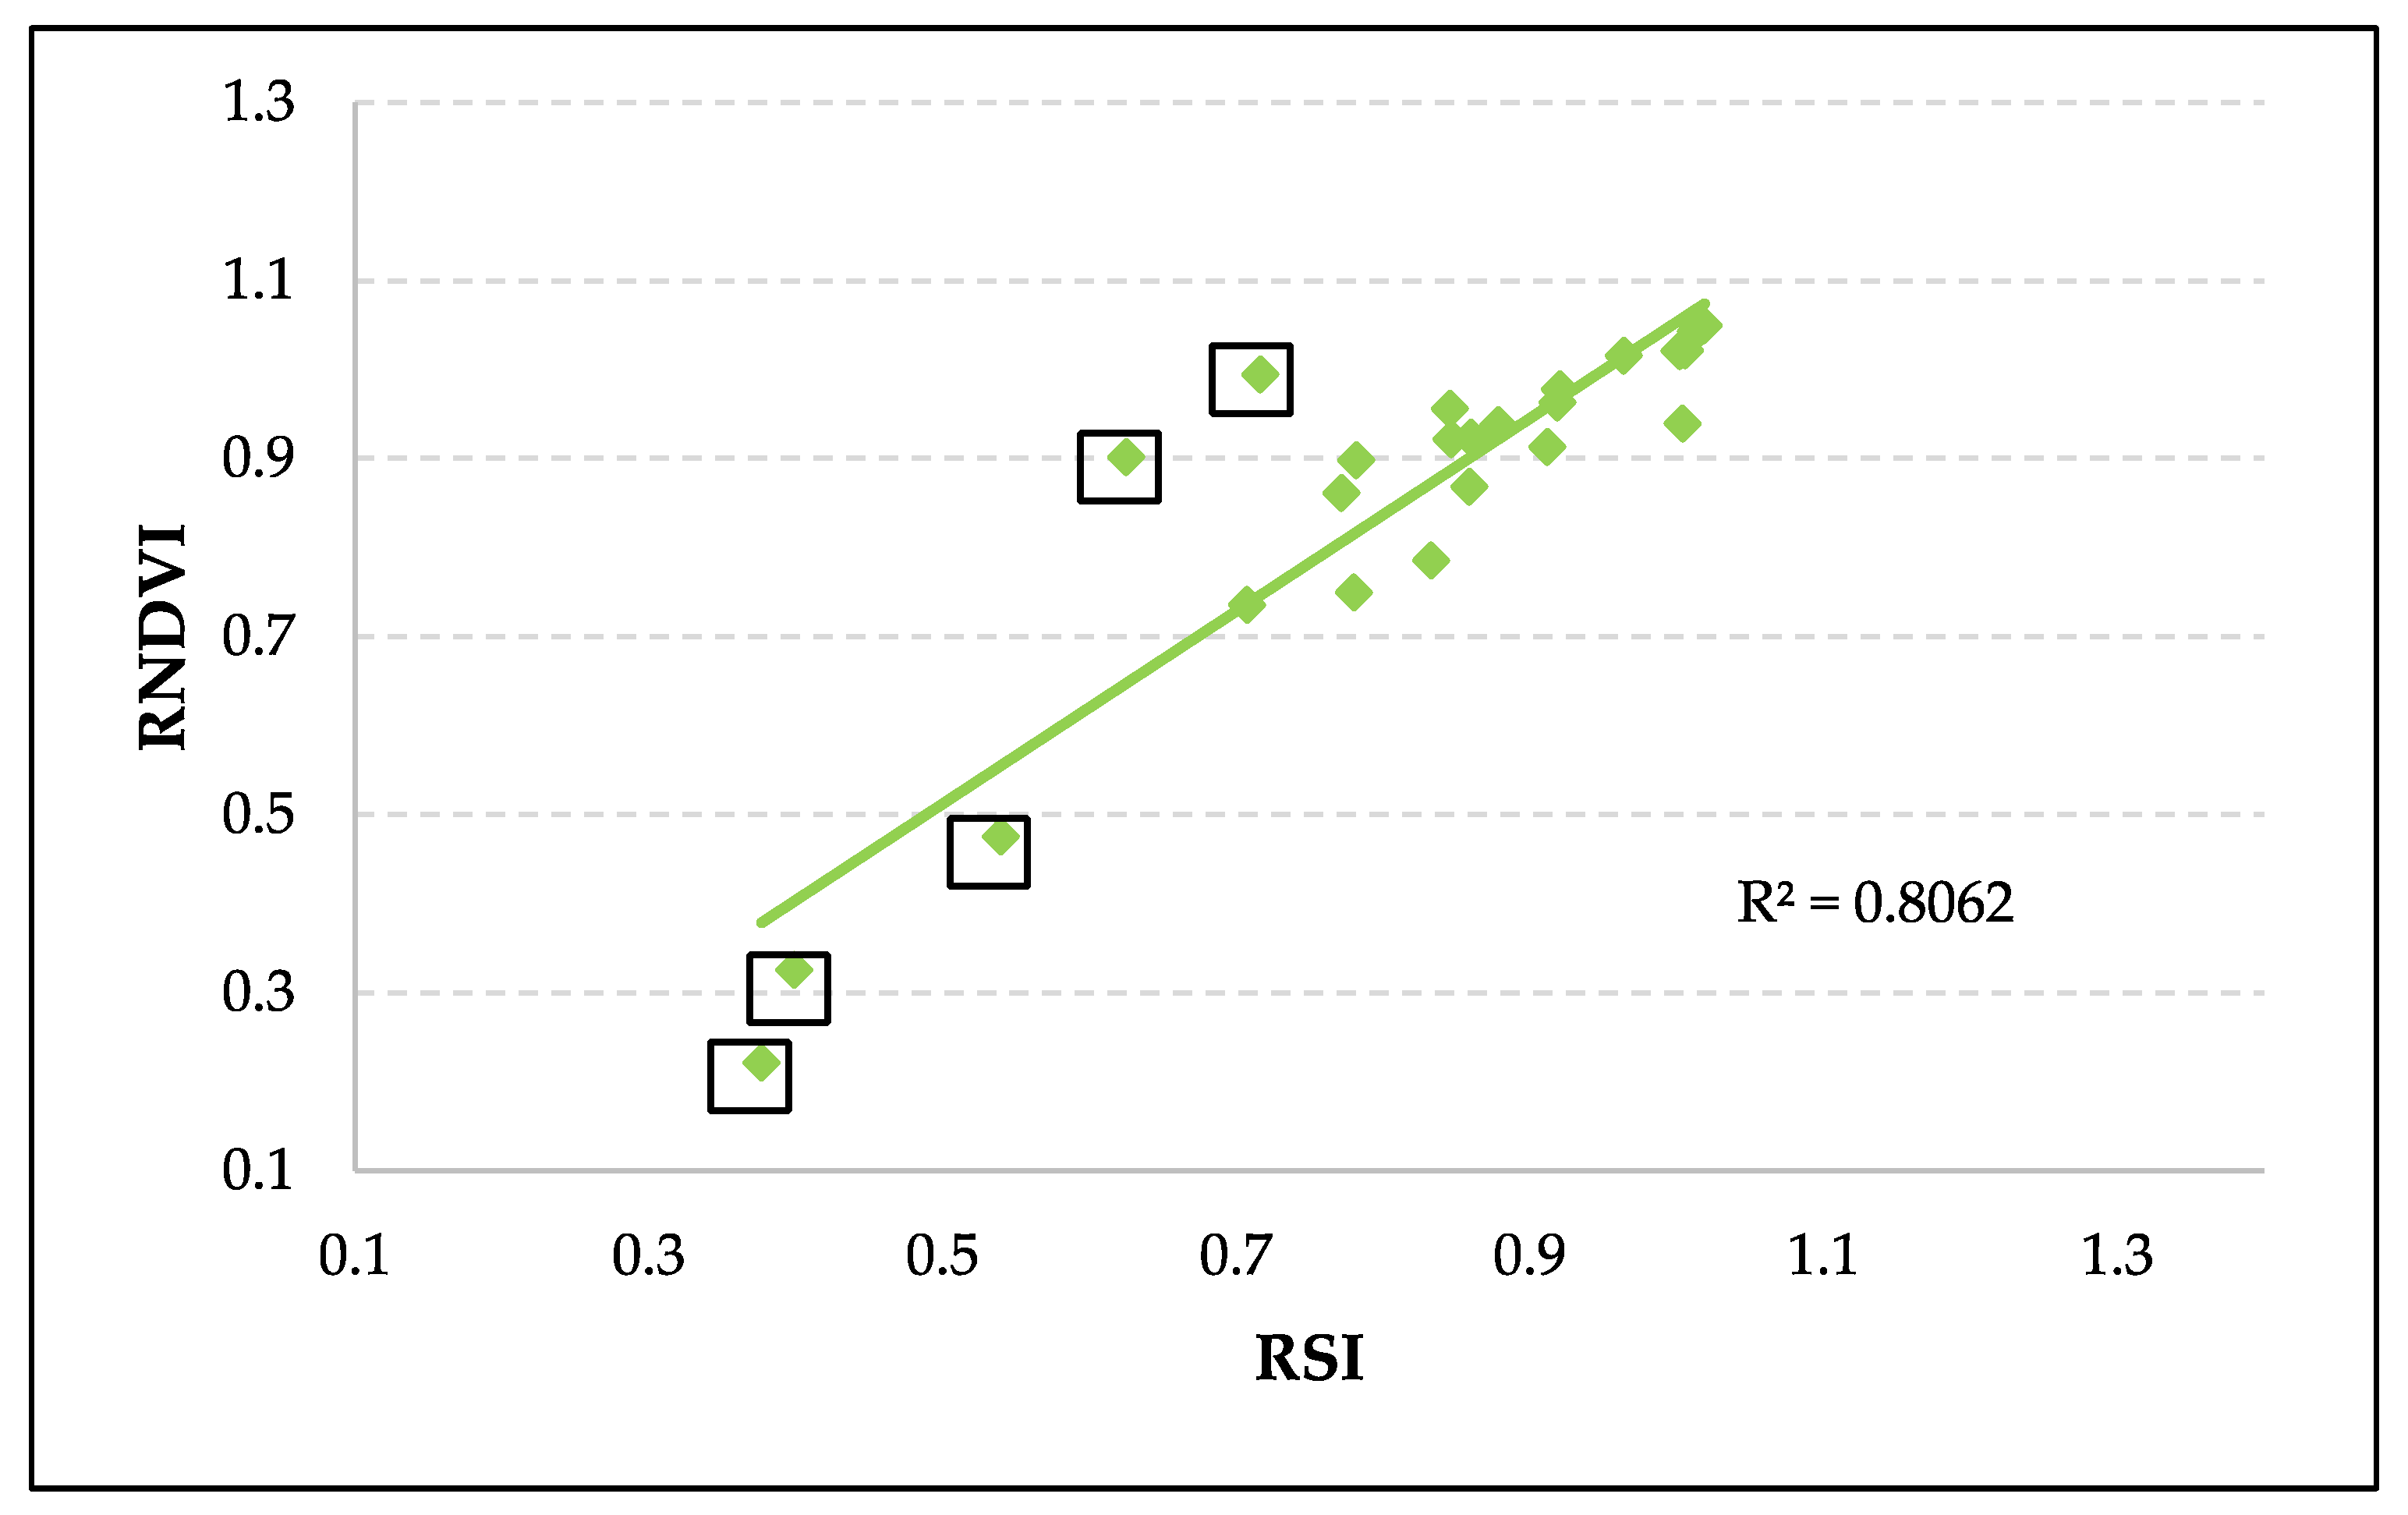
3.6. Relationship between RSI and RNDVI

A strong association was found between RSI and RNDVI (R2 = 0.8062) at different N levels (Figure 4). Highly N-use efficient and N-use inefficient varieties exhibited deviation from the trend line, which is presented by square boxes in Figure 4. Varieties revealing low RSI and RNDVI value are at the start and below the trend line (enclosed square boxes in Figure 4). These deviations corresponded to SH-2002 and AARI-11, which are N-use inefficient varieties, whereas N-use efficient varieties such as FSD-08, PIRSBK-08, NARC-09 and T-8 are above the trend line, showing high RSI and RNDVI values (enclosed square boxes in Figure 4). Thus, the results in Figure 4 were verified and are in complete agreement with the findings of the PCA plot (Figure 1), HACA (Figure 2) and means of Table 2 and Table 3. However, the rest of the varieties including TD-1, PAKISTAN-13, AAS-11, CHAKWAL-50 (moderately N-use efficient) and INQILAB-91, GA-2002 (moderately N-use inefficient) are near the trend line. A similar trend of high and low RSI and RNDVI values was observed in this study, depicting that any variety that has an RSI value must have a high RNDVI value and vice versa. Thus, hereafter, the relationship of both RSI and RNVI with other phenotypic traits is evaluated simultaneously as RSI on the primary Y-axis and RNDVI on the secondary Y-axis

3.7. Relationship between RSI, RNDVI with NAE

In this study, an inverse relationship was observed for RSI and RNDVI with NAE (Figure 5). NAE was calculated by subtracting grain yield at no nitrogen fertilization (N0) from the yield of the N treatments, i.e., N60 and N120. Thus, wheat varieties with a low NAE value will have a high RSI and RNDVI value and will be categorized as nitrogen-use efficient. A similar trend was observed in Figure 5, which demonstrated a downward trend line, while N-use efficient varieties such as FSD-08, PIRSBK-08 and NARC-09 lied above the trend line, having low mean NAE values but high mean RSI and RNDVI values and vice versa for SH-2002 and AARI-11, which are N-use inefficient varieties. The rest of the varieties demonstrated moderate variations and were closer to the trend line, being moderately N-use efficient and inefficient and having low regression values, i.e., R2 = 0.0071 and R2 = 0.0922 to depict moderately significant relationships between RNDVI/NAE and RSI/NAE.

3.8. Relationship of RSI, RNDVI with Yield and Yield-Related Traits

This study evaluated N-use efficiency by measuring N concentration in each variety at the anthesis in the form of RSI and RNDVI, indicating that these traits have a significant relationship with N supply and NUE. Figure 6 demonstrates that grain yield and yield components increased by escalating the N concentration in leaves as a consequence of more N fertilization. In the present study, RSI and RNDVI have linear relationships with applied N fertilization, with GY at R2 = 0.72 and R2 = 0.48, respectively (Figure 6A). A significant linear correlation was observed for RSI and RNDVI with BY at R2 = 0.78 and R2 = 0.56, respectively (Figure 6B). Varieties with high RSI and RNDVI values, i.e., FSD-08, PIRSBK-08, NARC-09 and T-8, also showed high GY and BY (Figure 5A,B and Table S2). There was significant association of RSI and RNDVI with PH at R2 = 0.39 and R2 = 0.31, respectively (Figure 6C). Both RSI and RNDVI displayed significant association with HI (R2 = 0.64 and R2 = 0.41, respectively) across the various N levels (Figure 6D). There were strong significant effects of RSI and RNDVI values on GpS with R2 = 0.59 and R2 = 0.44, respectively (Figure 6E). The relationship of RSI and RNDVI was positive and linear regarding SL (R2 = 0.75 and R2 = 0.49, respectively) (Figure 6F). The regression of TpP with RSI and RNDVI was linear and positive, with R2 = 0.64 and R2 = 0.43, respectively (Figure 6G). There was a positive exponential relationship with TKW regarding RSI and RNDVI (Figure 6H), with R2 = 0.82 and R2 = 0.61, respectively. A strong association was found between CTD and that of RSI and RNDVI, with regression values of 0.68 and 0.55, respectively (Figure 6I). The temperature was critical for all growth stages of the wheat crop. Hence, maintaining elevated NDVI under high temperature stress, such as terminal heat during grain filling, can be considered a sign of stress tolerance with potential use in wheat germplasm screening. High-yield wheat cultivars maintained higher NDVI values, whereas low-yield cultivars expressed a steep descent. Multiple linear regression was calculated to show the relationship of RSI and RNDVI with the agro-physiological traits of 12 wheat varieties grown under three N levels (Table S3).

4. Discussion

Nitrogen supply has a direct impact on a crop’s vigor and results in more grain yield; thus, N fertilization in wheat contributes to enhanced yield as observed in the present work under variable nitrogen and terminal heat stress conditions, which have been previously reported [10]. The results depict significant variations between N levels and varieties for RSI, RNDVI, CTD, NAE, GY, BY, and HI, along with other yield-related traits.
Developing N-use efficient wheat varieties has been a challenge for wheat breeders [27,28]. Several genes are involved that control grain yield under varied N levels, with effects of not only the genetic backgrounds but also of the environments having been reported [29]. To determine the most desirable wheat varieties, RSI and RNDVI provided more effective assessments [30,31]. Identifying wheat varieties that are more responsive to N levels and utilizing them efficiently can decrease the N fertilizer application rate, which is annually lost due to leaching into the soil and water ways. This ultimately reduced not only fertilizer input costs but also the amount of nutrient losses. It also increased crop yields [32]. In the present research work, phenotyping was performed by using precision agricultural approaches to N response-related factors, specifically RNDVI and RSI, which determined the significant positive correlation with nitrogen-use efficiency (NUE), nitrogen nutrition index (NNI) and GY [31,33]. Multivariate analytical techniques, i.e., PCA and HACA, can categorize wheat varieties in terms of N-use efficiency and inefficiency with precision and accuracy. Similar verification methodologies were already used by [34,35]. Based on these two multivariate techniques, we recommend cultivation of N-use efficient varieties, i.e., FSD-08, PIRSBK-08, NARC-09 and T-8 (cluster 1), in rain-fed areas of Pakistan, which should receive preference over that of moderately N-use efficient and inefficient varieties on account of their better response to optimum N fertilization regimes. Wheat varieties that were best adapted to a particular area and that can better exploit available resources should be preferred over other varieties cultivated in that particular area [36]. These findings were in agreement with already reported results by [32,37], in which the SPAD index (SI) and normalized difference vegetation index (NDVI) accurately predicted grain yield of wheat crop at the anthesis stage when nitrogen (N) was a limiting factor.
CTD provides a more accurate assessment, as it is calculated as the difference between crop canopy temperatures and the ambient temperature [15]. The present study indicated that a higher N dose resulted in a better thermal environment of the crop canopy. These findings are in line with already reported data that an increase in N application rate results in a decrease in CT values [12,38]. Similar results have already been reported, in which an increase in N fertilization application decreases CT (canopy temperature) in wheat crop by 1.0–2.0 °C [39].
Our results showed that N fertilization had a significant impact on all agro-physiological and yield-related traits. PH generally increased with increases in the N application rate due to elongation of the nodes in the wheat crop [40]. Differences in genetic makeup of different varieties is one of main attributes responsible for variation in PH. The results of the present study were in line with the reported data that higher levels of N significantly improved plant height, as more available nitrogen is responsible for this increase [41,42]. An appropriate amount of nitrogen application can regulate tiller number [43]. Productive tillers are the primary determinant of grain yield. Moreover, external factors such as N application rate and genetic attributes contribute to tillering capacity of any genotype. In the present study, a higher N fertilizer application resulted in greater SPAD values. These findings are in line with previously reported results [30]. The RSI value upsurges with as increasing N application rate [33]. This trend was also verified previously, in which SPAD readings have a direct correlation with leaf chlorophyll content at the anthesis stage in wheat [44]. It was observed that NAE also shows significant correlation with N application rates. More N fertilization resulted in higher RNDVI values in this study. A similar trend of an increase in NDVI value with increasing N levels was also reported in past scientific studies [31]. These results are also in line with already reported outcomes that the NDVI has a positive correlation with the biomass and amount of N accumulated in aerial plant parts [45]. Furthermore, plant density is one of the imperative factors that determines the yield in wheat crop, which can be efficiently measured with NDVI values.
The GpS increased with an increase in N application rate. A similar trend was reported that the effect of N levels on GpS was also statistically significant among different varieties [46]. GpS (grains per spike) has been used to determine the yield potential of a wheat variety [47,48]. SL improved with an increase in N fertilization rate. Longer spikes have ensured higher grain yield in wheat crops [49]. The increase in N rate significantly affected TKW. This result coincides with a previous study on the effect of N levels on TKW [50]. TKW is an important component of grain yield, as maximum TKW was obtained from wheat varieties that were sown at the highest N application rate [51]. BY is an important representative of plant overall growth and performance, as it is one of the most essential yield parameters. A trend between an increase in BY and an increase in N application rate was reported by [10]. These results are in line with many previous reports on the impact of N fertilization on wheat [48,52,53]. A significant increase in GY of staple crops, including wheat, is in dire need at present. The increase in N application rate significantly increases grain yield by improving different yield components, including spike length, grain per spike and thousand kernel weight [54]. An increasing trend in HI by elevating N levels was observed. HI is directly related with above-ground total dry matter (TDM) and is impacted by genotype and environment interaction [55].
Nitrogen response in the form of nitrogen-use efficiency (NUE), nitrogen nutrition index (NNI) and grain protein content (GPC) shows an inverse correlation with leaf chlorophyll content and vegetation index, i.e., NDVI [46,56,57]. Moreover, CTD, BY and HI have a strong association with RSI and RNDVI. This confirmed the findings of many previous studies [38,46]. For wheat, the NDVI values were significantly correlated with the GY with R2 value, ranging from 0.601 to 0.809 for the reproductive to early ripening stages, which was reported by many studies previously [22,58,59,60]. Varieties with high RSI and RNDVI values also produce higher biological and grain yield. These results are in line with previously reported findings [61]. Significant correlations of R2 = 0.71 were obtained between particular hyperspectral NDVI indices and all yield traits of wheat at the medium milk stage, which verified the results of the present study [62].

5. Conclusions

Effective nitrogen (N) fertilizer application is essential for attaining high wheat production. Identifying varieties that can utilize applied N more efficiently is a potential way of reducing N losses through leaching and denitrification. Therefore, the efficient use of nitrogen is in dire need of time. The findings of this study indicate that an increase in N fertilizer application results in better crop canopies with lower temperature ranges (as observed from the significant increase in mean CTD value from 3.45 at N0 to 5.47 at N120), as well as higher chlorophyll content (RSI) and vegetation index (RNDVI) under the heat-stressed conditions of Pakistan. Based on the findings of the present study, 60 kg N/ha is recommended for achieving higher yields from N-use efficient varieties (FSD-08, PIRSBK-08, NARC-09 and T-8), but it is not a sufficient dose for the rest of the varieties for attaining maximum yield in rain-fed conditions of Pakistan. FSD-08 was recorded to be the best variety compared to the other varieties, followed by PIRSBK-08, NARC-09 and T-8, which can be grown for economic yields, whereas SH-2002 and AARI-11 are N-use inefficient varieties with minimum mean GY productions of 1761 and 1398.7 kg/ha, respectively. However, the varietal response in utilizing N fertilizer in canopy cooling and the accumulation of more N fertilizer was reflected in the form of RSI, RNDVI and NAE in the present study. These parameters necessitate that N fertilizer application should be performed according to the efficiency and response of each variety. Moreover, this study also concluded that multivariate analytical techniques, i.e., PCA and HACA, can categorize wheat varieties in terms of N-use efficiency and inefficiency with precision and accuracy. The development of nutrient-use-efficient and heat-stress-tolerant wheat varieties using conventional and modern breeding approaches is promising. The current findings can be used to investigate the role of nitrogen fertilizer in lowering crop canopy temperature at the molecular level. In the last decade, many omics approaches have transformed research strategies that plant biotechnologists and breeders have used to investigate underlying abiotic stress tolerance mechanisms. There is a dire need for a deeper understanding of nutrient-use and heat-stress-tolerance mechanisms of different wheat varieties at the transcriptomic level. The use of genomics, proteomics, metabolomics, and transcriptomics data sets are needed rather than relying on phenomics data sets only.

Supplementary Materials

The following supporting information can be downloaded at: https://www.mdpi.com/article/10.3390/agronomy12071538/s1, Table S1: Agro-physiological traits of twelve wheat varieties affected by variable nitrogen levels; Table S2: Yield and yield-related traits of twelve wheat varieties affected by variable nitrogen levels. Table S3: Multiple Linear regression to show the relationship of RSI and RNDVI with agro-physiological traits of 12 wheat varieties grown under three N-levels.

Author Contributions

U.M.Q. conceived and supervised this research work. T.A. designed and performed the experiments and drafted the manuscript. Z.M. and S.L. facilitated in field trials and wheat phenotyping. Z.A. helped in statistical analysis/interpretation and proofread the final version of the manuscript. All authors have read and agreed to the published version of the manuscript.

Funding

This research received no external funding.

Data Availability Statement

Not applicable.

Conflicts of Interest

The authors declare no conflict of interest.

References

  1. Shiferaw, B.; Smale, M.; Braun, H.-J.; Duveiller, E.; Reynolds, M.; Muricho, G. Crops that feed the world 10. Past successes and future challenges to the role played by wheat in global food security. Food Secur. 2013, 5, 291–317. [Google Scholar] [CrossRef] [Green Version]
  2. Shewry, P.R.; Hey, S.J. The contribution of wheat to human diet and health. Food Energy Secur. 2015, 4, 178–202. [Google Scholar] [CrossRef] [PubMed]
  3. Mantri, N.; Patade, V.; Penna, S.; Ford, R.; Pang, E. Abiotic stress responses in plants: Present and future. In Abiotic Stress Responses in Plants; Springer: New York, NY, USA, 2012; pp. 1–19. [Google Scholar]
  4. Ni, Z.; Li, H.; Zhao, Y.; Peng, H.; Hu, Z.; Xin, M.; Sun, Q. Genetic improvement of heat tolerance in wheat: Recent progress in understanding the underlying molecular mechanisms. Crop J. 2018, 6, 32–41. [Google Scholar] [CrossRef]
  5. Yadav, M.R.; Choudhary, M.; Singh, J.; Lal, M.K.; Jha, P.K.; Udawat, P.; Gupta, N.K.; Rajput, V.D.; Garg, N.K.; Maheshwari, C. Impacts, Tolerance, Adaptation, and Mitigation of Heat Stress on Wheat under Changing Climates. Int. J. Mol. Sci. 2022, 23, 2838. [Google Scholar] [CrossRef] [PubMed]
  6. Zahedi, M.; Jenner, C.F. Analysis of effects in wheat of high temperature on grain filling attributes estimated from mathematical models of grain filling. J. Agric. Sci. 2003, 141, 203–212. [Google Scholar] [CrossRef] [Green Version]
  7. Tahir, I.; Nakata, N. Remobilization of nitrogen and carbohydrate from stems of bread wheat in response to heat stress during grain filling. J. Agron. Crop Sci. 2005, 191, 106–115. [Google Scholar] [CrossRef]
  8. Yang, J.; Sears, R.; Gill, B.; Paulsen, G. Genotypic differences in utilization of assimilate sources during maturation of wheat under chronic heat and heat shock stresses. Euphytica 2002, 125, 179–188. [Google Scholar] [CrossRef]
  9. Kingra, P.; Kaur, H. Microclimatic Modifications to Manage Extreme Weather Vulnerability and Climatic Risks in Crop Production. J. Agric. Phys. 2017, 17, 1–15. [Google Scholar]
  10. Adnan, M.; Shah, Z.; Ullah, H.; Khan, B.; Arshad, M.; Mian, I.A.; Khan, G.A.; Alam, M.; Basir, A.; Ali, M. Yield response of wheat to nitrogen and potassium fertilization. Pure Appl. Biol. 2016, 5, 1. [Google Scholar] [CrossRef]
  11. Sun, H.; Qian, Q.; Wu, K.; Luo, J.; Wang, S.; Zhang, C.; Ma, Y.; Liu, Q.; Huang, X.; Yuan, Q. Heterotrimeric G proteins regulate nitrogen-use efficiency in rice. Nat. Genet. 2014, 46, 652–656. [Google Scholar] [CrossRef]
  12. Elbashier, E.M.; Tahir, I.S.; Saad, A.S.I.; Ibrahim, M.A. Wheat genotypic variability in utilizing nitrogen fertilizer for a cooler canopy under a heat-stressed irrigated environment. Afr. J. Agric. Res. 2012, 7, 385–392. [Google Scholar]
  13. Modhej, A.; Naderi, A.; Emam, Y.; Aynehband, A.; Normohamadi, G. Effects of post-anthesis heat stress and nitrogen levels on grain yield in wheat (T. durum and T. aestivum) genotypes. Int. J. Plant Prod. 2012, 2, 257–268. [Google Scholar]
  14. Ali, Z. Morph-Physiological Traits Associated with Moisture and Nitrogen Stresses in Some Wheat (Triticum aestivum L.) Genotypes. Ph.D. Thesis, Gezira University, Wad Madani, Sudan, 2000. [Google Scholar]
  15. Rosyara, U.; Vromman, D.; Duveiller, E. Canopy temperature depression as an indication of correlative measure of spot blotch resistance and heat stress tolerance in spring wheat. J. Plant Pathol. 2008, 90, 103–107. [Google Scholar]
  16. Kizilgeci, F.; Yildirim, M.; Islam, M.S.; Ratnasekera, D.; Iqbal, M.A.; Sabagh, A.E. Normalized difference vegetation index and chlorophyll content for precision nitrogen management in durum wheat cultivars under semi-arid conditions. Sustainability 2021, 13, 3725. [Google Scholar] [CrossRef]
  17. Chen, M.; Ma, L.Q. Comparison of three aqua regia digestion methods for twenty Florida soils. Soil Sci. Soc. Am. J. 2001, 65, 491–499. [Google Scholar] [CrossRef] [Green Version]
  18. Soltanpour, P.; Schwab, A. A new soil test for simultaneous extraction of macro-and micro-nutrients in alkaline soils. Commun. Soil Sci. 1977, 8, 195–207. [Google Scholar] [CrossRef]
  19. Bouyoucos, G.J. Directions for making mechanical analysis of soils by the hydrometer method. Soil Sci. 1936, 42, 225–230. [Google Scholar] [CrossRef]
  20. Pask, A.; Pietragalla, J.; Mullan, D.; Reynolds, M. Physiological Breeding II: A Field Guide to Wheat Phenotyping; Cimmyt: El Batán, Mexico, 2012. [Google Scholar]
  21. Fageria, N.K.; Baligar, V.C. Enhancing Nitrogen Use Efficiency in Crop Plants. Adv. Agron. J. 2005, 88, 97–185. [Google Scholar]
  22. Prost, L.; Jeuffroy, M.-H. Replacing the nitrogen nutrition index by the chlorophyll meter to assess wheat N status. Agron. Sustain. Dev. 2007, 27, 321–330. [Google Scholar] [CrossRef] [Green Version]
  23. Gamon, J.A.; Field, C.B.; Goulden, M.L.; Griffin, K.L.; Hartley, A.E.; Joel, G.; Penuelas, J.; Valentini, R. Relationships between NDVI, canopy structure, and photosynthesis in three Californian vegetation types. Ecol. Appl. J. 1995, 5, 28–41. [Google Scholar] [CrossRef] [Green Version]
  24. Raun, W.R.; Solie, J.B.; Johnson, G.V.; Stone, M.L.; Mullen, R.W.; Freeman, K.W.; Thomason, W.E.; Lukina, E.V. Improving nitrogen use efficiency in cereal grain production with optical sensing and variable rate application. Agron. J. 2002, 94, 815–820. [Google Scholar] [CrossRef] [Green Version]
  25. Gandhi, G.M.; Parthiban, S.; Thummalu, N.; Christy, A. NDVI: Vegetation change detection using remote sensing and GIS—A case study of Vellore District. Procedia Comput. Sci. 2015, 57, 1199–1210. [Google Scholar] [CrossRef] [Green Version]
  26. Cao, Q.; Miao, Y.; Gao, X.; Liu, B.; Feng, G.; Yue, S. Estimating the nitrogen nutrition index of winter wheat using an active canopy sensor in the North China Plain. In Proceedings of the 2012 First International Conference on Agro-Geoinformatics (Agro-Geoinformatics), Shanghai, China, 2–4 August 2012; IEEE: Piscataway, NJ, USA, 2012; pp. 1–5. [Google Scholar]
  27. Cormier, F.; Foulkes, J.; Hirel, B.; Gouache, D.; Moënne-Loccoz, Y.; Le Gouis, J. Breeding for increased nitrogen-use efficiency: A review for wheat (T. aestivum L.). Plant Breed. 2016, 135, 255–278. [Google Scholar] [CrossRef] [Green Version]
  28. Prey, L.; Kipp, S.; Hu, Y.; Schmidhalter, U. Nitrogen Use Efficiency and Carbon Traits of High-Yielding European Hybrid vs. Line Winter Wheat Cultivars: Potentials and Limitations. Front. Plant Sci. 2018, 9, 1988. [Google Scholar] [CrossRef] [Green Version]
  29. Mahjourimajd, S.; Taylor, J.; Sznajder, B.; Timmins, A.; Shahinnia, F.; Rengel, Z.; Khabaz-Saberi, H.; Kuchel, H.; Okamoto, M.; Langridge, P. Genetic Basis for Variation in Wheat Grain Yield in Response to Varying Nitrogen Application. PLoS ONE 2015, 11, e0159374. [Google Scholar] [CrossRef] [Green Version]
  30. Islam, M.R.; Haque, K.S.; Akter, N.; Karim, M.A. Leaf chlorophyll dynamics in wheat based on SPAD meter reading and its relationship with grain yield. J. Sci. Agric. 2014, 8, 13–18. [Google Scholar]
  31. Sultana, S.R.; Ali, A.; Ahmad, A.; Mubeen, M.; Zia-Ul-Haq, M.; Ahmad, S.; Ercisli, S.; Jaafar, H.Z. Normalized difference vegetation index as a tool for wheat yield estimation: A case study from Faisalabad, Pakistan. Sci. World J. 2014, 2014, 725326. [Google Scholar] [CrossRef] [Green Version]
  32. Rosenstock, T.S.; Liptzin, D.; Six, J.; Tomich, T.P. Nitrogen fertilizer use in California: Assessing the data, trends and a way forward. Calif. Agric. 2013, 67, 68–79. [Google Scholar] [CrossRef] [Green Version]
  33. Debaeke, P.; Rouet, P.; Justes, E. Relationship between the Normalized SPAD Index and the Nitrogen Nutrition Index: Application to Durum Wheat. J. Plant Nutr. 2006, 29, 75–92. [Google Scholar] [CrossRef]
  34. Wolf, A.; Kirschner, K.N. Principal component and clustering analysis on molecular dynamics data of the ribosomal L11·23S subdomain. J. Mol. Model. 2013, 19, 539–549. [Google Scholar] [CrossRef] [Green Version]
  35. Ali, Z.; Mujeeb-Kazi, A.; Quraishi, U.M.; Malik, R.N. Deciphering adverse effects of heavy metals on diverse wheat germplasm on irrigation with urban wastewater of mixed municipal-industrial origin. Environ. Sci. Pollut. Res. 2018, 25, 18462–18475. [Google Scholar] [CrossRef] [PubMed]
  36. Rehman, A.; Jingdong, L.; Shahzad, B.; Chandio, A.A.; Hussain, I.; Nabi, G.; Iqbal, M.S. Economic perspectives of major field crops of Pakistan: An empirical study. Pac. Sci. Rev. B Int. J. Humanit. Soc. Sci. 2015, 1, 145–158. [Google Scholar] [CrossRef] [Green Version]
  37. Gaju, O.; DeSilva, J.; Carvalho, P.; Hawkesford, M.J.; Griffiths, S.; Greenland, A.; Foulkes, M.J. Leaf photosynthesis and associations with grain yield, biomass and nitrogen-use efficiency in landraces, synthetic-derived lines and cultivars in wheat. Field Crops Res. 2016, 193, 1–15. [Google Scholar] [CrossRef]
  38. Ward, N.C. Nitrogen and Water Effects on Canopy Sensor Measurements for Site-Specific Management of Crops. Ph.D. Thesis, University of Nebraska, Lincoln, NE, USA, 2015. [Google Scholar]
  39. Lepekhov, S.B. Canopy temperature depression for drought-and heat stress tolerance in wheat breeding. Vavilov J. Genet. Breed. 2022, 6, 196. [Google Scholar]
  40. Mosanaei, H.; Ajamnorozi, H.; Dadashi, M.R.; Faraji, A.; Pessarakli, M. Improvement effect of nitrogen fertilizer and plant density on wheat (Triticum aestivum L.) seed deterioration and yield. Emir. J. Food Agric. 2017, 29, 899–910. [Google Scholar] [CrossRef] [Green Version]
  41. Sultana, S.R.; Ahmad, A.; Wajid, A.; Akhtar, J. Estimating growth and yield related traits of wheat genotypes under variable nitrogen application in semi-arid conditions. Pak. J. Life Soc. Sci. 2013, 11, 118–125. [Google Scholar]
  42. Mattas, K.; Uppal, R.; Singh, R. Effect of varieties and nitrogen management on the growth, yield and nitrogen uptake of durum wheat. Res. J. Agric. Sci. 2011, 2, 376–380. [Google Scholar]
  43. Yang, D.; Cai, T.; Luo, Y.; Wang, Z. Optimizing plant density and nitrogen application to manipulate tiller growth and increase grain yield and nitrogen-use efficiency in winter wheat. PeerJ 2019, 7, e6484. [Google Scholar] [CrossRef]
  44. Arregui, L.; Lasa, B.; Lafarga, A.; Irañeta, I.; Baroja, E.; Quemada, M. Evaluation of chlorophyll meters as tools for N fertilization in winter wheat under humid Mediterranean conditions. Eur. J. Agron. 2006, 24, 140–148. [Google Scholar] [CrossRef]
  45. Vian, A.L.; Bredemeier, C.; Turra, M.A.; da Silva Giordano, C.P.; Fochesatto, E.; da Silva, J.A.; Drum, M.A. Nitrogen management in wheat based on the normalized difference vegetation index (NDVI). Ciência Rural 2018, 48. [Google Scholar] [CrossRef]
  46. Mandic, V.; Krnjaja, V.; Tomic, Z.; Bijelic, Z.; Simic, A.; Ruzic Muslic, D.; Gogic, M. Nitrogen fertilizer influence on wheat yield and use efficiency under different environmental conditions. Chil. J. Agric. Res. 2015, 75, 92–97. [Google Scholar] [CrossRef] [Green Version]
  47. Afridi, M.Z.; Jan, M.T.; Arif, M.; Jan, A. Wheat yielding components response to different levels of fertilizer-N application time and decapitation stress. Sarhad J. Agric. 2010, 26, 499–506. [Google Scholar]
  48. Guarda, G.; Padovan, S.; Delogu, G. Grain yield, nitrogen-use efficiency and baking quality of old and modern Italian bread-wheat cultivars grown at different nitrogen levels. Eur. J. Agron. 2004, 21, 181–192. [Google Scholar] [CrossRef]
  49. Khalil, S.K.; Khan, F.; Rehman, A.; Muhammad, F.; Amanullah, K.A.; Shah, M.; Khan, H. Dual purpose wheat for forage and grain yield in response to cutting, seed rate and nitrogen. Pak. J. Bot. 2011, 43, 937–947. [Google Scholar]
  50. Ruza, A.; Linina, A. The influence of cultivar, weather conditions and nitrogen fertilizer on winter wheat grain yield. Agron. Res. 2018, 16, 147–156. [Google Scholar]
  51. Hussain, M.I.; Shah, S.H.; Hussain, S.; Iqbal, K. Growth, yield and quality response of three wheat (Triticum aestivum L.) varieties to different levels of N, P and K. Int. J. Agric. Biol. 2002, 4, 362–364. [Google Scholar]
  52. Hussain, I.; Khan, M.A.; Khan, E.A. Bread wheat varieties as influenced by different nitrogen levels. J. Zhejiang Univ. Sci. B 2006, 7, 70–78. [Google Scholar] [CrossRef]
  53. Maqsood, M.; Ali, A.; Aslam, Z.; Saeed, M.; Ahmad, S. Effect of irrigation and nitrogen levels on grain yield and quality of wheat (Triticum aestivum). Int. J. Agric. Biol. 2002, 4, 164–165. [Google Scholar]
  54. Tian, Z.; Jing, Q.; Dai, T.; Jiang, D.; Cao, W. Effects of genetic improvements on grain yield and agronomic traits of winter wheat in the Yangtze River Basin of China. Field Crops Res. 2011, 124, 417–425. [Google Scholar] [CrossRef]
  55. Maqsood, M.; Shehzad, M.A.; Ramzan, Y.; Sattar, A. Effect of nitrogen nutrition on growth, yield and radiation use efficiency of different wheat (Triticum aestivum L.) cultivars. Pak. J. Agric. Sci. 2014, 51, 451–458. [Google Scholar]
  56. Nguyen, G.N.; Panozzo, J.; Spangenberg, G.; Kant, S. Phenotyping approaches to evaluate nitrogen-use efficiency related traits of diverse wheat varieties under field conditions. Crop Pasture Sci. 2016, 67, 1139–1148. [Google Scholar] [CrossRef]
  57. Arnall, D.B.; Raun, W.; Solie, J.; Stone, M.; Johnson, G.; Girma, K.; Freeman, K.; Teal, R.; Martin, K. Relationship between coefficient of variation measured by spectral reflectance and plant density at early growth stages in winter wheat. J. Plant Nutr. 2006, 29, 1983–1997. [Google Scholar] [CrossRef]
  58. Ali, M.; Al-Ani, A.; Eamus, D.; Tan, D.K. Leaf nitrogen determination using non-destructive techniques—A review. J. Plant Nutr. 2017, 40, 928–953. [Google Scholar] [CrossRef]
  59. Yang, H.; Yang, J.; Li, F.; Liu, N. Replacing the Nitrogen Nutrition Index by SPAD Values and Analysis of Effect Factors for Estimating Rice Nitrogen Status. Agron. J. 2018, 110, 545–554. [Google Scholar] [CrossRef]
  60. Fiez, T.E.; Pan, W.L.; Miller, B.C. Nitrogen use efficiency of winter wheat among landscape positions. Soil Sci. Soc. Am. J. 1995, 59, 1666–1671. [Google Scholar] [CrossRef]
  61. Mansour, E.; Merwad, A.; Yasin, M.; Abdul-Hamid, M.; El-Sobky, E.; Oraby, H. Nitrogen use efficiency in spring wheat: Genotypic variation and grain yield response under sandy soil conditions. J. Agric. Sci. 2017, 155, 1407–1423. [Google Scholar] [CrossRef]
  62. Cabrera-Bosquet, L.; Molero, G.; Stellacci, A.; Bort, J.; Nogues, S.; Araus, J. NDVI as a potential tool for predicting biomass, plant nitrogen content and growth in wheat genotypes subjected to different water and nitrogen conditions. Cereal Res. Commun. 2011, 39, 147–159. [Google Scholar] [CrossRef]
Figure 1. PCA analyses organized varieties at moderate N application (N60, 60 kg N/ha) into four groups represented by green (N-use efficient), pink (moderately N-use efficient), brown (moderately N-use inefficient) and blue (N-use inefficient) based on mean RSI, RNDVI and NAE.
Agronomy 12 01538 g001
Figure 2. Dendrogram analysis showing four clusters, i.e., cluster 1 (N-use efficient), cluster 2 (moderately N-use efficient), cluster 3 (moderately N-use inefficient) and cluster 4 (N-use inefficient).
Agronomy 12 01538 g002
Figure 3. Comparison of mean canopy temperature depression (°C) of twelve wheat varieties cultivated under three different N levels for two years at the National Agricultural Research Centre.
Agronomy 12 01538 g003
Figure 4. The relationship between relative SPAD index (RSI) and relative normalized difference vegetation index (RNDVI) of 12 wheat varieties cultivated under three N levels. The points marked with a square box show deviation of the varieties from the regression trend line.
Agronomy 12 01538 g004
Figure 5. The relationship of relative SPAD index (RSI) and relative normalized difference vegetation index (RNDVI) with nitrogen agronomic efficiency (NAE) of 12 wheat varieties cultivated under three N levels. The points marked with a square box show deviation of the varieties from the regression trend line.
Agronomy 12 01538 g005
Figure 6. The relationship of RSI and RNDVI with agro-physiological traits of 12 wheat varieties grown under three N levels: (A) grain yield (GY), (B) biological yield (BY), (C) plant height (PH), (D) harvest index (HI), (E) grains per spike (GpS), (F) spike length (SL), (G) tiller per plant (TpP), (H) thousand kernel weight (TKW), (I) canopy temperature depression (CTD). Agronomy 12 01538 i001, RSI; Agronomy 12 01538 i002, RNDVI.
Agronomy 12 01538 g006
Table 1. Minimum, maximum and mean temperatures (°C) for 2016–2017 and 2017–2018 at the National Agricultural Research Centre, Islamabad.
PeriodFirst Year (2016–2017)Second Year (2017–2018)Growth Stage
MinMaxMeanMinMaxMean
November7211432011.5Sowing
December42213−2188Vegetative
January−5123.50178.5Tillering
February0168−2167Tillering/booting
March−22310.522413Heading/anthesis
April4281642615Grain filling
May10281992818.5Maturity
Table 2. Physico-chemical properties of soil at the experimental site (n = 10).
ParametersUnitMean ± SDRange
NO31−-Nmg/kg5.88 ± 0.145.18–5.98
Kmg/kg154.51 ± 4.94151–160
PO42−-Pmg/kg3.08 ± 0.182.91–3.21
pH-8.07 ± 0.127.99–8.11
ECdS/m0.48 ± 0.070.39–0.54
Clay%17.51 ± 3.2514.9–19.92
Silt%37.05 ± 3.4634.21–39.52
Sand%49.25 ± 2.8946.82–51.36
Textural class-LoamLoam
Table 3. Detailed description of studied plant material.
No.Variety NamePedigree
1FSD-08PBW65/2Pastor
2NARC-09INQALAB 912/TUKURU
3PIRSBK-08JUP/ALD’S’//KLT’S’
4T-8land races
5TD-1PITIC-62/FROND//MEXIPAK/3/PITIC-62/MAZOE-79-75-76
6PAKISTAN-13CMH84.3379/CMH78.578//MILAN
7AAS-11LU26/HD 2179
8CHAKWAL-50F6.74/BUN//SIS/3/VEE#7 or F6-74/BUN//SIS/3/VEE#7
9GA-2002NAI60/CB151//S949/3/MEXIPAK
10INQILAB-91V-1562//CHRC’S’/HORK/3/KUFRA-I/4/CARP’S’/BJY’S’
11SH-2002INQALAB-91/FINK’S’
12AARI-11OPATA/RAYON//KAUZ
Publisher’s Note: MDPI stays neutral with regard to jurisdictional claims in published maps and institutional affiliations.

