Article

Searching of Novel Herbicides for Paddy Field Weed Management—A Case Study with Acetyl-CoA Carboxylase

by
Ajitha Antony
and
Ramanathan Karuppasamy
*
Department of Biotechnology, School of Bio Sciences and Technology, Vellore Institute of Technology, Vellore 632014, India
*
Author to whom correspondence should be addressed.
Agronomy 2022, 12(7), 1635; https://doi.org/10.3390/agronomy12071635
Submission received: 31 May 2022 / Revised: 25 June 2022 / Accepted: 26 June 2022 / Published: 8 July 2022
(This article belongs to the Special Issue The Future of Weed Science—Novel Approaches to Weed Management)

Abstract

:
Weed management is the major biological constraint in paddy (Oryza sativa L.) producing areas. Predominantly, barnyard grass (Echinochloa crus-galli) is a rice-mimicking weed that causes 57% of yield loss in rice production. Conventionally, herbicides are the site-specific weed inhibitors often used to suppress E. crus-galli growth. Acetyl-CoA carboxylase (ACCase) is an important target for developing novel herbicides with remarkable selectivity against gramineous weeds. Notably, fenoxaprop-P-ethyl (FPPE) is a selective ACCase herbicide extensively used in paddy fields to inhibit barnyard grass. However, prolonged use of FPPE herbicide elicits phytotoxicity in cultivated rice and herbicide resistance in weeds. Recently, phytotoxins are emerging as an alternative to commercial herbicides with safer environmental profiles. Nevertheless, discovering natural herbicides through in vivo and in vitro techniques is time-consuming and expensive. Therefore, high-end computational screening strategies including Tanimoto similarity, docking, binding free energy, and herbicide-likeness were used to pinpoint the lead molecule. Finally, molecular dynamics and MM/PBSA calculations were employed to validate the binding kinetics of the hit compound. Indeed, sinigrin was identified as a promising phytotoxic inhibitor against the ACCase enzyme. The findings of our study were well correlated with the existing experimental results. Overall, the current work will aid in the development of commercializing phytotoxin herbicides in foreseeable future.

1. Introduction

Paddy (Oryza sativa L.) is the principal food crop of the Indian agricultural economy [1]. According to the International Rice Research Institute (IRRI), India is the world’s second-largest rice producer after China, producing 163 million tons (mt). However, the average yield of rice in India is 3.76 (t ha−1), ranking it in 42nd position, which indicates the country’s low production rate [2,3]. Of various factors limiting rice productivity, weeds are the major threats affecting rice yield to a greater extent. Invasive weeds compete with paddy for natural resources, shelter the crop pests, reduce the crop yield, and subsequently increase the production cost. The predominant weed flora of a paddy field comprises grasses (Echinochloa colona, Echinochloa crus-galli, Eleusine indica, Cynodon dactylon); sedges (Cyperus rotundus, Cyperus iria, Cyperus difformis, Fimbristylis miliacea) and broad-leaved weeds (Alternanthera sessilis, Commelina benghalensis, Cyanotis axillaris, Sphaeranthus indicus, Eclipta alba) [4,5,6,7,8]. It is important to note that barnyard grass (Echinochloa crus-galli) is one of the most pernicious post-emergence grassy weeds abundantly found (96.9%) in paddy-producing areas. It has been evidenced that barnyard grass causes 57% yield loss in rice by reducing the photosynthetic capacity and energy conversion efficiency. Moreover, an extensive population of E. crus-galli could remove up to 80% of soil nitrogen [9,10]. Hand or mechanical weeding of barnyard grass is quite challenging, as its morphology is similar to that of paddy [8]. Thus, controlling the growth of barnyard grass plays a critical role in paddy cultivational areas.
Herbicides are an efficient tool in modern agriculture and effectively control weeds in the crop field [11,12]. Generally, herbicides have a specific site of action that kills weeds by selecting the potential molecular target. Acetyl-coenzyme A carboxylase (ACCase) is a biotin-dependent enzyme that serves as an important target for identifying grassy weeds [13]. ACCase inhibitors or Group A herbicides are grass selective and target only the homomeric ACCase of plastids. Thus, Group A herbicides are extensively used in the paddy field to control E. crus-galli [9]. The ACCase enzyme consists of three functional domains such as biotin-carboxyl carrier protein (BCCP), biotin carboxylase (BC), and carboxyltransferase (CT, with subunits α and β). Of note, the CT domain plays a key role in the carboxylation of acetyl-CoA to produce malonyl-CoA for the synthesis of fatty acids in weeds [13,14,15,16]. Thus, Group A herbicides interfering with the CT domain on homomeric ACCase eventually block the fatty acid synthesis in plants, resulting in growth retardation in the meristematic tissues and finally leading to plant death [17].
Paddy and barnyard grass belong to the same grass family [12]. Of note, the barnyard grass is morphologically and genotypically similar to some extent. However, they differ in the existence of notable enzymes such as cytochrome P450 and glutathione-S-transferase (GST). The presence of these enzymes particularly in paddy is of great importance to rapidly metabolize the herbicides into inactive products [13,18]. Therefore, ACCase herbicides consider this advantage as the basis of selectivity between crops and weeds [19]. Aryloxyphenoxypropionates (FOPs), cyclohexanediones (DIMs), and phenylpyrazole (DEN) are the three-chemical classes of Group A herbicides that target the CT domain of the homomeric ACCase enzyme [14,15,16,20]. Evidence in the literature revealed that only a few effective herbicides were available for controlling the barnyard grass weed [19]. For instance, fenoxaprop-P-ethyl (FPPE) is one of the post-emergence grass-selective FOP herbicides commercially used in the paddy field to control the growth of barnyard grass [21,22]. However, the intensive application of FPPE exhibits poor solubility and causes phytotoxic effects in cultivated rice and has led to the evolution of herbicide resistance in weeds [23,24]. Moreover, FPPE might cause residual effects on soil and paddy crops [21,25]. Therefore, there is a commercial need to develop a clinically safe ACCase targeting herbicide [26].
The greatest weed management challenge for organic agriculture is the lack of effective natural product herbicides [27]. Natural products have vast chemical diversity and thus serve as a promising source for the discovery of novel bioherbicides [28]. The selective nature of bioherbicides with rapid degradation properties deserves more attention than synthetic herbicides [24]. Interestingly, phytotoxins synthesized by various plants and microorganisms are excellent sources for weed control and could revolutionize sustainable agriculture [28,29]. Chen et al. reported that even low concentrations of phytotoxins have a good inhibitory effect on weeds, which is an added advantage of developing bioherbicides [30]. However, the wide bottleneck in bioherbicide commercialization is the marketing of a live product [31]. To date, only 8% of conventional herbicides derived from natural compounds have been approved by the USEPA (U.S. Environmental Protection Agency) [27].
In recent decades, the discovery of natural phytotoxic herbicides is an emerging strategy in the field of agrochemicals. Therefore, in the present investigation, a holistic virtual screening approach was used to illustrate the underlying mechanism of phytotoxic inhibitors against the CT domain of ACCase. We hope that our study encourages the commercialization of natural herbicides and enlightens agronomists toward environmentally friendly products.

2. Materials and Methods

2.1. Homology Modeling and Protein Preparation

The three-dimensional (3D) structure of the ACCase in E. crus-galli has not been experimentally determined. Therefore, a homology model is required to understand the crystallized nature of the ACCase enzyme. Based on the literature evidence, the protein sequence of E. crus-galli (HQ395759.1) was retrieved from the National Center for Biotechnology Information (NCBI) GenBank database [14]. The CT domain region of the protein sequence was used to build a model using the prime program of the Schrödinger software suite. A BLAST similarity search was performed to identify the suitable template structures for the modeling. Typically, 25% sequence identity between the query and target sequence of experimentally determined 3D structure is widely accepted as the template for modeling [32]. The quality of the modeled structure was evaluated with various methods such as Ramachandran plot, ERRAT, and ProSA (Z-score) to predict the model reliability. Ramachandran and ERRAT plots were accessed from the SAVES server (https://saves.mbi.ucla.edu/, accessed on 16 March 2022). Subsequently, Z-scores from the ProSA tool (https://prosa.services.came.sbg.ac.at/prosa.php, accessed on 16 March 2022) were used to perform the validation techniques. It is important to note that the Ramachandran plot helps to visualize energetical regions of psi (ψ) and phi (ϕ) angles of the amino acids in proteins. The existence of above 90% of the amino acids in energetically favored regions represents a good stereochemical model [33]. Subsequently, the overall quality factor (OQF) of the model was assessed by an ERRAT plot, and higher OQF scores (>50) signify the backbone conformations of protein with properly folded residues [34,35]. In addition, Z-score indicates the model quality by measuring the total energy deviation of the structure [36,37,38]. Often, lower negative energies of Z-score are acceptable [39,40]. After validation, the 3D modeled structure was refined using the protein preparation wizard of Schrödinger. The protein preparation process involves the assignment of hydrogen bonds, bond orders, and deletion of water beyond 5 Å from hetero atoms. Furthermore, the protein structure was minimized by applying the OPLS-3e force field until the root-mean-square deviation (RMSD) of all atoms reached 0.3 Å [38,39]. Finally, the minimized protein structure was used as the target to obtain the molecular insights.

2.2. Ligand Collection and Preparation

The small molecules used in our study were retrieved from the Toxic Plants—PhytoToxins (TPPT) database, a subset of the ColleCtion of Open Natural prodUcTs database (COCONUT) database. In total, the 1483 TPPT compounds from the COCONUT database were used in this study [41,42]. Fenoxaprop-P-ethyl (ID: 91707) was retrieved from the PubChem database and considered as a reference molecule for the screening. For ligand preparation, the LigPrep module of the Schrödinger suite was used. Ligand preparation includes ionization, stereo concoction, and minimization. To achieve the ionization state, the pH of all ligands was neutralized, and stereoisomers were generated for each ligand structure [39]. Subsequently, the OPLS-2005 force field was also used to minimize all ligand structures [43].

2.3. Tanimoto Coefficient Similarity

An analysis of the Tanimoto coefficient is of immense importance to explore the similarities between the molecules [44]. Therefore, the similarity of two or more molecules was determined by fingerprints and measured using the Tanimoto coefficient (Tc) as shown in Equation (1). As a strategy to screen the effective molecules, the collected natural compounds were compared to a known reference compound. In order to achieve this, the use of two-dimensional (2D) similarities is still the preferred way of coding small-molecule features in fingerprints [45]. Hereby, an open-source cheminformatics toolkit, the python RDKit package was used in this study [46,47,48]. To enable screening of molecular structures having the same scaffold, canonical SMILES were used in the RDKit tool to determine the structural similarity between the reference and natural phytotoxins.
T a n i m o t o = N a N a + N b + N a b    
where Na, Nb, and Nab are the number of bits set to one in the fingerprints representing compound a but not in b, compound b but not in a, and in both a and b, respectively.

2.4. Binding Site Analysis and Molecular Docking

The foremost technique of molecular docking is the determination of binding sites or active site residues of the target structure. To achieve this, the sitemap tool of Schrödinger software was used to determine the effective active sites [38,43]. The sitemap determines five sites and the potential binding sites were selected based on the highest site score and druggability score (D score) [49,50]. The selected active site included various hydrogen donors, acceptors, and hydrophilic and hydrophobic regions. Further, the receptor grid generation module of the Schrödinger suite was used to generate the grid box enclosing the potential binding site regions. Subsequently, molecular docking was carried out using the glide molecular docking module of the Schrödinger suite. To evaluate the binding affinity of the receptor with the ligand, hierarchical screening was followed, which includes high-throughput virtual screening (HTVS), standard precession (SP), and extra precession (XP) modes [51]. Of note, the glide XP (XP GScore) scoring function was more sophisticated, precise, and screened out the false positives. Therefore, the compounds screened through the XP mode exhibit the best binding affinity toward the protein and ligands [52].

2.5. MM/GBSA Screening

The molecular mechanics generalized Born and surface area method (MM/GBSA) is a well-known approach for determining the binding free energy (∆Gbind) of the small molecules [38]. Therefore, the Prime MM/GBSA module of the Schrödinger suite with an OPLS_2005 force field and the VSGB dissolvable model was used to remove the false-positive hits. It is important to highlight that ∆Gbind is a key factor in determining the binding affinity of the protein–ligand complex [53]. Notably, the higher negative ∆Gbind energies designate a persistent interaction between the complexes [54]. Here, the MM/GBSA, the binding free energy was calculated as follows:
∆Gbind = ∆Gsolv + ∆EMM + ∆GSA
where ∆Gsolv is the difference between the solvation energy of the protein–ligand complex and the sum of the solvation energy for the protein and ligand; ∆EMM is the difference in the minimized energies between protein–ligand complex; ∆GSA is the difference between the surface area energy of the complex and sum of the surface area energies in the protein and ligand [43,55].

2.6. Herbicide-Likeness

In the field of agrochemical discovery, the physiochemical properties of various pesticides and herbicides have been analyzed for their likeness based on “Tice’s rules”. Tice proposed a set of 5 rules for pesticides and post-emergence herbicides that specifies the optimum range of molecular descriptors for the compounds. The descriptors include molecular weight 150–500 Dalton (MW), partition coefficient ≤3.5 (logP), the number of hydrogen bond donors ≤3 (HBD) and acceptors 2–12 (HBA), and the number of rotatable bonds ≤12 (RB) [56,57]. The compounds under this range tend to have pesticides and herbicide-likeness properties. Therefore, in this study, we implemented the Tice rules as selection criteria to determine the herbicidal likeness of our screened compounds.

2.7. MD Simulation

Molecular dynamics (MD) simulation was performed to analyze the structural stability of protein binding to the ligand molecule using the GROningen Machine for Chemical Simulations (GROMACS 2018.2 version) software with the GROMOS96 43a1 force field. Initially, the PRODRG server was used to generate the ligand topology. Further, protein solvation was carried out in a 3D dodecahedron box of 10 Å with a simple point charge water model [34]. Subsequently, the protein–ligand complexes were neutralized by adding six Na+ ions. Moreover, electrostatic interaction was determined by particle-mesh Ewald (PME), and hydrogen bonds were constrained using the SHAKE algorithm [58]. Then, the entire system was equilibrated by applying NVT and NPT ensembles at 300 K and 1 bar pressure, respectively [39]. Ultimately, in this study various parameters such as root mean square deviation (RMSD), root mean square fluctuation (RMSF), the number of intermolecular hydrogen bonds (H-bonds), and principal component analysis (PCA) were assessed to determine the dynamic profiles of the protein–ligand complex. The results were analyzed using MD trajectories and plotted with Xmgrace.

2.8. MM/PBSA

The accurate prediction of binding free energy calculation was performed using MM/PBSA (molecular mechanics Poisson–Boltzmann surface area) analysis. Precisely, this method estimates free energy calculations by comparing energy differences between protein–ligand systems and the energy components of individuals. The incorporation of enthalpy and entropy terms during MM/PBSA calculations provided an accurate prediction of total binding free energy. For each system, 500 snapshots from last 5 ns of MD trajectories were taken for this analysis. Here, the g_mmpbsa tool (https://rashmikumari.github.io/g_mmpbsa/, accessed on 22 June 2022) was utilized to carry out free energy calculations [59,60]. The binding free energy of the system was calculated as
G b i n d = E M M + G s o l v + T S
where ∆Gbind—total binding free energy; ∆EMM—gas-phase interaction energy between protein and ligand; ∆Gsolv—solvation energy; T∆S—change in conformational entropy. Finally, the average binding free energy of the complexes were calculated using the MmPbSaStat.py tool, a python-based script.

3. Results and Discussion

3.1. Homology Validation

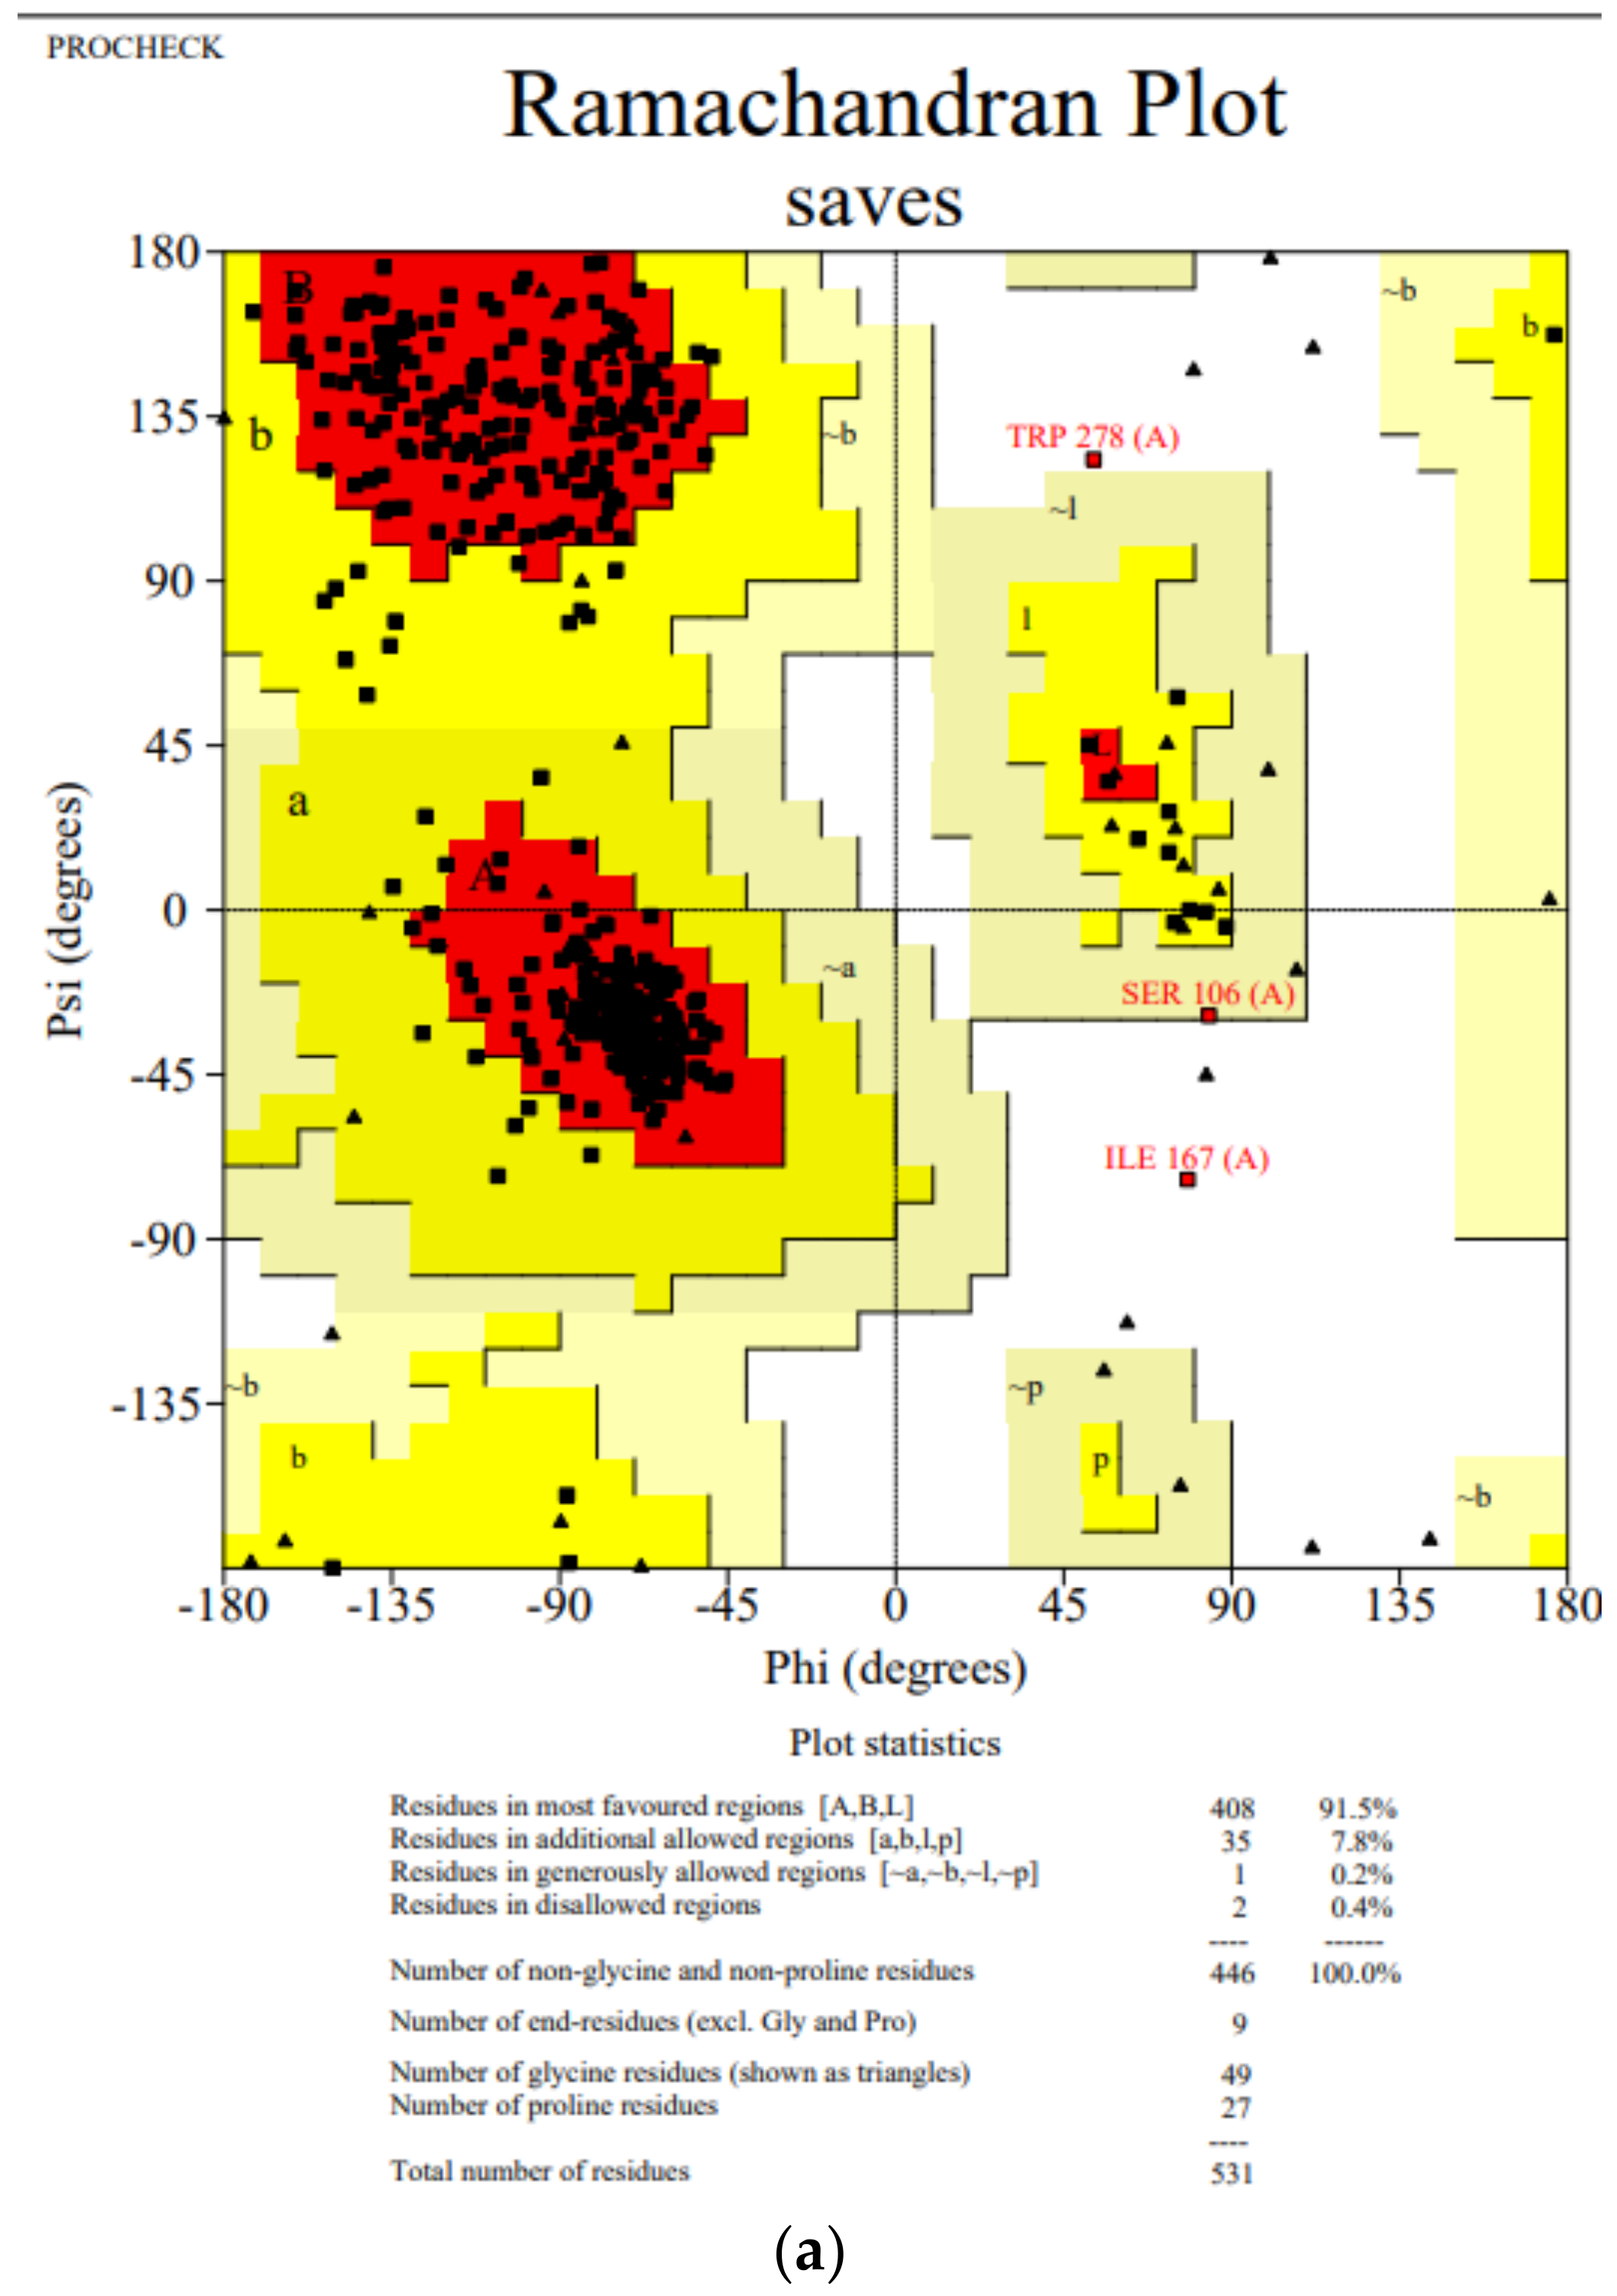
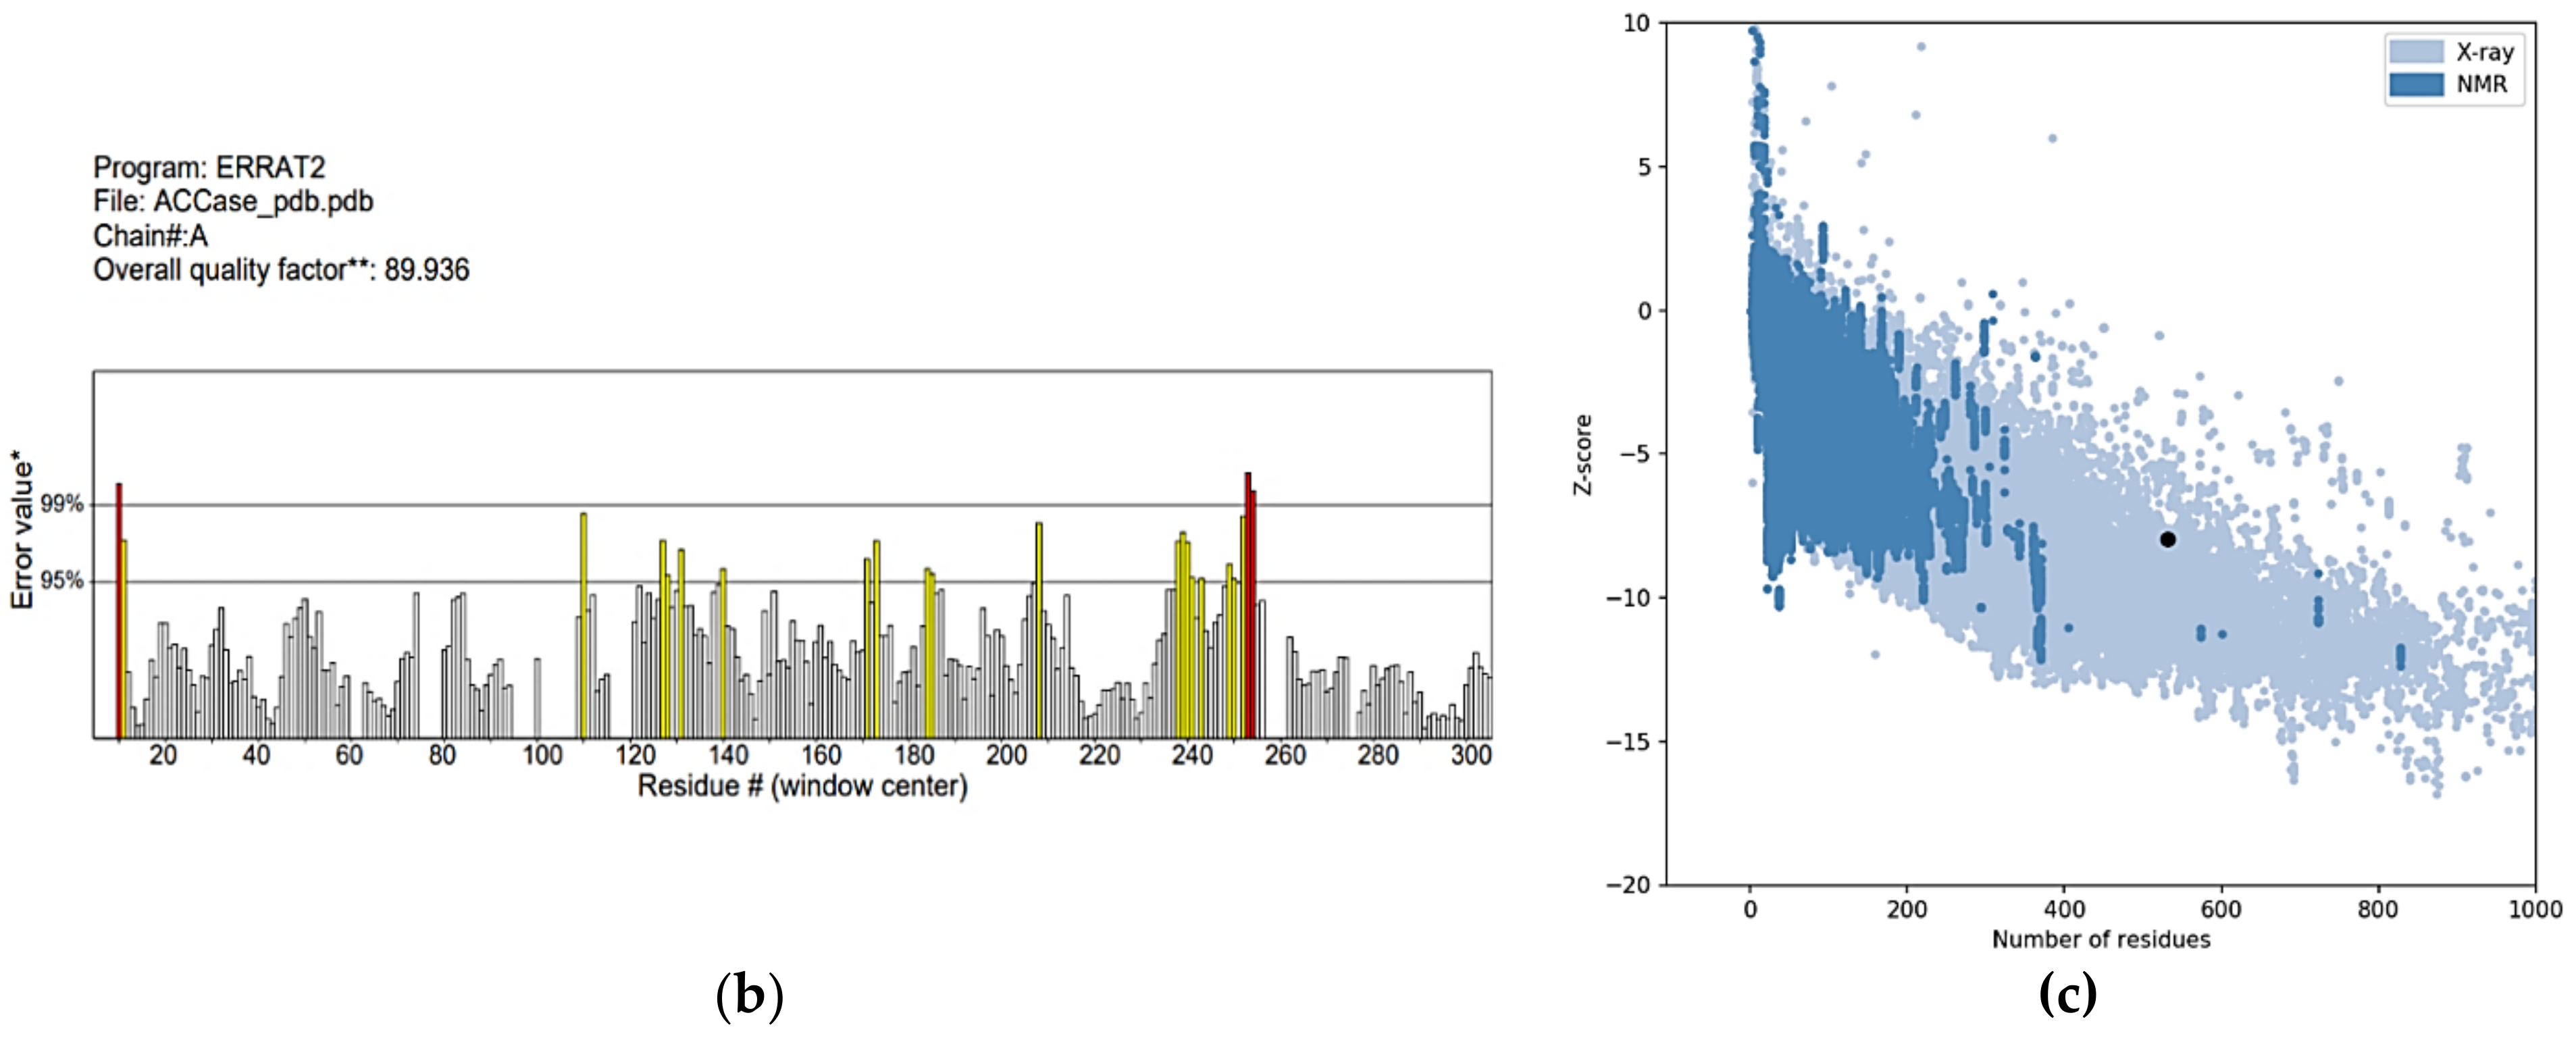
The crystal structure of the humanized carboxyltransferase domain of yeast ACCase (PDB: 3TV5) was selected as a template for homology modeling as it exhibited 54% similarity to the query sequence. Thus, the 3D structure of E. crus-galli was constructed using the homology modeling module of the Schrödinger software (Figure 1). The quality of the developed model was assessed using various techniques. The Ramachandran plot of the constructed model shows that the statistical distributions of ψ–ϕ dihedral angles were non-violated. Moreover, 91.5% of amino acids were found in the energetically favored regions indicating the perfect stereochemical model as shown in Figure 2a. Further, the ERRAT score of 89.936 (Figure 2b) confirms that amino acids are folded properly in the protein. In addition, the higher negative value of the Z-score (−7.95) implies a good quality of the protein model (Figure 2c). Ultimately, the results of the various validation methods revealed that the predicted homology model of ACCase of E. crus-galli is reliable for molecular modeling.

3.2. Tanimoto-Similarity-Based Screening

As an initial step in the virtual screening process, the BulkTanimoto similarity () function from the RDKit search algorithm was used to measure the similarities between the molecules. Indeed, similarity values range from 0 (non-identical compounds) to 1 (identical compounds) [47]. Accordingly, the Tc similarity of 1483 TPPT compounds was calculated against the FPPE compound. The overall structural similarity of all the compounds ranged from 0.17 to 0.52. Based on the recent literature evidence, a Tc value between 0.2 to 0.5 provides a good range to filter out similar molecules [61,62]. Keeping this in mind, a threshold value of 0.2 was set, and the compounds above this range were considered for further analysis. Ultimately, Tc similarity screened 1475 compounds, and these compounds were used for the further optimization.

3.3. Binding Site Prediction and Molecular Docking

The binding region with a site score of 1.112 and a D score of 1.145 was selected to generate the grid box with the dimensions of 21.66 × 25.52 × 15.43 Å. The binding site is the essential region that contains the 26 active residues such as TYR256, PRO258, GLU259, ASN260, THR261, YS262, ASP263, PRO264, ALA266, ALA267, ILE268, MET282, PHE283, ALA315, VAL316, THR318, GLN344, LEU371, ASN373, PRO411, MET412, ALA413, GLY414, GLU415, LYS442, and TRP539. Furthermore, the compounds screened from Tc similarity were pre-processed using the LigPrep module of Schrödinger software. Successively, molecular docking was carried out to determine the potential lead compound against the target. Initially, all the 1475 compounds were subjected to HTVS docking to reduce the number of compounds. Next, all the HTVS-screened compounds were passed to the SP mode of docking. Toward the end, XP docking was performed for further refinement and, thus, yielded the 558 lead compounds. It is worth noting that binding affinities with the higher negative XP GScore (kcal/mol) indicate a greater affinity toward the target. In the present study, the XP GScore of the screened compounds ranged from −12.829 to 1.388 kcal/mol. In order to find the most efficient compounds compared to FPPE, its XP GScore (−5.977 kcal/mol) was fixed as a threshold. As a result, 197 compounds were successfully screened and used for further investigation. The Tanimoto similarity and the docking scores of the 197 lead compounds are shown in Table S1.

3.4. MM/GBSA Screening Analysis

The MM/GBSA is one of the computationally intensive approaches that have a significant correlation with the experimentally determined biological activity [63]. Therefore, a binding free energy analysis was performed for the XP-docked complexes to examine the fine levels of the compound’s activity against the ACCase. In general, the Prime algorithm provides several energy attributes that provide a deeper understanding of the activity of the compounds. Despite this, the current study focuses on a parameter such as ∆Gbind, ∆Gbind coulomb, ∆Gbind Hbond, ∆Gbind lipo, ∆Gbind Solv GB, and ∆Gbind vdW to screen the final hit compounds. The ∆Gbind of FPPE (−77.03 kcal/mol) was used as a threshold value to screen the potential compounds. This yielded a total of seven hit compounds that possessed lower binding energy than the reference compound. Table 1 highlights the Tanimoto similarity, docking score, and ∆Gbind of the seven lead compounds at the final level of virtual screening. It is apparent from the table that the ∆Gbind score ranged from −83.78 to −77.29 kcal/mol. Notably, ∆Gbind is an important factor in the effective binding of the protein–ligand complex. In essence, lipophilicity (−42.32 kcal/mol) and van der Waals (−44.46 kcal/mol) interactions are the major energy contributors in determining the ∆Gbind of the FPPE compound. A similar trend was also noted for all the seven screened hit molecules. For instance, the lipophilicity and van der Waals of all the hit molecules ranged from −42.56 to −35.05 kcal/mol and −53.40 to −27.22. Subsequently, herbicide-likeness properties were analyzed for the seven screened hit compounds.

3.5. Herbicide-Likeness

The selected hit molecules as well as the reference molecules were analyzed for their herbicidal action over the target. Therefore, Tice’s 5 rules were followed to determine the novel lead compound with potential herbicidal property. Table 2 highlights the molecular descriptors of lead compounds calculated using the Tice rules. From the table, we found that only three lead compounds fell under the desirable range for the four descriptors MW, logP, HBA, and RB. Among the three lead molecules, the compound CNP0259095, named sinigrin exhibited herbicidal activity against E. crus-galli as evidenced in the recent literatures [44,64]. Prominently, sinigrin is a major glucosinolate (GS) that belongs to the Brassicaceae plant family [65]. According to Bangarwa et al. investigation, hydrolyzed sinigrin turns into a biologically active compound known as allyl isothiocyanate (allyl-ITC), which exhibits potential herbicidal activity against weeds [44]. Of note, herbicides are water-soluble agrochemicals that tend to have the lower MW and logP properties [57,66]. Interestingly, in our study the MW (358.36 Da) and logP (−4.52) descriptors of sinigrin exhibited a lower range of values than the FPPE. Adding together, a lower RB (<12) indicates good molecular flexibility between protein–ligand complexes [67]. Further, the screened hit molecule was 22% similar to FPPE and exhibited better glide and MM/GBSA score than the FPPE compound. In light of these evidences, we hope the sinigrin is well absorbed by the susceptible plants and is effective against the ACCase receptor. Thus, sinigrin was selected as lead hit molecule to accomplish the further analysis in the subsequent study.

3.6. Interaction Profile of FPPE and Sinigrin with ACCase

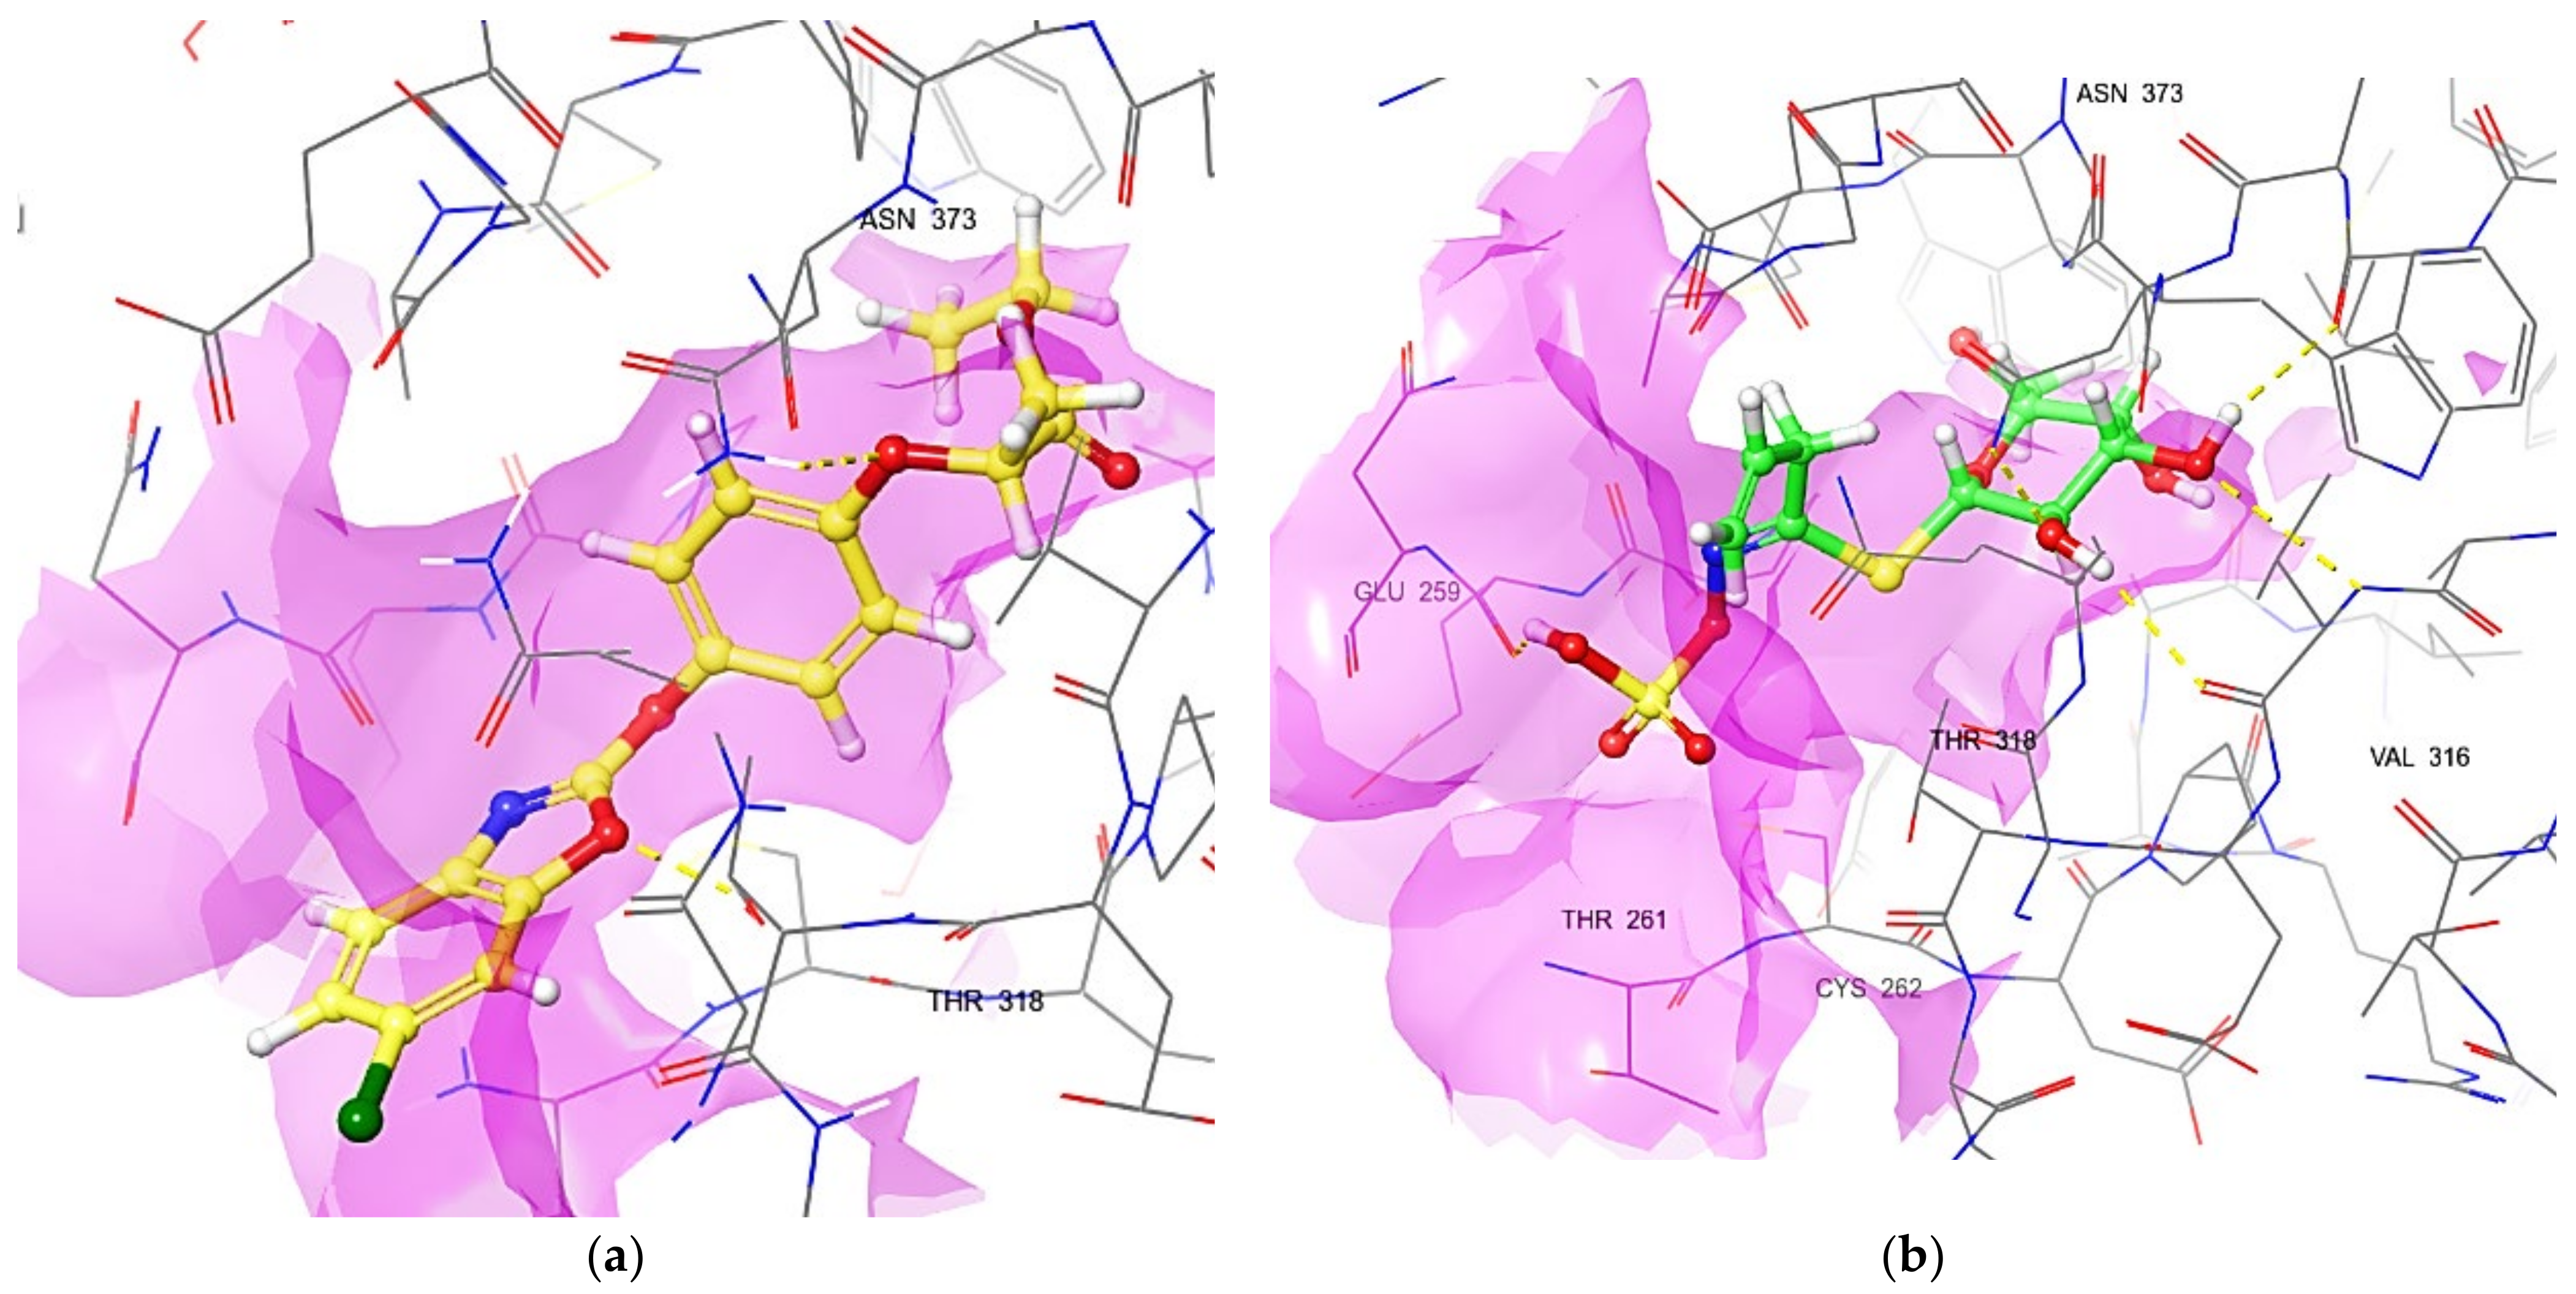
To understand the underlying mechanism of the protein–ligand complex, the binding pattern of the complexes was analyzed. The ligand interaction diagram (LID) and docked ACCase–FPPE and ACCase–sinigrin complexes are shown in Figure 3 and Figure 4, respectively. Despite the number of binding interactions, hydrogen bonding is one of the important non-covalent interactions in stabilizing the protein–ligand complex [68]. Consistently, it is apparent from the figure that the amino acids THR318 and ASN373 are the key residues involved in hydrogen bond interaction in both FPPE and the sinigrin complex (Figure 3a). In addition, the residues VAL316, CYS262, THR261, and GLU259 form more hydrogen bonds with the sinigrin. Figure 3b clearly shows that the ACCase–sinigrin complexes have more hydrogen bonds than ACCase–FPPE complexes, which is represented by pink lines. Table 3 highlights the hydrogen bond length (Å) of each interacting residue in FPPE and sinigrin compounds. Apart from the hydrogen bond, solvent exposure was noticed on both ligand molecules residing on the surface of the ACCase receptor. Of note, the influence of water on amino acids is indicated by a wide range of solvent exposure. Thus, the ligands that showed solvent exposure are often referred to as solvent-friendly binders, which play a key role in the stabilization of specific protein structures [69,70]. Importantly, the solvent-exposed scaffold of sinigrin was bound to the interacting residues THR 318, GLU259, and CYS262. Thus, the sinigrin compound was consistently a solvent-friendly binder with the receptor. Contrastingly, no residues interacted with the solvent-exposed scaffolds of FPPE. Overall, we found that sinigrin exhibited greater binding stability for ACCase due to higher levels of hydrogen bonds and good solvent exposure. Finally, dynamic analysis was performed to analyze the molecular insights of the ACCase–FPPE and ACCase–sinigrin complexes.

3.7. MD Simulation Analysis

The molecular dynamic (MD) simulation was carried out for 100 ns to explore the dynamic profiles of protein at the atomic level during the binding of inhibitors. The parameters RMSD, RMSF, and H-bond occupancy were calculated using the gmx_rms, gmx_rmsf, and gmx_hbond tools of GROMCS to determine the fluctuations and stability of the protein–ligand system. In addition, principal compound analysis (PCA) was performed with gmx_covar and gmx_anaeig tools for analyzing the atomic motions of proteins during binding. Moreover, all simulation plots were visualized in Xmgrace. Notably, the reference and hit compounds are represented in black and red throughout the study.

3.7.1. Structural Stability of Protein–Ligand Complexes

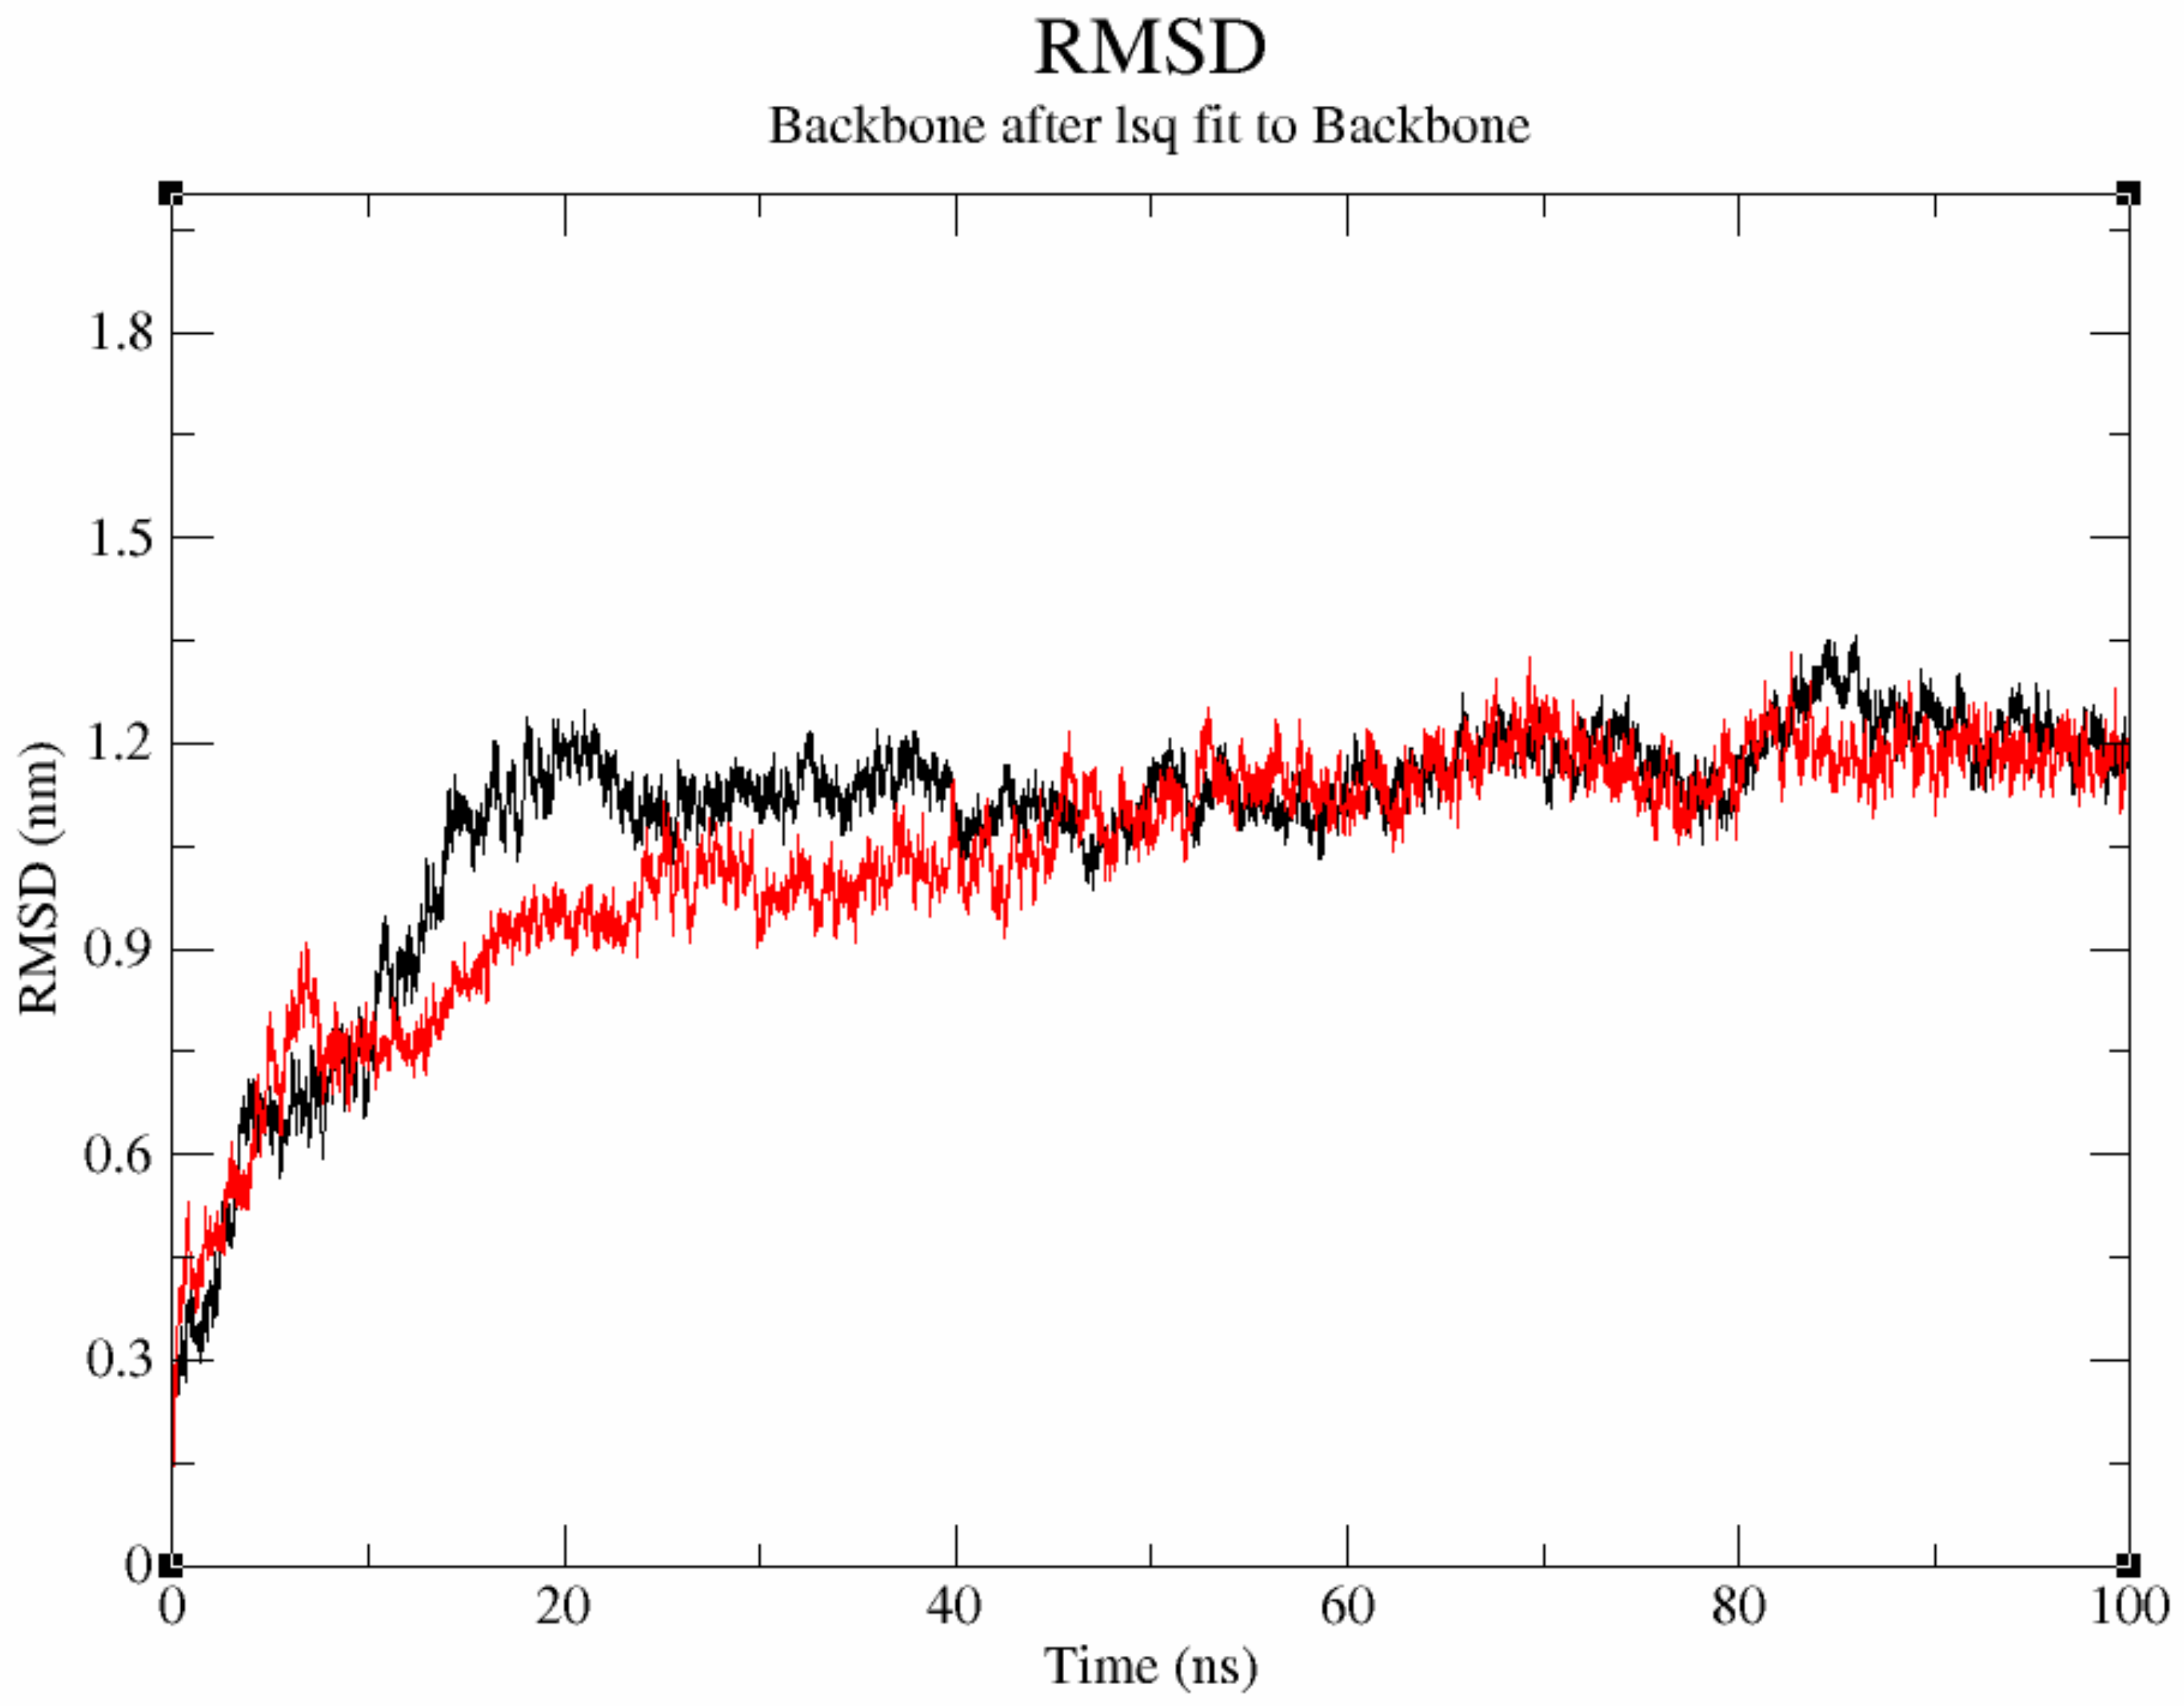
The RMSD of the backbone carbon atom relative to the protein was used to assess the conformational and structural stability of complexes [35]. Accordingly, higher RMSD values depict lesser stability of protein, whereas lower RMSD confirms the protein’s stability [67]. Figure 5 represents the RMSD (nm) plot of the reference (FPPE) and hit (sinigrin) molecules over the 100 ns simulation. Initially, the trend line of RMSD gradually increased up to 10 ns in both ACCase–FPPE and ACCase–sinigrin complexes. Furthermore, in the interval from 10 to 20 ns, the ACCase–FPPE complex reflected an abrupt rise in RMSD value (~1.2 nm). In contrast, the ACCase–sinigrin complex maintained a lesser deviation of 1 nm till 25 ns. Notably, the trend line of each complex showed a slight surge until 50 ns, then the line was steady between 50 and 70 ns. Thereafter, the trend line subsided quickly at 80 ns with an RMSD of ~1.05 nm. Subsequently, a sudden rise in RMSD value (~1.35 nm) was observed for the ACCase–FPPE complex in the interval of 80–85 ns, and it attained a stable conformation toward the end. Conversely, only a little upsurge was noted for the ACCase–sinigrin complex at 83 ns with an RMSD of ~1.2 nm, and it remained stable till the end of the simulation. Therefore, it is worth mentioning that the identified lead molecule was more dynamically stable than the native complex.

3.7.2. Flexibility Analysis of Protein–Ligand Complexes

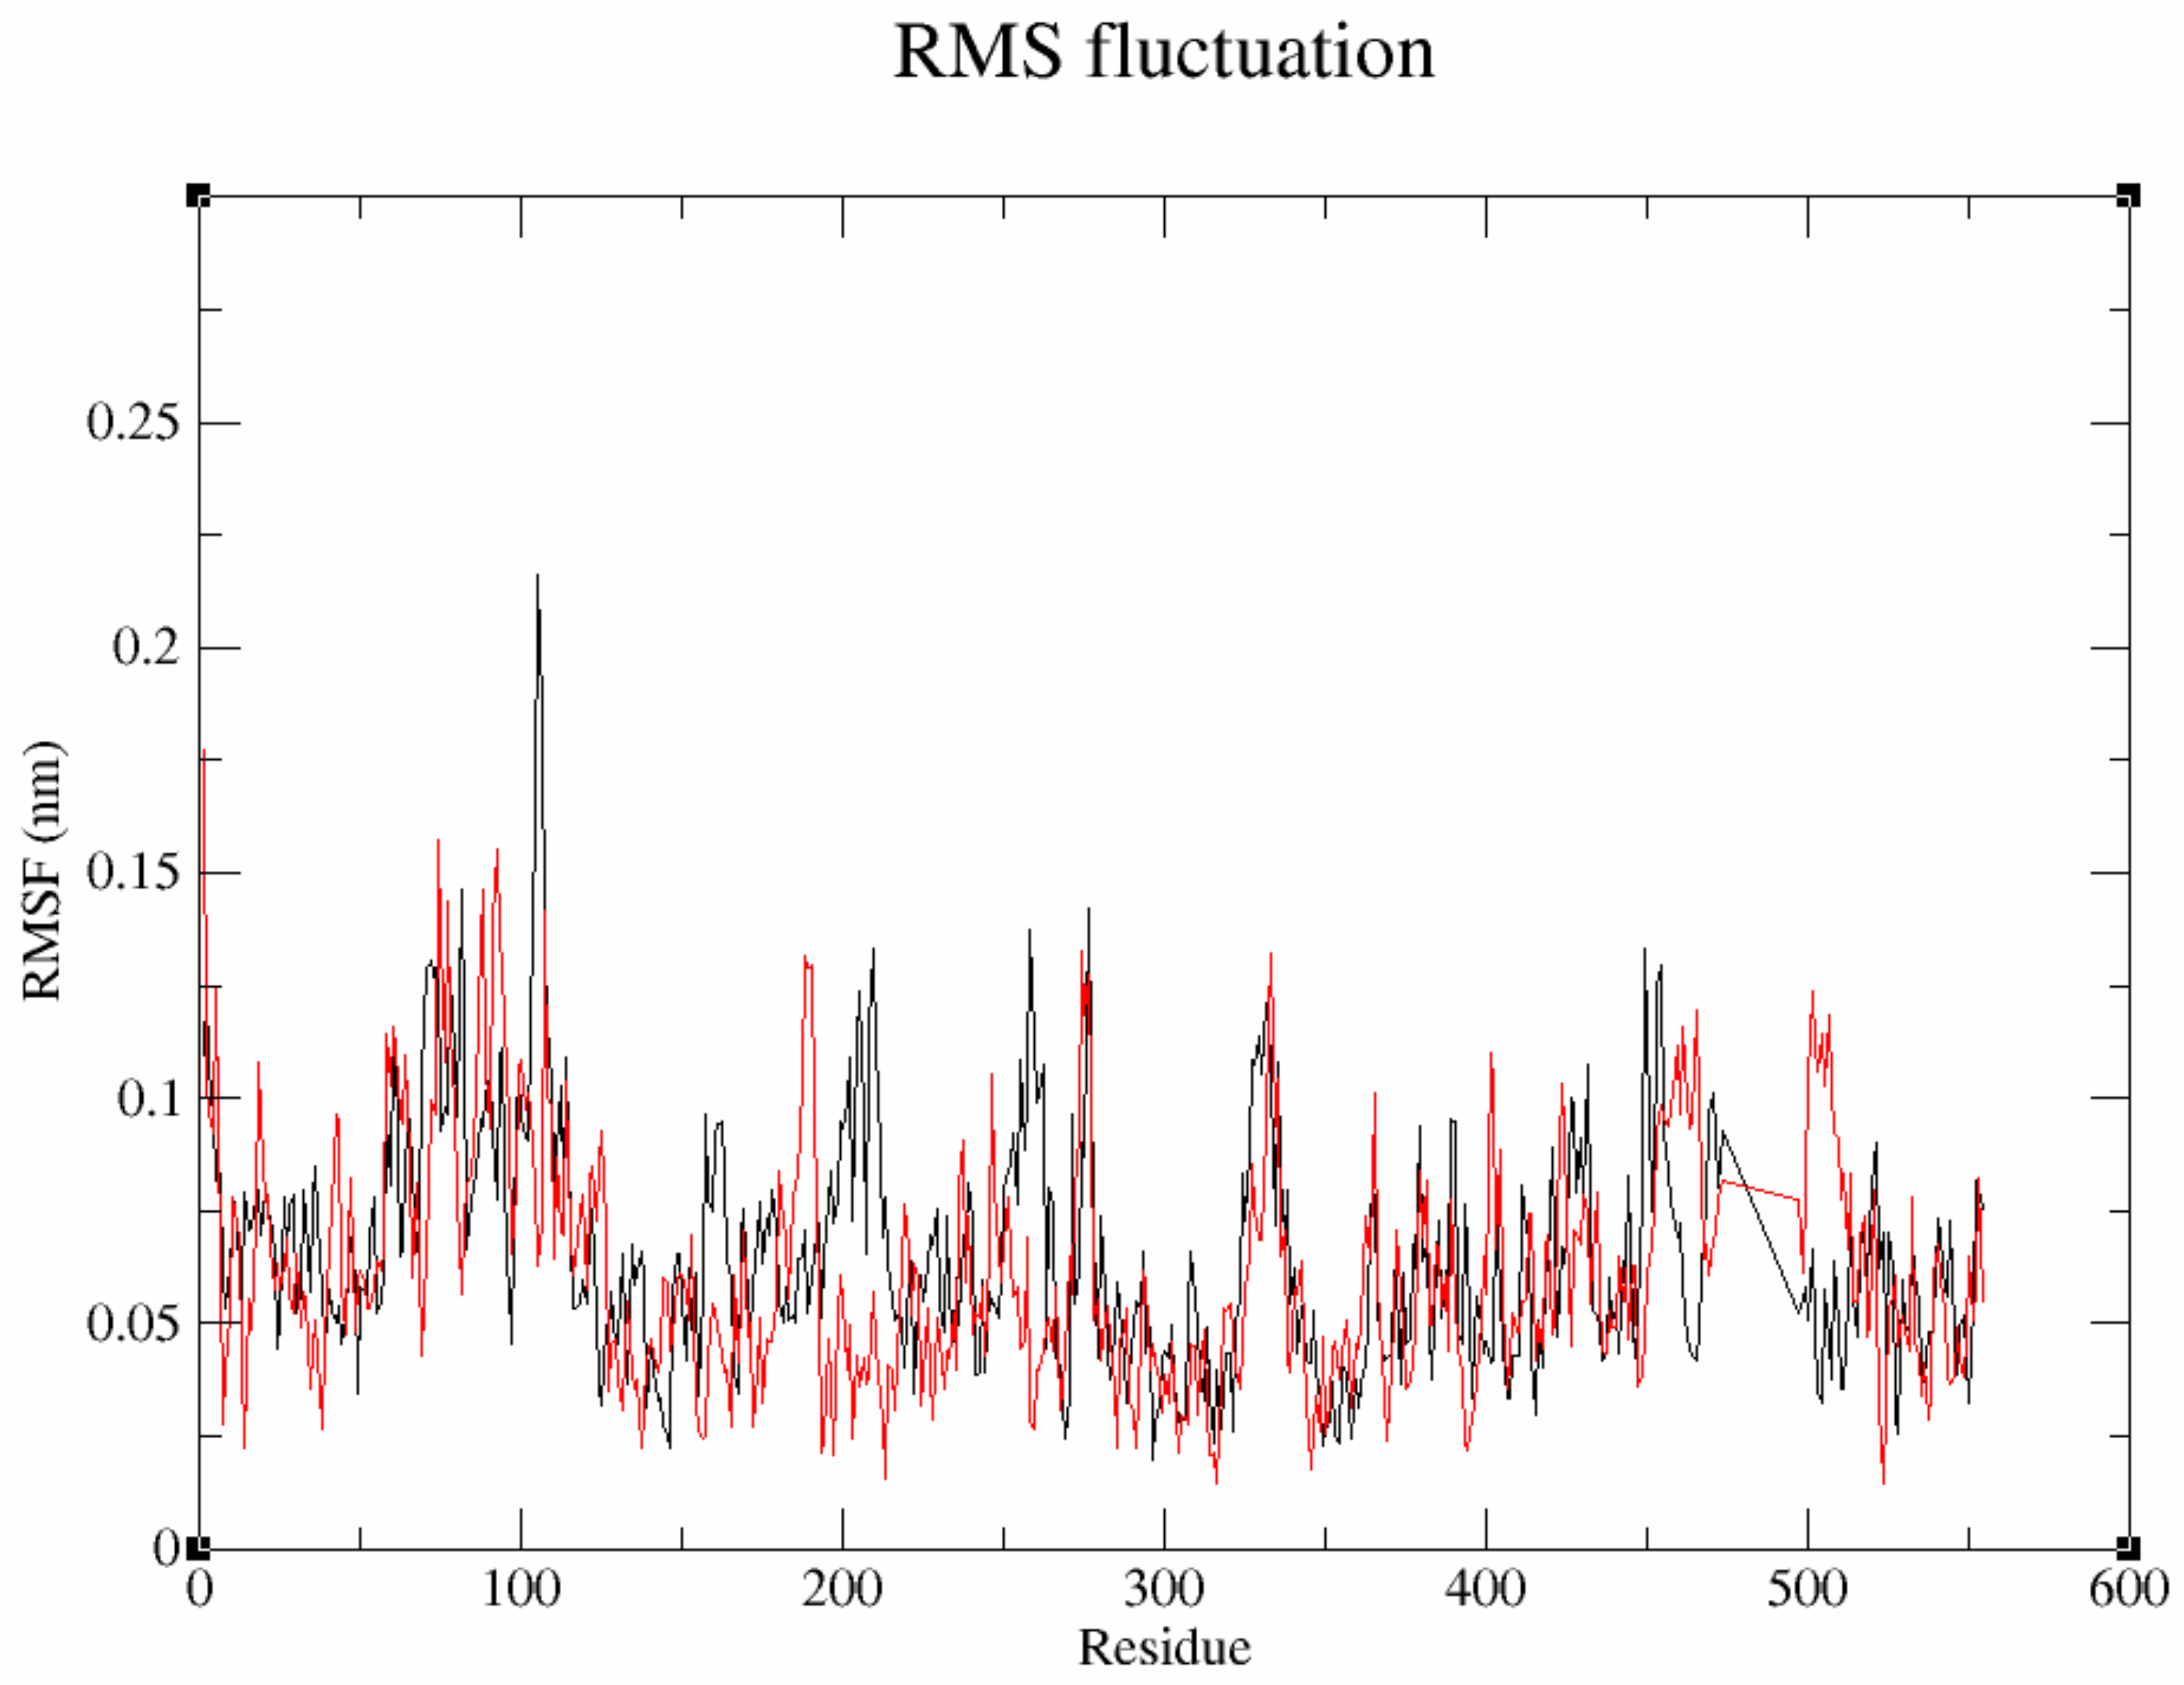
The RMSF calculates the fluctuation and flexibility of each residue of the protein complex during the progression of simulation [71,72]. The lower RMSF value indicates the rigid nature of residues, whereas the flexible region has a higher RMSF value [35,71]. Figure 6 represents the RMSF plot of ACCase–FPPE and ACCase–sinigrin complexes. The figure clearly shows that the ACCase–FPPE complex exhibited the highest fluctuations (>1.16 nm) for the residues LEU104, ASP105, and SER106 at the N-terminal region. Similarly, the ACCase–sinigrin complex shows a higher deviation due to the residues PRO1, ARG92, and GLU88 with the RMSF values of ~0.1775, ~0.1557, and ~0.1461 nm, respectively. However, the above-mentioned residues are not found in the active site region; thus, they have no significant effect on binding. Subsequently, the residues ALA296, PHE146, LEU269, ALA315, and MET321 of the ACCase–FPPE complex showed the lowest deviation ranging from ~0.019 to ~0.025 nm. In addition, the residues HIE213, VAL316, VAL345, and THR523 of ACCase exhibited subtle fluctuations (~0.014 to ~0.017 nm) upon sinigrin binding, thus indicating the complex’s stability. In essence, the active site residues of the protein–hit complex were substantially rigid and exhibited a minimum deviation of less than ~0.1 nm. In addition, the binding residues GLU259, THR261, CYS262, THR318, VAL316, and ASN373 were relatively stable in both complexes during the process of simulation. It is important to note that, VAL316 exhibited lower fluctuations (~0.0144 nm) than other residues and was involved in forming hydrogen bonds with the ACCase–sinigrin complex. The RMSF and RMSD plots of the protein–hit complex illustrate the consistent results throughout the simulation. This depicts the better stability of the ACCase–sinigrin complex. Moreover, these findings are well correlated with the docking and MM/GBSA results.

3.7.3. Hydrogen Bond Occupancy

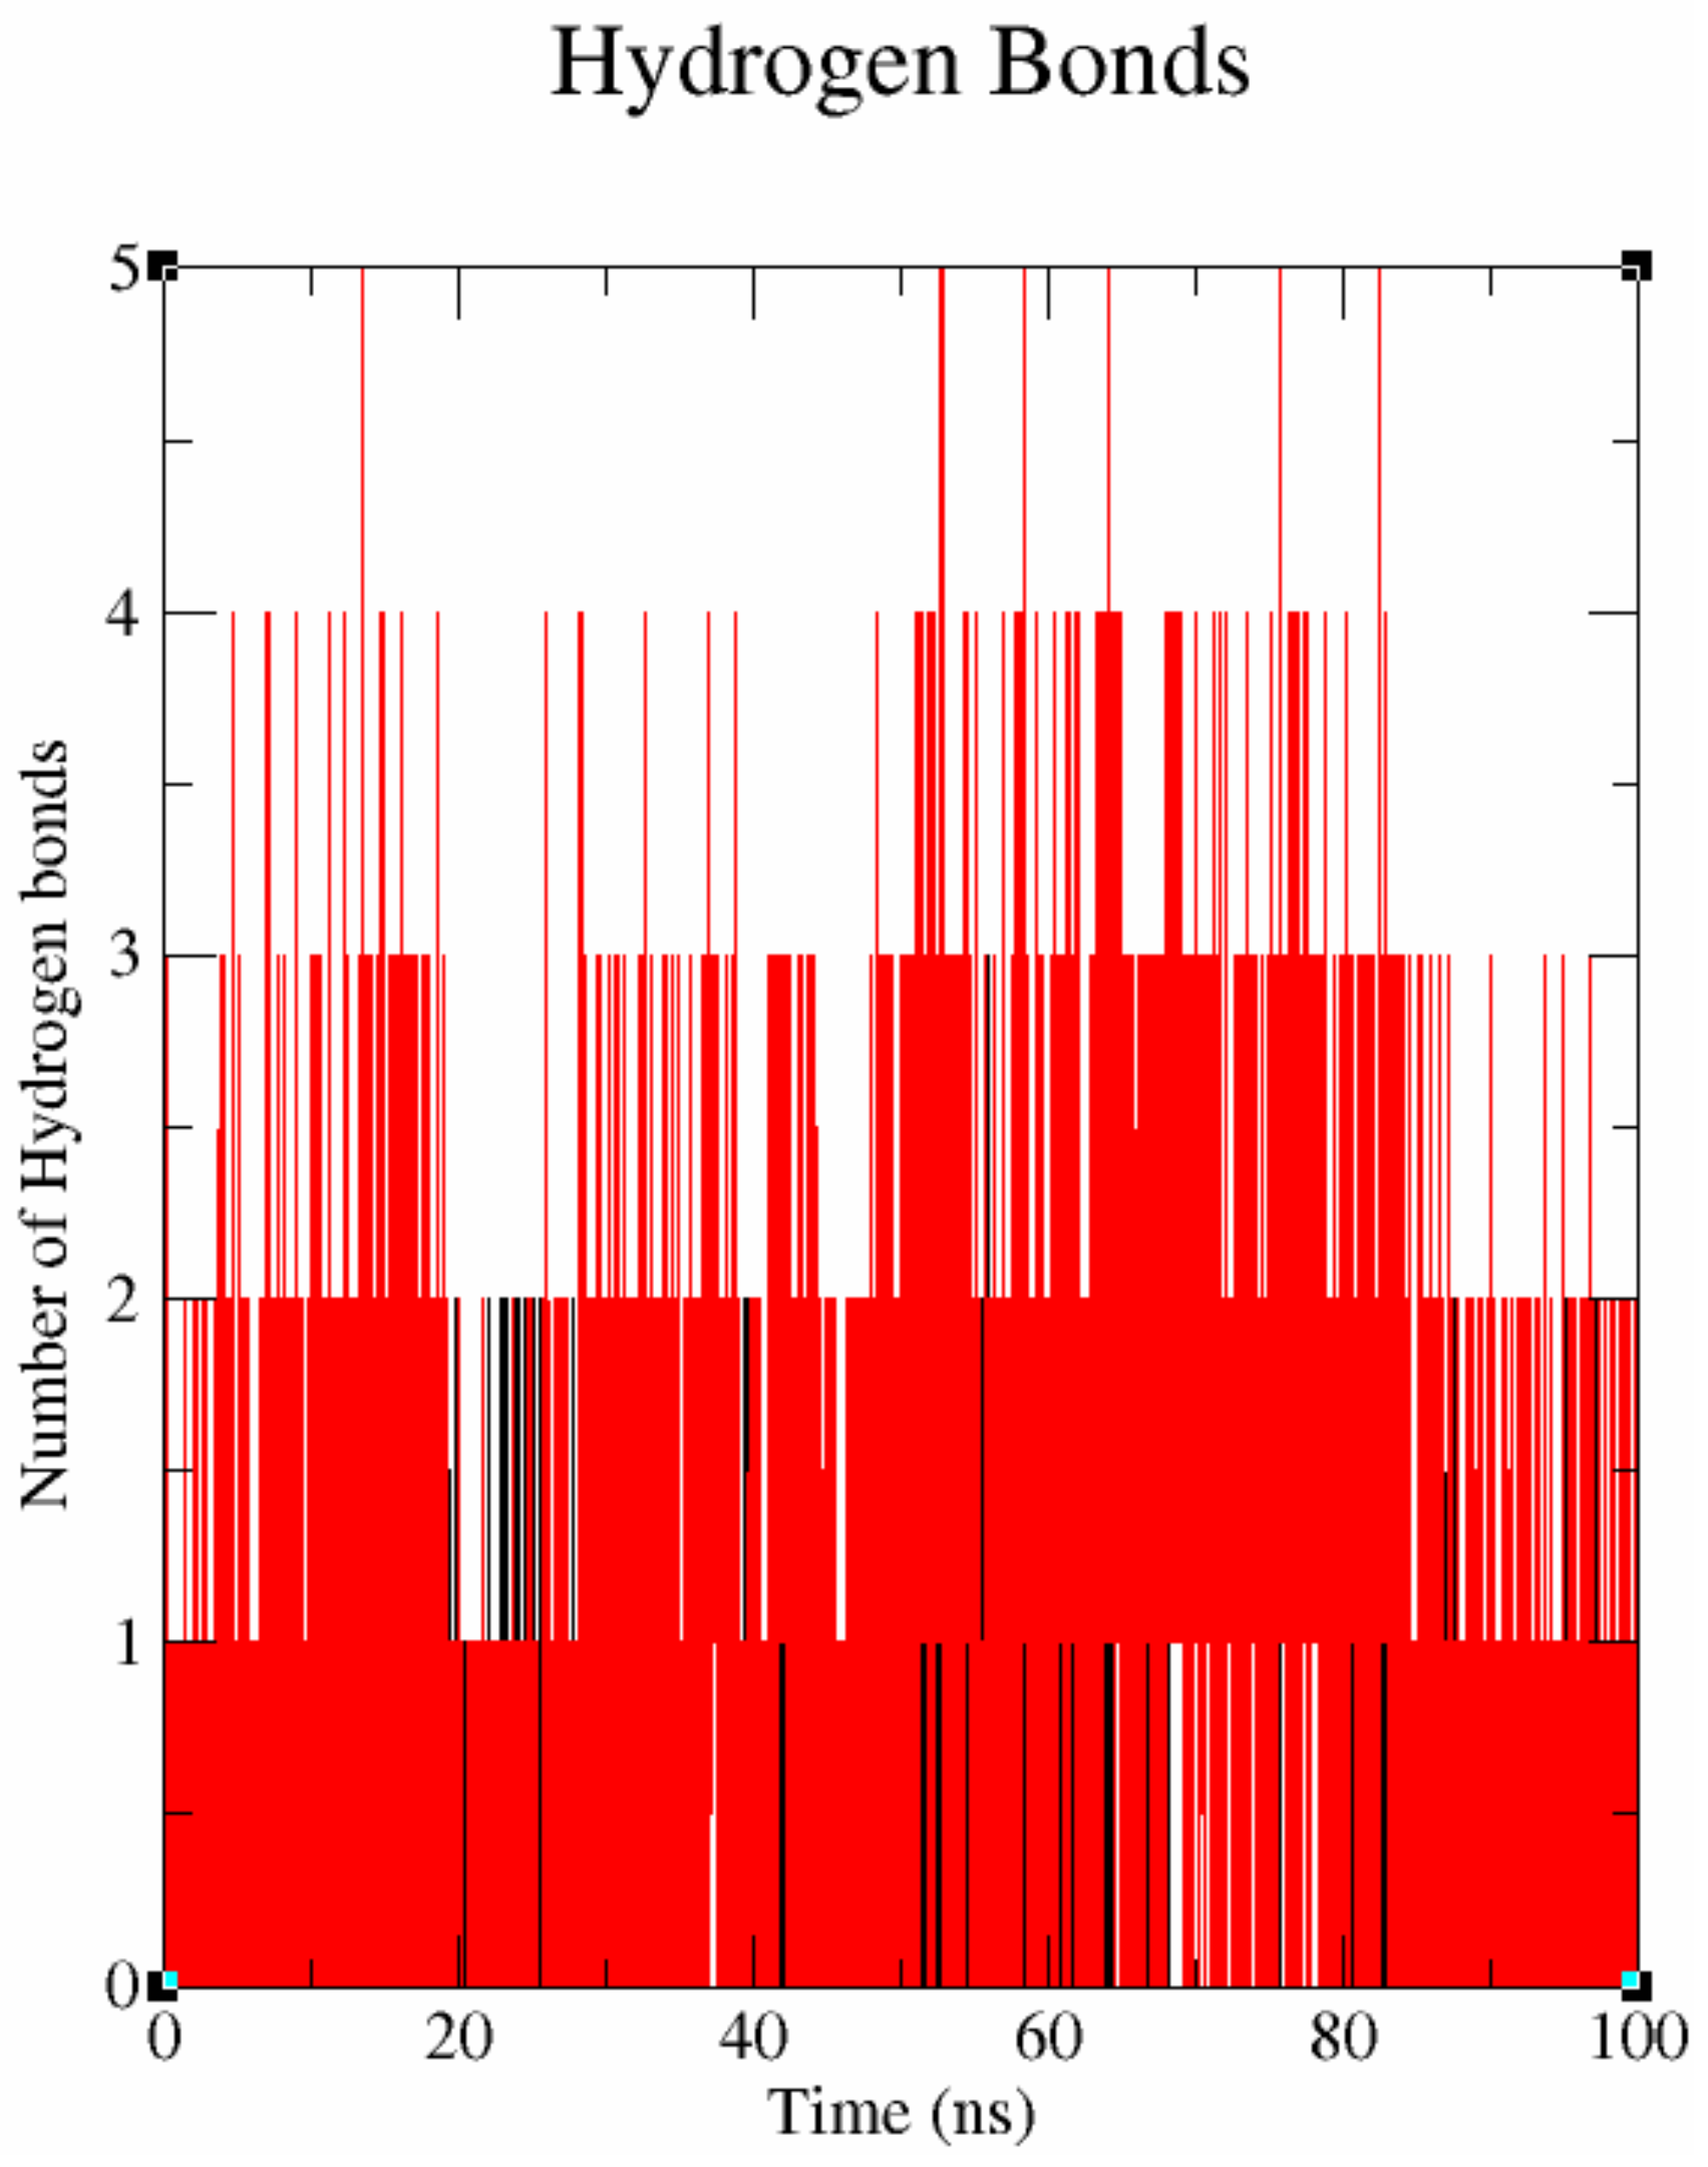
The stability of the protein–ligand complex is maintained by various binding interactions including electrostatic, π–π stacking, hydrogen bonds, hydrophobic interactions, etc. [35]. Amongst other interactions, the hydrogen bond (H-bond) plays a prominent role in determining the affinity and stability of the protein–ligand complexes [73]. In this study, the existence of hydrogen bonding was observed for the ACCase–FPPE and ACCase–sinigrin complexes using MD trajectory (Figure 7). The figure depicts that the sinigrin (hit) forms ~0–5 H-bonds with the binding site of the protein. While FPPE (reference) exhibits only ~0–2 H-bonds with the protein. It is important to mention that the obtained results were well correlated with the docking results. From the analysis, the ACCase–sinigrin complex showed the highest occupancy rate of H-bonds, which confirms the stability of the system during simulation.

3.7.4. Essential Dynamics

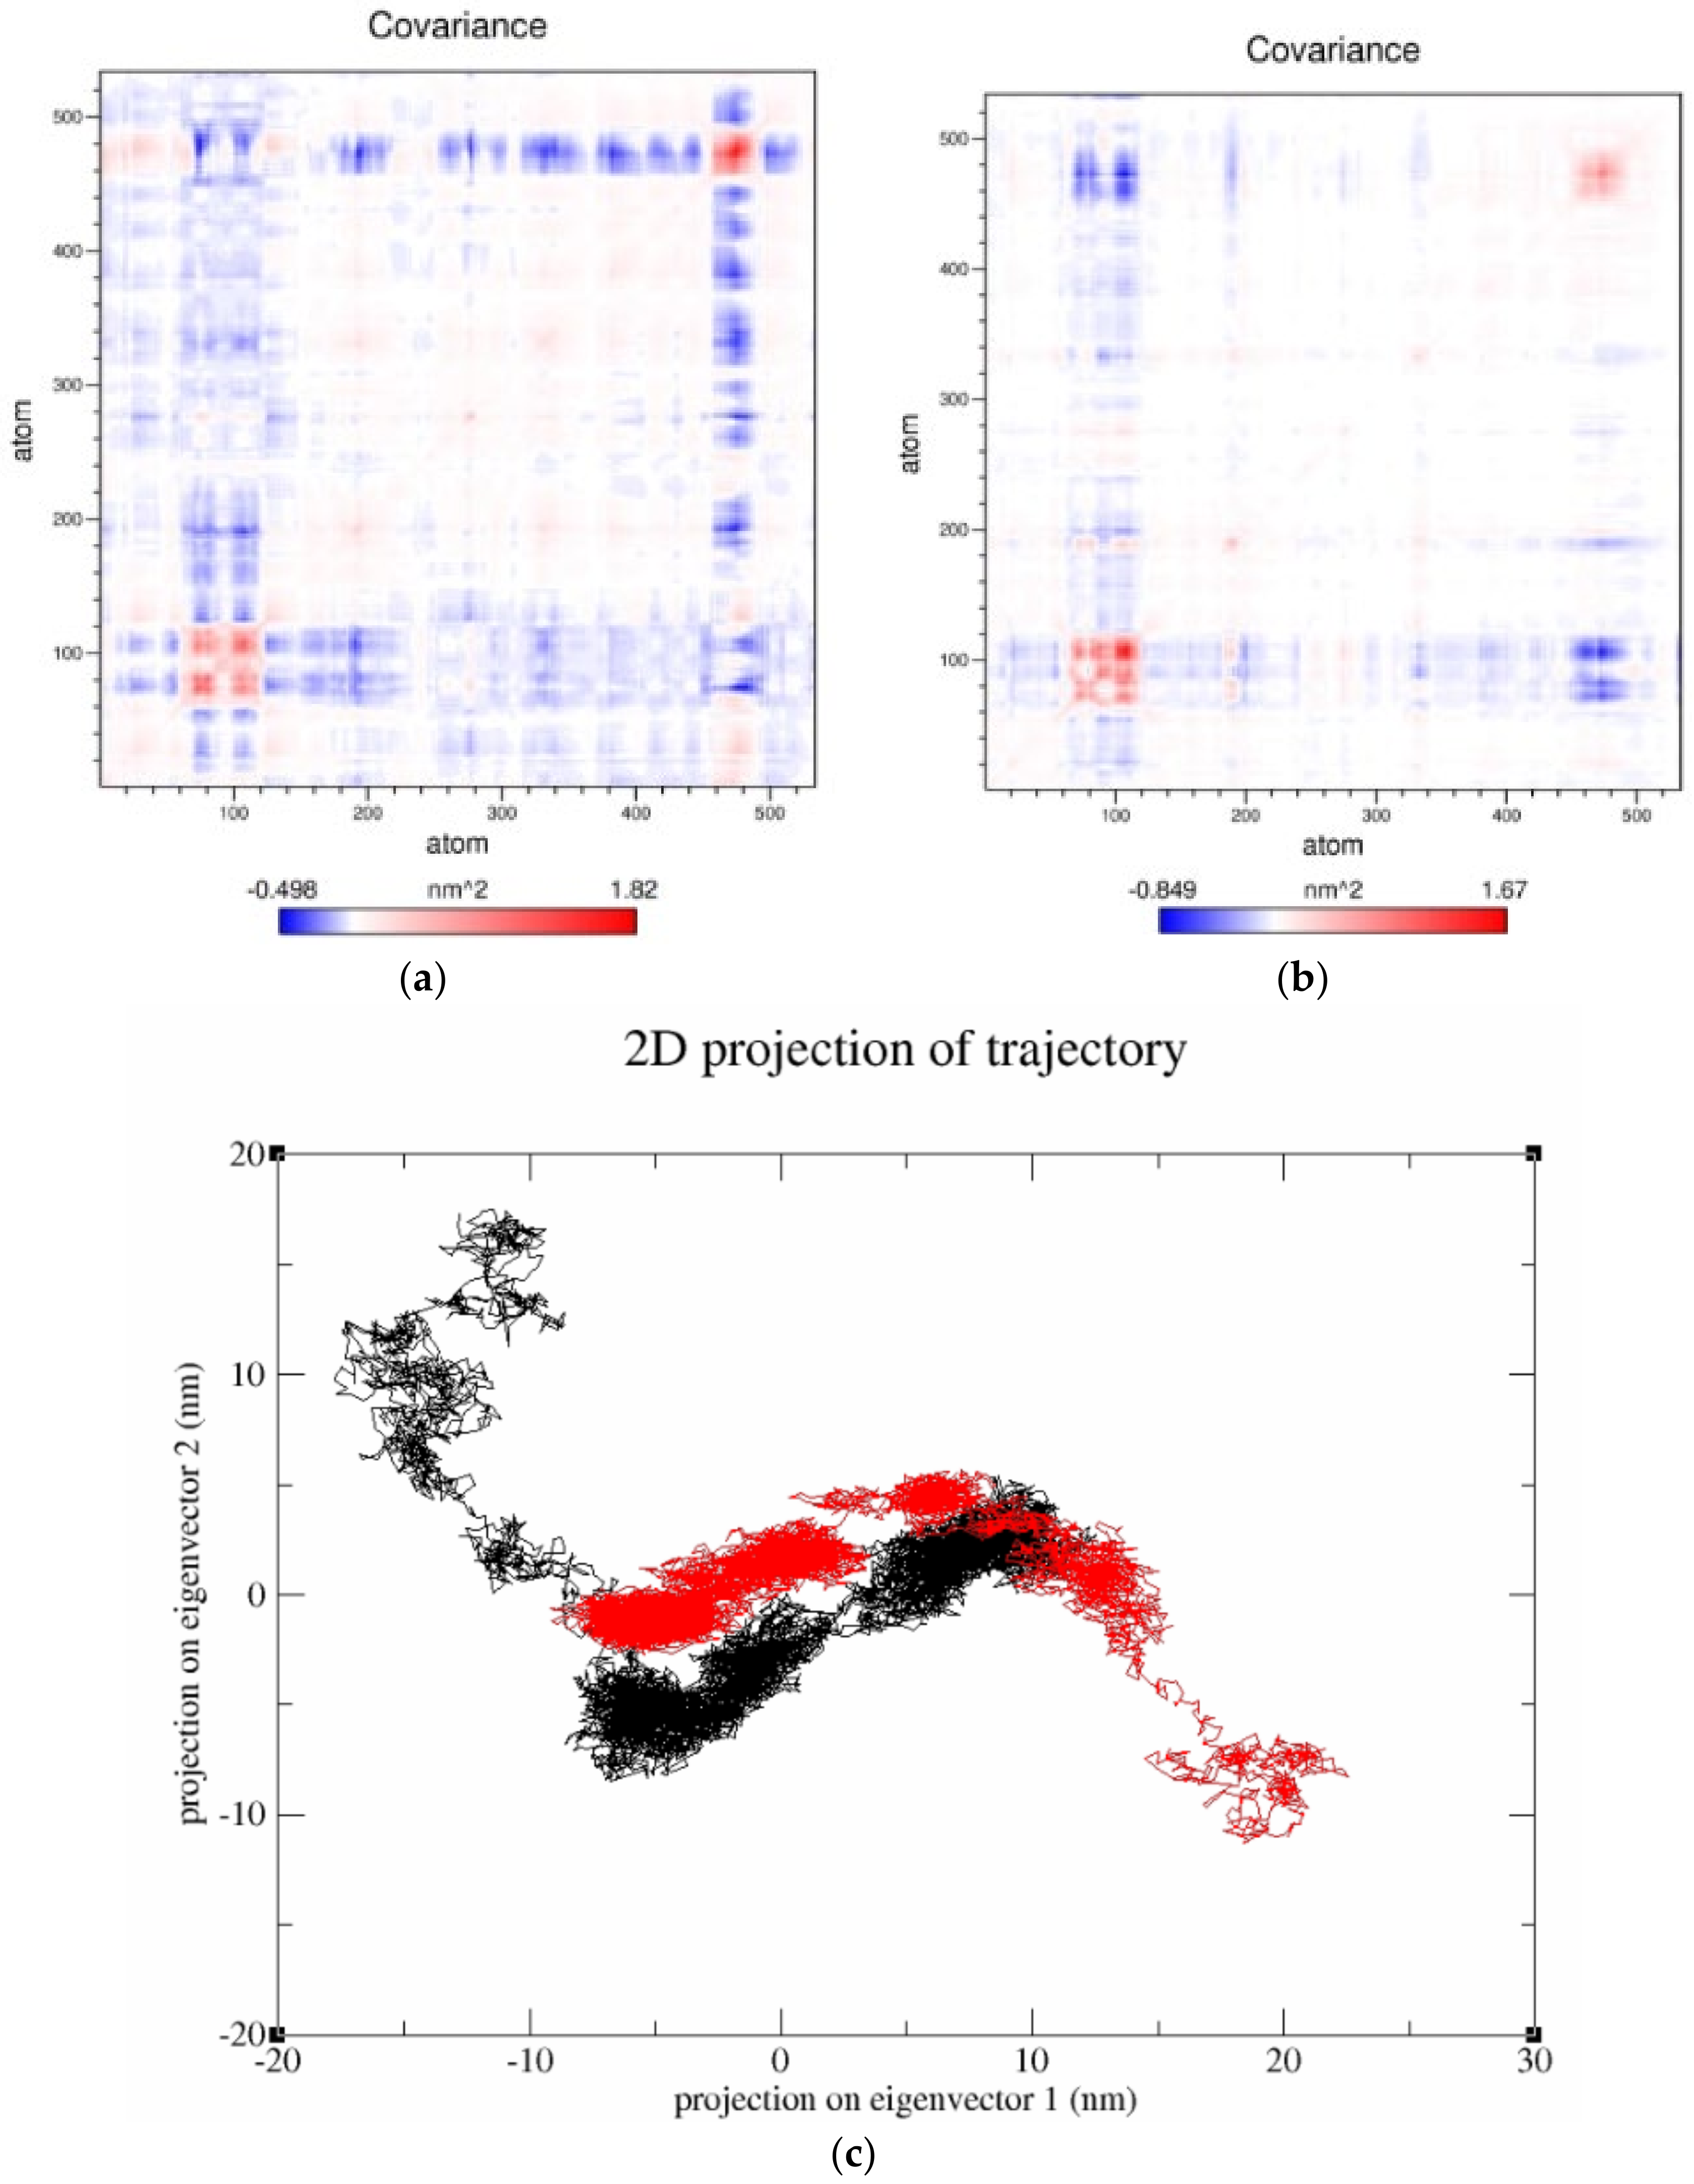
One of the most prominent techniques for understanding the probable conformational changes of proteins is the essential dynamics (ED). In general, ED is a method of retrieving substantial motion from atomic trajectories of proteins using the application of principal component analysis (PCA) [72]. It is important to note that the first few eigenvectors play a critical role in analyzing the collective motion of the protein [71]. Therefore, in this study, the first two eigenvectors (PC1 and PC2) were used to perform PCA with the aid of a covariance matrix [67,72]. Further, the eigenvalues retrieved from the diagonalized covariance matrix provide information about the correlated motions of the protein. The color gradient of the covariance matrix from blue to red specifies the anticorrelated and positively correlated motions of atom pairs [74]. As shown in Figure 8a,b, the covariance matrix of the ACCase–FPPE complex showed a strong negative correlation (dominance of blue color) in comparison to the that of ACCase–sinigrin complex. In addition, the stability of the protein–ligand complex was calculated by the trace of diagonalized covariance matrix value. A lower trace value indicates higher stability while a higher trace value depicts higher flexibility of the protein–ligand system [75]. In our study, the trace value of the reference and the hit compound was 103.329 and 74.4338 nm2, respectively. Thus, the lower trace value of the hit compound confirms the overall stability of the ACCase–sinigrin complex than the native complex. Moreover, the 2D projection plot of PCA is another method to illustrate the dynamics of a protein in the essential subspace of the system [76]. Noteworthily, the protein–ligand system occupying less space was more stable, whereas the largely occupied system was less stable [77]. From Figure 8c, we observed that the overall motion of the ACCase–FPPE complex was confined within the eigenvalues ranging from −18 to 13 nm and −9 to 18 nm along with the projection of eigenvector1 and eigenvector2. Similarly, the ACCase–sinigrin complex showed eigenvalues of −9 to 23 nm and 5 to −12 nm. Therefore, our study confirms that less space was occupied by the ACCase–sinigrin complex than the ACCase–FPPE complex as shown in Figure 7. Thus, the outcome of the PCA analysis was well correlated with the previous findings and confirms the higher stability of the ACCase–sinigrin complex.

3.7.5. Free Energy Landscape (FEL) Analysis

The protein folding patterns and conformational changes of the protein–ligand complex was predicted using Gibbs free energy along with the principal components [67]. The color ramp from blue to red of the FEL plot indicates the more and less stable regions of the protein–ligand complex as shown in Figure 9a,b. Importantly, the highly stable regions are referred to as energy minima conformation [78]. It is evident from the figure that both the reference and hit complex had global energy minima conformation with a slight variation. However, the ACCase–sinigrin complex showed a wider energy basin, whereas the ACCase–FPPE complex showed a narrow energy basin. In concordance with the previous results, FEL analysis also undoubtedly proves that the hit complex is thermodynamically more favorable than the reference complex.

3.8. MM/PBSA Calculation

The molecular dynamic conformations of the complexes were used to estimate the binding free energy calculations. It is notable that the binding free energy values obtained from MM/PBSA studies were very well correlated (R2 = 0.71) with the experimentally determined binding affinity values [79]. The average binding free energy and their associated energy terms of sinigrin and fenoxaprop-P-ethyl are arranged in Table 4. It is evident from the table that van der Waal interaction energy was the most dominant contributor to the total binding free energy value in both systems. This implies that both systems have a significant amount of hydrophobic interaction between protein and ligand molecules [80]. The electrostatic and polar energy components displayed marginally equivalent values in both cases. However, the higher deviation in SAV energy displayed by the sinigrin system (−81.638 ± 64.592 kJ/mol) supports the better binding potential of this compound. Overall, the average binding free energy value of sinigrin (−145.631 ± 73.851 kJ/mol) was higher than that of fenoxaprop-P-ethyl (−129.390 ± 111.326 kJ/mol). Thus, we conclude that sinigrin was the better candidate, making a tight-bound complex with the target protein than the fenoxaprop-p-ethyl.

4. Conclusions

The ideal investigation of this work focused on identifying the promising phytotoxic herbicides against the ACCase target of E. crus-galli. Here, we adopted computational approaches to design and discover the novel herbicide compound. Initially, Tanimoto similarity was employed to filter out the non-identical compounds. Molecular docking minimized the false-positive hits based on the binding affinity toward the target. As a result, 197 compounds showing higher XP GScore than the reference (FPPE) compound were considered for the analysis. Further, binding free energy was calculated for the XP-docked complexes that ultimately resulted in seven lead compounds. Note that herbicide-likeness was analyzed based on the Tice rule. From the analyses, three lead compounds produced satisfactory results. In essence, literature evidence unveiled that sinigrin would serve as the most promising natural phytotoxin herbicide against the ACCase enzyme among the three compounds. Of note, the sinigrin complex exhibited better results in terms of RMSD, RMSF, hydrogen bond, and PCA analysis than FPPE during simulation studies. In addition, the binding energy resulted from MM/PBSA analysis certainly validate the activity of the sinigrin against ACCase protein. This collective evidence indicates that the sinigrin compound might act as a potential phytotoxin for weed management in the paddy field. Overall, the attempt of our study has laid the foundation for developing novel bioherbicides in the future.

Supplementary Materials

The following supporting information can be downloaded at https://www.mdpi.com/article/10.3390/agronomy12071635/s1: Table S1: Tanimoto similarity and docking scores of the XP-screened compounds.

Author Contributions

R.K. conceived and planned the present study. A.A. carried out the experiments. R.K. contributed to the interpretation of the results. A.A. wrote the first draft of the manuscript. R.K. provided critical feedback and helped to draft the manuscript and supervised the entire study. All authors have read and agreed to the published version of the manuscript.

Funding

This research received no external funding.

Institutional Review Board Statement

Not applicable.

Informed Consent Statement

Not applicable.

Data Availability Statement

Not applicable.

Acknowledgments

The authors thank the management of Vellore Institute of Technology for providing the facilities and necessary funding to carry out this research work.

Conflicts of Interest

We wish to confirm that there are no known conflict of interest associated with this publication.

References

  1. Anami, B.S.; Malvade, N.N.; Palaiah, S. Classification of yield affecting biotic and abiotic paddy crop stresses using field images. Inf. Process. Agric. 2020, 7, 272–285. [Google Scholar] [CrossRef]
  2. Fahad, S.; Adnan, M.; Noor, M.; Arif, M.; Alam, M.; Khan, I.A.; Ullah, H.; Wahid, F.; Mian, I.A.; Jamal, Y.; et al. Major constraints for global rice production. In Advances in Rice Research for Abiotic Stress Tolerance; Woodhead Publishing: Sawston, UK, 2019; pp. 1–22. [Google Scholar] [CrossRef]
  3. Biswas, B.; Timsina, J.; Garai, S.; Mondal, M.; Banerjee, H.; Adhikary, S.; Kanthal, S. Weed control in trans-planted rice with post-emergence herbicides and their effects on subsequent rapeseed in Eastern India. Int. J. Pest Manag. 2020, 64, 1–13. [Google Scholar] [CrossRef]
  4. Gharde, Y.; Singh, P.K.; Dubey, R.P.; Gupta, P.K. Assessment of yield and economic losses in agriculture due to weeds in India. Crop Prot. 2018, 107, 12–18. [Google Scholar] [CrossRef]
  5. Golmohammadi, M.J.; Chamanabad, H.R.M.; Yaghoubi, B.; Oveisi, M. Study of postharvest weed population in paddy fields. Sarhad J. Agric. 2017, 34, 395–399. [Google Scholar] [CrossRef]
  6. Sardana, V.; Mahajan, G.; Jabran, K.; Chauhan, B.S. Role of competition in managing weeds: An introduction to the special issue. Crop Prot. 2017, 95, 1–7. [Google Scholar] [CrossRef]
  7. Weerarathne, L.V.Y.; Suriyagoda, L.D.; Marambe, B. Barnyard grass (Echinochloa crus-galli (L.) P. Beauv) is less competitive on rice (Oryza sativa L.) when phosphorus (P) is applied to deeper layers in P-deficient and moisture-limited soils. Plant Soil 2015, 391, 1–17. [Google Scholar] [CrossRef]
  8. Zhang, Y.; Gao, J.; Cen, H.; Lu, Y.; Yu, X.; He, Y.; Pieters, J.G. Automated spectral feature extraction from hyperspectral images to differentiate weedy rice and barnyard grass from a rice crop. Comput. Electron. Agric. 2019, 159, 42–49. [Google Scholar] [CrossRef]
  9. Amaro-Blanco, I.; Romano, Y.; Palmerin, J.A.; Gordo, R.; Palma-Bautista, C.; De Prado, R.; Osuna, M.D. Different Mutations Providing Target Site Resistance to ALS and ACCase-Inhibiting Herbicides in Echinochloa spp. from Rice Fields. Agriculture 2021, 11, 382. [Google Scholar] [CrossRef]
  10. Wang, X.L.; Zhang, Z.Y.; Xu, X.M.; Li, G. The density of barnyard grass affects photosynthesis and physio-logical characteristics of rice. Photosynthetica 2019, 57, 705–711. [Google Scholar] [CrossRef] [Green Version]
  11. Shekhawat, K.; Rathore, S.S.; Chauhan, B.S. Weed management in dry direct-seeded rice: A review on challenges and opportunities for sustainable rice production. Agronomy 2020, 10, 1264. [Google Scholar] [CrossRef]
  12. Hu, L.; Huang, Y.; Ding, B.; Cai, R.; Bai, L. Selective Action Mechanism of Fenclorim on Rice and Echinochloa crus-galli Is Associated with the Inducibility of Detoxifying Enzyme Activities and Antioxidative Defense. J. Agric. Food Chem. 2021, 69, 5830–5839. [Google Scholar] [CrossRef]
  13. Wenger, J.; Niderman, T.; Mathews, C.; Wailes, S. Acetyl-CoA carboxylase inhibitors. In Modern Crop Protection Compounds; Wiley-VCH: Hoboken, NJ, USA, 2019; Volume 3, pp. 501–528. [Google Scholar] [CrossRef]
  14. Fang, J.; He, Z.; Liu, T.; Li, J.; Dong, L. A novel mutation Asp-2078-Glu in ACCase confers resistance to ACCase herbicides in barnyardgrass (Echinochloa crus-galli). Pestic. Biochem. Physiol. 2020, 168, 104634. [Google Scholar] [CrossRef]
  15. Xia, X.; Tang, W.; He, S.; Kang, J.; Ma, H.; Li, J. Mechanism of metamifop inhibition of the carboxyltransferase domain of acetyl-coenzyme A carboxylase in Echinochloa crus-galli. Sci. Rep. 2016, 6, 34066. [Google Scholar] [CrossRef] [Green Version]
  16. Takano, H.K.; Ovejero, R.F.L.; Belchior, G.G.; Maymone, G.P.L.; Dayan, F.E. ACCase-inhibiting herbicides: Mechanism of action, resistance evolution and stewardship. Sci. Agric. 2020, 78, e20190102. [Google Scholar] [CrossRef]
  17. Sabet Zangeneh, H.; Mohammaddust Chamanabad, H.R.; Zand, E.; Asghari, A.; Alamisaeid, K.; Travlos, I.S.; Ale-brahim, M.T. Study of fitness cost in three rigid ryegrass populations susceptible and resistant to acetyl-CoA carboxylase inhibiting herbicides. Front. Ecol. Evol. 2016, 4, 142. [Google Scholar] [CrossRef] [Green Version]
  18. Chen, Z.J.; Qiao, Y.X.; Zhang, N.; Liu, J.; Yang, H. Insight into metabolism pathways of pesticide fomesafen in rice: Reducing cropping and environmental risks. Environ. Pollut. 2021, 283, 117128. [Google Scholar] [CrossRef]
  19. Bagavathiannan, M.V.; Norsworthy, J.K.; Smith, K.L.; Neve, P. Modeling the simultaneous evolution of resistance to ALS-and ACCase-inhibiting herbicides in barnyardgrass (Echinochloa crus-galli) in Clearfield® rice. Weed Technol. 2014, 28, 89–103. [Google Scholar] [CrossRef]
  20. Ye, F.; Ma, P.; Zhang, Y.Y.; Li, P.; Yang, F.; Fu, Y. Herbicidal activity and molecular docking study of novel ACCase inhibitors. Front. Plant Sci. 2018, 9, 1850. [Google Scholar] [CrossRef]
  21. Tandon, S. Dissipation dynamics of fenoxaprop-p-ethyl and fenoxaprop acid under Indian rice field conditions. Int. J. Environ. Anal. Chem. 2017, 97, 1352–1361. [Google Scholar] [CrossRef]
  22. Dash, S.; Duary, B.; Sar, K. Efficacy of fenoxaprop-p-ethyl and penoxsulam for weed management with special emphasis on Echinochloa spp. in transplanted summer rice. Indian J. Weed Sci. 2021, 53, 78–80. [Google Scholar] [CrossRef]
  23. Dubovik, V.; Dalinova, A.; Berestetskiy, A. Effect of adjuvants on herbicidal activity and selectivity of three phytotoxins produced by the fungus, Stagonospora Cirsii. Plants 2020, 9, 1621. [Google Scholar] [CrossRef]
  24. Shen, C.; Tang, W.; Zeng, D.; Xu, H.; Su, W.; Wu, R. Isoxadifen-ethyl derivatives protect rice from fenoxaprop-p-ethyl–associated injury during the control of weedy rice. Weed Sci. 2017, 65, 579–587. [Google Scholar] [CrossRef]
  25. Wu, J.X.; Zhang, Y.; Wang, K.; Zhang, H.Y. Residue analysis and dissipation of fenoxaprop-P-ethyl and its metabolite fenoxaprop-P in rice ecosystem. J. Anal. Chem. 2015, 70, 897–902. [Google Scholar] [CrossRef]
  26. Wu, X.; Huang, T. Recent development in acetyl-CoA carboxylase inhibitors and their potential as novel drugs. Future Med. Chem. 2019, 12, 533–561. [Google Scholar] [CrossRef]
  27. Dayan, F.E.; Duke, S.O. Natural compounds as next-generation herbicides. Plant Physiol. 2014, 166, 1090–1105. [Google Scholar] [CrossRef] [Green Version]
  28. Wang, L.; Wang, M.; Fu, Y.; Huang, P.; Kong, D.; Niu, G. Engineered biosynthesis of thaxtomin phytotoxins. Crit. Rev. Biotechnol. 2020, 40, 1163–1171. [Google Scholar] [CrossRef]
  29. Bordin, E.R.; Frumi Camargo, A.; Stefanski, F.S.; Scapini, T.; Bonatto, C.; Zanivan, J.; Preczeski, K.; Modkovski, T.A.; Reichert Junior, F.; Mossi, A.J.; et al. Current production of bioherbicides: Mechanisms of action and technical and scientific challenges to improve food and environmental security. Biocatal. Biotransform. 2021, 39, 346–359. [Google Scholar] [CrossRef]
  30. Chen, H.; Singh, H.; Bhardwaj, N.; Bhardwaj, S.K.; Khatri, M.; Kim, K.H.; Peng, W. An exploration on the toxicity mechanisms of phytotoxins and their potential utilities. Crit. Rev. Biotechnol. 2022, 52, 395–435. [Google Scholar] [CrossRef]
  31. Dass, A.; Shekhawat, K.; Choudhary, A.K.; Sepat, S.; Rathore, S.S.; Mahajan, G.; Chauhan, B.S. Weed management in rice using crop competition-a review. Crop Prot. 2017, 95, 45–52. [Google Scholar] [CrossRef]
  32. Jain, C.K.; Gupta, M.; Prasad, Y.; Wadhwa, G.; Sharma, S.K. Homology modelling and molecular dynamics simulations of a protein serine/threonine phosphatase stp1 in Staphylococcus aureus N315: A potential drug target. Mol. Simul. 2015, 41, 592–599. [Google Scholar] [CrossRef]
  33. Sobolev, O.V.; Afonine, P.V.; Moriarty, N.W.; Hekkelman, M.L.; Joosten, R.P.; Perrakis, A.; Adams, P.D. A global Ramachandran score identifies protein structures with unlikely stereochemistry. Structure 2020, 28, 1249–1258. [Google Scholar] [CrossRef] [PubMed]
  34. Panda, S.K.; Saxena, S.; Guruprasad, L. Homology modeling, docking and structure-based virtual screening for new inhibitor identification of Klebsiella pneumoniae heptosyltransferase-III. J. Biomol. Struct. 2019, 38, 1887–1902. [Google Scholar] [CrossRef] [PubMed]
  35. Idris, M.O.; Yekeen, A.A.; Alakanse, O.S.; Durojaye, O.A. Computer-aided screening for potential TMPRSS2 inhibitors: A combination of pharmacophore modeling, molecular docking and molecular dynamics simulation approaches. J. Biomol. Struct. 2021, 39, 5638–5656. [Google Scholar] [CrossRef] [PubMed]
  36. Bathula, R.; Lanka, G.; Muddagoni, N.; Dasari, M.; Nakkala, S.; Bhargavi, M.; Somadi, G.; Sivan, S.K.; Potlapally, S.R. Identification of potential Aurora kinase-C protein inhibitors: An amalgamation of energy minimization, virtual screening, prime MMGBSA and AutoDock. J. Biomol. Struct. 2019, 38, 2314–2325. [Google Scholar] [CrossRef]
  37. Wiederstein, M.; Sippl, M.J. ProSA-web: Interactive web service for the recognition of errors in three-dimensional structures of proteins. Nucleic Acids Res. 2007, 35, W407–W410. [Google Scholar] [CrossRef] [Green Version]
  38. Muddagoni, N.; Bathula, R.; Dasari, M.; Potlapally, S.R. Homology Modeling, Virtual Screening, Prime-MMGBSA, AutoDock-Identification of Inhibitors of FGR Protein. Biointerface Res. Appl. Chem. 2020, 11, 11088–11103. [Google Scholar] [CrossRef]
  39. Selvaraj, C.; Dinesh, D.C.; Panwar, U.; Abhirami, R.; Boura, E.; Singh, S.K. Structure-based virtual screening and molecular dynamics simulation of SARS-CoV-2 Guanine-N7 methyltransferase (nsp14) for identifying antiviral in-hibitors against COVID-19. J. Biomol. Struct. Dyn. 2021, 39, 4582–4593. [Google Scholar] [CrossRef]
  40. Hemmati, S.A.; Karam Kiani, N.; Serrão, J.E.; Jitonnom, J. Inhibitory potential of a designed peptide inhibitor based on zymogen structure of trypsin from Spodoptera frugiperda: In silico insights. Int. J. Pept. Res. Ther. 2021, 27, 1677–1687. [Google Scholar] [CrossRef]
  41. Gunthardt, B.F.; Hollender, J.; Hungerbuhler, K.; Scheringer, M.; Bucheli, T.D. Comprehensive toxic plants–phytotoxins database and its application in assessing aquatic micropollution potential. J. Agric. Food Chem. 2018, 66, 7577–7588. [Google Scholar] [CrossRef]
  42. Sorokina, M.; Merseburger, P.; Rajan, K.; Yirik, M.A.; Steinbeck, C. COCONUT online: Collection of open natural products database. J. Cheminform. 2021, 13, 2. [Google Scholar] [CrossRef]
  43. Pattar, S.V.; Adhoni, S.A.; Kamanavalli, C.M.; Kumbar, S.S. In silico molecular docking studies and MM/GBSA analysis of coumarin-carbonodithioate hybrid derivatives divulge the anticancer potential against breast cancer. Beni-Suef Univ. J. Basic Appl. Sci. 2020, 9, 36. [Google Scholar] [CrossRef]
  44. Bangarwa, S.K.; Norsworthy, J.K. Glucosinolate and Isothiocyanate Production for Weed Control in Plasticulture Production System. In Glucosinolates; Mérillon, J.M., Ramawat, K., Eds.; Reference Series in Phytochemistry; Springer: Cham, Switzerland, 2016; pp. 1–35. [Google Scholar] [CrossRef]
  45. Mellor, C.L.; Robinson, R.M.; Benigni, R.; Ebbrell, D.; Enoch, S.J.; Firman, J.W.; Madden, J.C.; Pawar, G.; Yang, C.; Cronin, M.T.D. Molecular fingerprint-derived similarity measures for toxicological read-across: Recommendations for optimal use. Regul. Toxicol. Pharmacol. 2019, 101, 121–134. [Google Scholar] [CrossRef]
  46. Muegge, I.; Mukherjee, P. An overview of molecular fingerprint similarity search in virtual screening. Expert Opin. Drug Discov. 2016, 11, 137–148. [Google Scholar] [CrossRef]
  47. Bragina, M.E.; Daina, A.; Perez, M.A.; Michielin, O.; Zoete, V. The SwissSimilarity 2021 Web Tool: Novel Chemical Libraries and Additional Methods for an Enhanced Ligand-Based Virtual Screening Experience. Int. J. Mol. Sci. 2022, 23, 811. [Google Scholar] [CrossRef]
  48. Landrum, G. RDKit: Open-Source Cheminformatics, GitHub. 2019. Available online: https://github.com/rdkit/rdkit (accessed on 28 January 2022).
  49. Gudipati, S.; Muttineni, R.; Mankad, A.U.; Pandya, H.A.; Jasrai, Y.T. Molecular docking-based screening of Noggin inhibitors. Bioinformation 2018, 14, 15. [Google Scholar] [CrossRef] [Green Version]
  50. Srinivasan, P.; Vijayakumar, S.; Kothandaraman, S.; Palani, M. Anti-diabetic activity of quercetin extracted from Phyllanthus emblica L. fruit: In silico and in vivo approaches. J. Pharm. Anal. 2018, 8, 109–118. [Google Scholar] [CrossRef]
  51. Lanka, G.; Bathula, R.; Dasari, M.; Nakkala, S.; Bhargavi, M.; Somadi, G.; Potlapally, S.R. Structure-based identification of potential novel inhibitors targeting FAM3B (PANDER) causing type 2 diabetes mellitus through virtual screening. J. Recept. Signal Transduct. 2019, 39, 253–263. [Google Scholar] [CrossRef]
  52. Yadav, M.; Dhagat, S.; Eswari, J.S. Structure Based Drug Design and Molecular Docking Studies of Anticancer Molecules Paclitaxel, Etoposide and Topotecan using Novel Ligands. Curr. Drug Discov. Technol. 2020, 17, 183–190. [Google Scholar] [CrossRef]
  53. Poopandi, S.; Sundaraj, R.; Rajmichael, R.; Thangaraj, S.; Dhamodharan, P.; Biswal, J.; Malaisamy, V.; Pandian, C.J.; Jeyaraman, J. Computational screening of potential inhibitors targeting MurF of Brugia malayi Wolbachia through multi-scale molecular docking, molecular dynamics and MM-GBSA analysis. Mol. Biochem. Parasitol. 2021, 246, 111427. [Google Scholar] [CrossRef]
  54. Shahroz, M.M.; Sharma, H.K.; Altamimi, A.S.; Alamri, M.A.; Ali, A.; Ali, A.; Alqahtani, S.; Altharawi, A.; Alabbas, A.B.; Alossaimi, M.A.; et al. Novel and Potential Small Molecule Scaffolds as DYRK1A Inhibitors by Integrated Molecular Docking-Based Virtual Screening and Dynamics Simulation Study. Molecules 2022, 27, 1159. [Google Scholar] [CrossRef]
  55. Kellici, T.F.; Ntountaniotis, D.; Liapakis, G.; Tzakos, A.G.; Mavromoustakos, T. The dynamic properties of angiotensin II type 1 receptor inverse agonists in solution and in the receptor site. Arab. J. Chem. 2019, 12, 5062–5078. [Google Scholar] [CrossRef]
  56. Zhang, Y.; Lorsbach, B.A.; Castetter, S.; Lambert, W.T.; Kister, J.; Wang, N.X.; Klittich, C.J.; Roth, J.; Sparks, T.C.; Loso, M.R. Physicochemical property guidelines for modern agrochemicals. Pest Manag. Sci. 2018, 74, 1979–1991. [Google Scholar] [CrossRef] [PubMed]
  57. Avram, S.; Funar-Timofei, S.; Borota, A.; Chennamaneni, S.R.; Manchala, A.K.; Muresan, S. Quantitative estimation of pesticide-likeness for agrochemical discovery. J. Cheminform. 2014, 6, 42. [Google Scholar] [CrossRef] [PubMed] [Green Version]
  58. Isa, M.A.; Majumdar, R.S.; Haider, S. In silico identification of potential inhibitors against shikimate dehydrogenase through virtual screening and toxicity studies for the treatment of tuberculosis. Int. J. Microbiol. 2019, 22, 7–17. [Google Scholar] [CrossRef]
  59. Kumari, R.; Kumar, R.; Open-Source Drug Discovery Consortium; Lynn, A. g_mmpbsa—A GROMACS tool for high-throughput MM-PBSA calculations. J. Chem. Inf. Model. 2014, 54, 1951–1962. [Google Scholar] [CrossRef]
  60. Thirunavukkarasu, M.K.; Shin, W.H.; Karuppasamy, R. Exploring safe and potent bioactives for the treatment of non-small cell lung cancer. 3 Biotech 2021, 11, 241. [Google Scholar] [CrossRef]
  61. Lenselink, E.B.; Beuming, T.; van Veen, C.; Massink, A.; Sherman, W.; van Vlijmen, H.W.; IJzerman, A.P. In search of novel ligands using a structure-based approach: A case study on the adenosine A2A receptor. J. Comput. Aided Mol. Des. 2016, 30, 863–874. [Google Scholar] [CrossRef] [Green Version]
  62. Wang, L.; Ma, C.; Wipf, P.; Liu, H.; Su, W.; Xie, X.Q. TargetHunter: An in-silico target identification tool for predicting therapeutic potential of small organic molecules based on chemogenomic database. AAPS J. 2013, 15, 395–406. [Google Scholar] [CrossRef] [Green Version]
  63. Tripathi, S.K.; Muttineni, R.; Singh, S.K. Extra precision docking, free energy calculation and molecular dynamics simulation studies of CDK2 inhibitors. J. Theor. Biol. 2013, 334, 87–100. [Google Scholar] [CrossRef]
  64. Motmainna, M.; Juraimi, A.S.; Uddin, M.K.; Asib, N.B.; Islam, A.K.M.M.; Hasan, M. Assessment of allelopathic compounds to develop new natural herbicides: A review. Allelopath. J. 2021, 52, 21–40. [Google Scholar] [CrossRef]
  65. Mazumder, A.; Dwivedi, A.; Du Plessis, J. Sinigrin and its therapeutic benefits. Molecules 2016, 21, 416. [Google Scholar] [CrossRef] [Green Version]
  66. Manallack, D.T. The acid/base profile of agrochemicals. SAR QSAR Environ. Res. 2017, 28, 621–628. [Google Scholar] [CrossRef]
  67. Agrahari, A.K.; Sneha, P.; George Priya Doss, C.; Siva, R.; Zayed, H. A profound computational study to pri-oritize the disease-causing mutations in PRPS1 gene. Metab. Brain Dis. 2018, 33, 589–600. [Google Scholar] [CrossRef]
  68. Ononamadu, C.J.; Abdalla, M.; Ihegboro, G.O.; Li, J.; Owolarafe, T.A.; John, T.D.; Tian, Q. In silico identification and study of potential anti-mosquito juvenile hormone binding protein (MJHBP) compounds as candidates for dengue virus-Vector insecticides. Biochem. Biophys. Rep. 2021, 28, 101178. [Google Scholar] [CrossRef]
  69. Prabhu, N.; Sharp, K. Protein−solvent interactions. Chem. Rev. 2006, 106, 1616–1623. [Google Scholar] [CrossRef] [Green Version]
  70. Trisciuzzi, D.; Nicolotti, O.; Miteva, M.A.; Villoutreix, B.O. Analysis of solvent-exposed and buried co-crystallized ligands: A case study to support the design of novel protein–protein interaction inhibitors. Drug Discov. Today 2019, 24, 551–559. [Google Scholar] [CrossRef]
  71. Shukla, R.; Shukla, H.; Kalita, P.; Sonkar, A.; Pandey, T.; Singh, D.B.; Tripathi, T. Identification of potential inhibitors of Fasciola gigantica thioredoxin1: Computational screening, molecular dynamics simulation, and binding free energy studies. J. Biomol. Struct. Dyn. 2018, 36, 2147–2162. [Google Scholar] [CrossRef]
  72. Rampogu, S.; Lemuel, M.R.; Lee, K.W. Virtual screening, molecular docking, molecular dynamics simulations and free energy calculations to discover potential DDX3 inhibitors. Adv. Cancer Biol. Metastasis 2022, 4, 100022. [Google Scholar] [CrossRef]
  73. Li, T.; Pang, W.; Wang, J.; Zhao, Z.; Cheng, L. Docking-based 3D-QSAR, molecular dynamics simulation studies and virtual screening of novel ONC201 analogues targeting Mitochondrial ClpP. J. Mol. Struct. 2021, 1245, 131025. [Google Scholar] [CrossRef]
  74. Aier, I.; Varadwaj, P.K.; Raj, U. Structural insights into conformational stability of both wild-type and mutant EZH2 receptor. Sci. Rep. 2016, 6, 34984. [Google Scholar] [CrossRef] [Green Version]
  75. Kumar, A.; Purohit, R. Computational screening and molecular dynamics simulation of disease associated nsSNPs in CENP-E. Mutat. Res. Fundam. Mol. Mech. Mutagen. 2012, 738, 28–37. [Google Scholar] [CrossRef]
  76. Joshi, T.; Joshi, T.; Pundir, H.; Sharma, P.; Mathpal, S.; Chandra, S. Predictive modeling by deep learning, virtual screening and molecular dynamics study of natural compounds against SARS-CoV-2 main protease. J. Biomol. Struct. 2021, 39, 6728–6746. [Google Scholar] [CrossRef]
  77. Pitaloka, D.A.E.; Ramadhan, D.S.F.; Chaidir, L.; Fakih, T.M. Docking-based virtual screening and molecular dynamics simulations of quercetin analogs as enoyl-acyl carrier protein reductase (InhA) inhibitors of Mycobacterium tuberculosis. Sci. Pharm. 2021, 89, 20. [Google Scholar] [CrossRef]
  78. Agrahari, A.K.; Doss, G.P.C.; Siva, R.; Magesh, R.; Zayed, H. Molecular insights of the G2019S substitution in LRRK2 kinase domain associated with Parkinson’s disease: A molecular dynamics simulation approach. J. Theor. Biol. 2019, 469, 163–171. [Google Scholar] [CrossRef]
  79. Poli, G.; Granchi, C.; Rizzolio, F.; Tuccinardi, T. Application of MM-PBSA methods in virtual screening. Molecules 2020, 25, 1971. [Google Scholar] [CrossRef] [Green Version]
  80. Kumar, A.; Srivastava, G.; Srivastava, S.; Verma, S.; Negi, A.S.; Sharma, A. Investigation of naphthofuran moiety as potential dual inhibitor against BACE-1 and GSK-3β: Molecular dynamics simulations, binding energy, and network analysis to identify first-in-class dual inhibitors against Alzheimer’s disease. J. Mol. Model. 2017, 23, 239. [Google Scholar] [CrossRef]
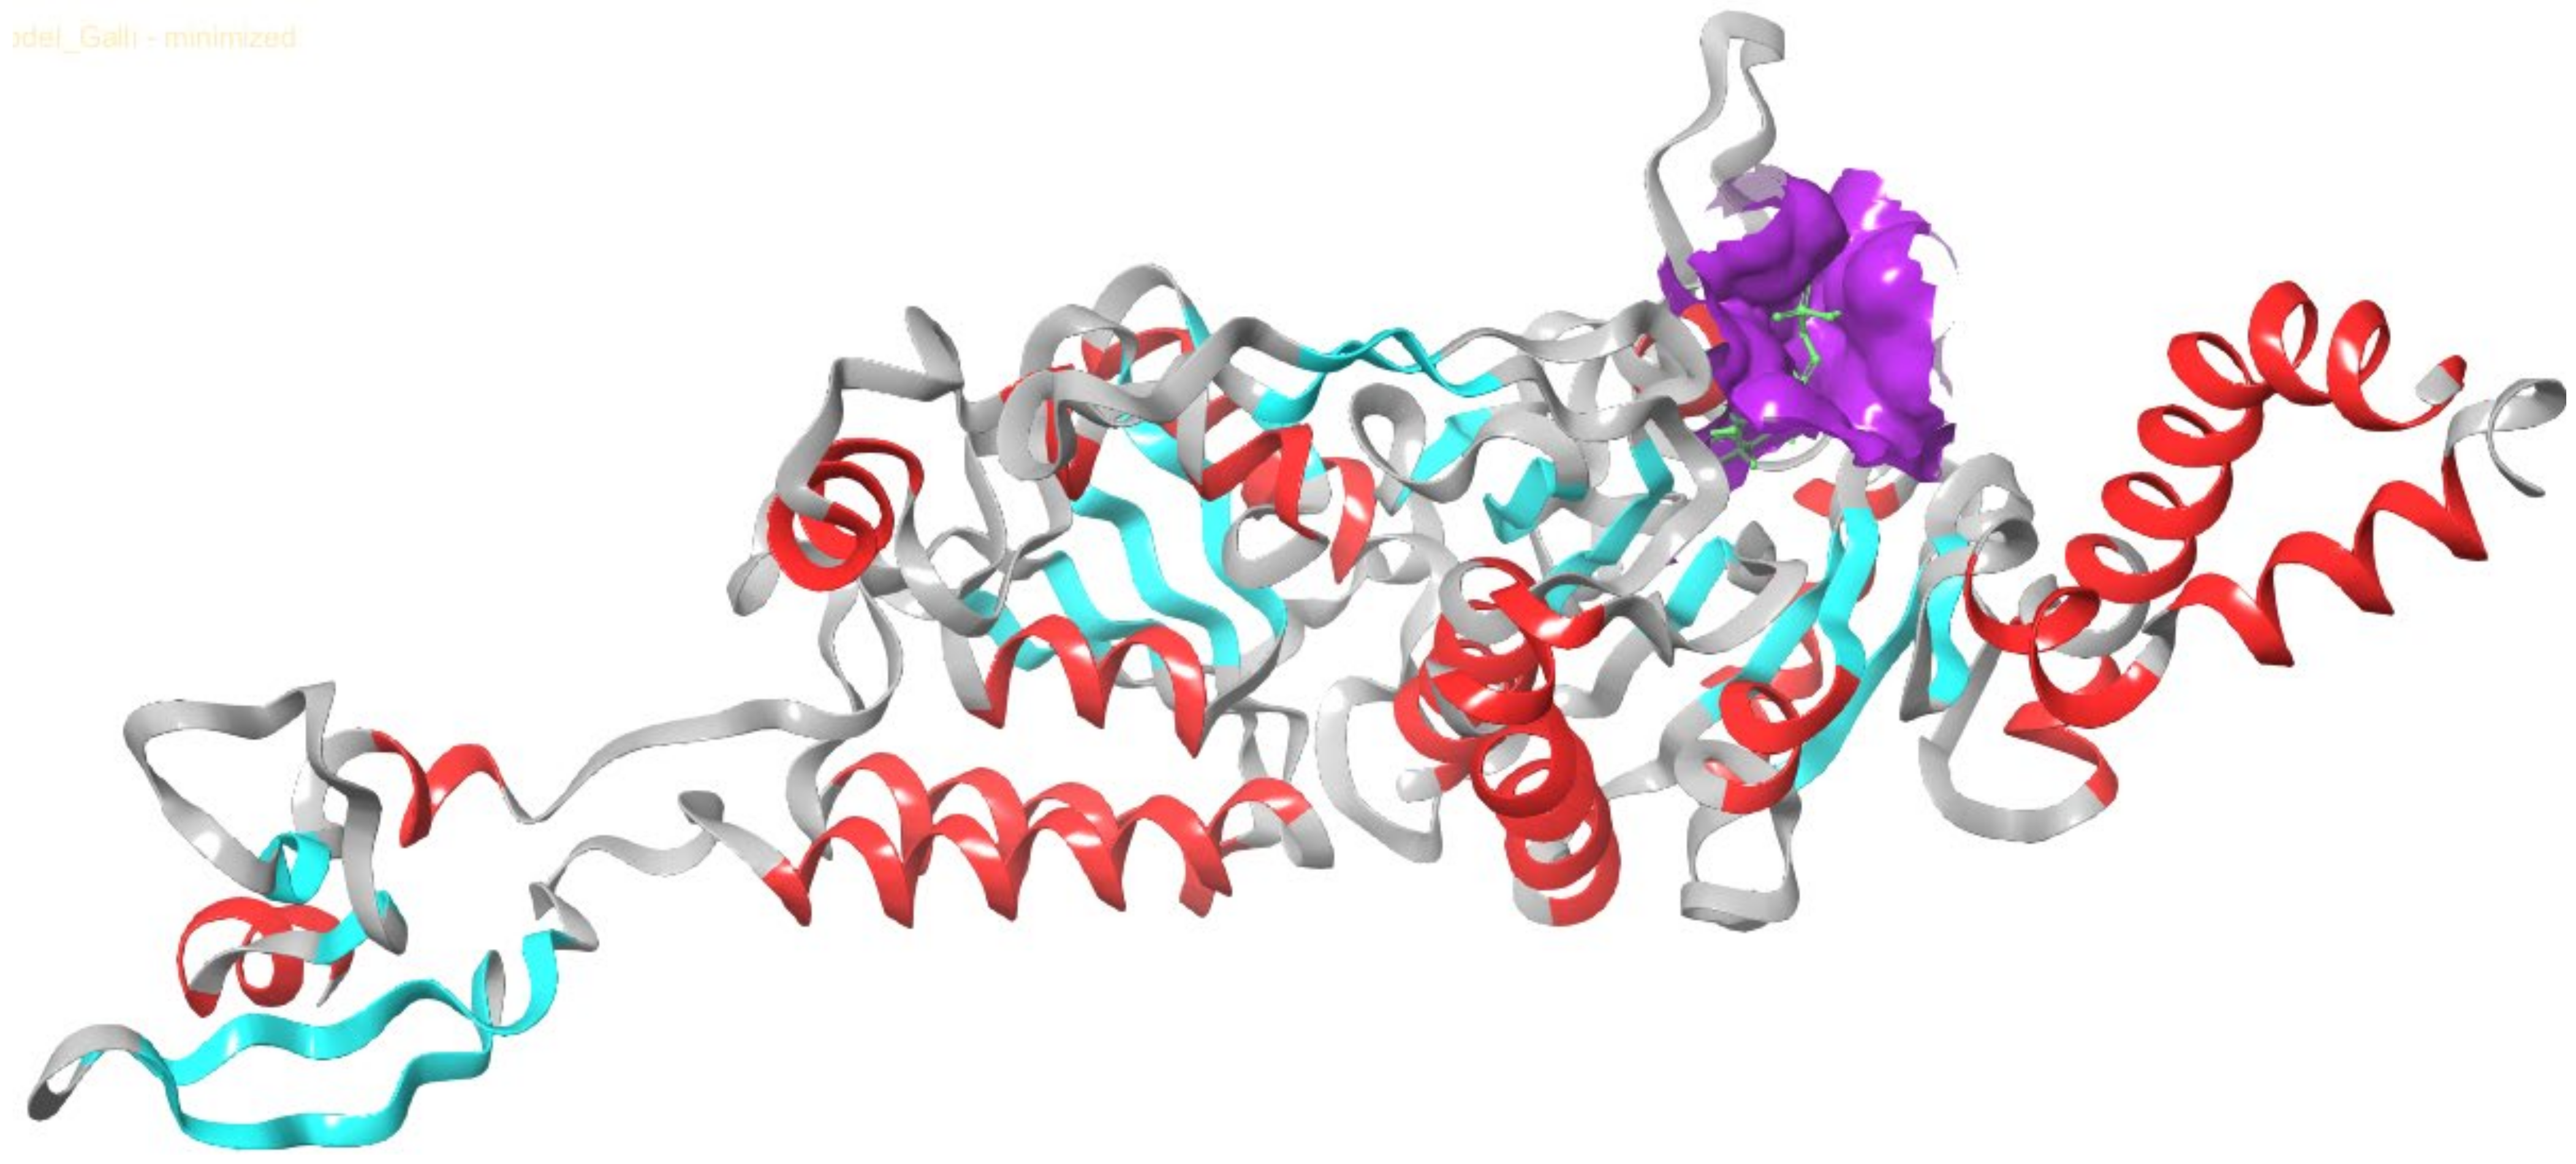
Figure 1. Three-dimensional view of modeled structure of ACCase.
Agronomy 12 01635 g001
Figure 2. Validation of the homology structure of E. crus-galli. (a) Ramachandran plot represents the presence of amino acids (black) in most favored (red) and allowed regions (yellow); (b) ERRRAT plot analysis using SAVES tool. The plot calculates the OQF ** (% of protein) and the error value * (confidence level of structure) of protein structure; and (c) Z−score calculation using ProSA tool (black dot implies the range of score falls in X-ray crystallography).
Agronomy 12 01635 g002aAgronomy 12 01635 g002b
Figure 3. Interaction pattern of (a) fenoxaprop-p-ethyl and (b) sinigrin within the active site of ACCase.
Agronomy 12 01635 g003
Figure 4. Docked pose of ACCase with (a) fenoxaprop-p-ethyl and (b) sinigrin.
Agronomy 12 01635 g004
Figure 5. Root mean square deviation (RMSD) plot of fenoxaprop-p-ethyl (black) and sinigrin (red) ACCase complex structures over 100 ns simulation.
Agronomy 12 01635 g005
Figure 6. Root mean square fluctuation (RMSF) plot of fenoxaprop-p-ethyl (black) and sinigrin (red) ACCase complex structures over 100 ns simulation.
Agronomy 12 01635 g006
Figure 7. Hydrogen bond interaction of fenoxaprop-p-ethyl (black) and sinigrin (red) with ACCase over 100 ns simulation.
Agronomy 12 01635 g007
Figure 8. Principle component analysis (PCA). (a) Covariance matrix of ACCase–fenoxaprop-p-ethyl and (b) ACCase–sinigrin complexes. (c) 2D projection motion of fenoxaprop-p-ethyl (black) and sinigrin (red) complex protein in phase space with the first two eigenvectors.
Agronomy 12 01635 g008
Figure 9. Free energy landscape of (a) ACCase–fenoxaprop-p-ethyl and (b) ACCase–sinigrin complexes.
Agronomy 12 01635 g009
Table 1. Tanimoto coefficient, docking score, and binding free energy contributions of hit compounds.
S. No.Compound IDNameTanimoto CoefficientXP GScore (kcal/mol)∆Gbind (kcal/mol)∆Gbind Coulomb (kcal/mol)∆Gbind Covalent (kcal/mol)∆Gbind H-bond (kcal/mol)∆Gbind Lipophilicity (kcal/mol)∆Gbind van der Waals (vdW) (kcal/mol)
191707Fenoxaprop-P-ethyl1−5.977−77.03−5.136.07−0.64−42.32−44.46
2CNP0166854Ligustaloside A0.29−10.974−83.78−37.711.96−4.36−35.05−50.49
3CNP0293269Glucoiberverin0.22−9.093−83.513.305.38−1.47−42.56−35.90
4CNP0288601Isoacteoside0.27−12.829−81.18−53.079.29−3.84−37.25−53.40
5CNP0233323Ophiohayatone B0.32−7.689−81.05−34.396.72−2.57−41.46−41.75
6CNP0232558Iridin0.33−10.393−79.61−31.4611.66−3.52−42.17−49.75
7CNP0259095Sinigrin0.22−9.068−79.216.983.65−1.56−39.38−34.54
8CNP0332060Glucolepidiin0.21−10.593−77.29−9.088.06−1.49−37.78−27.22
Table 2. Herbicide-likeness analysis of hit compounds.
S. No.Compound IDMW
(150–500) * Da
LogP
(≤3.5) *
HBD
(≤3) *
HBA
(2–12) *
RB
(<12) *
191707361.84.9067
2CNP0166854556.51−0.742713
3CNP0293269407.48−3.485129
4CNP0288601624.58−0.2391511
5CNP0233323564.49−0.938146
6CNP0232558522.450.076137
7CNP0259095358.36−4.524116
8CNP0332060347.36−3.675116
MW—molecular weight; LogP—partition coefficient; HBD—hydrogen bond donors; HBA—hydrogen bond acceptors; RB—rotatable bonds. * Values within parentheses are the standard threshold considered for the herbicide screening.
Table 3. The bond length of the amino acids involved in forming hydrogen bond interactions.
S. No.Binding ResiduesFenoxaprop-P-Ethyl (Å)Sinigrin (Å)
1THR 3181.932.37
2ASN 3732.032.00
3CYS262NI2.61
2.36
4VAL 316NI1.85
5GLU 259NI1.78
6THR 261NI2.54
NI—no interactions.
Table 4. Binding free energy analysis of the protein–ligand complexes calculated by MM/PBSA.
S. No.EnergySinigrin (kJ/mol)Fenoxaprop−P−Ethyl (kJ/mol)
1Van der Waal energy−105.790 ± 60.492−102.784 ± 57.997
2Electrostatic energy−4.901 ±5.543−5.353 ±8.379
3Polar solvation energy46.698 ± 47.82334.996 ± 28.300
4SAV energy−81.638 ± 64.592−56.249 ± 81.862
5Binding energy−145.631 ± 73.851−129.390 ± 111.326
Publisher’s Note: MDPI stays neutral with regard to jurisdictional claims in published maps and institutional affiliations.