Article

Effects of Daily Light Integral on Compact Tomato Plants Grown for Indoor Gardening

Environmental Horticulture Department, Institute of Food and Agriculture Sciences (IFAS), University of Florida, Gainesville, FL 32611, USA
*
Author to whom correspondence should be addressed.
Agronomy 2022, 12(7), 1704; https://doi.org/10.3390/agronomy12071704
Submission received: 26 May 2022 / Revised: 1 July 2022 / Accepted: 11 July 2022 / Published: 19 July 2022

Abstract

:
Our objective was to characterize the growth, physiological responses, fruit yield, and quality of tomato (Solanum lycopersicum L.) plants grown under different daily light integrals (DLIs) and photoperiods. In experiment I, nine compact tomato cultivars were grown indoors using broadband white light-emitting diode (LED) fixtures. Plants were grown under low (10.4 mol·m−2·d−1) and high (18.4 mol·m−2·d−1) DLIs with 12 and 16 h photoperiods, respectively, and two intermediate DLIs of 13.8 mol·m−2·d−1 with either 12 or 16 h photoperiods. In experiment II, three compact tomato cultivars were grown under the same low DLI with either 8 or 12 h photoperiods, and the same high DLI with either 12 or 16 h photoperiods. Generally, higher DLIs decreased plant growth and increased the fruit yield. Changing the DLI delivery strategy by adjusting the photoperiod and photosynthetic photon flux density (PPFD) did not have major effects on the growth, yield, and fruit quality of the compact tomato plants evaluated in this study, even though net photosynthesis increased under higher PPFDs in experiment II. Although several cultivars were affected by intumescence, only two cultivars showed treatment responses, for which the severity was generally higher in lower PPFDs using the same DLI.

1. Introduction

According to the United Nations [1], 68% of the global population is expected to live in urban areas by 2050. With increasing urbanization, gardening activities are continuously moving indoors due to the typical lack of private backyard or patio spaces [2]. Consumers who engage in indoor gardening often grow edible plants suitable for small spaces [3,4]. Some use “smart” gardening systems that often integrate countertop hydroponic kits with sole-source lighting provided by light-emitting diode (LED) fixtures. Others chose to grow plants in containers near windowsills or use an electric lamp, hoping to provide sufficient light to sustain a harvest [5].
In 2020, the global market for smart gardening systems was valued at $11 million and is projected to reach $18 million by 2027 [6]. Further, sales of vegetable transplants for home gardening increased from $107 million in 2019 to $146 million in 2020 [7]. Although herbs and leafy greens are the most popular indoor gardening crops due to their ease of cultivation and various culinary uses, there is growing interest in expanding indoor gardening activities to include fruiting vegetable crops [8].
Tomato (Solanum lycopersicum L.) is the second most-consumed vegetable in the United States (U.S.) and the most popular gardening vegetable, cultivated in 86% of residential food gardens [9,10]. Numerous new compact cultivars are available from seed distributors that cater to home gardeners [11,12,13].
The increasing interest in urban agriculture has urged breeders to select for compact tomato plants adapted to high-density cultivation and rapid crop cycling [14]. However, there is limited information about the inputs needed to grow these plants, especially in indoor spaces where environmental setpoints target human comfort and, thus, may not be optimal for maximizing productivity. Further, home gardening has received limited research attention despite being one of the largest retail sectors in the horticulture industry, with approximate sales in 2018 of $44 billion in lawn and garden equipment [15].
Light is typically the most limiting environmental factor for indoor gardening [4]. Therefore, providing additional light is often necessary to ensure adequate yields for indoor gardening. Solis-Toapanta et al. [16] showed that challenges with plant lighting account for almost 20% of the questions asked in popular indoor gardening online communities. In most residential spaces, the photosynthetic photon flux density (PPFD) indoors is 50% to 99% lower than that measured outdoors [17]. Light is particularly important for crops like tomatoes, which have daily light integral (DLI) requirements of 25 to 30 mol·m−2·d−1 for optimal commercial production [18,19]. Providing DLIs in that range is likely unfeasible for most indoor gardeners, particularly considering the low output of most off-the-shelf LED fixtures. Further, compact tomato plants likely have a lower DLI requirement than the range used for commercial cultivation [20]; however, the optimal values to grow healthy, high-yielding plants are unknown.
One strategy to increase DLI without increasing the PPFD is to extend the photoperiod. Recent studies have shown that lettuce (Lactuca sativa L.) plants grown under the same DLI with a longer photoperiod use light more efficiently to drive photosynthesis and growth [21,22,23]. However, extended photoperiods or continuous lighting can negatively affect tomato plants by inducing leaf chlorosis through mechanisms that affect their circadian rhythm [24,25]. Further, others have shown that carbon dioxide (CO2) fixation rates decrease in tomato plants grown under long photoperiods due to the accumulation of starch and soluble sugars [26]. In contrast, increasing the PPFD with the same DLI has been shown to decrease the water use efficiency (WUE), net photosynthesis (A), and transpiration (E) in tomato plants [27].
Considering that aesthetic appeal is likely important for home gardeners, identifying methods to maintain adequate yields while minimizing physiological damage is critical. Some tomato cultivars are susceptible to intumescence, which is a physiological disorder characterized as hypertrophic lesions on the leaves and stems of plants [28,29,30]. Issues with intumescence are expected to affect susceptible cultivars grown under LED fixtures lacking ultraviolet (UV) (100 to 400 nm) radiation, which are standard for non-horticultural or research applications [29,31,32].
The objective of this study was to characterize the growth, physiological responses, fruit yield, and quality of compact tomato plants grown under different DLIs and photoperiods. Our goal was to compare lighting strategies with DLIs below the recommended ranges for commercial production using three DLIs in one experiment (experiment I) and two DLIs in another (experiment II). We hypothesized that higher DLIs would increase fruit yield and quality due to an increase in the energy available for photosynthesis. However, higher DLIs would affect plant growth and height, reducing leaf area for radiation capture and ultimately affecting overall plant size [33]. We also hypothesized that, under the same DLI, the fruit yield of tomatoes would be positively affected by longer photoperiods due to an increase in the daily photochemical light-use efficiency under lower PPFDs [22].

2. Materials and Methods

In experiment I, seeds of the compact tomato cultivars Pillar Tomatoes™ F1—Catch Red (CR) (Prudac, Enkhuizen, The Netherlands), Sweet Sturdy™ F1—Jimmy (SSJ) (Prudac), Little Bing (LB) (PanAmerican Seed, Chicago, IL, USA), Siam (S) (PanAmerican Seed), Red Robin (RR) (Sakata, Morgan Hill, CA, USA), Rosy Finch (RF) (Sakata), Yellow Canary (YC) (Sakata), Sweet ‘n’ Neat Scarlet (SNS) (Syngenta, Basel, Switzerland), and Sweet ‘n’ Neat Yellow (SNY) (Syngenta) were sown into 50-cell trays (55 mL individual cell volume) filled with horticultural grade substrate composed of (v/v) 79% to 87% peat moss, 10% to 14% perlite, and 3% to 7% vermiculite (Pro-Mix BX general purpose; Premier Tech Horticulture, Quakertown, PA, USA) on 20 May 2020.
Seedlings were propagated inside an air-conditioned growth room under broadband white LED fixtures (GreenPower; Phillips Lighting, Somerset, NJ, USA) that provided a PPFD of 137 ± 48 µmol·m−2·d−1 for 16 h·d−1 (0800 to 2400 HR), resulting in a DLI of 7.9 mol·m−2·s−1. In experiment II, seeds of CR, LB, and YC were sown on 23 March 2021 and propagated using the same conditions described above, except that a different type of broadband white LED fixture (RAY66 PhysioSpec IndoorTM; Fluence Bioengineering, Austin, TX, USA) was used.
Target PPFD setpoints were measured using a spectroradiometer (SS-110; Apogee Instruments, Inc., Logan, UT, USA). In both experiments, seedlings were fertigated as needed using water-soluble fertilizer (Peter’s Professional 15N–5P–15K; ICL Specialty Fertilizer, Summerville, SC, USA) providing (in mg·L−1) 100 nitrogen (N), 15 phosphorus (P), 83 potassium (K), 33 calcium (Ca), 13 magnesium (Mg), 1.0 iron (Fe), 0.3 manganese (Mn), 0.3 zinc (Zn), 0.1 copper (Cu), 0.1 boron (B), and 0.1 molybdenum (Mo).
In both experiments, 32 uniform seedlings from each cultivar were individually transplanted 4 weeks after sowing into 8-inch diameter (20.3 cm) ‘azalea’ plastic containers (BWI, Nash, TX, USA) using the same substrate described above. Before transplanting, 17 g of controlled-release fertilizer (12N–2P–9K PLUS CaNO3 100 d; Florikan, Sarasota, FL, USA) was pre-plant incorporated into the substrate of each container. In experiment I, half of the plants from each treatment replication and cultivar were selected for WUE quantification at the plant level (WUEplant), which was measured using the shoot and fruit dry mass produced per volume of water consumed by each plant. For this purpose, all containers were weighed before transplanting to ensure uniform substrate volume. After transplanting, the surface of all containers was covered with an opaque plastic film secured with a rubber band to minimize evaporation from the substrate surface. A small cross was cut in the middle of the plastic film to fit a single plant. Water use was not measured in experiment II, and thus, the containers were not covered with plastic film. However, a 2.5 cm layer of parboiled rice hulls (Sungro, Agawam, MA, USA) was applied on the substrate surface of each container to minimize complications with fungus gnats (Bradysia sp.) [34].
Immediately after transplanting, plants in both experiments were moved inside two 12 m2 air-conditioned growth rooms. Each growth room had four shelving units with an upper and lower treatment compartment (1.8 m length, 0.9 m width, and 0.9 m height). Both experiments were arranged as a randomized complete block design with four blocks (two in each growth room). Two adjacent shelving units on each side of each growth room were regarded as a block, each with four randomly arranged treatment compartments. Each treatment compartment held two replicate plants of each cultivar, and each plant was considered as an experimental unit. In total, there were eight experimental units for each cultivar in each experiment.
In both experiments, each treatment compartment had three broadband white LED fixtures (RAY66 PhysioSpec IndoorTM; Fluence Bioengineering) set at different PPFDs and photoperiods as described below. All fixtures provided 19% blue, 40% green, 39% red, and 2 far-red light. Nine-point light maps were generated for each treatment compartment using a spectroradiometer (SS-110; Apogee Instruments Inc., Logan, UT, USA) placed at mid-canopy height (approx. 45 cm from the lower surface of the compartment). The light output was controlled with dimmers to achieve target PPFDs (C-W-U; Fluence Bioengineering). The side where the adjacent shelving units adjoined was covered with a 0.3 mm thick black polyethylene film to minimize light pollution (≤1 μmol·m−2·s−1) within the treatment compartments. A black fabric curtain (2.1 m length × 3.6 m width) was hung from the middle of each growth room to further minimize light pollution.
Four treatments were evaluated in experiment I, including a low DLI of 10.4 mol·m−2·d−1 (240 µmol·m−2·d−1 for 12 h·d−1 (L-12)), two intermediate DLIs of 13.8 mol·m−2·d−1 (320 µmol·m−2·s−1 for 12 h·d−1 (I-12) and 240 µmol·m−2·s−1 for 16 h·d−1 (I-16)), and a high DLI of 18.4 mol·m−2·d−1 (320 µmol·m−2·s−1 for 16 h·d−1 (H-16)). Four treatments were evaluated in experiment II, including two low DLIs of 10.4 mol·m−2·d−1 (360 µmol·m−2·d−1 for 8 h·d−1 (L-8) and 240 µmol·m−2·d−1 for 12 h·d−1 (L-12)) and two high DLIs of 18.4 mol·m−2·d−1 (425 µmol·m−2·d−1 for 12 h·d−1 (H-12) and 320 µmol·m−2·d−1 for 16 h·d−1 (H-16)). A summary of all treatments with their respective PPFDs and photoperiods is shown in Table 1. The containers within each treatment compartment were randomly rotated every other day to minimize the location effects in the experimental area.
Plants in experiment I were grown for 11 weeks except for YC, which was harvested 9 weeks after transplanting due to complications with intumescence. Plants in experiment II were grown for 14 weeks. In both experiments, growth rooms were set at a constant ambient temperature of 22 °C and ~65% relative humidity (RH). The environmental conditions were monitored in each growth room using data loggers (RC-4HC (Elitech, Milpitas, CA, USA) in experiment I and HOBO MX1102A (Onset, Bourne, MA, USA) in experiment II). The daily average ambient air temperature and RH during experiment I were (mean ± standard deviation) 21 ± 2 °C and 74 ± 14%, respectively. The daily average air temperature, RH, and CO2 during experiment II were 22% ± 1 °C, 58 ± 14%, and 543 ± 195 µmol·mol−1, respectively. In both experiments, the near-canopy air temperature was monitored with k-type thermocouples (OS36-01-T-80F; Apogee Instruments Inc.) placed at the center of each treatment compartment and interfaced to a data logger (CR1000; Campbell Scientific, Logan, UT, USA). Data were measured every 5 s, and the average was logged every 60 min. The daily average near-canopy air temperatures from all treatments are shown in Table 1.
Throughout experiment I, plants were sub-irrigated two to three times per week using one black plastic reservoir (1508 mL volume) per plant. For one hour, the plants were allowed to sit in the reservoir with 750 mL of tap water (initially) or fertilizer solution (after week 7) at a concentration of 200 mg·L−1 N provided by the same water-soluble fertilizer described above (Peter’s Professional 15N–5P–15K; ICL Specialty Fertilizer). After each irrigation event, plants were placed on top of their corresponding reservoir, which was covered with an opaque plastic lid with a center opening for excess leachate to return to the reservoir. For WUEplant quantification, reservoirs were weighed immediately after each irrigation event using a digital balance.
Reservoirs were then refilled with tap water or fertilizer solution to the pre-set volume of 750 mL. Tap water had 0.4 dS·m−1 electrical conductivity (EC), 8.3 pH, and 31.2 mg·L−1 calcium carbonate alkalinity, and contained (in mg·L−1) 0.3 nitrogen N (combining 0.2 ammonium (NH4-N) and 0.1 nitrate (NO3-N)), 0.1 P, 1.7 K, 36.8 Ca, 23.4 Mg, 41.6 S, 0.02 Fe, 0.0 Mn, 0.0 Zn, 0.0 Cu, 0.03 B, 0.0 Mo, 11.5 Na, and 27.3 Cl. Plants in experiment II were initially drip-irrigated with tap water as needed. At week 7, plants were irrigated with the same fertilizer solution described above.
Leaf tissue and leachate samples from three and one replicate cultivars per treatment in experiments I and II, respectively, were collected 9 weeks after transplanting and sent to a third-party laboratory (Quality analytical Laboratories, Panama City, FL, USA). Nutrient analyses were conducted to assess if the different growth rates in response to the DLI treatments affected the nutritional status of the plants. No nutritional differences were observed among treatments (data not shown). Once flowering started, plants were hand-pollinated every other day between 1100 and 1400 HR.
In experiment I, WUEplant was only measured from one plant per cultivar within each treatment compartment, with a total of four replicate plants measured per cultivar. Reservoirs were weighed after each irrigation event to quantify the water used per plant. In experiment II, leaf-level A and WUEleaf, which refers to an instantaneous measure of the amount of CO2 assimilated per unit of water used by a leaf, were measured 10 weeks after transplanting using a portable gas-exchange meter (CIRAS-3; PP Systems, Amesbury, MA, USA). Data were collected between 0900 and 1400 HR, and measurements were made on a single fully expanded leaf per plant. The reference CO2 concentration, leaf temperature, RH, and flow rate inside the chamber were 410 μmol·mol−1, 22 °C, 65%, and 400 mL·min−1, respectively. Measurements were conducted under ambient PPFD (without the use of an external light source), ensuring leaf exposure to the target intensity from each treatment.
The number of days until first harvest after transplanting were recorded for all plants in experiment II to assess differences in harvest time among DLI treatments. This variable was not measured in experiment I. A visual assessment for the severity of intumescence was conducted at 9 and 4 weeks after transplanting in experiments I and II, respectively, using a 1 to 6 subjective scale based on Eguchi et al. [35] with modifications, where 1 = no intumescence injury; 2 = 1% to 10% of the plant affected and minimal isolated intumescence on terminal leaves; 3 = 11% to 50% of the plant affected and dense intumescence on the terminal leaflets with pronounced topical necrotic spotting; 4 = 51% to 75% of the plant affected, pronounced upward leaf curling, and prolific top leaf surface necrosis; 5 = 76% to 100% of the plant affected and full senescence of leaflets; and 6 = complete abscission/senescence.
Intumescence was measured earlier in experiment II as the disorder seemed to peak at week 4 after transplanting in experiment I and became harder to visually assess after that point. For that reason, intumescence incidence was only recorded in experiment II by counting the number of leaves with signs of intumescence and dividing that by the total number of leaves per plant.
Harvests occurred weekly after 17 August 2020 in experiment I and 21 June 2021 in experiment II, corresponding to week 9 after transplanting for both experiments. The number and fresh mass of immature fruits > 1 cm were also recorded from all plants during the final harvest and used to measure the total fruit number and total fruit fresh mass. Fruits from plants used for WUEplant quantification in experiment I were weighed and dried at 70 °C in an air-forced oven for 5 d after each harvest to calculate fruit dry mass for WUEplant quantification.
Eight mature fruits from half of the plants in experiment I (those not used for WUEplant quantification) and from all plants in experiment II were measured for colorimetric attributes using a colorimeter (AMT599; Amtast, Lakeland, FL, USA), where L* = light/dark; a* = red/green; b* = yellow/blue; and a*/b* = brightness of red color. Fruits from each plant were then homogenized in a blender (HBB908; Hamilton Beach, Glen Allen, VA, USA), and 50 mL samples of tomato fruit puree were stored in a −20 °C freezer for future analyses. Frozen samples were thawed at room temperature, homogenized with a vortex mixer for 10 s, and strained with a paper coffee filter before analyses. For each sample, Brix was measured using a digital refractometer (HDR-P; Thermo-Fisher Scientific, Waltham, MA, USA). Filtered fruit juice samples were used to measure fruit pH and EC using a pH/EC meter (Orion Versa Star; Thermo-Fisher Scientific). Titratable acidity was measured and calculated using methods described by Dzakovich et al. [36] and expressed as citric acid percentage. The sugar:acid ratio of the fruits was calculated by dividing values for Brix by citric acid [37].
Before terminating each experiment (11 September 2020 and 28 July 2021 for experiments I and II, respectively), plant height was measured from the substrate surface to the tallest growing point. The widest diameter and width 90° from the widest diameter were also recorded. Growth index was calculated using the formula π × h × r2, where h is plant height, and r was calculated by multiplying half times the mean of two leaf widths. SPAD index was measured on three fully expanded leaves per plant using a chlorophyll meter (SPAD-503; Konica Minolta Sensing Inc., Ramsey, NJ, USA). SPAD index was measured only in plants used for WUEplant quantification in experiment I, and in all plants in experiment II.
At the end of each experiment, shoots were severed at the substrate surface, and shoot fresh mass was recorded for the plants used for WUEplant quantification in experiment I and for all plants in experiment II. In both experiments, shoots were oven-dried for 5 d at 70 °C for determination of shoot dry mass. In experiment I, the WUEplant was calculated by the sum of the fruit plus shoot dry mass divided by the total water used by each plant. In both experiments, canopy density was calculated by dividing values for shoot dry mass by plant height. As YC plants were harvested earlier than all other plants in experiment I, only the following data were collected for this cultivar following procedures described above: growth index, intumescence severity, total fruit number, total fruit fresh mass, shoot fresh mass, shoot dry mass, and WUEplant.
The influence of the two categorical independent variables (i.e., cultivar and treatment) and their possible interactions on each dependent variable were analyzed using a two-way analysis of variance. Data are presented by cultivar to illustrate unique cultivar trends because most dependent variables showed a cultivar × treatment interaction (p ≤ 0.05). In experiment I, data for WUEplant, SPAD, shoot fresh mass, shoot dry mass, fruit pH, EC, Brix, citric acid, sugar:acid ratio, and chromaticity were collected on four replicate plants per cultivar (n = 4). Every other variable in experiment I and all variables in experiment II were collected from all plants (n = 8). In both experiments, data for chromatic attributes were pooled among eight fruits harvested per plant per treatment replication. All analyses were conducted using the R [38] statistical analysis software (version 3.5.1; R Foundation for Statistical Computing, Vienna, Austria). Pairwise comparisons for the main effect treatment means were completed using Tukey’s Honestly Significant Difference test (p = 0.5) performed using the R packages ‘dplyr’ [39] and ‘agricolae’ [40].

3. Results and Discussion
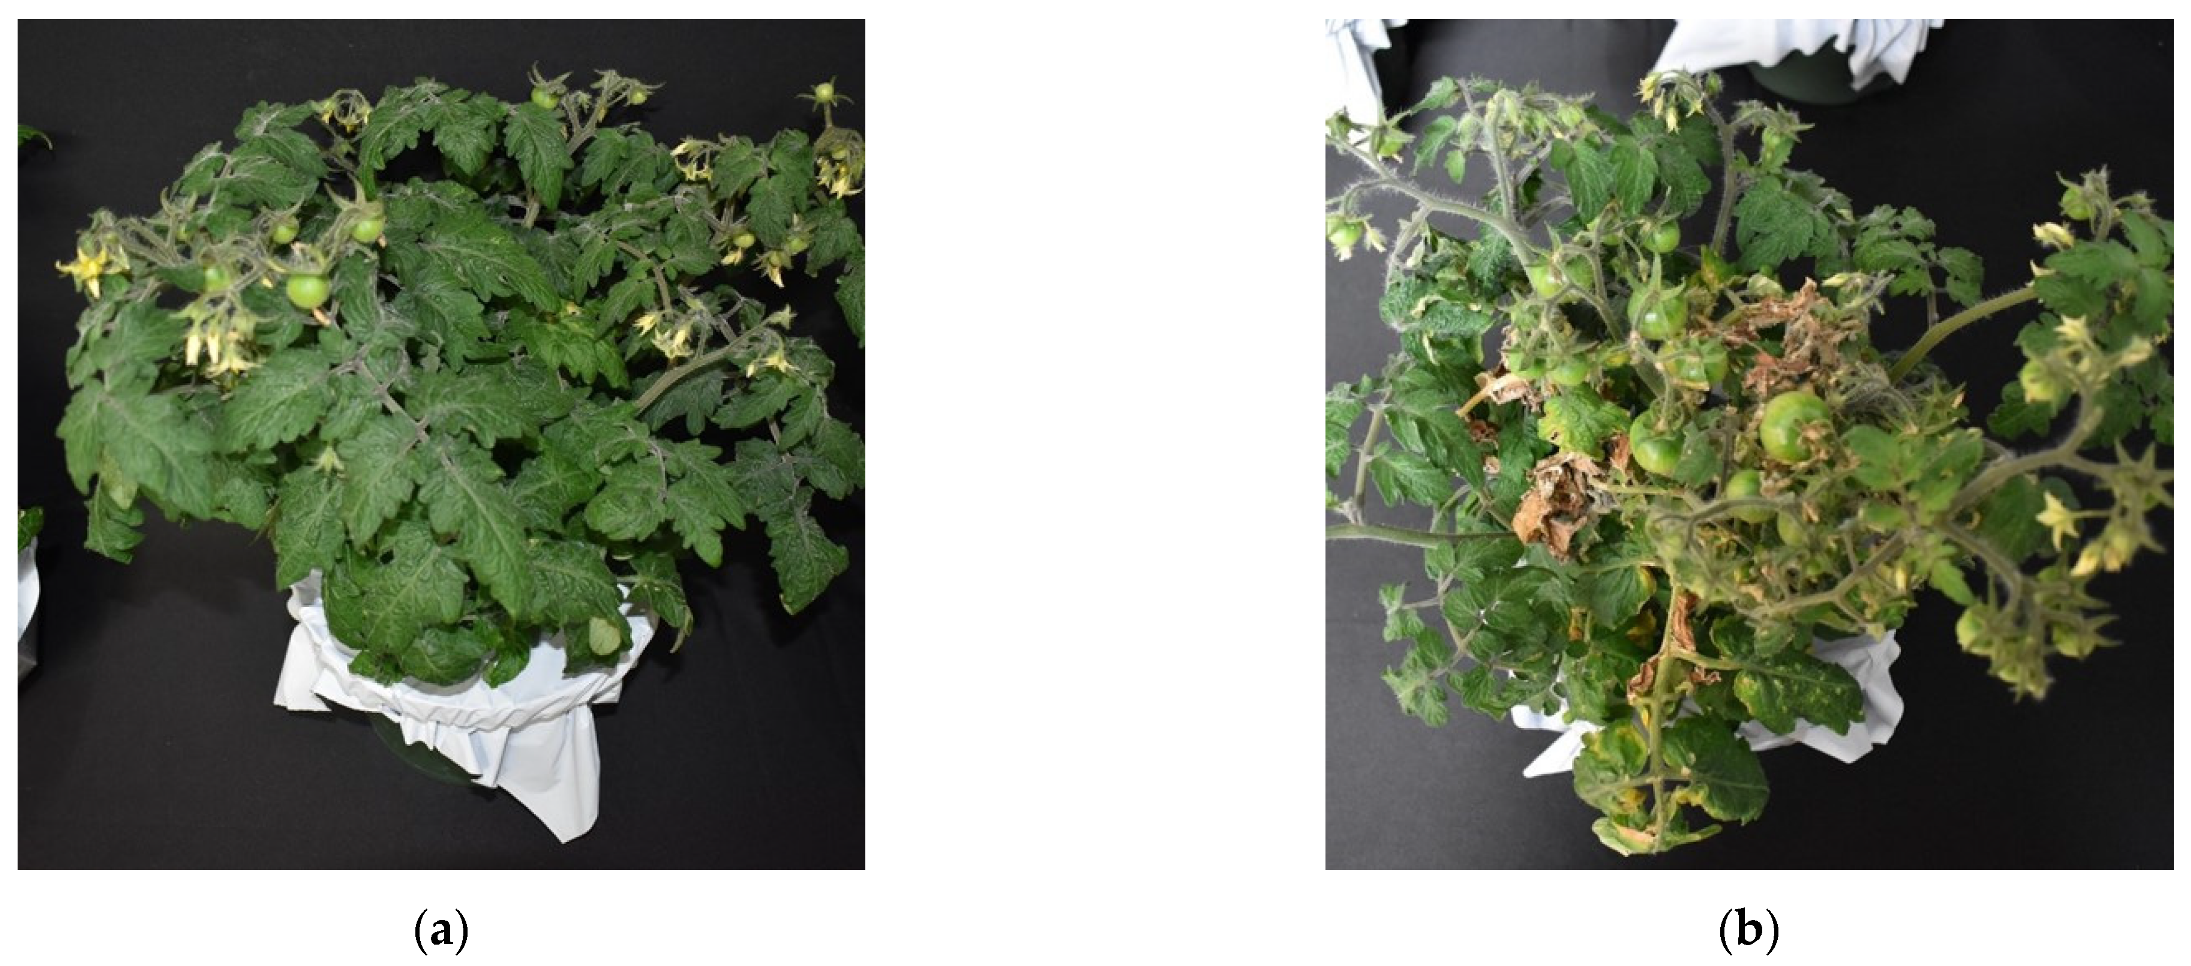
3.1. Growth

Plants of most cultivars were smaller under high compared to low DLIs (Table 2 and Table 3). In experiment I, growth index was 33% to 56% lower in RF, RR, SNY, SSJ, and YC grown under H-16 compared to L-12. Similarly, growth index of those same cultivars was 22% to 45% lower under I-16 compared to L-12. However, growth index of most cultivars was similar under I-12, I-16, and H-16 in experiment I. Only SSJ showed differences in growth index when plants were grown under the same intermediate DLI and different photoperiods, where plants under I-16 had a 38% lower growth index than those under I-12. In experiment II, growth index of CR was unaffected by DLI but that of YC was lower by 31% and 38% under H-12 and H-16, respectively, compared to L-8. In addition, growth index of LB grown under high DLI was close to half of that under low DLI, regardless of the photoperiod.
These findings suggest that higher DLIs can limit the size of compact tomato cultivars, which could be a desirable attribute for urban gardening settings with limited space [4]. Compact growth could also be advantageous for commercial production in indoor farms, helping to maximize space-use efficiency [14,41]. However, providing higher DLIs to achieve compact growth might not be a suitable approach for most growers unless significant increases in yield can be achieved, considering the high energy costs of providing sole-source lighting. Selecting cultivars that are compact and high yielding is a more suitable strategy for the commercial industry compared to producing plants under higher DLIs [11,14]. Using LED fixtures with high red:far-red ratios could also help maintain plants compact [42].
Among the cultivars evaluated, plants of CR consistently had the smaller growth index values (Table 2 and Table 3). This could be attributed to the fact that CR was bred for indoor countertop use [43]. In contrast, most other cultivars used in our study were bred for outdoor gardening in containers (J. Bogard and C. Filios, pers. comm., 2020). Moreover, because growth index of CR, LB, S, and SNS was unaffected by DLI, it is likely that the DLIs in the range used in our study were adequate for maximizing height and width of these cultivars.
Growth index was expected to increase under the same intermediate DLI with a lower PPFD and longer photoperiod, as the strategy has been shown to increase plant height and overall canopy size in tomato seedlings [44]. However, growth index was generally similar when plants were grown under the same DLI with different photoperiods, and the trend was consistent in both experiments and across cultivars except for SSJ in experiment I (Table 2 and Table 3). Results for SSJ corresponds with the findings of Demers et al. [45], who reported a decrease in height, internode length, and leaf area for greenhouse tomatoes grown under a long photoperiod (24 h·d−1), which increased the DLI compared to a short photoperiod (14 h·d−1). It is plausible that photoperiods longer than those used in our study increase carbohydrate accumulation and act as a photosynthetic feedback inhibitor, thereby, reducing the growth of tomato plants [26].
Similar to the response in growth index, shoot height in both experiments decreased with increasing DLIs and was similar in plants grown under the same DLI with different photoperiods (Table 2 and Table 3). These findings are not surprising, considering that growth index integrates plant height and width. In experiment I, height of RF, RR, SSJ, and YC decreased by up to 31% when plants were grown under L-12 compared to H-16. However, no treatment differences were measured in the height of CR, LB, S, and SNS. Height of SNY was similar under L-12 and H-16 (40 and 34 cm, respectively) in experiment I; however, plants under I-16 (33 cm) were shorter than those under L-12. In experiment II, LB plants were taller under L-12 (56 cm) compared to H-12 (42 cm) (Table 3), but height of CR and YC was not affected by DLI. The lack of differences in height of YC plants grown in the second experiment suggests that width was largely responsible for the decrease in growth index under high DLI.
Hwang et al. [44] and Fan et al. [46] showed that height of tomato seedlings decreased as the PPFD increased from 200 to 300 µmol·m−2·s−1. Hwang et al. [44] attributed their findings to a decrease in gibberellic acid content under higher PPFDs, which helps to regulate plant height. It is widely accepted that stem elongation is a common shade-avoidance response under low PPFDs or low red:far-red ratios, as taller plants are able to capture more light for photosynthesis and growth [42,47]. In addition, leaves tend to grow larger under low PPFDs or low red:far-red ratios to maximize radiation capture [46].
Although leaf area was not measured in our study, plants grown under low DLI produced visibly larger leaves than those under high DLI, regardless of the PPFD and photoperiod combinations in the two experiments. Plants grown under the low DLI treatments in the two experiments did not appear to be light-limited even though their larger size seems to be a response to the lower amount of light that plants received compared to those in higher DLIs. Kalaitzoglou et al. [42] found that red:far-red ratios higher than sunlight decreased plant height in tomato plants. Considering that most LED fixtures used for sole-source lighting applications emit a fixed spectra that tends to have a higher red:far-red ratio than sunlight [48], growing plants under broadband white LEDs with a high red:far-red ratio may be useful to help indoor gardeners produce shorter tomato plants.
In experiment I, means for shoot fresh and dry mass were generally similar across treatments in the different cultivars except for CR, RF, and YC (Table 2). Shoot fresh mass of CR was higher under H-16 (156 g) than under L-12 (100 g). Similarly, shoot dry mass of CR was higher under H-16 (17 g) than L-12 (9 g) and I-12 (12 g). In contrast, shoot fresh mass of RF in experiment I was lower in H-16 (240 g) than in L-12 (309 g). In experiment II, shoot dry mass of YC was highest under H-16 (76 g) and lowest under L-8 (48 g). Similarly, shoot fresh and dry mass of CR were highest under H-16 (219 and 31 g, respectively) (Table 3).
In both experiments, shoot fresh and dry mass were generally similar when plants were grown under the same DLI with different photoperiods, except for CR in experiment II, for which shoot biomass increased under a high DLI with a longer photoperiod. Results for CR correspond with the findings of Weaver and van Iersel [21] and Kelly et al. [23], who showed that lower PPFDs and longer photoperiods increased lettuce biomass production due to an increase in light-use efficiency for photosynthesis. However, our general findings suggest that, although DLI had some effect on growth index and height of various cultivars, shoot biomass production of compact tomato plants was only minimally affected by DLI using the PPFDs and photoperiods evaluated in our study.
Canopy density was used as a qualitative indicator, where larger numbers represent a denser canopy with more foliage per unit area [49]. In experiment I, canopy density of CR and YC increased by 80% and 40%, respectively, from L-12 to H-16 (Table 2). However, no differences were measured in canopy density under the same intermediate DLI used in experiment I, regardless of cultivar. In experiment II, canopy density of CR and YC increased by 21% and 22%, respectively, from L-8 to H-16 (Table 3). Similarly, canopy density of LB increased by 18% from L-8 to H-12. These results correspond with those of Faust et al. [50], who reported that increasing DLI increased canopy density in four bedding plant species. Their findings were attributed to a greater accumulation of carbohydrates in the leaves of plants grown under higher DLIs, ultimately increasing shoot dry mass and canopy density. For indoor gardening applications, plants with a higher canopy density produced under higher DLIs could be considered fuller, more attractive plants.

3.2. Fruit Yield

In general, the total number of fruits produced by plants grown under the same DLI with different photoperiods was similar in both experiments; however, plants under higher DLIs tended to produce more fruits than those under lower DLIs (Table 4 and Table 5). In experiment I, the total number of fruits was 28% to 129% higher in CR, RF, RR, S, SNS, SSJ, and YC plants grown under H-16 compared to L-12. In experiment II, the total number of fruits produced by CR and YC increased by 41% and 32%, respectively, in plants grown under L-8 compared to H-16. Furthermore, the total number of fruits produced by CR were also higher under H-12 (46) compared to L-8 (34). Similarly, the total number of fruits produced by YC plants grown under H-16 (82) were higher than those under L-12 (59).
Across cultivars, plants grown in experiment I produced a total fruit fresh mass (i.e., yield) that was 17% to 139% higher under H-16 compared to L-12; however, plants grown under the same DLI with different photoperiods produced the same yield (Table 4). Fruit yield was expected to increase with increasing DLI, as it is widely accepted that the supply of photoassimilates that influence yield increases almost linearly with DLI [51,52]. However, yield of S and SNY plants in experiment I were similar under the two intermediate DLIs compared to H-16 (Table 4). Yield of LB was also similar between plants grown under I-12 (418 g) and H-16 (470 g) in experiment I and across all treatments in experiment II (Table 5). These findings suggest that fruit yield of S, SNY, and LB could have been maximized under the DLI ranges used in our study. However, further studies should evaluate higher DLIs that may maximize the productivity of other compact tomato cultivars.
Interestingly, fruits matured almost 1 week earlier in plants grown under a low DLI compared to those under a high DLI in experiment II. This was unexpected considering that fruit development is thought to primarily depend on temperature [53], and our measurement of near-canopy air temperature showed that plants under higher DLIs were grown under a slightly warmer temperature in both experiments (Table 1). The differences in time to harvest could be attributed to the lower number of fruits generally produced in plants grown under low compared to high DLIs, which could have reduced competition for photoassimilates [54]. It appears that, although plants grown under low DLIs are expected to produce less fruit than those under high DLIs, they could be harvested earlier. This may lead to more positive gardening experiences, as the time to harvest is an important attribute for most home gardeners [55].

3.3. Fruit Quality

Results from both experiments and across cultivars showed only minor differences in fruit quality in response to DLI (Table 6 and Table 7). Across cultivars and in both experiments, there were no differences in fruit pH, EC, Brix, citric acid, and sugar:acid ratio between treatments with the same DLI and different photoperiods. In experiment I, there were no treatment differences in fruit pH and EC regardless of cultivar. Brix of CR fruits increased from 4.2° under L-12 to 5.1° under I-12. Similarly, Brix of LB fruits increased from 4.3° under L-12 to 5.7° under H-16. In experiment II, pH of CR fruits increased from 5.2 under L-8 to 7.2 under H-16, and EC decreased from 8.2 dS·m−1 under L-12 to 7.3 dS·m−1 under H-16.
Brix of fruits produced by CR, LB, and YC plants grown in experiment II increased from 5.2, 5.3, and 4.1 under L-8 to 6.5, 6.2, and 5.0 under H-12, respectively. Citric acid was unaffected by DLI in both experiments (Table 6 and Table 7). As the sugar:acid ratio was calculated using the Brix and citric acid, there was a general lack of treatment differences in experiment I. However, the sugar:acid ratio increased in CR fruits in experiment II from 8.0 under L-8 to 10.6 under H-16. Similarly, the sugar:acid ratio increased in YC fruits from 12.3 under L-8 to 15.5 under H-12, and from 10.6 under L-12 to 13.8 under H-16.
Except for RR (experiment I) and CR (both experiments), there were no treatment differences in fruit chromatic attributes (Table 6 and Table 7). Further, fruits of plants grown under the same DLI with different photoperiods generally had similar chromatic attributes across cultivars. Fruit chromaticity is mainly used to assess the ripening stage in tomatoes prior to harvesting and can be correlated with health-related compounds such as lycopene content [56]. Cultivar differences in chromatic attributes were expected as they are often correlated with fruit color, which, in our study, included yellow (SNY and YC), red (CR, LB, RR, S, SNS, and SSJ), and pink (RF) tomato fruits.
The general lack of treatment differences in fruit quality suggests that indoor gardeners could produce tomato fruits with consistent quality attributes using various DLIs (Table 6 and Table 7). Dzakovich et al. [36,57,58] found that Brix, pH, EC, titratable acidity, and sugar:acid ratio were similar in greenhouse tomatoes grown under different supplemental lighting treatments, with DLIs ranging from <5 to >40 mol·m−2·d−1. Verheul [52] found that providing plants with more light did not affect tomato Brix, despite an increase in the number of fruits produced per plant under higher DLIs.
Average values for the fruit quality parameters measured in our study are similar to those reported by Dzakovich et al. [36,57,58], which were associated with good taste in organoleptic sensory surveys. It is plausible that studies focused on evaluating different colors of light could better elucidate mechanisms to change the nutritional quality and taste profile of tomato fruits, as indicated by spectral quality studies using LEDs in the greenhouse [59]. Similarly, manipulating fertility and irrigation methods have been shown to improve the quality attributes of tomato fruit [60,61], which could be recommended as strategies for home gardeners interested in manipulating fruit quality.

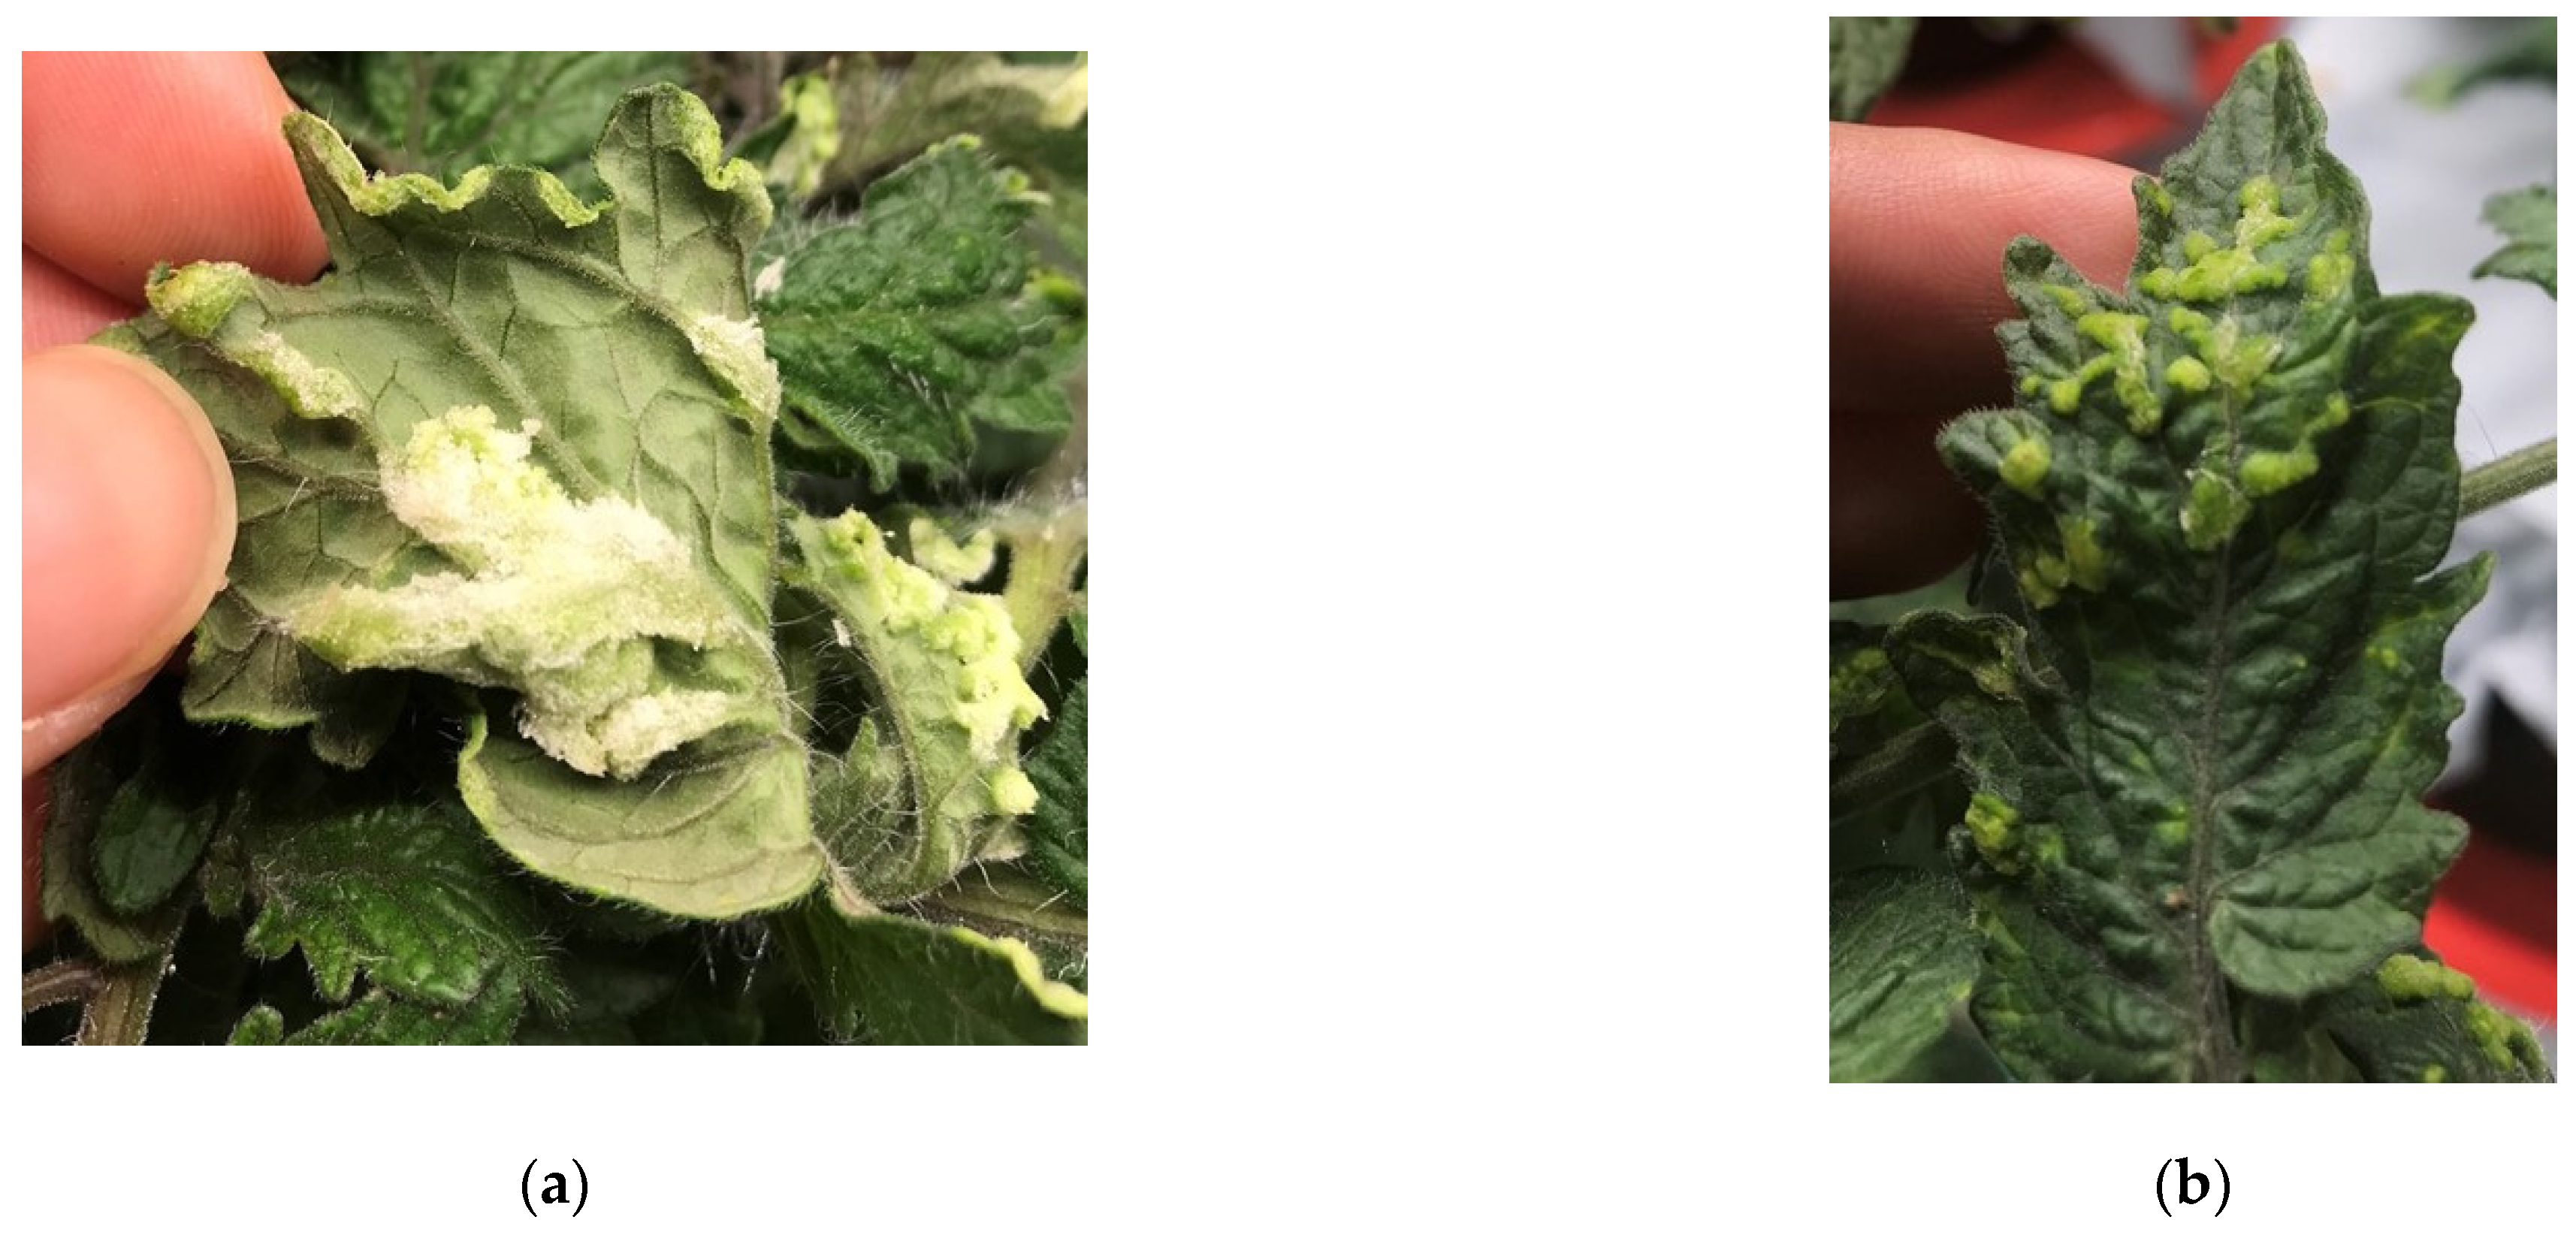
3.4. Intumescence and Physiological Responses

In experiment I, intumescence severity of LB and YC plants increased from 2.0 and 2.6 under L-12 to 3.9 and 3.8 under H-16, respectively (Table 8). However, no treatment differences were measured for intumescence severity in all other cultivars, although CR, RF, SNY, and YC plants showed signs of intumescence. Based on our findings for experiment I, SNY had the most severe intumescence as it developed several canker-like lesions on the surface of leaves (Figure 1). However, leaf abscission was only observed in YC plants, which led to complications with fungal decay.
Visually, YC appeared to be the most susceptible cultivar to intumescence, especially under the highest DLI evaluated in experiment I (Figure 2). However, this observation does not correspond with the data collected based on the subjective visual scale used in our study. Given the large variability observed in intumescence among cultivars grown in this and other studies conducted by our group [11], we believe that rating scales should be adjusted to enable the proper characterization and quantification of various symptoms. For example, intumescence injury in tomatoes can include canker-like lesions on stems and the adaxial and abaxial surface of leaves, leaf-edge discoloration, and partial or complete leaf abscission (Figure 1). In addition, complications with intumescence can lead to secondary pathogenic problems as seen in the YC plants grown in experiment I.
Interestingly, although intumescence severity of LB and YC plants was slightly higher in experiment I than in experiment II, severity was generally higher in treatments with the same DLI and lower PPFDs (Table 8 and Table 9). In addition, there was no intumescence incidence in LB under L-8 and YC under H-12 in experiment II, and there were no treatment differences for this variable in CR plants. Our findings contradict the results from Sagi and Rylski [62], who showed that intumescence was more severe under low compared to high PPFDs. The authors attributed their findings to changes in the RH and water loss in response to PPFD, which could plausibly explain the differences in intumescence measured in YC plants between the two experiments. It is likely that the larger plant density used in experiment I (11 plants·m−2) affected the responses to intumescence as it indirectly caused a higher RH in the growing environment (74 ± 14%) compared to that in experiment II (58 ± 14%), which had a lower plant density (four plants·m−2) (Table 1). Accordingly, studies have shown that high RH can aggravate intumescence injury in tomato plants as this affects the development of the protective cuticular layer of leaves [63].
Issues with intumescence appeared to decline as plants matured (data not shown). However, most research describing intumescence in tomatoes has been conducted on seedlings, and limited information is available describing how the disorder affects mature plants. We hypothesize that, as plants grow and produce more leaves, they have a greater leaf surface area for water to escape via transpiration, which likely changes the turgor pressure within cells and may affect the development of this disorder. Intumescence has important implications for indoor gardening, as it could mislead gardeners into thinking they are not providing adequate plant care. Further, the disorder decreases the aesthetic quality of plants, which, as previously mentioned, is an important attribute for most consumers.
In experiment I, SPAD index values were generally similar among treatments except for CR and S, which increased from 45 and 48 under L-12 to 53 and 64 under H-16, respectively (Table 8). In experiment II, SPAD index was generally higher under high compared to low DLIs (Table 9). This trend was expected as plants under higher DLIs tend to produce darker leaves, which corresponds with the findings of Adams et al. [64], who reported higher chlorophyll content in leaves of tomato plants grown under higher DLIs provided by extending the photoperiod. Plants under high DLIs also tend to produce thicker, smaller leaves than those under low DLIs, often as a photoprotective response to increasing PPFDs [45]. Within the same species, smaller leaves are commonly darker than larger leaves, partly due to a greater concentration of chlorophyll molecules in a smaller area.
Considering that visual aesthetics are important quality attributes for consumers, effects on leaf color may be important when selecting DLIs for indoor gardening. When comparing consumer preference for leaf color in ornamental plants, Townsley-Brascamp and Marr [65] found that most garden center consumers equally liked dark-green and light-green colored leaves. Based on our findings, indoor gardeners who prefer light-green leaves could use lower DLIs than those who prefer dark-green leaves, provided that plant aesthetics are more important than maximizing yield.
In experiment I, WUEplant of CR was 63% higher under H-16 compared to L-12 (Table 8). In contrast, in experiment II, WUEleaf of CR was 56% and 62% higher under H-12 and L-8, respectively, compared to H-16 (Table 9). Additionally, WUEleaf of YC plants in experiment II was the highest under H-12 and lowest under L-12 and H-16. As previously described, WUE was quantified at the whole-plant level in experiment I and at the leaf-level in experiment II. These differences likely explain the varying results in WUE between the two experiments. For example, there was an increasing trend in WUEplant for CR under increasing DLIs in experiment I. In contrast, WUEleaf for CR was the lowest under the higher DLI and longer photoperiod (H-16) in experiment II.
Our findings generally suggest that the WUE of these compact tomato plants was only slightly affected by DLI, although others have shown that both DLI and PPFD can affect WUE of plants (Table 8 and Table 9). Garland et al. [66] reported that WUEplant increased with increasing DLI in Heuchera americana L., likely due to changes in leaf area in response to DLI. As previously mentioned, plants tend to produce smaller leaves under high compared to low DLIs, which corresponds with our observations in both experiments (data not shown).
Small leaves help to minimize water loss in plants [67]. In a study with greenhouse-grown tomatoes, Li et al. [68] showed that WUEplant was slightly higher (although not significant) in plants grown under supplemental lighting compared to unlighted controls. The authors also found an increase in yield and photosynthesis in response to the use of supplemental lighting, suggesting that providing more light increases WUE by increasing the photosynthesis and yield without additional water consumption [68].
Leaf-level gas exchange was measured in experiment II to provide an indication of the instantaneous photosynthetic capacity of plants. In general, A was higher under treatments with the same DLI and higher PPFDs (Table 9). This could be attributed to the fact that short-term single-leaf measurements of A increase (to a point) under increasing PPFD. Correspondingly, Fan et al. [45] showed that A of tomato leaves consistently increased between PPFDs of 50 to 300 µmol·m−2·d−1 but decreased between PPFDs of 300 to 450 µmol·m−2·d−1.
In our study, A was similar in plants grown under L-8 and H-12, which provided an average PPFD of 360 ± 75 and 425 ± 83 µmol·m−2·d−1, respectively. Others have shown that light is used more efficiently to drive photosynthesis under lower PPFDs and longer photoperiods compared to higher PPFDs and shorter photoperiods [21,23,69]. Weaver and van Iersal [21] attributed this response to a greater electron transport rate under longer photoperiods. The results for A did not correspond with our general results for growth, yield, or fruit quality (Table 2, Table 3, Table 4, Table 5, Table 6 and Table 7), suggesting that leaf-level A is not an appropriate metric to describe how these compact tomato plants grow and produce fruit, nor does it reflect the photosynthetic efficiency of plants under different DLIs.

4. Conclusions

Results from this study provide baseline information for growing compact tomato plants under three DLIs using various photoperiods and PPFDs. As expected, fruit fresh mass of most cultivars increased from a low DLI of 10.4 mol·m−2·d−1 to a high DLI of 18.4 mol·m−2·d−1. However, based on the results from both experiments, changing the DLI delivery strategy by adjusting the photoperiod and PPFD did not appear to have major effects on the growth, yield, and fruit quality of these compact tomato plants, even though instantaneous leaf-level A increased under high PPFDs in experiment II. Our findings also show that higher DLIs generally decreased plant growth. Further, although several cultivars were affected by the intumescence, only LB and YC showed treatment responses, indicating that the severity was generally higher in treatments with the same DLI and lower PPFDs.
Fruit number and yield of certain cultivars (S, SNY, and LB) were similar in the low (10.4 mol·m−2·d−1) and intermediate (13.8 mol·m−2·d−1) DLIs compared to the high DLI (18.4 mol·m−2·d−1). Although the necessary yield to satisfy the needs of indoor gardeners is currently unknown, it appears that the DLIs used in this study could be adequate for indoor gardening of compact tomato plants. Further, the general lack of treatment differences in fruit quality suggests that all DLIs evaluated in our study could enable the production of fruit with consistent quality attributes.
Based on our findings, a lower DLI may be recommended to indoor gardeners aiming to produce larger, light-green plants. Further, lower DLIs could enable indoor gardeners to use low-output LED fixtures that are widely available as off-the-shelf products. However, higher DLIs could be recommended when the priority is to maximize yield, which could also help produce smaller plants that can maximize space-use efficiency.
Overall, photoperiods ranging from 8 to 16 h·d−1 appeared to be adequate for growing compact tomato plants indoors. However, longer photoperiods could enable indoor gardeners to use lower output LED fixtures to maintain adequate DLIs while potentially reducing the energy costs of providing sole-source lighting. Although photoperiods >16 h·d−1 may not be desirable for many home gardeners producing plants in common living spaces, further studies should evaluate growth and yield of these compact tomato plants under longer photoperiods that can increase DLI and maximize yield.

Author Contributions

Conceptualization, methodology, and investigation, S.C. and C.G.; formal analysis and data curation, S.C.; visualization and writing—original draft, S.C. and C.G; writing—review and editing, S.C. and C.G.; and funding acquisition, C.G. All authors have read and agreed to the published version of the manuscript.

Funding

Financial support was received from the USDA National Institute of Food and Agriculture, Multistate Research Project NE1835: Resource Optimization in Controlled Environment Agriculture, the USDA-ARS Floriculture and Nursery Research Initiative #58-3607-8-725, and industry partners of the Research on Urban Gardening (RUG) consortium, including PanAmerican Seed, Syngenta Flowers, BioWorks, and Scotts Miracle Gro Co. We also thank our partners from the Floriculture Research Alliance at the University of Florida.

Institutional Review Board Statement

Not applicable.

Informed Consent Statement

Not applicable.

Data Availability Statement

The data presented in this study are available upon request from the corresponding author.

Acknowledgments

We thank PanAmerican Seed, Syngenta Flowers, Pure Line Seeds Inc., and Sakata Seed America for donating seeds to conduct these trials.

Conflicts of Interest

The authors declare no conflict of interest. The funders had no role in the design of the study; in the collection, analyses, or interpretation of data; in the writing of the manuscript; or in the decision to publish the results.

References

  1. United Nations Department of Economic and Social Affairs. World Urbanization Prospects. 2018. Available online: https://population.un.org/wup/Publications/Files/WUP2018-Report.pdf (accessed on 23 May 2022).
  2. Deng, L.; Deng, Q. The basic roles of indoor plants in human health and comfort. Environ. Sci. Pollut. Res. 2018, 25, 36087–36101. [Google Scholar] [CrossRef] [PubMed]
  3. Baras, T. DIY Hydroponic Gardens; Cool Springs Press: Minneapolis, MN, USA, 2018; ISBN 0760357595. [Google Scholar]
  4. Halleck, L.F. Gardening under Lights; Timber Press: Portland, OR, USA, 2018; ISBN 1604697954. [Google Scholar]
  5. Machovina, H. Ways to Help Consumers Bring the Garden Indoors. 2019. Available online: https://www.greenhousegrower.com/crops/ways-to-help-consumers-bring-the-garden-indoors/ (accessed on 23 May 2022).
  6. Chinnchane, A.; Sumant, O. Smart Indoor Gardening Systems Market. 2021. Available online: https://www.alliedmarketresearch.com/smart-indoor-garden-systems-market-A09426 (accessed on 23 May 2022).
  7. USDA. Floriculture Crops 2020 Summary. 2021. Available online: https://downloads.usda.library.cornell.edu/usda-esmis/files/0p0966899/s4656b62g/g445d913v/floran21.pdf (accessed on 23 May 2022).
  8. Blazek, D. National Garden Bureau’s glimpse into the future. In Proceedings of the Cultivate’20, Columbus, OH, USA, 11–14 July 2020. [Google Scholar]
  9. The National Gardening Association. National Gardening Association Special Report: Garden to Table: A 5 Year Look at Food Gardening in America. 2014. Available online: https://garden.org/special/pdf/2014-NGA-Garden-to-Table.pdf (accessed on 23 May 2022).
  10. USDA. U.S. per Capita Loss-Adjusted Vegetable Availability 2019. 2020. Available online: https://www.ers.usda.gov/data-products/food-availability-per-capita-data-system/ (accessed on 23 May 2022).
  11. Cruz, S.; Van Santen, E.; Celina, G. Evaluation of compact tomato cultivars for container gardening indoors and under sunlight. Horticulturae 2022, 8, 294. [Google Scholar] [CrossRef]
  12. Gómez, C.; Cruz, S.; Fisher, P. Finding Fail-Proof Veggies. InsideGrower: Controlled Environment Agriculture. May 2021. Available online: https://www.ballpublishing.com/magazine/IG_21_05/index.aspx (accessed on 23 May 2022).
  13. Polanz, J. Finding the Right Fit. InsideGROWER: Controlled Environment Agriculture. February 2021. Available online: https://www.ballpublishing.com/magazine/IG_21_02/index.aspx (accessed on 23 May 2022).
  14. Kwon, C.T.; Heo, J.; Lemmon, Z.H.; Capua, Y.; Hutton, S.F.; Van Eck, J.; Park, S.J.; Lippman, Z.B. Rapid customization of Solanaceae fruit crops for urban agriculture. Nat. Biotechnol. 2020, 38, 182–188. [Google Scholar] [CrossRef]
  15. Hall, C.R.; Hodges, A.W.; Khachatryan, H.; Palma, M.A. Economic contributions of the green industry in the United States in 2018. J. Environ. Hortic. 2020, 38, 73–79. [Google Scholar] [CrossRef]
  16. Solis-Toapanta, E.; Gómez, C.; Kirilenko, A. Reddit community analysis to identify knowledge gaps. Horttechnology 2020, 30, 346–355. [Google Scholar] [CrossRef] [Green Version]
  17. Giorgioni, M.E.; Neretti, U. Effects of artificial light intensity and ambient CO2 level on photosynthesis of araceae species commonly used for interior landscaping. Acta Hortic. 2010, 881, 697–702. [Google Scholar] [CrossRef]
  18. Morgan, L. Daily Light Integral (DLI) and Greenhouse Tomato Production. 2013. Available online: https://www.specmeters.com/assets/1/7/2013_-_DLI_Greenhouse_Tomato1.pdf (accessed on 23 May 2022).
  19. Dorais, M.; Mitchell, C.A.; Kubota, C. Lighting greenhouse fruiting vegetables. In Light Management in Controlled Environments; Meister Media: Willoughby, OH, USA, 2017; pp. 159–169. ISBN 9781544254494. [Google Scholar]
  20. Klassen, S.P.; Ritchie, G.; Frantz, J.M.; Pinnock, D.; Bugbee, B. Real-time imaging of ground cover: Relationships with radiation capture, canopy photosynthesis, and daily growth rate. Digit. Imaging Spectr. Tech. Appl. Precis. Agric. 2015, 66, 3–14. [Google Scholar] [CrossRef] [Green Version]
  21. Weaver, G.; van Iersel, M.W. Longer photoperiods with adaptive lighting control can improve growth of greenhouse-grown ‘Little Gem’ lettuce (Lactuca sativa). HortScience 2020, 55, 573–580. [Google Scholar] [CrossRef] [Green Version]
  22. Elkins, C.; van Iersel, M.W. Longer photoperiods with the same daily light integral increase daily electron transport through photosystem II in lettuce. Plants 2020, 9, 1172. [Google Scholar] [CrossRef]
  23. Kelly, N.; Choe, D.; Meng, Q.; Runkle, E.S. Promotion of lettuce growth under an increasing daily light integral depends on the combination of the photosynthetic photon flux density and photoperiod. Sci. Hortic. 2020, 272, 109565. [Google Scholar] [CrossRef]
  24. Pham, D.M.; Chun, C. Growth and leaf injury in tomato plants under continuous light at different settings of constant and diurnally varied photosynthetic photon flux densities. Sci. Hortic. 2020, 269, 109347. [Google Scholar] [CrossRef]
  25. Velez-Ramirez, A.I.; Vreugdenhil, D.; Heuvelink, E.; Van Ieperen, W.; Millenaar, F.F. Continuous light as a way to increase greenhouse tomato production: Expected challenges. Acta Hortic. 2012, 956, 51–57. [Google Scholar] [CrossRef]
  26. Dorais, M.; Yelle, S.; Gosselin, A. Influence of extended photoperiod on photosynthate partitioning and export in tomato and pepper plants. N. Z. J. Crop Hortic. Sci. 1996, 24, 29–37. [Google Scholar] [CrossRef] [Green Version]
  27. O’Carrigan, A.; Hinde, E.; Lu, N.; Xu, X.Q.; Duan, H.; Huang, G.; Mak, M.; Bellotti, B.; Chen, Z.H. Effects of light irradiance on stomatal regulation and growth of tomato. Environ. Exp. Bot. 2014, 98, 65–73. [Google Scholar] [CrossRef]
  28. Craver, J.K.; Miller, C.T.; Williams, K.A.; Boyle, D.L. Characterization and comparison of lesions on ornamental sweetpotato ‘Blackie’, tomato ‘Maxifort’, interspecific geranium ‘Caliente Coral’, and bat-faced cuphea ‘Tiny Mice’. J. Am. Soc. Hortic. Sci. 2014, 139, 603–615. [Google Scholar] [CrossRef] [Green Version]
  29. Kubota, C.; Eguchi, T.; Kroggel, M. UV-B radiation dose requirement for suppressing intumescence injury on tomato plants. Sci. Hortic. 2017, 226, 366–371. [Google Scholar] [CrossRef]
  30. Williams, K.A.; Miller, C.T.; Craver, J.K. Light quality effects on intumescence (oedema) on plant leaves. In LED Lighting for Urban Agriculture; Springer: Berlin/Heilderberg, Germany, 2016; pp. 275–286. [Google Scholar] [CrossRef]
  31. Want, J.; Bumb, H.; Zeitschrift, D.P.; Reise, U.; Bayly, E.; Gaisberg, F.; Jussuf, S.; Str, H.; Beka, T. The Great Reset. Garden Media Garden Trends Report 2021. Available online: https://f.hubspotusercontent00.net/hubfs/165357/2021%20Garden%20Trends%20Report%20-%20final.pdf (accessed on 23 May 2022).
  32. Mitchell, C.A.; Sheibani, F. LED advancements for plant-factory artificial lighting. In Plant Factory: An Indoor Vertical Farming System for Efficient Quality Food Production, 2nd ed.; Academic Press: Cambridge, MA, USA, 2020; pp. 167–184. [Google Scholar] [CrossRef]
  33. Gómez, C.; Jiménez, J. Effect of end-of-production high-energy radiation on nutritional quality of indoor-grown red-leaf lettuce. HortScience 2020, 55, 1055–1060. [Google Scholar] [CrossRef]
  34. Cloyd, R.A.; Marley, K.A.; Larson, R.A.; Arieli, B. Attractiveness of parboiled rice hulls to the fungus gnat, bradysia sp. nr coprophila (Diptera: Sciaridae), adult relative to standard growing medium components. HortScience 2009, 44, 1366–1369. [Google Scholar] [CrossRef] [Green Version]
  35. Eguchi, T.; Hernández, R.; Kubota, C. End-of-day far-red lighting combined with blue-rich light environment to mitigate intumescence injury of two interspecific tomato rootstocks. Acta Hortic. 2016, 1134, 163–170. [Google Scholar] [CrossRef]
  36. Dzakovich, M.P.; Gómez, C.; Mitchell, C.A. Tomatoes grown with light-emitting diodes or high-pressure sodium supplemental lights have similar fruit-quality attributes. HortScience 2015, 50, 1498–1502. [Google Scholar] [CrossRef]
  37. Moneruzzaman, K.M.; Hossain, A.B.M.S.; Sani, W.; Saifuddin, M. Effect of stages of maturity and ripening conditions on the biochemical characteristics of tomato. Am. J. Biochem. Biotechnol. 2008, 4, 336–344. [Google Scholar] [CrossRef]
  38. R Core Team. R: A Language and Environment for Statistical Computing, Vienna, Austria. 2021. Available online: https://www.eea.europa.eu/data-and-maps/indicators/oxygen-consuming-substances-in-rivers/r-development-core-team-2006 (accessed on 23 May 2022).
  39. Wickham, H.; Francois, R.; Henry, L.; Muller, K. dplyr: A Grammar of Data Manipulation 2021. Available online: https://dplyr.tidyverse.org/ (accessed on 23 May 2022).
  40. Mendiburu, F. de Agricolae: Statistical Procedures for Agricultural Research. 2021. Available online: https://rdrr.io/cran/agricolae/ (accessed on 23 May 2022).
  41. Runkle, E. Crops Suitable for Vertical Farming. Greenhouse Production News. April 2019. Available online: https://gpnmag.com/article/crops-suitable-for-vertical-farming/ (accessed on 23 May 2022).
  42. Kalaitzoglou, P.; van Ieperen, W.; Harbinson, J.; van der Meer, M.; Martinakos, S.; Weerheim, K.; Nicole, C.C.S.; Marcelis, L.F.M. Effects of continuous or end-of-day far-red light on tomato plant growth, morphology, light absorption, and fruit production. Front. Plant Sci. 2019, 10, 322. [Google Scholar] [CrossRef] [Green Version]
  43. Prudac Container Tomatoes. Available online: https://www.prudac.com/products/tomatoes (accessed on 23 May 2022).
  44. Hwang, H.; An, S.; Pham, M.D.; Cui, M.; Chun, C. The combined conditions of photoperiod, light intensity, and air temperature control the growth and development of tomato and red pepper seedlings in a closed transplant production system. Sustainability 2020, 12, 9939. [Google Scholar] [CrossRef]
  45. Demers, D.-A.; Dorais, M.; Wien, C.H.; Gosselin, A. Effects of supplemental light duration on greenhouse tomato (Lycopersicon esculentum Mill.) plants and fruit yields. Sci. Hortic. 1998, 74, 295–306. [Google Scholar] [CrossRef]
  46. Fan, X.-X.; Xu, Z.-G.; Liu, X.-Y.; Tang, C.-M.; Wang, L.-W.; Han, X.-l. Effects of light intensity on the growth and leaf development of young tomato plants grown under a combination of red and blue light. Sci. Hortic. 2013, 153, 50–55. [Google Scholar] [CrossRef]
  47. Chitwood, D.H.; Kumar, R.; Ranjan, A.; Pelletier, J.M.; Townsley, B.T.; Ichihashi, Y.; Martinez, C.C.; Zumstein, K.; Harada, J.J.; Maloof, J.N.; et al. Light-induced indeterminacy alters shade-avoiding tomato leaf morphology. Plant Physiol. 2015, 169, 2030–2047. [Google Scholar] [CrossRef] [PubMed] [Green Version]
  48. Lund, J.B.; Blom, T.J.; Aaslyng, J.M. End-of-day lighting with different red/far-red ratios using light-emitting diodes affects plant growth of Chrysanthemum × morifolium Ramat. “Coral Charm.”. HortScience 2007, 42, 1609–1611. [Google Scholar] [CrossRef] [Green Version]
  49. Faust, J.E. FIRST Research Report: Light Management in Greenhouses. 2002. Available online: https://www.specmeters.com/assets/1/7/A051.pdf (accessed on 23 May 2022).
  50. Faust, J.E.; Holcombe, V.; Rajapakse, N.C.; Layne, D.R. The effect of daily light integral on bedding plant growth and flowering. HortScience 2005, 40, 645–649. [Google Scholar] [CrossRef] [Green Version]
  51. Heuvelink, E.; Dorais, M. Crop Growth and Yield. In Tomatoes; CABI Publishing: Wallingford, UK, 2005; pp. 85–144. ISBN 9780851993966. [Google Scholar]
  52. Verheul, M.J. Effects of plant density, leaf removal and light intensity on tomato quality and yield. Acta Hortic. 2012, 956, 365–372. [Google Scholar] [CrossRef]
  53. Heuvelink, E. Developmental processes. In Tomatoes; CABI Publishing: Wallingford, UK, 2005; pp. 54–84. ISBN 9780851993966. [Google Scholar]
  54. Heuvelink, E. Effect of fruit load on dry matter partitioning in tomato. Sci. Hortic. 1997, 69, 51–59. [Google Scholar] [CrossRef]
  55. Sykes, V.R.; Bumgarner, N.R.; Keadle, S.B.; Wilson, A.; Palacios, F. Citizen science in vegetable garden cultivar evaluation in Tennessee. Horticulturae 2021, 7, 422. [Google Scholar] [CrossRef]
  56. López Camelo, A.F.; Gómez, P.A. Comparison of color indexes for tomato ripening. Hortic. Bras. 2004, 22, 534–537. [Google Scholar] [CrossRef]
  57. Dzakovich, M.P.; Ferruzzi, M.G.; Mitchell, C.A. Manipulating Sensory and phytochemical profiles of greenhouse tomatoes using environmentally relevant doses of ultraviolet radiation. J. Agric. Food Chem. 2016, 64, 6801–6808. [Google Scholar] [CrossRef] [PubMed]
  58. Dzakovich, M.P.; Gómez, C.; Ferruzzi, M.G.; Mitchell, C.A. Chemical and sensory properties of greenhouse tomatoes remain unchanged in response to red, blue, and far red supplemental light from light-emitting diodes. HortScience 2017, 52, 1734–1741. [Google Scholar] [CrossRef] [Green Version]
  59. Kim, H.J.; Yang, T.; Choi, S.; Wang, Y.J.; Lin, M.Y.; Liceaga, A.M. Supplemental intracanopy far-red radiation to red LED light improves fruit quality attributes of greenhouse tomatoes. Sci. Hortic. 2020, 261, 108985. [Google Scholar] [CrossRef]
  60. Abdel-Razzak, H.; Wahb-Allah, M.; Ibrahim, A.; Alenazi, M.; Alsadon, A. Response of cherry tomato to irrigation levels and fruit pruning under greenhouse conditions. J. Agric. Sci. Technol. 2016, 18, 1091–1103. [Google Scholar] [CrossRef] [Green Version]
  61. Solis-Toapanta, E.; Fisher, P.R.; Gómez, C. Effects of nutrient solution management and environment on tomato in small-scale hydroponics. HortTechnology 2020, 30, 697–705. [Google Scholar] [CrossRef]
  62. Sagi, A.; Rylski, I. Differences in susceptibility to Oedema in two Tomato cultivars growing under various light intensities. Phytoparasitica 1978, 6, 151–153. [Google Scholar] [CrossRef]
  63. Suzuki, K.; Ozawa, C.; Kiriiwa, Y. Morphological study on the incidence of intumescence injury in tomato plant leaves. Hortic. J. 2020. [Google Scholar] [CrossRef]
  64. Adams, S.R.; Valdés, V.M.; Langton, F.A. Why does low intensity, long-day lighting promote growth in Petunia, Impatiens, and tomato? J. Hortic. Sci. Biotechnol. 2008, 83, 609–615. [Google Scholar] [CrossRef]
  65. Townsley-Brascamp, W.; Marr, N.E. Evaluation and analysis of consumer preferences for outdoor ornamental plants. Acta Hortic. 1995, 199–208. [Google Scholar] [CrossRef]
  66. Garland, K.F.; Burnett, S.E.; Day, M.E.; van Iersel, M.W. Influence of substrate water content and daily light integral on photosynthesis, water use efficiency, and morphology of Heuchera americana. J. Am. Soc. Hortic. Sci. 2012, 137, 57–67. [Google Scholar] [CrossRef] [Green Version]
  67. Osmond, C.B. What is photoinhibition? Some insights from comparisons of shade and sun plants. Photoinhibition Photosynth. Mol. Mech. Field 1994, 1–24. [Google Scholar]
  68. Li, Q.; Liu, Y.; Tian, S.; Liang, Z.; Li, S.; Li, Y.; Wei, M.; Zhang, D. Effect of supplemental lighting on water transport, photosynthetic carbon gain and water use efficiency in greenhouse tomato. Sci. Hortic. 2019, 256, 108630. [Google Scholar] [CrossRef]
  69. Elkins, C.; van Lersel, M.W. Longer photoperiods with the same daily light integral improve growth of rudbeckia seedlings in a greenhouse. HortScience 2020, 55, 1672–1676. [Google Scholar] [CrossRef]
Figure 1. Symptoms of intumescence; canker-like lesions on the surface of tomato leaves on the (a) abaxial and (b) adaxial leaf surface.
Agronomy 12 01704 g001
Figure 2. Intumescence severity of ‘Yellow Canary’ tomato in experiment I under (a) a low DLI of 10.4 mol·m−2·d−1 and (b) a high DLI of 18.4 mol·m−2·d−1.
Agronomy 12 01704 g002
Table 1. Mean (± standard deviation) of the near-canopy air temperature measured under four daily light integral (DLI) treatments evaluated in two experiments.
Treatment zDLI
(mol·m−2·d−1)
PPFD
(µmol·m−2·s−1)
Photoperiod (h·d−1)Temperature
(°C)
Experiment I
L-1210.4 ± 0.5240 ± 621220.8 ± 1.4
I-1213.8 ± 0.6320 ± 901221.0 ± 2.0
I-1613.8 ± 0.8240 ± 601621.2 ± 1.5
H-1618.4 ± 1.1320 ± 911621.7 ± 1.9
Experiment II
L-810.4 ± 0.3360 ± 75821.1 ± 1.4
L-1210.4 ± 0.4240 ± 491221.1 ± 1.4
H-1218.4 ± 0.8425 ± 831221.9 ± 1.9
H-1618.4 ± 1.1320 ± 671621.9 ± 1.7
z Low (L), intermediate (I), or high (H) DLI treatments. The number represents the corresponding photoperiod. PPFD = Photosynthetic photon flux density.
Table 2. Growth parameters measured on nine compact tomato cultivars grown in experiment I.
Treatment zGrowth Index y
(m3)
Height
(cm)
Shoot Fresh Mass (g)Shoot Dry Mass (g)Canopy Density x
(g·cm−1)
‘Catch Red’
L-120.02 a w20.9 a100.3 b9.0 b0.5 b
I-120.02 a21.8 a127.8 ab12.2 b0.5 b
I-160.02 a20.4 a126.0 ab13.2 ab0.6 b
H-160.02 a21.3 a155.5 a17.0 a0.9 a
‘Little Bing’
L-120.10 a36.9 a317.0 a28.1 a0.8 a
I-120.10 a38.1 a297.5 a29.8 a0.9 a
I-160.09 a37.4 a316.0 a32.1 a0.8 a
H-160.10 a40.9 a247.8 a30.9 a0.9 a
‘Rosy Finch’
L-120.09 a36.8 a309.5 a32.6 a0.9 a
I-120.07 ab32.6 ab264.0 ab27.3 a0.9 a
I-160.07 b31.6 ab274.8 ab31.1 a1.0 a
H-160.06 b28.8 b240.3 b29.7 a1.0 a
‘Red Robin’
L-120.06 a29.8 a303.0 a28.5 a1.0 a
I-120.05 ab27.5 ab236.8 a22.3 a0.9 a
I-160.04 b22.9 bc296.5 a28.5 a1.1 a
H-160.04 b20.6 c225.8 a20.7 a1.1 a
‘Siam’
L-120.06 a24.0 a209.5 a18.5 a0.8 a
I-120.06 a24.8 a251.0 a23.6 a0.9 a
I-160.05 a25.3 a245.8 a24.7 a1.0 a
H-160.04 a25.0 a213.8 a24.6 a1.0 a
‘Sweet ‘n’ Neat Scarlet’
L-120.06 a27.1 a236.5 a22.1 a0.8 a
I-120.04 a27.5 a224.5 a21.0 a0.7 a
I-160.04 a21.5 a224.0 a21.9 a1.0 a
H-160.04 a24.1 a231.5 a24.2 a1.1 a
‘Sweet ‘n’ Neat Yellow’
L-120.11 a39.5 a310.3 a29.4 a0.8 a
I-120.08 ab35.1 ab289.8 a33.0 a0.9 a
I-160.06 b32.6 b229.5 a33.5 a1.0 a
H-160.07 b33.8 ab256.0 a32.7 a1.0 a
‘Sweet Sturdy Jimmy’
L-120.09 a31.1 a444.0 a101.2 a3.3 a
I-120.08 a30.9 ab332.0 a33.6 a1.1 a
I-160.05 b24.8 bc297.8 a29.8 a1.3 a
H-160.05 b23.5 c269.3 a30.0 a1.4 a
‘Yellow Canary’
L-120.04 a 27.9 a172.0 a14.1 a0.5 b
I-120.03 ab24.1 ab200.8 a17.7 a0.8 a
I-160.03 b24.1 ab205.5 a16.0 a0.7 ab
H-160.02 b22.0 b149.8 a16.6 a0.7 a
z Treatments providing low (L), intermediate (I), or high (H) daily light integrals of 10.4, 13.8, or 18.4 mol·m−2·d−1, respectively, with a 12 or 16 h photoperiod. y Growth index was calculated using the formula π × h × r2, where h is plant height, and r was calculated by multiplying half times the mean of two leaf widths. x Canopy density was calculated based on dividing values for shoot dry mass by shoot height. w For each cultivar, means within columns followed by the same letter are not different based on Tukey’s Honestly Significant Different test at p ≤ 0.05. n = 8 for growth index and height; n = 4 for shoot fresh mass, shoot dry mass, and canopy density.
Table 3. Growth parameters measured on three compact tomato cultivars grown in experiment II.
Treatment zGrowth Index y (m3)Height (cm)Shoot Fresh Mass (g)Shoot Dry Mass (g)Canopy Density x (g·cm−1)
‘Catch Red’
L-80.03 a w27.6 a144.8 b16.3 c0.6 b
L-120.03 a26.8 a141.5 b15.8 c0.6 b
H-120.02 a23.1 a167.9 b21.9 b1.0 a
H-160.03 a27.5 a219.0 a31.3 a1.2 a
‘Little Bing’
L-80.24 a50.3 ab731.6 a76.3 a1.5 b
L-120.30 a56.3 a774.6 a81.9 a1.5 b
H-120.15 b42.4 b704.1 a85.3 a2.0 a
H-160.15 b45.8 ab645.3 a84.9 a1.9 ab
‘Yellow Canary’
L-80.13 a33.0 a500.4 a48.0 c1.5 b
L-120.11 ab34.3 a484.4 a53.4 bc1.6 b
H-120.09 b30.1 a551.9 a65.5 ab2.2 a
H-160.08 b30.1 a613.4 a76.3 a2.5 a
z Treatments providing low (L) or high (H) daily light integrals of 10.4 or 18.4 mol·m−2·d−1, respectively, with an 8, 12, or 16 h photoperiod. y Growth index was calculated using the formula π × h × r2, where h is plant height, and r was calculated by multiplying half times the mean of two leaf widths. x Canopy density was calculated based on dividing values for shoot dry mass by shoot height. w For each cultivar, means within columns followed by the same letter are not different based on Tukey’s Honestly Significant Different test at p ≤ 0.05 (n = 8).
Table 4. Fruit yield measured on nine compact tomato cultivars grown in experiment I.
Treatment zTotal Fruits (No.)Total Fruit Fresh Mass (g)
‘Catch Red’
L-1233.5 b x104.6 c
I-1243.4 b156.7 b
I-1644.6 b169.8 b
H-1668.4 a248.2 a
‘Little Bing’
L-1254.6 a365.7 b
I-1257.9 a417.8 ab
I-1653.6 a401.4 b
H-1662.4 a469.6 a
‘Rosy Finch’
L-1228.8 c210.1 c
I-1250.0 ab356.2 b
I-1647.0 b322.1 bc
H-1665.4 a503.1 a
‘Red Robin’
L-1228.8 b232.2 b
I-1238.3 ab317.4 b
I-1647.1 ab299.9 b
H-1657.2 a458.5 a
‘Siam’
L-1273.8 b323.0 b
I-1271.5 b392.8 ab
I-1682.1 ab423.4 ab
H-1696.2 a494.0 a
‘Sweet ‘n’ Neat Scarlet’
L-1241.0 c277.4 c
I-1252.8 bc337.7 bc
I-1661.0 ab380.7 ab
H-1672.9 a437.7 a
‘Sweet ‘n’ Neat Yellow’
L-1225.3 a176.7 b
I-1241.7 a223.8 ab
I-1637.1 a242.9 ab
H-1646.5 a328.6 a
‘Sweet Sturdy Jimmy’
L-1246.6 b313.1 b
I-1256.8 ab393.6 b
I-1656.6 ab367.2 b
H-16106.6 a509.6 a
‘Yellow Canary’ y
L-1224.0 a149.2 b
I-1230.9 a156.1 b
I-1627.5 a149.8 b
H-1636.4 a192.7 a
z Treatments providing low (L), intermediate (I), or high (H) daily light integrals of 10.4, 13.8, or 18.4 mol·m−2·d−1, respectively, with a 12 or 16 h photoperiod. y ‘Yellow Canary’ plants were prematurely terminated, which is reflected in the yield measured for this cultivar. x For each cultivar, means within columns followed by the same letter are not different based on Tukey’s Honestly Significant Different test at p ≤ 0.05 (n = 8).
Table 5. Fruiting responses measured on three compact tomato cultivars grown in experiment II.
Treatment zDays until Harvest (No.) yTotal Fruits (No.)Total Fruit Fresh Mass (g)
‘Catch Red’
L-865.4 a x33.5 b174.8 b
L-1263.6 ab38.4 ab193.0 ab
H-1260.1 bc45.9 a244.6 a
H-1658.5 c49.8 a224.0 ab
‘Little Bing’
L-868.4 a72.3 a567.6 a
L-1266.4 a95.5 a704.3 a
H-1261.3 b80.6 a654.6 a
H-1659.9 b86.0 a639.0 a
‘Yellow Canary’
L-865.6 a62.4 b563.1 ab
L-1265.6 a59.4 b488.5 b
H-1260.0 b71.5 ab611.1 ab
H-1662.5 ab82.1 a697.1 a
z Treatments providing low (L) or high (H) daily light integrals of 10.4 or 18.4 mol·m−2·d−1, respectively, with an 8, 12, or 16 h photoperiod. y Based on the number of days between transplanting and first harvest. x For each cultivar, means within columns followed by the same letter are not different based on Tukey’s Honestly Significant Different test at p ≤ 0.05 (n = 8).
Table 6. Physiochemical fruit content and color attributes measured on nine compact tomato cultivars grown in experiment I.
Treatment zpHElectrical Conductivity (dS·m−1)Brix (°) yCitric Acid (%) xSugar:Acid wFruit Color v
L*a*b*a*/b*
‘Catch Red’
L-124.2 a u9.2 a4.2 b0.6 a7.5 a33.6 a v34.0 a16.0 a2.13 ab
I-124.1 a10.4 a5.1 a1.0 a6.0 a35.7 a33.7 a15.9 a2.11 ab
I-164.1 a8.6 a4.5 ab0.5 a8.7 a34.5 a32.7 a16.8 a1.95 b
H-164.2 a7.0 a5.1 ab0.6 a9.6 a33.7 a36.0 a16.3 a2.22 a
‘Little Bing’
L-124.2 a6.7 a4.3 b0.4 a11.9 a32.1 a22.5 a14.1 a1.59 a
I-124.2 a7.1 a4.6 b0.7 a8.4 a32.2 a23.7 a13.0 a1.82 a
I-164.3 a6.3 a4.7 b0.4 a13.0 a32.0 a21.9 a12.9 a1.70 a
H-164.3 a7.2 a5.7 a0.4 a15.5 a31.8 a24.8 a13.3 a1.87 a
‘Rosy Finch’
L-124.3 a4.6 a3.3 a0.2 a13.8 a35.7 a16.8 a10.1 a1.65 a
I-124.3 a4.7 a3.5 a0.2 a15.4 a36.5 a16.6 a9.7 a1.71 a
I-164.2 a4.5 a3.5 a0.2 a15.0 a36.6 a20.3 a11.0 a1.89 a
H-164.3 a4.4 a3.6 a0.2 a28.5 a37.0 a22.2 a11.0 a2.02 a
‘Red Robin’
L-124.2 a5.8 a3.4 a0.3 a10.8 a34.5 a19.5 a17.0 a1.15 a
I-124.3 a4.9 a3.8 a0.2 a17.1 a33.9 ab19.8 a15.8 ab1.25 a
I-164.3 a5.6 a3.6 a0.3 a12.8 a34.3 ab17.6 a15.9 ab1.11 a
H-164.4 a5.8 a4.6 a0.3 a16.2 a32.0 b19.0 a14.3 b1.33 a
‘Siam’
L-124.1 a6.1 a4.3 a0.4 a10.0 a33.7 a22.3 a16.0 a1.39 a
I-124.3 a6.9 a3.6 a0.4 a9.7 a32.3 a18.1 a14.5 a1.25 a
I-164.2 a6.4 a4.4 a0.3 a14.3 a33.9 a20.0 a15.5 a1.29 a
H-164.3 a6.4 a4.2 a0.3 a15.6 a32.9 a16.0 a15.5 a1.03 a
‘Sweet ‘n’ Neat Scarlet’
L-124.3 a 6.8 a4.1 a0.4 a12.2 a33.7 a18.5 a24.0 a0.98 a
I-124.4 a6.1 a3.8 a0.3 a11.3 a32.8 a18.0 a14.4 a1.25 a
I-164.2 a6.3 a4.0 a0.4 a11.2 a33.2 a18.8 a15.9 a1.18 a
H-164.4 a6.0 a4.2 a0.3 a14.0 a33.0 a19.4 a15.5 a1.26 a
‘Sweet ‘n’ Neat Yellow’
L-124.3 a5.3 a3.8 a0.3 a15.5 a47.8 a−0.6 a40.4 a−0.01 a
I-124.3 a5.8 a4.1 a0.3 a13.9 a44.2 a−0.4 a36.1 a−0.01 a
I-164.3 a5.7 a4.6 a0.3 a21.6 a46.9 a0.6 a40.4 a0.01 a
H-164.4 a5.9 a4.5 a0.4 a13.4 a45.9 a1.3 a37.9 a0.03 a
‘Sweet Sturdy Jimmy’
L-124.2 a6.4 a4.6 a0.3 a13.8 a33.8 a21.0 a16.2 a1.29 a
I-124.2 a6.7 a4.8 a0.4 a12.1 a33.2 a23.1 a15.5 a1.49 a
I-164.2 a6.3 a4.3 a0.4 a12.1 a32.7 a19.6 a14.6 a1.33 a
H-164.3 a5.9 a5.1 a0.3 a20.3 a31.8 a22.9 a14.5 a1.56 a
z Treatments providing low (L), intermediate (I), or high (H) daily light integrals of 10.4, 13.8, or 18.4 mol·m−2·d−1, respectively, with a 12 or 16 h photoperiod. y Grams sucrose/100 g sample. x Determined by titrating 100 mL of tomato juice solution with sodium hydroxide until a pH of 8.1 was reached. w Determined by dividing values for Brix by citric acid. v L* = light/dark; a* = red/green; b* = yellow/blue; a*/b* = brightness of red color. u For each cultivar, means within columns followed by the same letter are not different based on Tukey’s Honestly Significant Different test at p ≤ 0.05 (n = 4).
Table 7. Physiochemical fruit content and color attributes measured on three compact tomato cultivars grown in experiment II.
Treatment zpHElectrical
Conductivity (dS·m−1)
Brix (°) yCitric Acid (%) xSugar:
Acid w
Fruit Color v
L*a*b*a*/b*
‘Catch Red’
L-84.0 a u7.7 ab5.2 b0.7 a8.0 b34.8 ab30.7 b14.8 b2.07 b
L-123.9 ab8.2 a5.4 b0.7 a7.4 b34.6 ab30.5 b14.7 b2.08 b
H-123.9 b7.7 ab6.5 a0.7 a9.2 ab35.3 a35.8 a17.0 a2.11 b
H-163.9 ab7.3 b7.2 a0.7 a10.6 a34.0 b37.1 a15.4 b2.40 a
‘Little Bing’
L-84.0 a5.8 a5.3 b0.5 a10.8 a32.9 a22.4 a12.0 a1.88 a
L-124.0 a5.9 a5.7 ab0.5 a12.5 a33.2 a21.7 a12.0 a1.80 a
H-124.0 a5.8 a6.2 a0.3 a11.7 a33.0 a23.9 a12.2 a1.95 a
H-164.0 a5.7 a5.9 ab0.4 a14.6 a32.8 a23.1 a14.7 a1.67 a
‘Yellow Canary’
L-84.1 a5.0 a4.1 b0.3 a12.3 bc45.6 a−2.0 a33.8 a−0.06 a
L-124.1 a5.4 a4.2 ab0.4 a10.6 c47.7 a−3.8 a37.9 a−0.09 a
H-124.1 a4.8 a5.0 a0.3 a15.5 a46.4 a−0.8 a35.9 a−0.03 a
H-164.2 a4.8 a5.0 ab0.4 a13.8 ab45.8 a−0.6 a35.0 a−0.02 a
z Treatments providing low (L) or high (H) daily light integrals of 10.4 or 18.4 mol·m−2·d−1, respectively, with an 8, 12, or 16 h photoperiod. y Grams sucrose/100 g sample. x Determined by titrating 100 mL of tomato juice solution with sodium hydroxide until a pH of 8.1 was reached. w Determined by dividing values for Brix by citric acid. v L* = light/dark; a* = red/green; b* = yellow/blue; and a*/b* = brightness of red color. u For each cultivar, means within columns followed by the same letter are not different based on Tukey’s Honestly Significant Different test at p ≤ 0.05 (n = 8).
Table 8. Intumescence and physiological parameters measured on nine compact tomato cultivars grown in experiment I.
Treatment zIntumescence Severity (1–6) ySPADWUEplant
(g·L−1) x
‘Catch Red’
L-122.5 a w48.0 b 3.5 b
I-122.6 a57.2 a4.5 ab
I-162.5 a64.3 a4.7 ab
H-162.8 a63.7 a5.7 a
‘Little Bing’
L-122.0 b47.3 a3.3 a
I-122.1 b51.1 a3.4 a
I-162.8 ab53.2 a3.3 a
H-163.9 a56.3 a4.3 a
‘Rosy Finch’
L-122.0 a55.2 a3.2 a
I-122.1 a56.8 a3.6 a
I-162.3 a56.7 a3.6 a
H-162.6 a56.8 a3.8 a
‘Red Robin’
L-121.3 a53.5 a3.5 a
I-121.3 a47.1 a3.3 a
I-161.3 a54.6 a3.5 a
H-161.3 a55.4 a3.6 a
‘Siam’
L-121.1 a45.0 b3.8 a
I-121.3 a48.1 ab3.6 a
I-161.3 a50.6 ab4.0 a
H-161.1 a53.3 a4.2 a
‘Sweet ‘n’ Neat Scarlet’
L-121.0 a52.6 a3.6 a
I-121.3 a53.2 a3.6 a
I-161.3 a55.8 a3.8 a
H-161.3 a57.5 a4.0 a
‘Sweet ‘n’ Neat Yellow’
L-123.6 a52.1 a3.0 a
I-123.6 a51.3 a2.9 a
I-163.4 a49.7 a3.2 a
H-164.0 a50.3 a3.4 a
‘Sweet Sturdy Jimmy’
L-121.0 a51.9 a 8.2 a
I-121.3 a51.0 a3.7 a
I-161.3 a53.7 a4.0 a
H-161.3 a57.1 a4.2 a
‘Yellow Canary’
L-122.6 bc48.9 a3.4 a
I-122.4 c51.4 a3.3 a
I-163.3 ab52.7 a3.5 a
H-163.8 a54.5 a3.8 a
z Treatments providing low (L), intermediate (I), or high (H) daily light integrals of 10.4, 13.8, or 18.4 mol·m−2·d−1, respectively, with a 12 or 16 h photoperiod. y Subjective scale based on Eguchi et al. [35] with modifications, where 1 = no intumescence injury; 2 = 1% to 10% of the plant affected and minimal isolated intumescence on terminal leaves; 3 = 11% to 50% of the plant affected and dense intumescence on the terminal leaflet with pronounced topical necrotic spotting; 4 = 51% to 75% of the plant affected, pronounced upward leaf curling, and prolific top leaf surface necrosis; 5 = 76% to 100% of the plant affected and full senescence of leaflets; and 6 = complete abscission/senescence. x WUEplant = Whole-plant water use efficiency, expressed as grams of shoot plus fruit dry mass divided by liters of water used by the plant. w For each cultivar, means within columns followed by the same letter are not different based on Tukey’s Honestly Significant Different test at p ≤ 0.05 (n = 8 for intumescence and n = 4 for SPAD and WUEplant).
Table 9. Intumescence and physiological parameters measured on three compact tomato cultivars grown in experiment II.
Treatment zIntumescence
Severity (1–6) y
Intumescence
Incidence (%)
SPADWUEleaf (mmol·mol−1) xNet Photosynthesis (µmol·m−2·s−1)
‘Catch Red’
L-81.1 a w1.9 a65.1 b 5.5 a9.2 ab
L-121.4 a2.8 a68.3 b4.1 ab6.2 b
H-121.1 a1.7 a79.8 a5.3 a11.0 a
H-161.3 a2.8 a78.7 a3.4 b7.2 ab
‘Little Bing’
L-81.0 b0.0 c57.7 b4.3 a11.2 a
L-121.1 ab1.3 b62.1 ab2.8 a7.4 b
H-121.3 a1.9 b68.1 a4.4 a11.1 a
H-161.5 a3.6 a66.1 ab4.0 a7.7 b
‘Yellow Canary’
L-81.1 b3.2 b52.8 b3.6 b13.0 a
L-122.0 a12.3 ab54.0 b2.2 c8.7 b
H-121.0 b0.0 b62.7 a5.1 a12.7 a
H-162.6 a21.2 a64.2 a2.4 c9.4 b
z Treatments providing low (L) or high (H) daily light integrals of 10.4 or 18.4 mol·m−2·d−1, respectively, with an 8, 12, or 16 h photoperiod. y Subjective scale based on Eguchi et al. [35] with modifications, where 1 = no intumescence injury; 2 = 1% to 10% of the plant affected and minimal isolated intumescence on terminal leaves; 3 = 11% to 50% of the plant affected and dense intumescence on the terminal leaflet with pronounced topical necrotic spotting; 4 = 51% to 75% of the plant affected, pronounced upward leaf curling, and prolific top leaf surface necrosis; 5 = 76% to 100% of the plant affected and full senescence of leaflets; and 6 = complete abscission/senescence. x WUEleaf = Leaf-level water use efficiency. w For each cultivar, means within columns followed by the same letter are not different based on Tukey’s Honestly Significant Different test at p ≤ 0.05 (n = 8).
Publisher’s Note: MDPI stays neutral with regard to jurisdictional claims in published maps and institutional affiliations.

