Abstract
Tree peony (Paeonia ostii) is an important ornamental plant with high oil and medical values and is widely distributed in China. In order to explore the effects of sucrose treatment on the growth of the P. ostii seeds and identify key genes involved in sucrose metabolism and transport during the early development of the P. ostii seeds, the comparative transcriptome sequencing of the P. ostii seed coats and endosperms at 50 days after flowering (DAF) with and without sucrose supply were conducted using Illumina HiSeq platform. A total of 97,976 unigenes were obtained and annotated with seven public function protein databases. There were 22,779, 22,632, 16,700, and 36,233 differentially expressed genes (DEGs) identified in the four comparisons, respectively. A total of 77 DEGs associated with the sucrose metabolism and transporter were identified in this study. Among them, sucrose transporter protein (SUT) and sweet sugar transporter (SWEET) were predicted to participate in sucrose transport from seed coat to embryo, and invertase (INV) was identified to be involved in sucrose degradation. In addition, sucrose synthase (SUS) and sucrose phosphate synthase (SPS) related to sucrose synthesis were highly expressed in seeds with sucrose supply. Finally, nine differentially expressed genes were selected randomly to analyze their expression levels using qRT-PCR, which were consistent with the transcriptome sequencing results. Above all, these results and analyses provide valuable gene resources and directions for further studying the effects of sucrose supply on the molecular mechanism of the sucrose metabolism and transporter during the development of P. ostii seeds.
1. Introduction
Tree peony (Paeonia ostii), which belongs to the Paeoniaceae family, is a perennial woody flowering plant that is one of the most important ornamental and medical plants in China. It was endowed with the meaning of prosperity, wealth, and happiness and is praised as the ‘king of flowers’ for its beauty and huge flower [1,2]. The origin of Paeonia ostii is located in the city of Yangshan, China, and it has a long history of cultivation in China as early as the Sui Dynasty. The seeds of Paeonia ostii consist of three parts: endosperm, seed embryo, and seed coat, of which the endosperm is very rich in essential substance such as vitamins, protein, and unsaturated fatty acids [3]. Compared with other Chinese tree peony cultivars, Paeonia ostii has high seed setting rate (about 74%) and high oil yield (25–30%) [4]. What is more, P. ostii seed oil is rich in alpha linolenic acid with abundant nutritional valve and excellent healthcare functions. Therefore, P. ostii seed oil was approved as a new source of edible plant oil in China in 2011 [5].
Sugar metabolism plays an important role in seed development, which is closely related to the accumulation of stored resources. It can not only provide nutrients and energy for the growth and development of seeds, but it can also be used as a key developmental signal to regulate a series of physiological processes, such as cell division and expansion, the storage of nutrients, and seed maturation [6,7,8]. Exogenous sucrose has positive effects on the development and growth of plants. For example, spraying sucrose in tree peony under shading could increase the anthocyanin contents significantly and effectively improve the ornamental quality of tree peony under shade conditions [9]. During the initial flowering stage of alfalfa, spraying 10% sucrose solution on leaf surface resulted in a higher podding rate and seed yield than the control [10]. Endogenous sucrose, produced in green leaves, is the major long-distance transport form in which photosynthates are transported from source organs to sink tissues, including fruits, seeds, and roots [11]. Sucrose is conveyed through the phloem to the maternal seed coat and then released from the seed coat to the embryo [12]. During this process, enzymes such as sucrose transporter (SUT) [13,14], sucrose synthase (SUS) [15,16,17], sucrose phosphate synthase (SPS) [18], invertases (INVs) [19,20], and sweet sugar transporter (SWEET) [21,22] involved in the pathway of sucrose metabolism and transporter play a strong part. In Arabidopsis thaliana, the endosperm-specific sucrose transporter AtSUC5 played an important part in early seed development, especially during maturation of the embryo [23], and sugar transporters AtSWEET11, 12, and 15, expressed in particular tissues of the seeds during development, are the key to sucrose efflux from seed coat to embryo and are necessary for filial organs growth [24]. In addition, the study showed that sucrose synthase (SUS) might play different roles during the development of silique and seed of Arabidopsis thaliana, for example, functioning within the embryo and cotyledon in sucrose utilization [15]. Studies of developing maize and rice seeds suggested that SWEET4 was probably recruited during seed filling in order to improve sugar import into the endosperm [22]. Deletion of SlSWEET15 function significantly declined the size and weight of fruits, with defects in embryo development and seed filling in tomato, which indicating that SlSWEET15 is important for sucrose releasing from seed coat to the embryo [25]. During the early development of barley caryopses, cell-wall invertases HvCWIN1 and HvCWIN2 have significant effects on regulating sugar rates between maternal and filial tissues [26]. What is more, OsCWIN1, OsCWIN2, and OsCWIN7 also play a crucial role in sucrose allocation from the seed coat to the embryo and endosperm in rice [27].
Plant hormones such as auxin (IAA), gibberellins (GA), cytokinins, and abscisic acid (ABA) have significant physiological regulation functions at all stages of seed development, and the changes in their kinds and levels would influence the growth of seeds. Among them, the balance of abscisic acid and gibberellin has vital effects on embryonic development and seed germination [28]. Zeatin, a kind of cytokinin, can promote cell division and growth, and facilitate degradation of endosperm materials [29]. Although IAA by itself may not be important for seed germination, it is necessary for the growth of young seedlings and its interactions with gibberellins and ethylene may influence the processes of seed development [30].
With the development of high-throughput technologies, new genes have been mined and specific transcripts analyzed. Transcriptome sequencing is one of the indispensable means of analyzing gene sequence data to better understand the biological processes [31]. Among kinds of sequencing platforms accessible, RNA-Seq 2.0, such as the Illumina sequencing platform, is the most widely used platform due to its high data quality and low cost [32]. Thanks to the ease, efficiency, and accuracy of transcriptome sequencing, it has often been used for functional gene discovery, differentially expressed genes analysis, and biosynthetic pathway analysis. Nowadays, de novo transcriptome sequencing has been applied to the identification and profiling of DEGs in various species including peanut [33], wheat [34], rice [35], olive [36], soybean [37], Paeonia section Moutan DC. [38], Plukenetia volubilis L. [39], Cinnamomum camphora L. [40], and Tapiscia sinensis [41]. For example, 124 candidate unigenes were selected from Illumina sequencing database in soybean seeds at different developmental stages and identified as key genes responsible for lipid synthesis [37].
Here, we sprayed sucrose solution weekly on tree peony leaves to explore the effects of sucrose treatment on the soluble sugar and endogenous hormones contents of Paeonia ostii. In addition, the transcriptome sequencing technology was applied to identify and analyze the differentially expressed genes related to sucrose metabolism and transporter during the early development of Paeonia ostii seeds.
2. Materials and Methods
2.1. Plant Materials, Treatment, and Sample Preparation
In this study, tree peony (Paeonia ostii) was grown in the germplasm repository of the Horticulture and Plant Protection College, Yangzhou University, Jiangsu Province, P.R. China (32°23′314″ N, 119°24′50″ E). A total of 30 three-year-old plants free of disease or pests and with a similar growth vigor were randomly selected and divided into two groups (15 plants for each group). (1) Control group: all of the plants were sprayed with distilled water and then received routine maintenance. Data and sample collections were conducted in parallel with the treatment group. (2) Sucrose treatment group: when the leaves were fully unfolded, all of the upper and lower surfaces of plant leaves were sprayed with 50 g/L sucrose solution between 9:00 a.m. and 10 a.m. weekly until 50 days after flowering and received the same routine maintenance as the control group. The P. ostii seed samples of the control and the treatment group with a similar size and growth were randomly collected at 50 days after flowering (Figure S1). The seeds were separated into two parts: seed coat and endosperm by using a sterile blade under stereo microscope. After quick freezing in liquid nitrogen, they were stored at –80 °C for subsequently physiological and molecular experiments.
2.2. Measurement of Soluble Sugar, Glucose 6-Phosphate (G6P), and Trehalose 6-Phosphate (T6P) Contents
The contents of sucrose, glucose, and fructose of seed coats and endosperms at 50 DAF with and without sucrose treatment were extracted using Sucrose Content kit, Glucose Content kit, and Fructose Content kit (Sino Best Biological Technology Co., Ltd., Shanghai, China) and measured by spectrophotometer. For the sample preparation, the samples were ground to powder in liquid nitrogen, and exactly 0.2 g of a sample was added to 0.5 mL extracting solution. The mixture was put in a water bath at 80 °C for 10 min and then centrifuged at 4000× g for 10 min after cooling. The supernatant was extracted and decolorized for 30 min at 80 °C, and then added to 0.5 mL extracting solution. The solution was centrifuged at 4000× g for 10 min after cooling, and the final supernatant was used for determination.
The contents of G6P and T6P of seed coats and endosperms at 50 DAF with and without sucrose treatment were extracted using Plant Glucose 6-phosphate (G6P) ELISA kit and Plant Trehalose 6-phosphate (T6P) ELISA kit (Shanghai Qiao Du Biotechnology Co., Ltd., Shanghai, China) and measured by standard microplate reader (450 nm) based on manufacturer’s instruction manual.
2.3. Measurement of Zeatin, GA3, IAA, and ABA Contents
The contents of endogenous hormones (zeatin, GA3, IAA, and ABA) of seeds at 50 DAF with and without sucrose treatment were measured using High-Performance Liquid Chromatography (HPLC). Briefly, for the sample preparation, exactly 0.2 g of fresh sample was homogenized in 2 mL 80% methanol and incubated overnight at 4 °C. The solution was centrifuged at 5000× g, 4 °C for 10 min and the supernatant was extracted. The residue was continuously eluted twice in 80% methanol, and then the supernatants were combined and blown to water phase by nitrogen. The solution was decolorized thrice in 2 mL petroleum ether and extracted thrice in ethyl acetate and dried by nitrogen. Then, the supernatant was purified through C18 column (100 × 2.1 mm, 3 μm) and eluted in methanol. Finally, the eluent was collected and passed through a 0.22 μL filter membrane and waited for measurement.
2.4. RNA Extraction, cDNA Library Construction and Sequencing
Total RNA was separately extracted from seed coats and endosperms with and without sucrose at 50 DAF using the CTAB method and Mini BEST RNA Extraction Kit (TaKaRa, Tokyo, Japan), and the concentrations of all RNA samples were checked through Nanodrop 2000C (Thermo Scientific, Waltham, MA, USA). The cDNA library was constructed according to the Illumina manufacturer’s instructions. Briefly, mRNA was purified using Oligo (dT) magnetic beads, and then interruption reagent was added to obtain short mRNA fragments. The first-strand cDNA was synthesized by using these short fragments as templates, and the second-strand cDNA was synthesized subsequently. These cDNA fragments were purified, and the sticky end was repaired by adding with a base ‘A’ at the 3′ end of the cDNA. Then, the PCR reaction system was prepared, and amplification was performed. The insert segment scope of the constructed cDNA library was detected by Agilent 2100 Bioanalyzer, and the quality of the cDNA library was identified by ABI StepOnePlus Real-Time PCR System (TaqMan Probe). Finally, the RNA was sequenced after qualification using the Illumina HiSeq platform.
2.5. Sequencing Data Filtering and Assembly
The filtering software SOAPnuke (v1.4.0, BGI Inc., Shenzhen, China) and trimmomatic (v0.36, Anshan Biology Inc., Tianjin, China) were used to analyze and filter the raw data. After removing repetitions to obtain clean reads, Trinity (v2.0.6, GitHub Inc., San Francisco, CA, USA) software (https://github.com/trinityrnaseq/trinityrnaseq/wiki) (accessed on 24 September 2019) was used for de novo assembly of clean reads. Tgicl was used to cluster the assembled transcript and clear the redundant data to obtain Unigene. Bowtie2 (v2.2.5, Baltimore, MD, USA) was applied to compare the clean reads acquired after sequencing and filtering with the whole genome sequence. Then, RSEM (v1.2.8, Madison, WI, USA) [42] was used to calculated the expressive abundance of the transcript.
2.6. Functional Annotation and Classification
All unigenes were annotated via seven functional databases, including Kyoto Encyclopedia of Genes and Genomes (KEGG), Gene Ontology (GO), non-redundant protein database (NR), non-redundant nucleic acid sequence database (NT), Swiss-Prot protein sequence database (Swiss-Prot), Protein Families database (Pfam), and EuKaryotic Orthologous Groups (KOG). Blastn was used to annotate unigenes in NT, while Blastx annotated unigenes in NR, KOG, KEGG, and Swiss-Prot. Moreover, GO was annotated by Blast2GO and NR, and InterPro was annotated by InterProScan5.
2.7. Analysis of Differentially Expressed Genes (DEGs)
The DESeq package method was used to identify the differentially expressed genes [43]. RPKM (reads per kilo bases per million mapped reads) were used as the value of normalized gene expression levels. p values were adjusted to account for multiple tests using the false discovery rate (FDR). Genes with a threshold of FDR ≤ 0.001 and an absolute value of log2 (fold change) ≥ 1.0 were regarded as significantly differentially expressed. Among them, log2 (FPKM of treatment group/control group) > 0 indicates that the gene expression level of the treatment group is upregulated compared with the control group, while log2 < 0 indicates downregulation. According to the testing results of DEGs, hierarchical clustering analysis was conducted by the pheatmap function in R software. Gene Ontology analysis was performed to classify the functions of the annotated DEGs. KEGG enrichment analysis was performed to compared this with the whole transcriptome background to search for biological pathways. Meanwhile, the hyper function was applied to enrichment pathway analysis. Then, p value was calculated, and the FDR ≤ 0.05 was usually determined as significant enrichment.
2.8. Validation of Gene Expression by Quantitative Real-Time PCR
To verify the reliability of the transcriptome sequencing database by Illumina platform, qRT-PCR was performed on nine random genes related to sugar metabolism and transporters. Total RNA from Paeonia ostii seeds of control and sucrose treatment was extracted by a Mini BEST Plant RNA Extraction Kit (TaKaRa, Tokyo, Japan). The first-strand cDNA was synthesized by PrimeScript RT reagent Kit With gDNA Eraser (TaKaRa, Tokyo, Japan) [44] to analyze expression levels with a BIO-RAD CFX Connect Optics Module (Bio-Rad, Des Plaines, IL, USA). The reaction system of qRT-PCR (25 μL total volume) contained 12.5 μL SYBR Premix Ex Taq (2×), 2 μL cDNA solution, 1 μL PCR Forward Primer, 1 μL PCR Reverse Primer, and 8.5 μL ddH2O. The amplification conditions are as follows: 1 cycle of 95 °C for 30 s; 40 cycles of 95 °C for 5 s, 55 °C for 30 s, 72 °C for 30 s, and 1 cycle of 72 °C for 10 min. The 2−ΔΔCt comparative threshold cycle (Ct) method was referred to calculate their values. The ACTIN gene was selected as a reference gene. Each sample was repeated three times. All used primers were designed using the Primer Premier 5.0 program and are listed in Table S1.
2.9. Statistical Analysis
SPSS (IBM SPSS Statistics 26, SPSS Inc., Chicago, IL, USA) was used for statistical analysis included Student’s t-test and one-way analysis of variance. Comparison of the means was calculated according to the Tukey-HSD test using SPSS. GraphPad Prism 8 (GraphPad Inc., San Diego, CA, USA) was used for data visualization.
3. Results
3.1. Effect of Sucrose Treatment on the Soluble Sugar, G6P, and T6P Contents in Seed Coat and Endosperm of P. ostii
During the development of seeds, soluble sugar, as the main respiratory substrate, is an important source of nutrients and energy for seed development. At the same time, it is closely related to the fatty acid synthesis and oil accumulation in oil seeds [45]. Here, to better seek the effect of sucrose supply on the sugar signaling pathway in P. ostii seeds, we measured the contents of soluble sugar, G6P and T6P in seed coat and endosperm with sucrose treatment at 50 days after flowering. The results indicated that the soluble content in endosperm was higher than that in seed coat. Moreover, compared with the control group, the sucrose contents increased significantly both in seed coat and endosperm (Figure 1A). The changes in glucose and fructose contents enhanced slightly in seed coat, while it showed no significant changes in endosperm (Figure 1B,C). G6P and T6P are important indicators of sugar signaling. The trend of G6P content in the seed coat was similar to fructose, being slightly greater than the control (Figure 1D). On the contrary, the T6P content in seed coat was higher than that in endosperm in both two groups. In addition, the content of T6P in seed coat was decreased significantly after spraying with sucrose solution (Figure 1E).
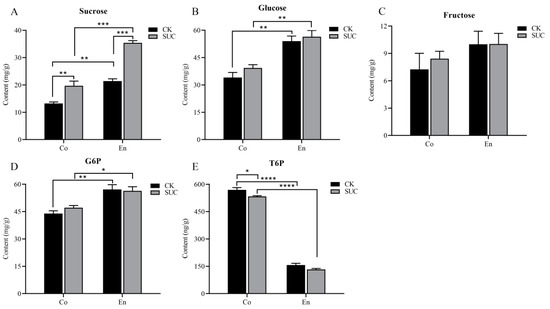
Figure 1.
Effect of sucrose treatment on the contents of (A) sucrose, (B) glucose, (C) fructose, (D) G6P, and (E) T6P in seed coat (Co) and endosperm (En) of P. ostii at 50 days after flowering. The black bar represents the control group, while the grey bar represents the sucrose-treated group. Each value represents the mean ± SD of three replicates (n = 3). Asterisks indicate significant differences between the sucrose treatment group and the controls: * p < 0.05; ** p < 0.01; *** p < 0.001; **** p < 0.0001 (one-way ANOVA).
3.2. Effect of Sucrose Treatment on the Endogenous Hormone Contents in Endosperm of P. ostii
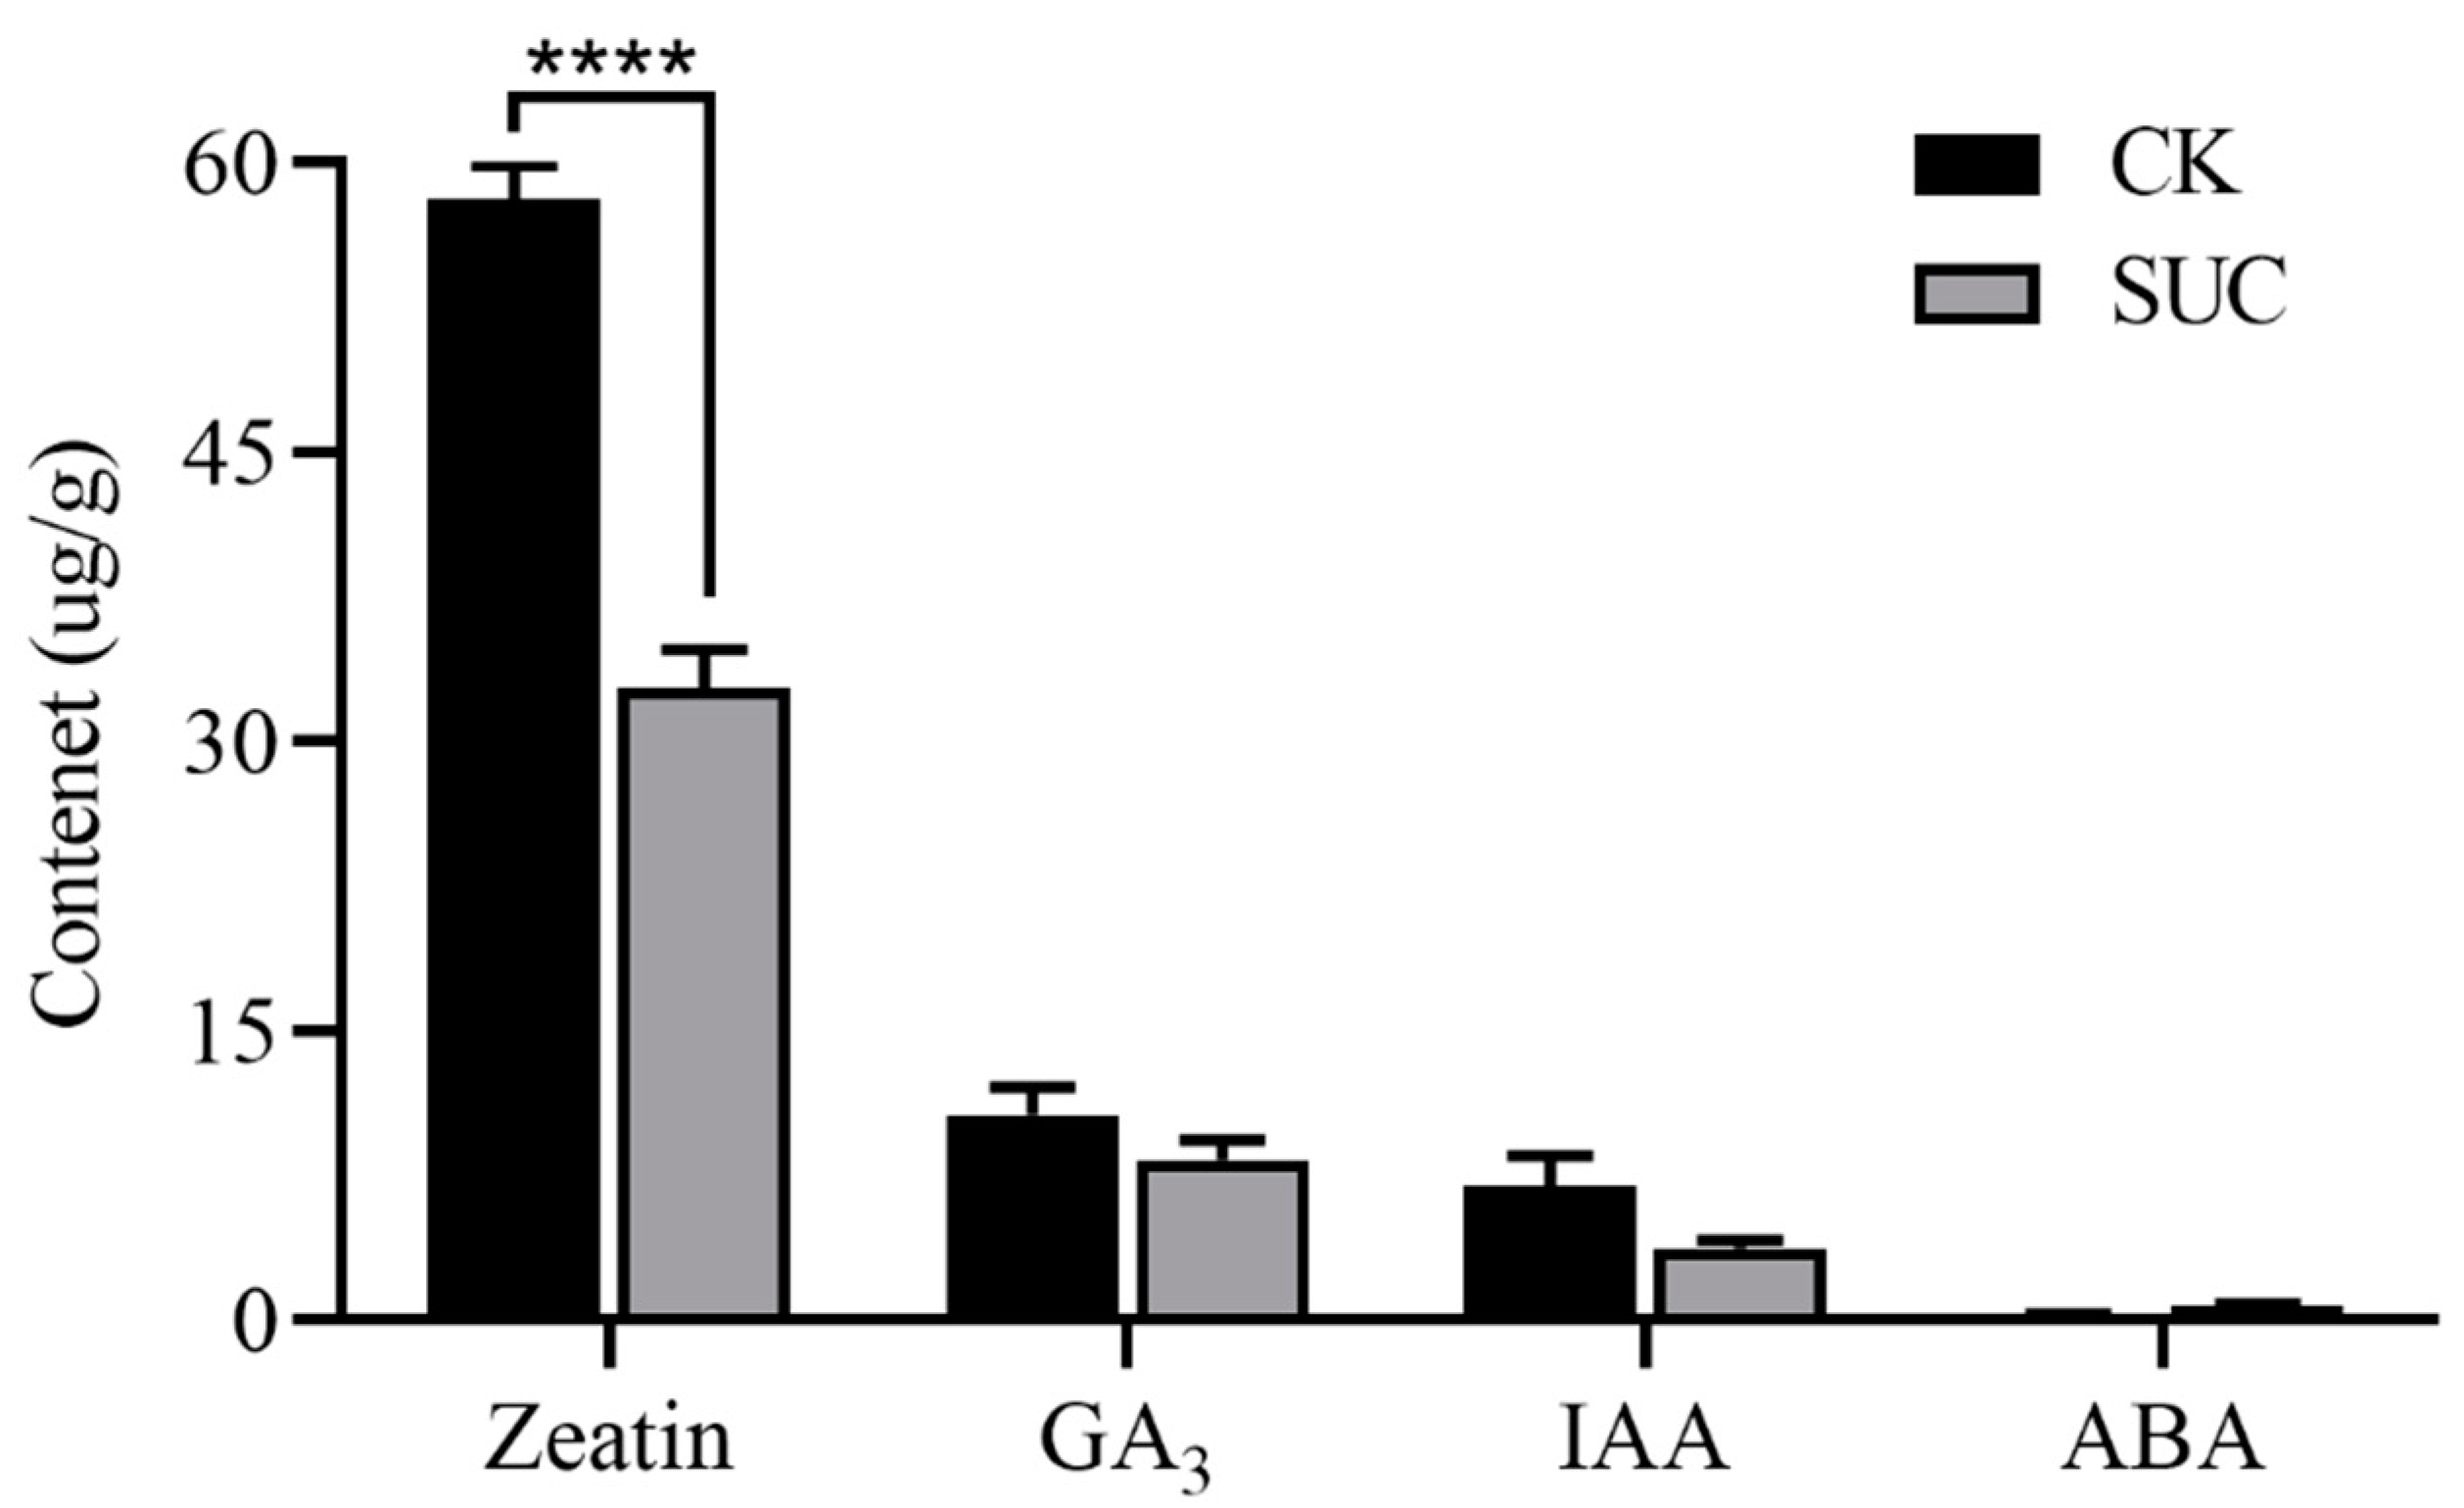
Endogenous hormones have important physiological regulation functions at all stages of seed development, and the balance of hormones has vital effects on embryonic development and seed germination, especially the balance of abscisic acid (ABA) and gibberellin (GA) [28]. We determined the contents of zeatin, GA3, IAA, and ABA, among which zeatin was the most abundant constituent both in the control and the sucrose treatment group. Compared to the control, the zeatin content in the sucrose treatment groups was noticeably decreased in seeds (Figure 2). The contents of GA3 and IAA declined slightly compared to the control, whereas the ABA content retained in the sucrose treatment group.

Figure 2.
Effects of sucrose treatment on the contents of zeatin, GA3, IAA, and ABA in endosperm of P. ostii. The black bar represents the control group, while the grey bar represents sucrose-treated group. Each value represents the mean ± SD of three replicates (n = 3). Asterisks indicate significant differences between the sucrose treatment group and the controls: **** p < 0.0001 (t-test).
3.3. Transcriptome Sequencing Results and Quality Assessment
In order to explore the effect of sucrose treatment on the development P. ostii seeds, we separated the seed coat and endosperm at 50 days after flowering and treated it with sucrose. Then, nine cDNA libraries constituting three biological repeats were constructed by collecting samples from P. ostii seed coats and endosperm. Finally, a total of 212.9 Gb transcriptome databases of P. ostii seeds was acquired by using the Illumina HiSeq platform, and the data can be accessed in the National Center for Biotechnology Information (NCBI) under accession number PRJNA648679.
After removing joint pollution, the high content of unknown base N, and the excessive and low-quality data, data analysis was performed to ensure the accuracy and reliability of sequencing results. The quality statistics of clean reads after filtering were shown in Table S2. The results indicated that the proportion of reads after filtering was higher than 93.41%, and the percentage of Q20 (%) was above 98.27%, while the ratio of low-quality bases was lower. On the whole, these outcomes pointed out that the sequencing quality was responsible.
The clean reads were assembled by Trinity and then using Tgicl to cluster transcripts and remove redundancy. As a result, a total of 98,344 unigenes were obtained. The mean length, N50, and GC (%) contents were 852 bp, 1256 bp, and 42.42%, respectively. Table S3 shows the quality metrics of P. ostii seeds unigenes after clustering. The length distribution of uinigenes illustrated that contigs ranging from 200 to 300 bp were dominant among different sizes of contigs (Figure S2).
3.4. Gene Functional Annotation
The assembled unigenes were annotated using seven function protein databases (KEGG, GO, NR, NT, Swiss-Prot, Pfam, and KOG) to explore the function information. Among them, 45,517 unigenes (47.92%) were annotated by NR databases: 39,239 (41.31%) were matched to NT; 33,761 (35.55%) could be annotated in Swiss-Prot; 35,580 (37.46%) were aligned to KEGG; and 35,638 (37.52%) were annotated in KOG. In addition, 33,236 (34.99%) of the unigenes could be annotated by Pfam, and 34,552 (36.38%) were annotated in GO (Table S4). In conclusion, there were 17,075 unigenes (17.98%) that could be found in all databases, and about 53,802 (56.65%) were annotated by at least one database. The Venn diagram of unigenes annotated by KEGG, GO, NR, NT, and Swiss-Prot is displayed in Figure S3A.
Depending on the results of NR functional annotation, the proportion of unigene annotation in different species was calculated. As shown in Figure S3B, the unigenes of P. ostii shared the highest homology with Vitis vinifera (23.63%), followed by Quercus suber (6.87%), Actinidia chinensis var. chinensis (4.46%), Juglans regia (4.07%), and Nelumbo nucifera (3.27%).
The KOG (clusters of eukaryotic Orthologous Groups) database was used to explore the specific functions of P. ostii unigenes, and a total of 35,638 unigenes were successfully matched to KOG, which could be divided into 25 functional classifications. Among them, the category ‘General function prediction only’ was the biggest, accounting for 21.74%, followed closely by ‘Signal transduction mechanisms’ (10.29%), while ‘Lipid transport and metabolism’ (3.33%) shared a relatively small proportion (Figure S3C).
3.5. Analysis of Differentially Expressed Genes (DEGs) in P. ostii Seed Coat and Endosperm
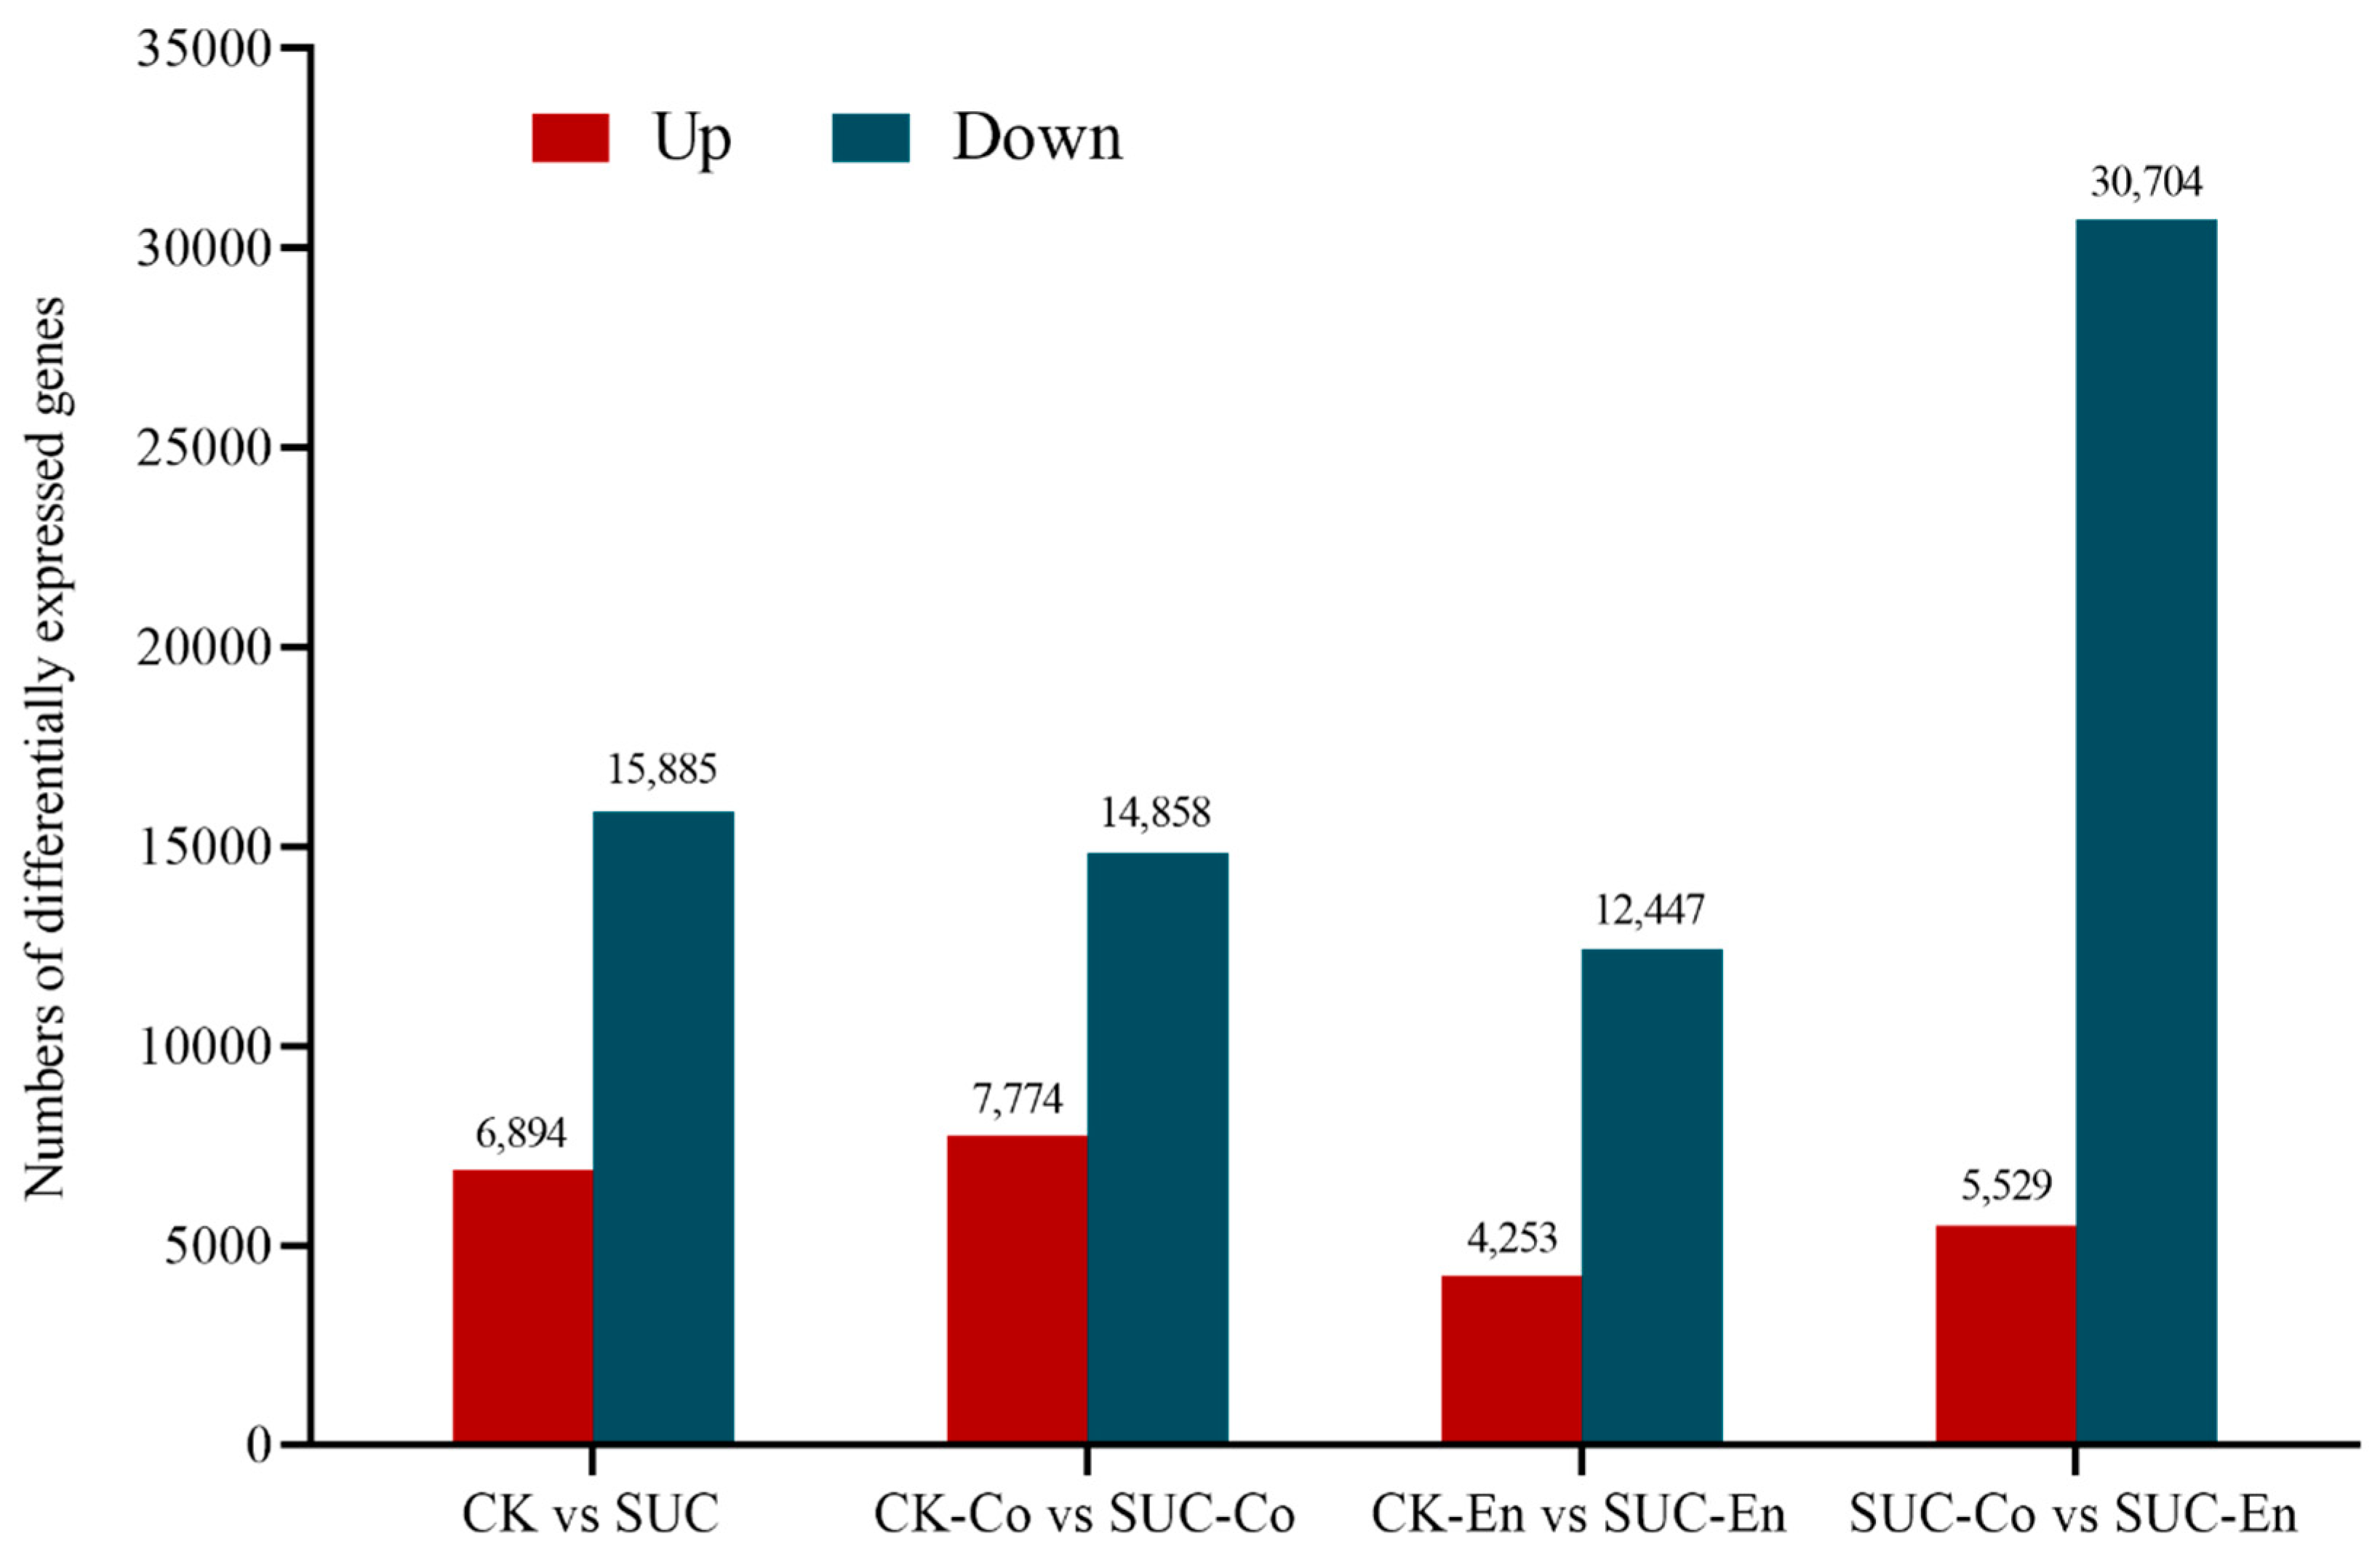
In transcriptome sequencing analysis, FPKM (number of transcription fragments per kilogram of sequenced reads per million) was often used to measure gene expression level. According to the transcriptome databases of P. ostii seed coat and endosperm at 50 days after flowering between the control group and the sucrose treatment group, the FPKM values of unigenes were compared between any two examples to screen the differentially expressed genes related to sucrose transport. The number of significantly differentially expressed genes is shown in Figure 3. Among them, comparing CK-Co with SUC-Co, there were 22,632 DEGs, including 7774 upregulated unigenes and 14,858 downregulated unigenes. Comparing CK-En to SUC-En, a total of 16,700 DEGs were obtained, encompassing 4253 upregulated unigenes and 12,447 downregulated unigenes. In SUC-Co vs. SUC-En, there were 5529 upregulated unigenes and 30,704 downregulated unigenes.

Figure 3.
Statistics of the number of differentially expressed genes in four groups. The dark red represents upregulated genes, while the dark blue represents downregulated genes. CK, seed as the control; SUC, seed with sucrose treatment; CK-Co, seed coat as the control; SUC-Co, seed coat with sucrose treatment; CK-En, endosperm as the control; SUC-En, endosperm with sucrose treatment.
3.6. GO and KEGG Pathway Analysis of DEGs
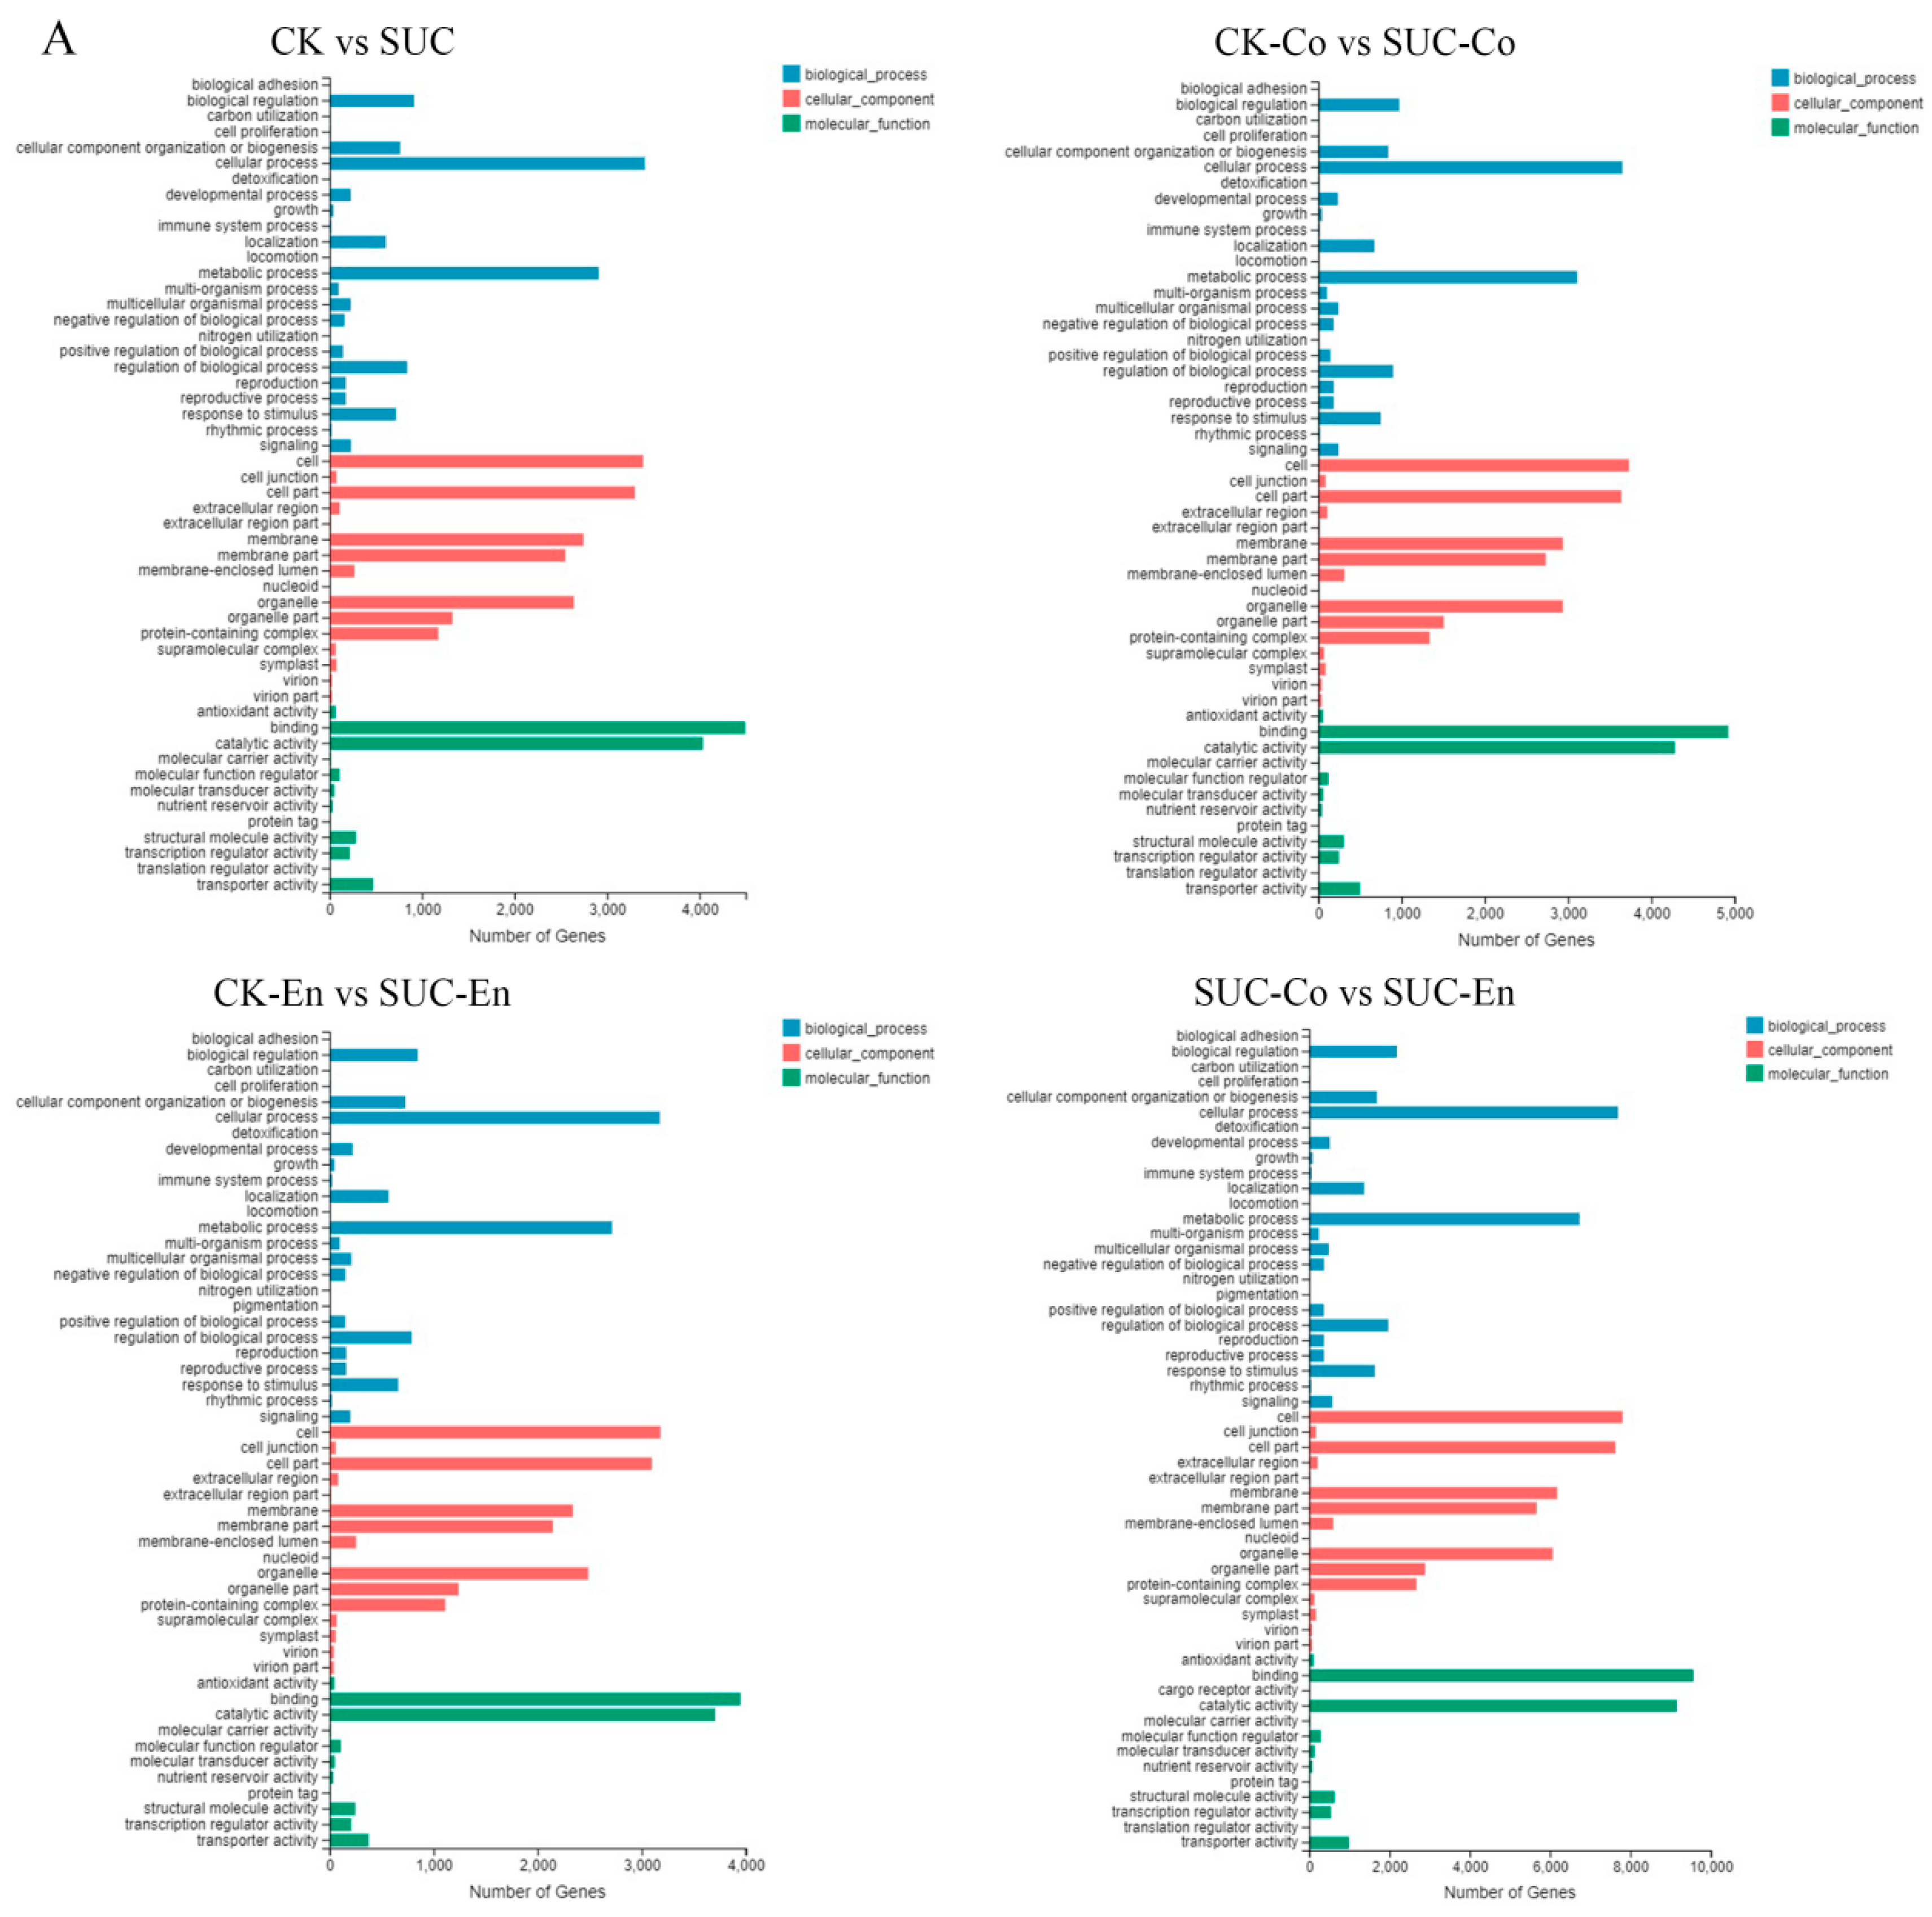
GO analysis was used to classify the functions of the annotated DEGs with sucrose treatment. According to the GO classification, all DEGs were divided into three functional categories: molecular function, cellular component, and biological process, with 54 functional groups in total. As is shown in Figure 4A, in the CK vs. SUC group, a total of 39,345 unigenes were annotated, of which ‘Binding’ and ‘Catalytic activity’ were the two subclasses with the highest proportion, including 4496 and 4039 unigenes, respectively. Comparing CK-Co with SUC-Co, there were 42,671 unigenes annotated. Among them, in the classification of molecular function, cellular components, and biological process, the subclasses of ‘Binding’, ‘Cell’, and ‘Cellular process’ occupied the majority, involving 4924, 3733, and 3654 unigenes, respectively. The results of GO annotation of the remaining two groups were similar to the CK-Co vs. SUC-Co group.
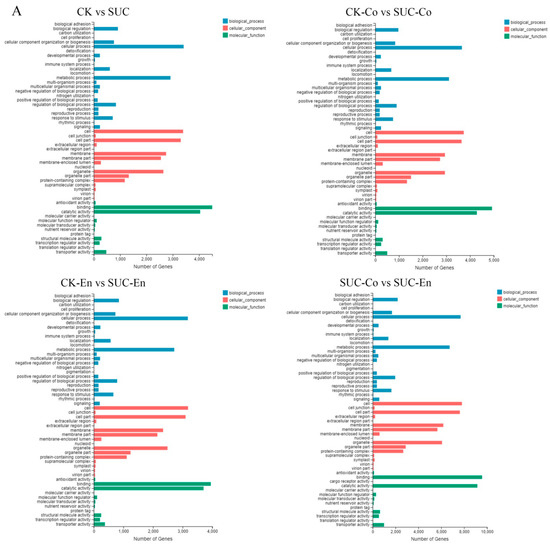
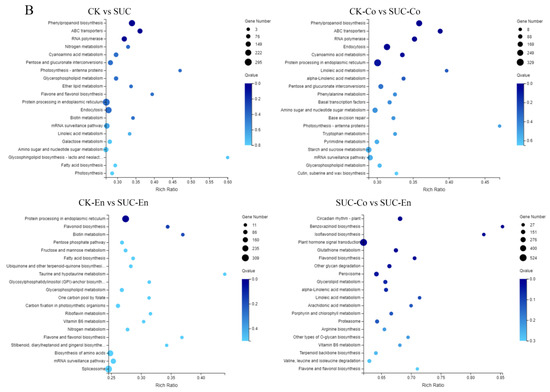
Figure 4.
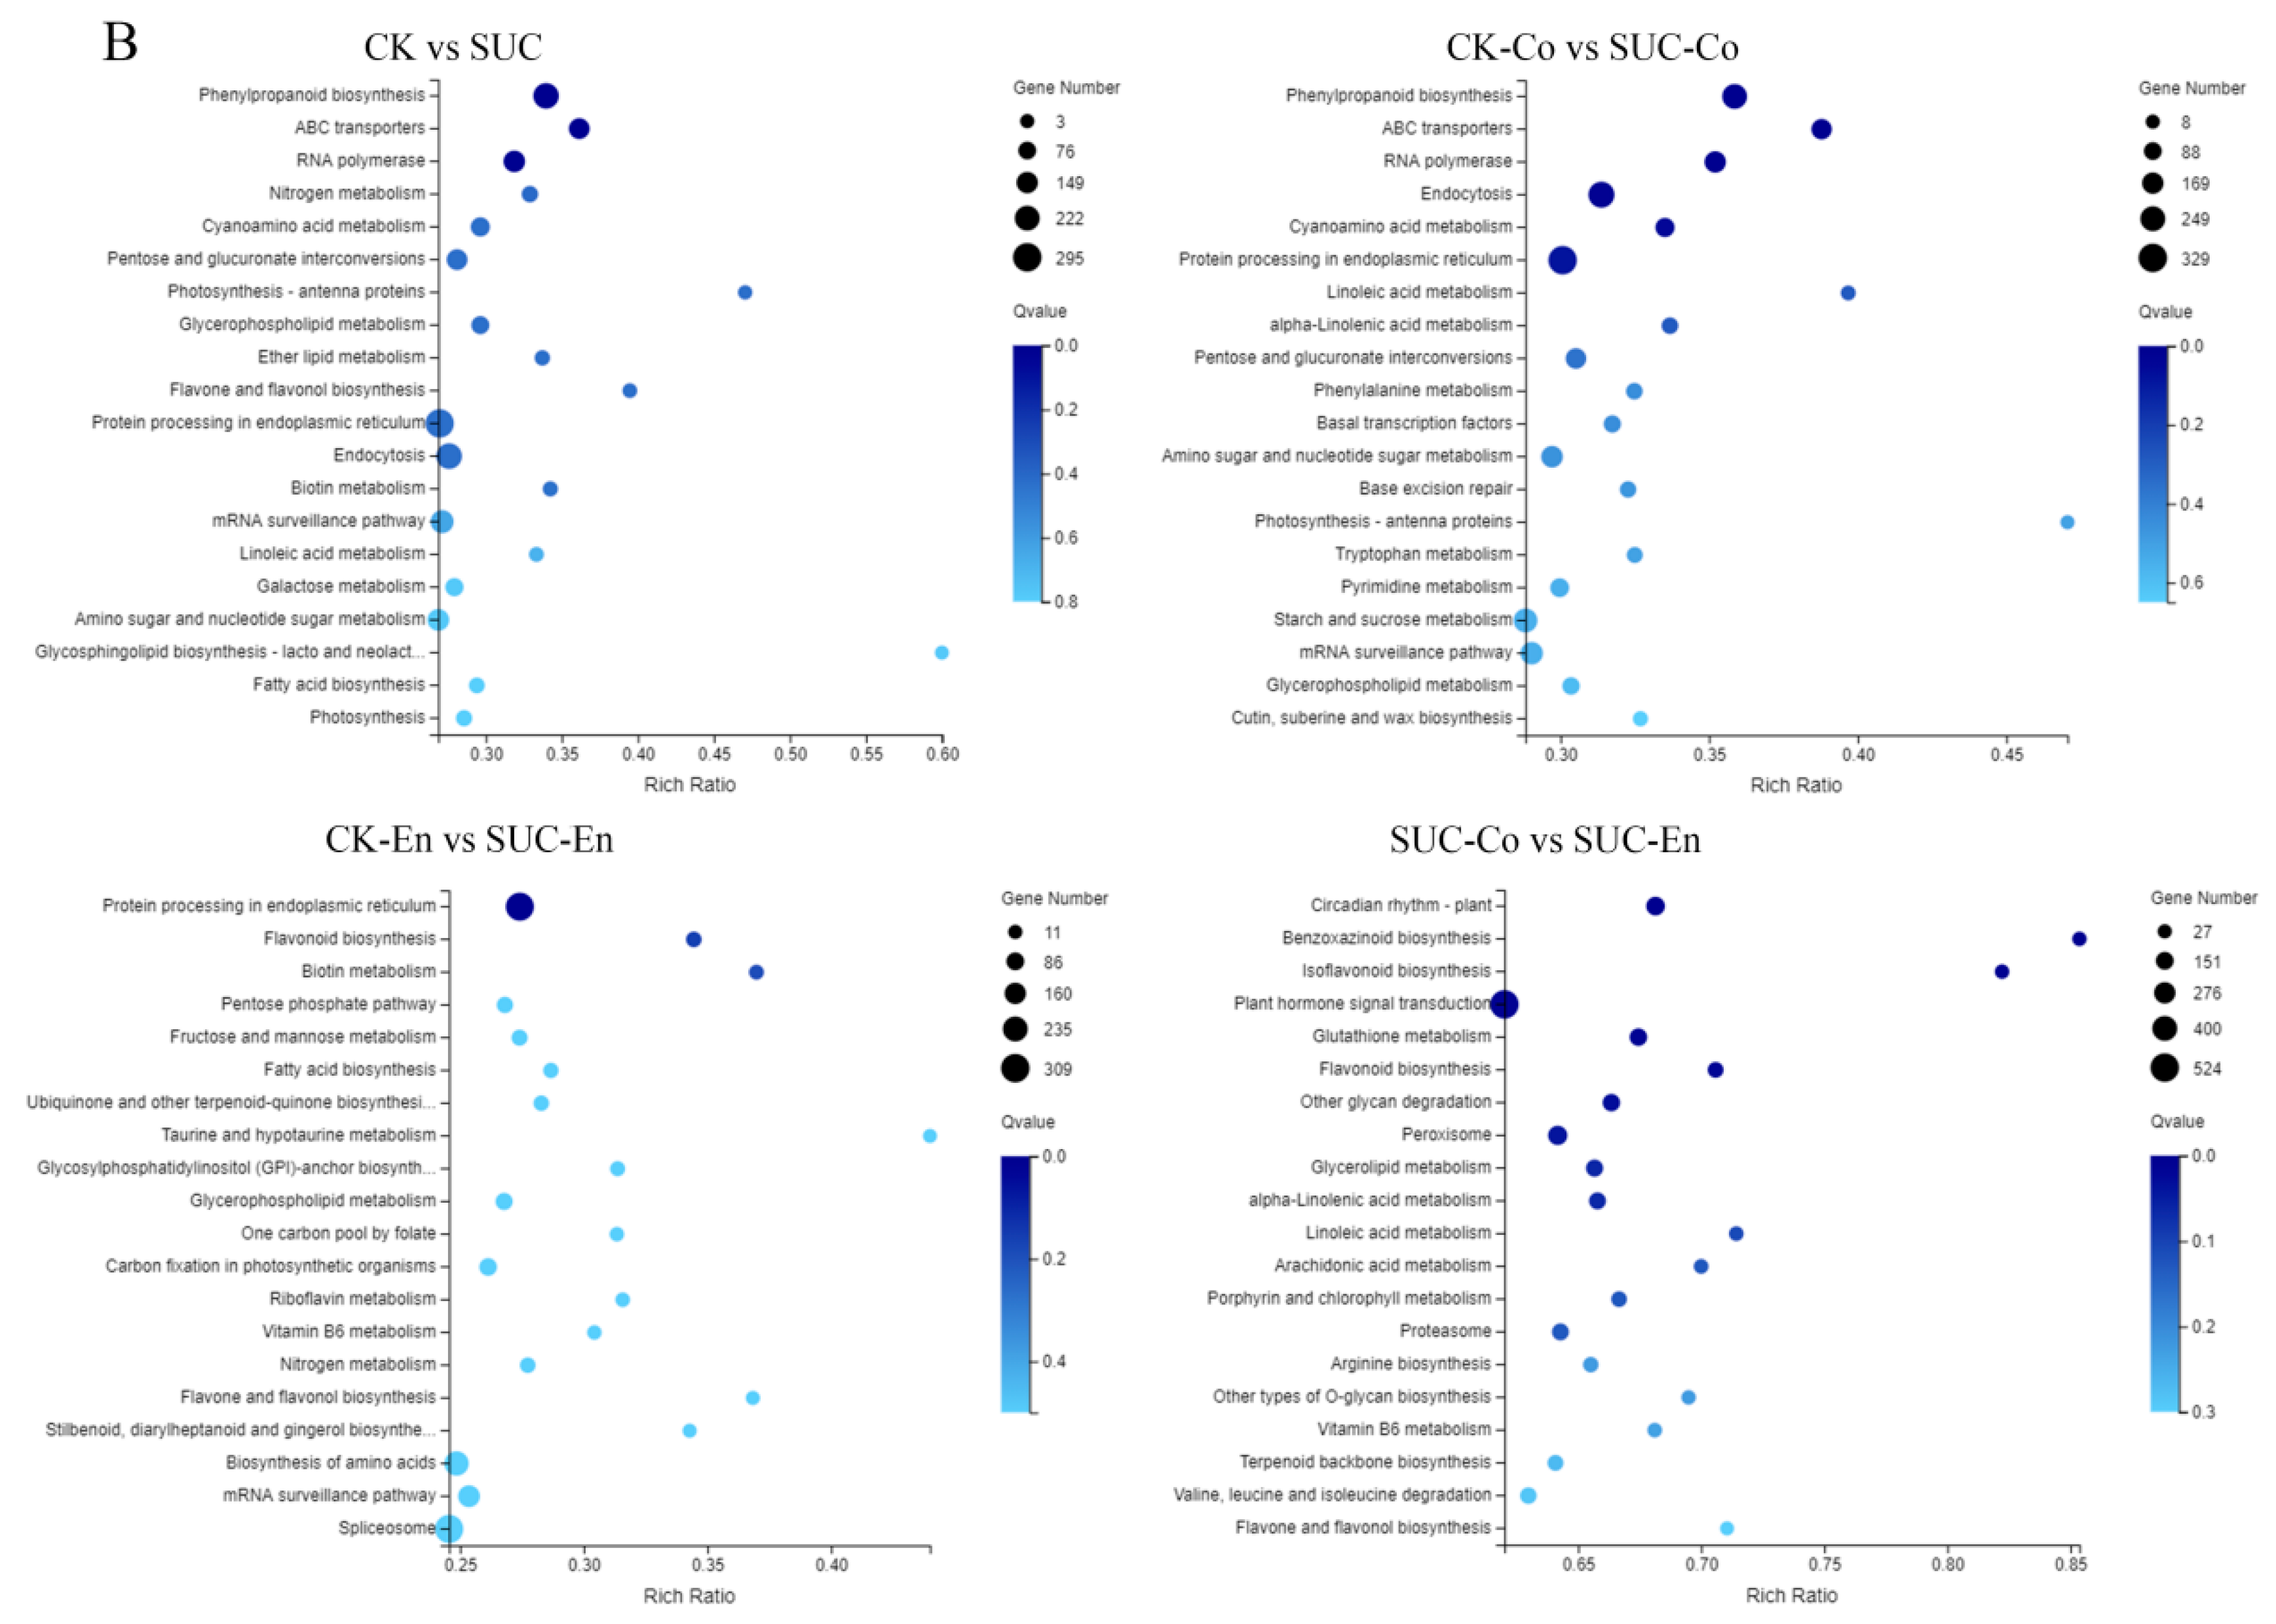
GO and KEGG Pathway analysis of DEGs. (A) Functional distribution of DEGs annotated GO. The x-axis represents the number of genes annotated GO, and the y-axis stands for the functional distribution of GO. (B) Bubble Diagram of enrichment of DEGs KEGG pathway. The x-axis is enrichment ratio, the y-axis is KEGG Pathway, the bubble size indicates the number of genes annotated on one KEGG pathway, the color represents enrichment Q-value, and darker color represents smaller Q-value. CK, seed as the control; SUC, seed with sucrose treatment; CK-Co, seed coat as the control; SUC-Co, seed coat with sucrose treatment; CK-En, endosperm as the control; SUC-En, endosperm with sucrose treatment.
To further explore the functions of the DEGs, we mapped the genes to terms in the KEGG database and compared this with the whole transcriptome background to search for biological pathways in which genes were significantly enriched. It was found that the metabolic pathways of P. ostii involved mainly five categories: ‘Cellular Processes’, ‘Environmental Information Processing’, ‘Genetic Information Processing’, ‘Metabolism’, and ‘Organismal Systems’. The five pathways could be further divided into 19 subclasses, of which the two groups with the largest number of unigenes were ‘Global and overview map’ and ‘Carbohydrate metabolism’. After the DEGs in CK vs. SUC, CK-Co vs. SUC-Co, CK-En vs. SUC-En, and SUC-Co vs. SUC-En were matched to the KEGG database for enrichment analysis, the top 20 metabolic pathways with the smallest Q-values were illustrated in Figure 4B. The DEGs in CK-Co vs. SUC-Co were enriched in 134 metabolic pathways, among which the number of DEGs in the ‘Protein processing in endoplasmic reticulum’, ‘Endocytosis’, ‘Phenylpropanoid biosynthesis’, and ‘starch and sucrose metabolism’ pathways was relatively large, namely, 329, 273, 246, and 228 DEGs, respectively. Pathway enrichment analysis also disclosed that the annotated changes between CK-En and SUC-En were matched to 132 pathways, and were mostly involved in ‘Protein processing in endoplasmic reticulum’, whereas the annotated changes between CK and SUC were matched to 132 pathways and mainly participated in ‘Phenylpropanoid biosynthesis’, ‘ABC transporters’, and ‘RNA polymerase’.
3.7. Expression Profiles Analysis of Key DEGs Related to Sucrose Metabolism and Transporter in P. ostii Seeds with Sucrose Treatment
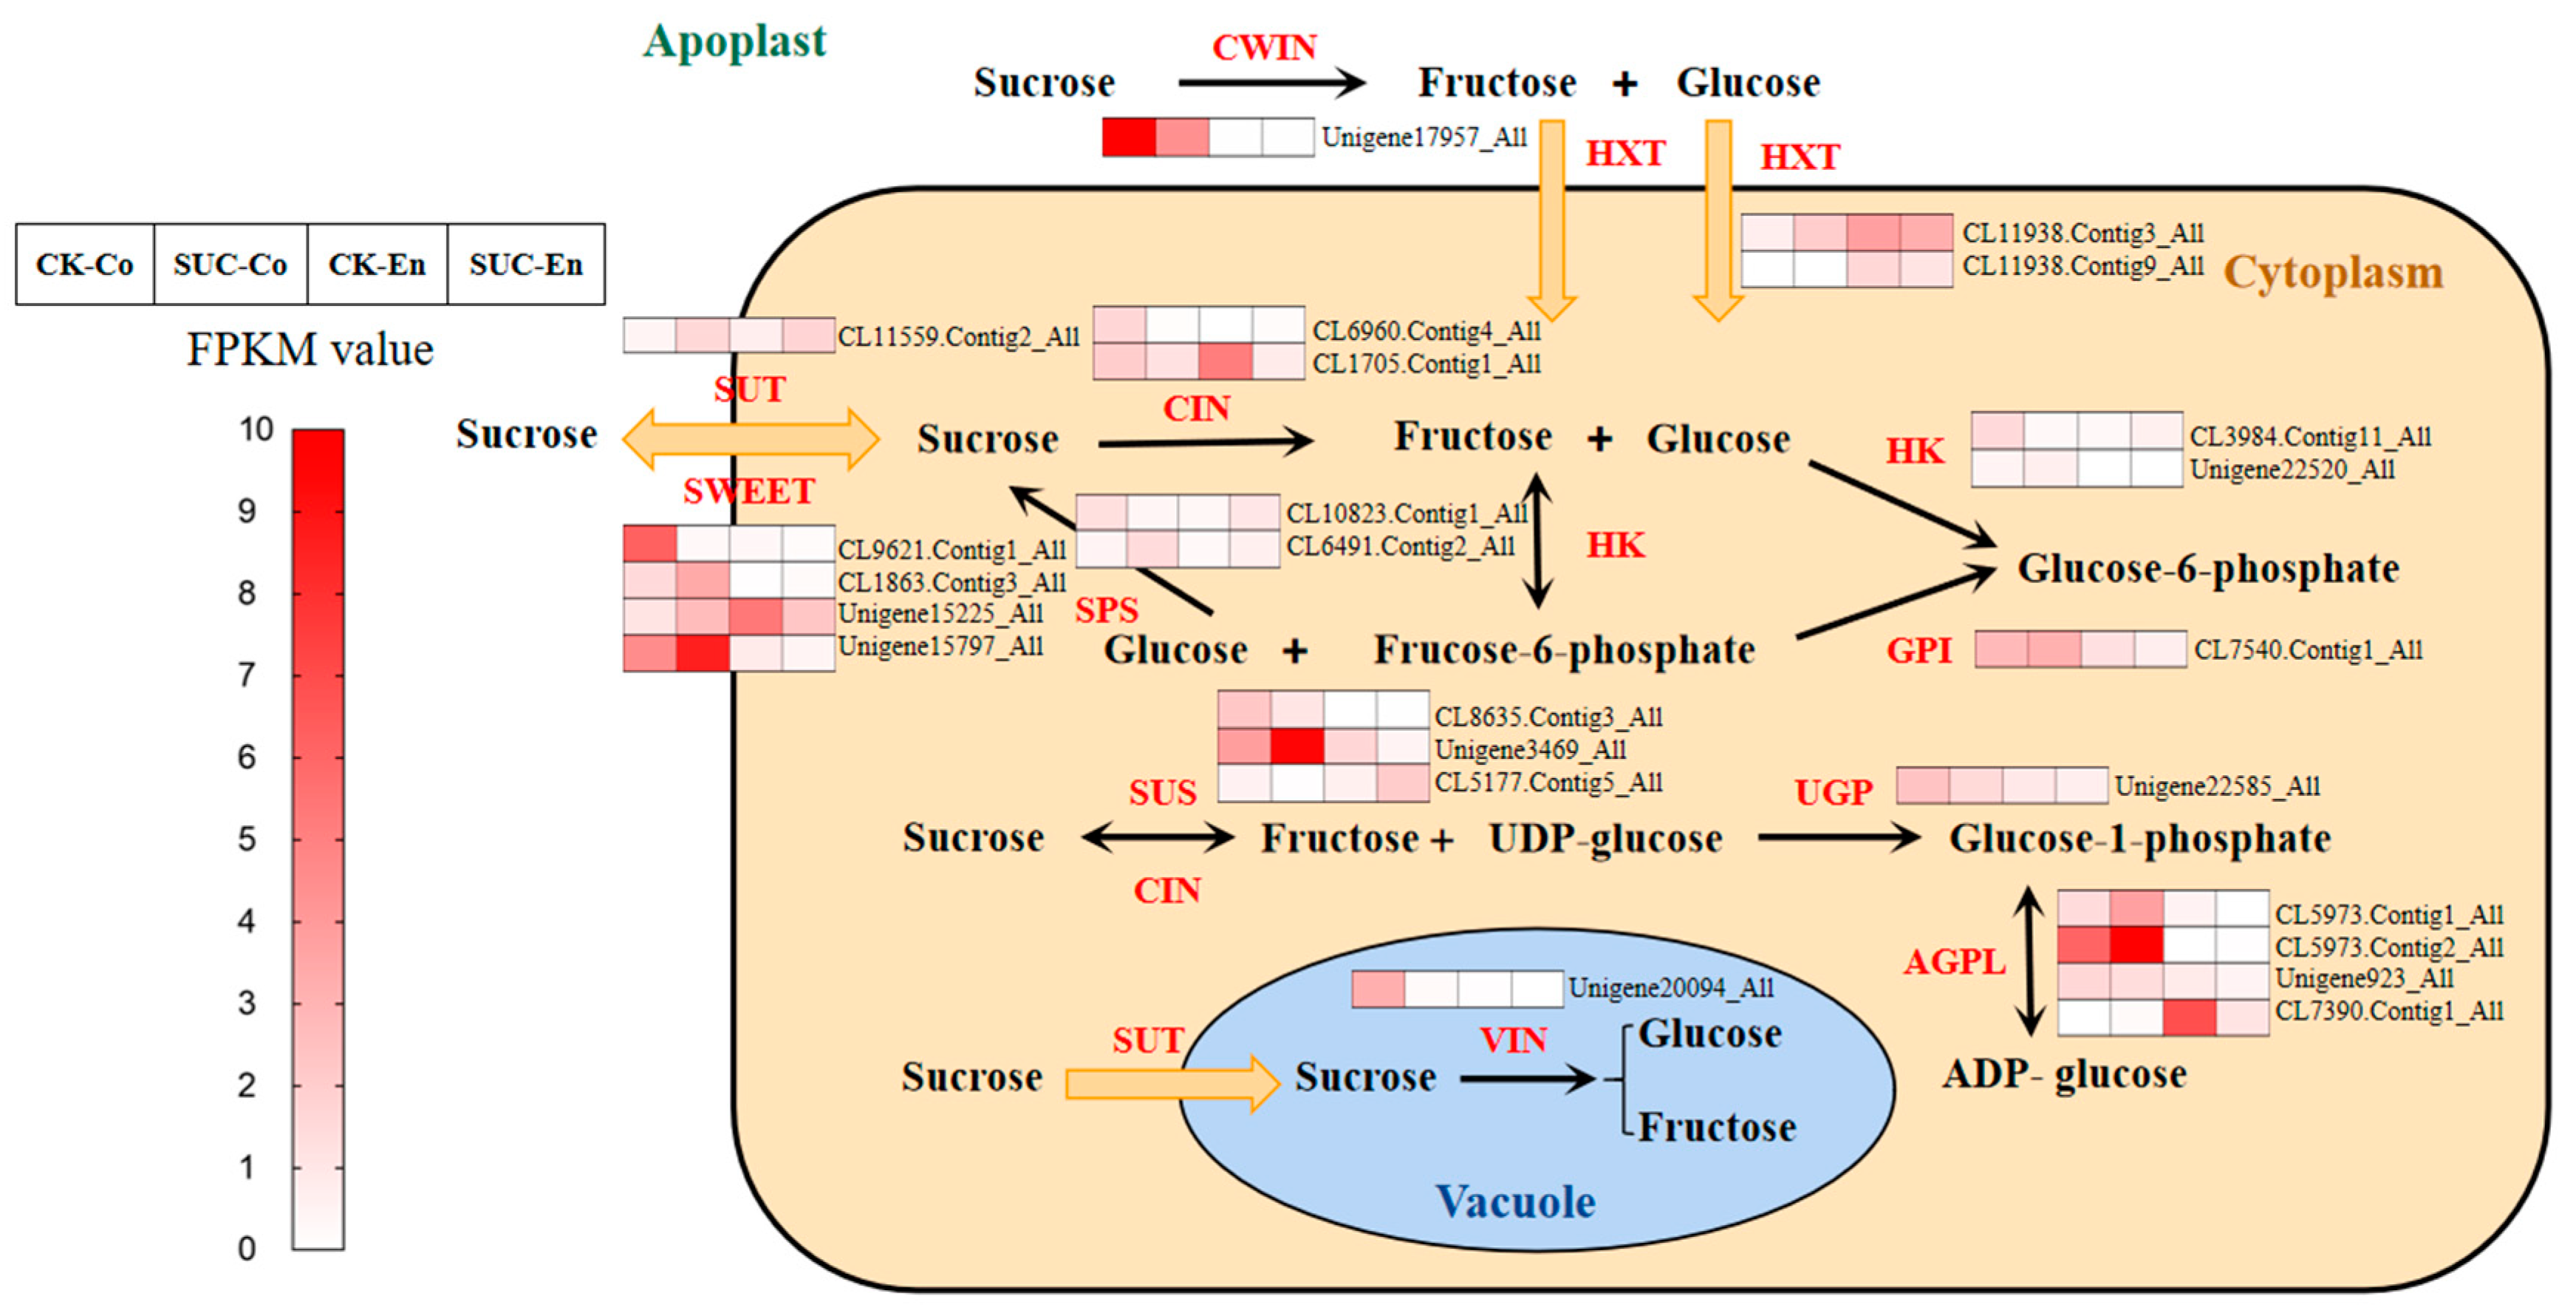
To explore the molecular mechanism of sucrose efflux from seed coat to embryo and the effects of exogenous sucrose on the sucrose metabolism and transporter during the development of P. ostii seed, most genes were analyzed according to FPKM of transcriptome sequencing. The KEGG pathway results revealed that the pathway of ‘starch and sucrose metabolism’ was enriched and significant in CK-Co vs. SUC-Co. DEGs found in the transcriptome sequencing database in the starch and sucrose metabolism pathway, especially involving in the sucrose metabolism and transporter, are shown in Table 1 and Table S5. Among them, genes encoding the sweet sugar transporter and sucrose synthase were annotated at most. During the early development of seeds, sucrose transporters play an important role in sucrose efflux from seed coat to endosperm [27]; SUSs are intimately involved in the maturation of the embryo [26]; INVs may play regulatory roles by controlling sequential and embryo cell proliferation [46]. As shown in Figure 5, compared the control group with sucrose treatment group, the genes encoding sugar transporter proteins including SUT, SWEETs, and HXTs were significantly upregulated during the early development of P. ostii seed coat at 50 DAF. At the same time, the expression level of genes involving sucrose synthesis such as SUSs and SPSs also increased remarkably in seeds. However, genes related to sucrose breakdown including CWIN, CIN, and VIN were highly downregulated in seeds with sucrose treatment. These results indicated that exogenous sucrose supply may help sucrose transport from seed coat to embryo and further facilitate the growth of filial organs.

Table 1.
Analysis of main DEGs related to sucrose metabolism and transporter in P. ostii transcriptome.

Figure 5.
Heat maps of the expression genes involved sucrose metabolism and transporter pathway during the development of P. ostii seed at 50 days after flowering with and without sucrose treatment. SUT, sucrose transporter; SWEET, sweet sugar transporter; HXT, hexose transporter; SUS, sucrose synthase; SPS, sucrose phosphate synthase; CWIN, cell wall invertase; CIN, chloroplast invertase; VIN, vacuolar invertase; HK, hexokinase; GPI, glucose-6-phosphate isomerase; UGP, UTP-glucose-1-phosphate uridylyltransferase; AGPL, glucose-1-phosphate adenylyltransferase. The red from light to dark represents the expression level from low to high. CK-Co, seed coat as the control; SUC-Co, seed coat with sucrose treatment; CK-En, endosperm as the control; SUC-En, endosperm with sucrose treatment.
3.8. Validation of Candidate DEGs by qRT-PCR
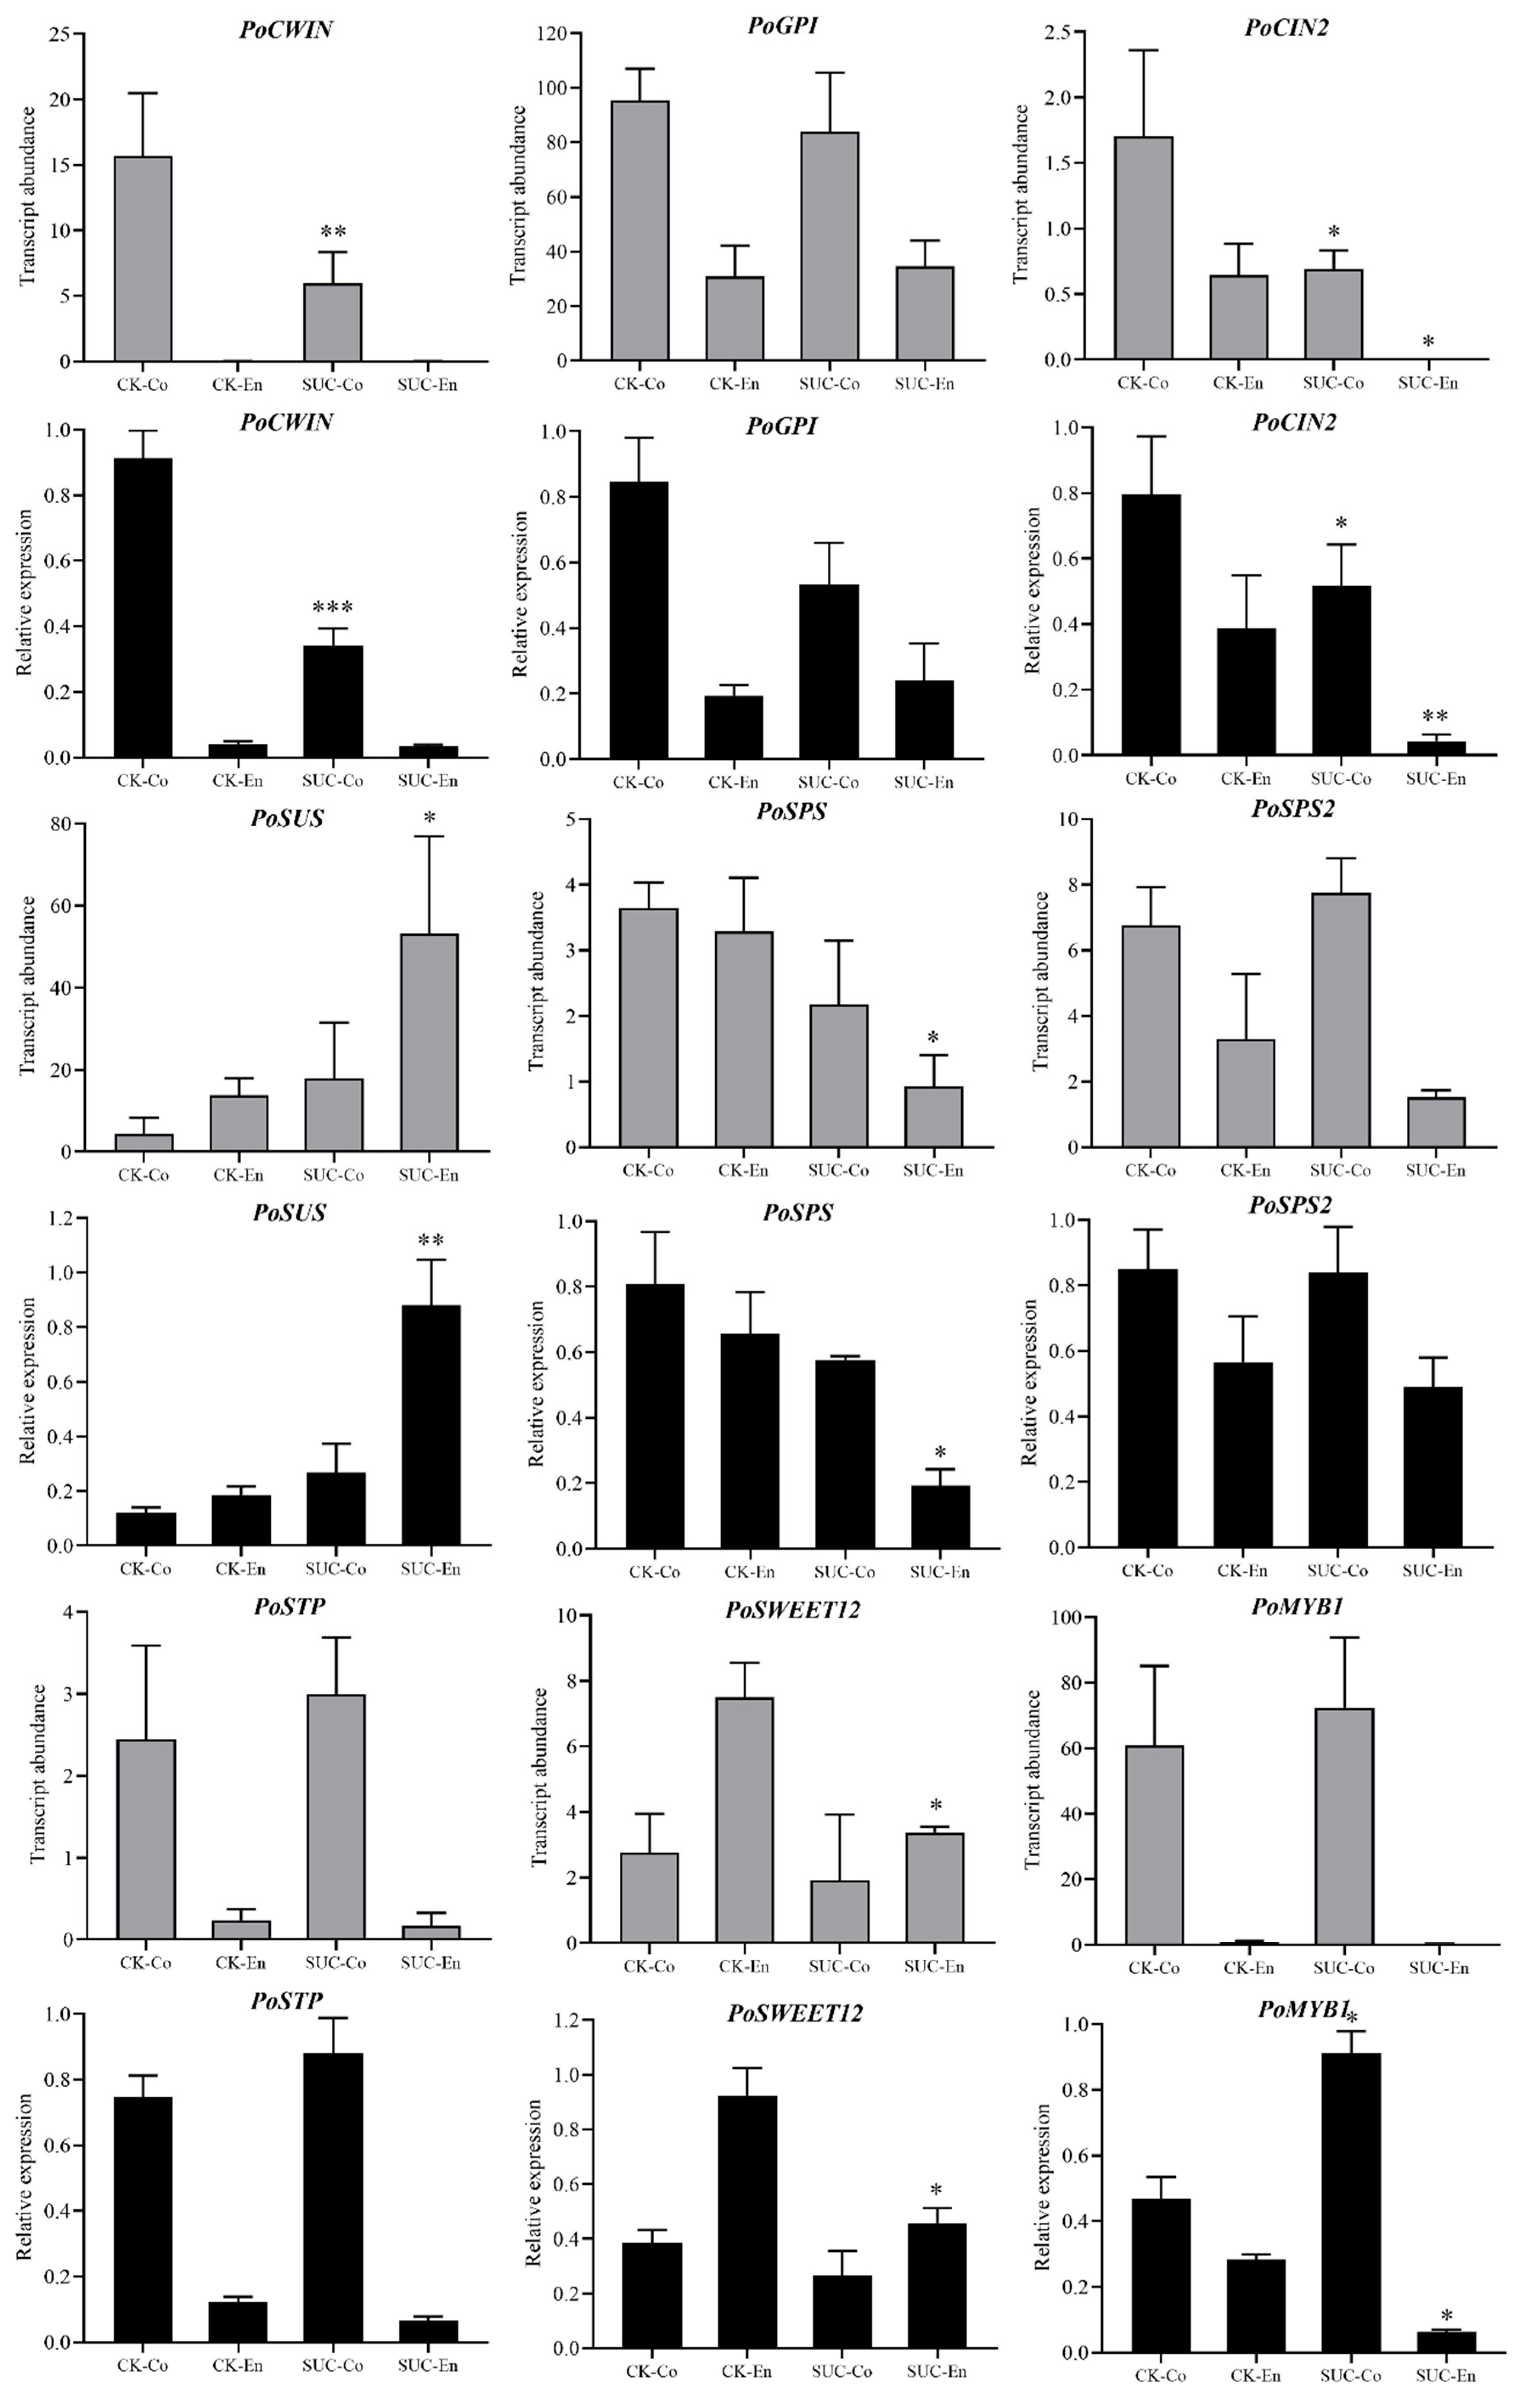
To verify the reliability of transcriptome sequencing results, nine differentially expressed genes related to sucrose metabolism and transporters were randomly selected, and the P. ostii seed coat and endosperm of the control and the sucrose treatment groups were used to analyze their expression by qRT-PCR. The nine DEGs were SWEET12, SUS, SPS, SPS2, STP, CWIN, CIN, MYB1, and GPI. As shown in Figure 6, the expression changes in nine random genes of seed coats and endosperms at 50 days after flowering with and without sucrose treatment were highly in line with the transcriptome sequencing results, which indicated that the transcriptome sequencing results acquired were creditable and accurate.

Figure 6.
The expression patterns of nine selected DEGs compared for FPKM and qRT-PCR analysis. CWIN, cell-wall invertase; GPI, glucose-6-phosphate isomerase; CIN, chloroplast; SUS, sucrose synthase; SPS, sucrose phosphate synthase; STP, sugar transporter; SWEET, sweet sugar transporter; MYB, MYB transcription factor. CK-Co, seed coat as the control; SUC-Co, seed coat with sucrose treatment; CK-En, endosperm as the control; SUC-En, endosperm with sucrose treatment. The grey bar represents the transcript abundance of genes by RNA-seq, while the black bar means the relative expression of genes by qRT-PCR. Each value represents the mean ± SD of three replicates (n = 3). Asterisks indicate significant differences between CK-Co and SUC-Co, CK-En and SUC-En: * p < 0.05; ** p < 0.01; *** p < 0.001 (t-test).
4. Discussion
During the early development of tree peony seeds, the content of soluble sugar appears increased and then remains stable, among which the contents of glucose and fructose rose gradually. At the early stages of seeds growth, glucose is the main component of soluble sugar and provides energy for cell division of seeds. Then, as the sucrose synthase is expressed highly at the late stages of seed development, the content of sucrose continued rising and was used for the synthesis of reserve substances such as oil and protein [47]. In our study, the content of sucrose in seed coat and endosperm at 50 DAF increased by 40% and 67%, respectively, when the P. ostii seeds were treated with sucrose after flowering. However, the levels of glucose, fructose, G6P, and T6P were not changed (Figure 1). The exogenous sucrose could be absorbed by leaves and then transported to seeds and may have effects on the sucrose metabolism and transporter of P. ostii seeds but had no effects on the contents of soluble sugar except sucrose. In addition, glucose content was higher than the levels of sucrose and fructose, which indicated that glucose was the main energy and nutrients source for early seed development at 50 DAF.
With the change in seed morphology and accumulation of nutrients during the development of seeds, the kinds and levels of endogenous hormones are changed continuously and have specific effects on the growth of seeds. Among them, the role of GA and ABA in regulating seed germination is particularly pivotal [48]. Zeatin, a kind of cytokinin, can promote cell division and growth and facilitate the degradation of endosperm materials [29]. In this study, Zeatin had the highest contents in seeds at 50 DAF, predicting that the endosperm formed at this stage and the starch accumulated in seeds was degraded gradually (Figure 2). The content of Zeatin in P. ostii seeds decreased by 44% after treating with sucrose, while the levels of GA3, IAA, and ABA had no changes. We speculated that sucrose supply on P. ostii seeds may not affect the seed germination caused by hormones, especially GA3 and ABA. To better explain the effect of sucrose supply on endogenous hormones via RNA seq, we analyzed the main DEGs involved in plant hormone signal transduction (Table S6). We hope that the results may provide new insight to the study of the relationship between plant hormones and seed development in Paeonia ostia.
New-generation sequencing technology has been widely used for mining functional genes in many plants. In our paper, a total of 212.9 Gb of sequencing data was obtained by Illumina HiSeq platform. The results indicated that the proportion of reads after filtering was higher than 93.41%, and the percentage of Q20 (%) was above 98.27%, while the ratio of low-quality bases was lower (Table S2), which pointed out that the sequencing quality was responsible. A total of 98,344 differentially expressed genes was identified in four groups by DEGseq method. The biological pathway enrichment analysis of DEGs shown that in P. ostii seed coat and endosperm at 50 DAF with and without sucrose supply, the number of DEGs annotated in the ‘phenylpropanoid biosynthesis’ and ‘starch and sucrose metabolism’ pathways was relatively high, indicating that the activities associated with starch and sucrose metabolism and phenylpropanoid biosynthesis were active during the development of P. ostii seeds (Figure 4). Research has shown that sucrose is the main form in which photosynthesis products are transported from source organs into seeds and the genes related to sucrose metabolism are expressed most heavily in the early stage of seed development. Then, sucrose is converted into oil and stored in seeds through a series of physiological and biochemical processes. Therefore, increased sucrose content will promote the conversion of sugar to oil [49,50]. Comparing the DEGs in seed coats at 50 DAF with and without sucrose, a total of 228 unigenes were annotated in the starch and sucrose metabolism pathway, indicating that a large number genes related to starch and sucrose metabolism expressed in the seed coat in order to promote the development of P. ostii seeds. It is speculated that sucrose supply may enhance the expression level of genes involving in sucrose metabolism and transporters in the P. ostii seed coat and promote the conversion of sucrose to oil.
In the transcriptome sequencing database, a total of 74 DEGs involving sucrose metabolism and transporters were found, such as SUT, SWEET, SUS, SPS, CWIN, CIN, and VIN (Table 1). In Arabidopsis thaliana, the sucrose transporter gene AtSUC5 specifically expressed in the endosperm was involved in seed maturation. In the suc5 mutants, the embryo development was slightly delayed [26]. During the development of barley seeds, the rapid induction of HvSUT1 gene expression would increase sucrose levels, which predicted that the role of HvSUT1 could act as a control element for sucrose concentration in endosperm [51]. The expression level of the sucrose transporter was upregulated in P. ostii seeds with sucrose treatment (Figure 5). It is possible to predict that the sucrose transporter found in P. ostii transcriptome database may express specifically in peony endosperm, and the role of it may act as an uptake of sucrose from the seed coat into the endosperm and further promote the growth of seeds. Another sucrose transporter gene SWEET was identified and appeared to play a role in Arabidopsis thaliana seeds development. Research showed that a sweet 11;12;15 triple mutant demonstrated severe seed defects, and starch accumulated in the seed coat but not the embryo, which implicated the important role of SWEETs as sucrose transporters medicated sucrose efflux from seed coat to embryo [27]. In this study, ten genes encoding sweet sugar transporter were found, and two of them were upregulated in seeds treated with sucrose. We predict that these two genes may be responsible for mediating sucrose efflux into the embryo. Sucrose is degraded into glucose and fructose by invertase (INV), which can be classified as cell-wall invertase (CWIN), cytoplasmic invertase (CIN), and vacuolar invertase (VIN) (Figure 5) [52]. In tomato, silencing SlCWIN1 expression would inhibit seed and fruit development, whereas enhancing its activity promoted seed growth [53]. A total of seven genes involving in sucrose breakdown were annotated by the NR database in transcriptome sequencing. Most of them were downregulated, predicting that additional sucrose supply may hinder their activity. However, their expression in the P. ostii seed coat and endosperm highly suggests their role in carbon distribution during peony seed development.
5. Conclusions
In this paper, the effect of spraying sucrose on Paeonia ostii seeds during their early development was studied. Firstly, foliar spraying of 50 g/L sucrose solution helped to increase the content of sucrose, whether in seed coat or endosperm. The T6P content in seed coat was also enhanced after sucrose treatment. In addition, the endogenous hormones content of seeds also changed by dealing with sucrose; for example, the content of zeatin witnessed a sharp drop. Finally, we used transcriptome sequencing technology to determine differentially expressed genes related to sucrose metabolism and transporter in P. ostii seed coats and endosperms at 50 DAF with and without sucrose treatment. Then, using the transcriptome database for reference, the transcriptome changes between the control and sucrose-treated library were analyzed comprehensively. A total of 77 genes involving in sucrose metabolism and transporter including sucrose transporters protein (SUT), sucrose synthases (SUS), sweet sugar transporters (SWEET) and invertases (INV) were identified in this study, and nine random genes were selected to verify their expressions by qRT-PCR. At last, this research provides valuable gene resources and directions for further studying the effects of sucrose on the molecular mechanism of the sucrose metabolism and transporter during the development of P. ostii seeds.
Supplementary Materials
The following supporting information can be downloaded at: https://www.mdpi.com/article/10.3390/agronomy12081771/s1, Figure S1: The P. ostii seed morphology at 50 days after flowering with and without sucrose treatment (each square represents 1 cm); Figure S2: Unigene length distribution of P. ostii seed; Figure S3: Gene functional annotation of P. ostii unigenes; Table S1: Gene-specific primers sequence for qRT-PCR detection; Table S2: Clean reads quality statistics of P. ostii seed coat and endosperm with sucrose treatment at 50 days after flowering; Table S3: Quality metrics of unigenes of P. ostii seed coat and endosperm with sucrose treatment at 50 days after flowering; Table S4: Summary of the annotation results of P. ostii seeds unigenes; Table S5: Unigenes related to sucrose metabolism and transporter in P. ostii transcriptome; Table S6: Analysis of main DEGs related to plant hormone signal transduction in P. ostii transcriptome.
Author Contributions
Conceptualization and methodology, J.S. and J.T.; investigation, Q.C., M.L. and H.L.; formal analysis, Q.C., M.L. and H.L.; project administration, J.S. and J.T.; writing—original draft preparation, Q.C.; writing—review and editing, J.S. and Q.C. All authors have read and agreed to the published version of the manuscript.
Funding
This research was supported by funding from the National Natural Science Foundation of China (31600564), the Natural Science Fund of Jiangsu Province (BK20160460), and the program of key members of Yangzhou University outstanding young teachers.
Institutional Review Board Statement
Not applicable.
Informed Consent Statement
Not applicable.
Data Availability Statement
The data underlying this article are available in the article.
Conflicts of Interest
No potential conflict of interest was reported by the authors.
Abbreviations
DAF: days after flowering; DEGs: differentially expressed genes; SUT/SUC: sucrose transporter protein; SWEET: sweet sugar transporter; INV: invertase; SUS: sucrose synthase; SPS: sucrose phosphate synthase; qRT-PCR: quantitative real-time PCR; CWIN: cell-wall invertase; RNA-Seq: RNA sequencing; G6P: glucose 6-phosphate; T6P: trehalose 6-phosphate; GA: gibberellin; IAA: indole-3-acetic acid; ABA: abscisic acid; HPLC: high performance liquid chromatography; KEGG: Kyoto Encyclopedia of Genes and Genomes; GO: Gene Ontology; NR: non-redundant protein database; NT: non-redundant nucleic acid sequence database; Swiss-Prot: Swiss-Prot protein sequence database; Pfam: Protein Families database; KOG: EuKaryotic Orthologous Groups; RPKM: reads per kilo bases per million mapped read; FDR: false discovery rate; NCBI: national center for biotechnology information; STP: sugar transporter; HXT: hexose transporter; CIN: chloroplast invertase; VIN: vacuolar invertase; ERD6: sugar transporter ERD6-like; HK: hexokinase; GPI: glucose-6-phosphate isomerase; AGPL: glucose-1-phosphate adenylyltransferase; UGP: UTP-glucose-1-phosphate uridylyltransferase; MYB: MYB transcription factor.
References
- Zhao, X.; Zhou, Z.Q.; Lin, Q.B.; Pan, K.Y.; Li, M.Y. Phylogenetic analysis of Paeonia sect. Moutan (Paeoninceae) based on multiple DNA fragments and morphological data. J. Syst. Evol. 2008, 46, 563–572. [Google Scholar]
- Zhou, S.L.; Zou, X.H.; Zhou, Z.Q.; Liu, J.; Xu, C.; Yu, J.; Wang, Q.; Zhang, D.M.; Wang, X.Q.; Ge, S.; et al. Multiple species of wild tree peonies gave rise to the ‘king of flowers’, Paeonia suffruticosa Andrews. Proc. R. Soc. B-Biol. Sci. 2014, 281, 41687. [Google Scholar] [CrossRef] [PubMed] [Green Version]
- Sun, J.; Guo, H.X.; Liu, M.; Chen, M.; Zhu, M.Y.; Liu, D.T.; Tao, J. Histology and transcriptomeic profiling reveal the dynamics of seed coat and endosperm formation in tree peony (Paeonia ostii). Hortic. Res. 2022, 9, uhac106. [Google Scholar] [CrossRef] [PubMed]
- Deng, R.X.; Liu, Z.; Qin, L.L.; Wang, L.; Liu, X.Q.; Liu, P. Optimization of super critical CO2 extraction and analysis of chemical composition of peony seed oil. Food Sci. 2010, 31, 142–145. [Google Scholar]
- Li, X.Q.; Han, J.G.; Liu, Z.; Liu, Q.H.; Hu, Y.H. Economic characteristics investigation and seed oil fatty acid composition analysis of Paeonia ostii plants in diferent areas. Cereals Oils 2014, 27, 43–46. [Google Scholar]
- Rosche, E.; Blackmore, D.; Tegeder, M.; Richardson, T.; Schroeder, H.; Higgins, T.J.V.; Frommer, W.B.; Offler, C.E.; Patrick, J.W. Seed-specific overexpression of a potato sucrose transporter increases sucrose uptake and growth rates of developing pea cotyledons. Plant J. 2002, 30, 165–175. [Google Scholar] [CrossRef] [Green Version]
- Weichert, N.; Saalbach, I.; Weichert, H.; Kohl, S.; Erban, A.; Kopka, J.; Hause, B.; Varshney, A.; Sreenivasulu, N.; Strickert, M.; et al. Increasing sucrose uptake capacity of wheat grains stimulates storage protein synthesis. Plant Physiol. 2010, 152, 698–710. [Google Scholar] [CrossRef] [Green Version]
- Weber, H.; Borisjuk, L.; Wobus, U. Sugar import and metabolism during seed development. Trends Plant Sci. 1997, 2, 169–174. [Google Scholar] [CrossRef]
- Yang, Q.S.; Zhu, L.J.; Lu, L.; Lu, X.Z. Effects of shading and extraneous source sucrose on petal color and the photosynthetic characteristics in Paeonia suffruticosa. J. Henan Agric. Univ. 2005, 39, 249–253. [Google Scholar]
- Wang, Y.X.; Li, C.J.; Zhang, B. Effect of spraying sucrose and linalool solution on the floral characteristics, pod rate and seed yield of alfalfa. J. Arid. Land Resour. Environ. 2019, 33, 189–193. [Google Scholar]
- Slewinski, T.L.; Braun, D.M. Current perspectives on the regulation of whole-plant carbohydrate partitioning. Plant Sci. 2010, 178, 341–349. [Google Scholar] [CrossRef]
- Patrick, J.W.; Offler, C.E. Post-sieve element transport of photoassimilates in sink regions. J. Exp. Bot. 1995, 47, 1165–1177. [Google Scholar] [CrossRef]
- Kuhn, C.; Grof, C.P. Sucrose transporters of higher plants. Curr. Opin. Plant Biol. 2010, 13, 288–298. [Google Scholar] [CrossRef]
- Wind, J.; Smeekens, S.; Hanson, J. Sucrose: Metabolite and signaling molecule. Phytochemistry 2010, 71, 1610–1614. [Google Scholar] [CrossRef] [PubMed]
- Fallahi, H.; Scofield, G.N.; Badger, M.R.; Chow, W.S.; Furbank, R.T.; Ruan, Y.L. Localization of sucrose synthase in developing seed and siliques of Arabidopsis thaliana reveals diverse roles for SUS during development. J. Exp. Bot. 2008, 59, 3283–3295. [Google Scholar] [CrossRef] [PubMed] [Green Version]
- Dale, E.M.; Housley, T.L. Sucrose synthase activity in developing wheat endosperms differing in maximum weight. Plant Physiol. 1986, 82, 7–10. [Google Scholar] [CrossRef] [PubMed] [Green Version]
- Heim, U.; Weber, H.; Baumlein, H.; Wobus, U. A sucrose-synthase gene of Vicia faba L.: Expression pattern in developing seeds in relation to starch synthesis and metabolic regulation. Planta 1993, 191, 394–401. [Google Scholar] [CrossRef]
- Weber, H.; Buchner, P.; Borisjuk, L.; Wobus, U. Sucrose metabolism during cotyledon development of Vicia faba L. is controlled by the concerted action of both sucrose-phosphate synthase and sucrose synthase Expression patterns, metabolic regulation and implications for seed development. Plant J. 1996, 9, 841–850. [Google Scholar] [CrossRef]
- Miller, M.E.; Chourey, P.S. The maize invertase-deficient miniature-1 seed mutation is associated with aberrant pedicel and endosperm development. Plant Cell 1992, 4, 297–305. [Google Scholar] [CrossRef]
- Cheng, W.H.; Taliercio, E.W.; Chourey, P.S. The Miniature1 seed locus of maize encodes a cell wall invertase required for normal development of endosperm and maternal cells in the pedicel. Plant Cell 1996, 8, 971–983. [Google Scholar] [CrossRef]
- Chen, L.Q.; Qu, X.Q.; Hou, B.H.; Sosso, D.; Osorio, S.; Fernie, A.R.; Frommer, W.B. Sucrose efflux mediated by SWEET proteins as a key step for phloem transport. Science 2012, 335, 207–211. [Google Scholar] [CrossRef]
- Sosso, D.; Luo, D.; Li, Q.B.; Sasse, J.; Yang, J.; Gendrot, G.; Suzuki, M.; Koch, K.E.; McCarty, D.R.; Chourey, P.S.; et al. Seed filling in domesticated maize and rice depends on SWEET-mediated hexose transport. Nat. Genet. 2015, 47, 1489–1493. [Google Scholar] [CrossRef]
- Baud, S.; Wuilleme, S.; Lemoine, R.; Kronenberger, J.; Caboche, M.; Lepiniec, L.; Rochat, C. The AtSUC5 sucrose transporter specifically expressed in the endosperm is involved in early seed development in Arabidopsis. Plant J. 2005, 43, 824–836. [Google Scholar] [CrossRef]
- Chen, L.Q.; Lin, I.W.; Qu, X.-Q.; Sosso, D.; McFarlane, H.E.; Londoño, A.; Samuels, A.L.; Frommer, W.B. A Cascade of Sequentially Expressed Sucrose Transporters in the Seed Coat and Endosperm Provides Nutrition for the Arabidopsis Embryo. Plant Cell 2015, 27, 607–619. [Google Scholar] [CrossRef] [Green Version]
- Ko, H.Y.; Ho, L.H.; Neuhaus, H.E.; Guo, W.J. Transporter SlSWEET15 unloads sucrose from phloem and seed coat for fruit and seed development in tomato. Plant Physiol. 2021, 187, 2230–2245. [Google Scholar] [CrossRef]
- Weschke, W.; Panitz, R.; Gubatz, S.; Wang, Q.; Radchuk, R.; Weber, H.; Wobus, U. The role of invertases and hexose transporters in controlling sugar ratios in maternal and filial tissues of barley caryopses during early development. Plant J. 2003, 33, 395–411. [Google Scholar] [CrossRef]
- Cho, J.I.; Lee, S.K.; Ko, S.; Kim, H.K.; Jun, S.H.; Lee, Y.H.; Bhoo, S.H.; Lee, K.W.; An, G.; Hahn, T.R.; et al. Molecular cloning and expression analysis of the cell-wall invertase gene family in rice (Oryza sativa L.). Plant Cell Rep. 2005, 24, 225–236. [Google Scholar] [CrossRef]
- Finkelstein, R.; Reeves, W.; Ariizumi, T.; Steber, C. Molecular aspects of seed dormancy. Annu. Rev. Plant Biol. 2008, 59, 387–415. [Google Scholar] [CrossRef] [Green Version]
- Zhang, X.J.; Liu, H.Y.; Li, L. The influence of post havest ripening on content of seed endogenous hormone in Cistanche deserticola YC Ma. Seed 2006, 25, 1–7. [Google Scholar]
- Fu, X.; Harberd, N.P. Auxin promotes Arabidopsis root growth by modulating gibberellin response. Nature 2003, 421, 740–743. [Google Scholar] [CrossRef] [PubMed]
- Hao, D.C.; Chen, S.L.; Xiao, P.G.; Liu, M. Application of high-throughput sequencing in medicinal plant transcriptome studies. Drug Dev. Res. 2012, 73, 487–498. [Google Scholar] [CrossRef]
- Bankar, K.G.; Todur, V.N.; Shukla, R.N.; Vasudevan, M. Ameliorated de novo transcriptome assembly using Illumina paired end sequence data with Trinity Assembler. Genom. Data 2015, 5, 352–359. [Google Scholar] [CrossRef] [Green Version]
- Yin, D.; Wang, Y.; Zhang, X.; Li, H.; Lu, X.; Zhang, J.; Zhang, W.; Chen, S. De novo assembly of the peanut (Arachis hypogaea L.) seed transcriptome revealed candidate unigenes for oil accumulation pathways. PLoS ONE 2013, 8, e73767. [Google Scholar] [CrossRef] [Green Version]
- Fox, S.E.; Geniza, M.; Hanumappa, M.; Naithani, S.; Sullivan, C.; Preece, J.; Tiwari, V.K.; Elser, J.; Leonard, J.M.; Sage, A.; et al. De novo transcriptome assembly and analyses of gene expression during photomorphogenesis in diploid wheat Triticum monococcum. PLoS ONE 2014, 9, e96855. [Google Scholar] [CrossRef] [Green Version]
- Du, H.; Yu, Y.; Ma, Y.; Gao, Q.; Cao, Y.; Chen, Z.; Ma, B.; Qi, M.; Li, Y.; Zhao, X.; et al. Sequencing and de novo assembly of a near complete indica rice genome. Nat. Commun. 2017, 8, 15324. [Google Scholar] [CrossRef] [Green Version]
- Munoz-Merida, A.; Gonzalez-Plaza, J.J.; Canada, A.; Blanco, A.M.; Garcia-Lopez Mdel, C.; Rodriguez, J.M.; Pedrola, L.; Sicardo, M.D.; Hernandez, M.L.; De la Rosa, R.; et al. De novo assembly and functional annotation of the olive (Olea europaea) transcriptome. DNA Res. 2013, 20, 93–108. [Google Scholar] [CrossRef]
- Chen, H.; Wang, F.W.; Dong, Y.Y.; Wang, N.; Sun, Y.P.; Li, X.Y. Sequence mining and transcript profiling to explore differentially expressed genes associated with lipid biosynthesis during soybean seed development. BMC Plant Biol. 2012, 12, 122. [Google Scholar] [CrossRef] [Green Version]
- Li, S.S.; Wang, L.S.; Shu, Q.Y.; Wu, J.; Chen, L.G.; Shao, S.; Yin, D.D. Fatty acid composition of developing tree peony (Paeonia section Moutan DC.) seeds and transcriptome analysis during seed development. BMC Genom. 2015, 16, 208. [Google Scholar] [CrossRef] [Green Version]
- Wang, X.; Xu, R.; Wang, R.; Liu, A. Transcriptome analysis of Sacha Inchi (Plukenetia volubilis L.) seeds at two developmental stages. BMC Genom. 2013, 13, 716. [Google Scholar] [CrossRef] [Green Version]
- Shi, X.; Zhang, C.; Liu, Q.; Zhang, Z.; Zheng, B.; Bao, M. De novo comparative transcriptome analysis provides new insights into sucrose induced somatic embryogenesis in camphor tree (Cinnamomum camphora L.). BMC Genom. 2016, 17, 26. [Google Scholar] [CrossRef] [Green Version]
- Zhao, P.; Xin, G.; Yan, F.; Wang, H.; Ren, X.; Woeste, K.; Liu, W. The de novo genome assembly of Tapiscia sinensis and the transcriptomic and developmental bases of androdioecy. Hortic. Res. 2020, 7, 191. [Google Scholar] [CrossRef] [PubMed]
- Li, B.; Dewey, C.N. RSEM: Accurate transcript quantification from RNA-Seq data with or without a reference genome. BMC Bioinform. 2011, 12, 323. [Google Scholar] [CrossRef] [Green Version]
- Wang, L.K.; Feng, Z.X.; Wang, X.; Wang, X.W.; Zhang, X.G. DEGseq: An R package for identifying differentially expressed genes from RNA-seq data. Bioinformatics 2010, 26, 136–138. [Google Scholar] [CrossRef] [PubMed]
- Zhao, X.C.; Yang, G.Y.; Liu, X.Q.; Yu, Z.D.; Peng, S.B. Integrated analysis of seed microRNA and mRNA transcriptome reveals important functional genes and microRNA-targets in the process of walnut (Juglans regia) seed oil accumulation. Int. J. Mol. Sci. 2020, 21, 9093. [Google Scholar] [CrossRef]
- Hill, L.M.; Morley-Smith, E.R.; Rawsthorne, S. Metabolism of sugars in the endosperm of developing seeds of oilseed rape. Plant Physiol. 2003, 131, 228–236. [Google Scholar] [CrossRef] [Green Version]
- Ruan, Y.L. Sucrose metabolism: Gateway to diverse carbon use and sugar signaling. Annu. Rev. Plant Biol. 2014, 65, 33–67. [Google Scholar] [CrossRef]
- Liu, M.; Zeng, Z.X.; Xu, Y.; Zhang, X.; Li, M.; Sun, J. Studies on physiological and biochemical changes during seed development of peony. Seed 2021, 40, 27–32. [Google Scholar]
- Zuo, Y.; Xu, Y.H. Research progress on the mechanism of GA and ABA during seed germination. Mol. Plant Breed. 2021, 19, 6221–6226. [Google Scholar] [CrossRef]
- Zhang, Y.; Liu, A.Z. The correlation between soluble carbohydrate metabolism and lipid accumulation in castor seeds. Biotechnol. Bull. 2016, 32, 120–129. [Google Scholar]
- Borisjuk, L.; Rolletschek, H.; Radchuk, R.; Weschke, W.; Wobus, U.; Weber, H. Seed development and differentiation: A role for metabolic regulation. Plant Biol. 2004, 6, 375–386. [Google Scholar] [CrossRef] [PubMed]
- Weschke, W.; Panitz, R.; Sauer, N.; Wang, Q.; Neubohn, B.; Weber, H.; Wobus, U. Sucrose transport into barley seeds: Molecular characterization of two transporters and implications for seed development and starch accumulation. Plant J. 2000, 21, 455–467. [Google Scholar] [CrossRef] [PubMed] [Green Version]
- Sturm, A. Invertases: Primary structures, functions, and roles in plant development and sucrose partitioning. Plant Physiol. 1999, 121, 1–7. [Google Scholar] [CrossRef] [PubMed] [Green Version]
- Zanor, M.I.; Osorio, S.; Nunes-Nesi, A.; Carrari, F.; Lohse, M.; Usadel, B.; Kuhn, C.; Bleiss, W.; Giavalisco, P.; Willmitzer, L.; et al. RNA interference of LIN5 in tomato confirms its role in controlling Brix content, uncovers the influence of sugars on the levels of fruit hormones, and demonstrates the importance of sucrose cleavage for normal fruit development and fertility. Plant Physiol. 2009, 150, 1204–1218. [Google Scholar] [CrossRef] [PubMed] [Green Version]

Publisher’s Note: MDPI stays neutral with regard to jurisdictional claims in published maps and institutional affiliations. |
© 2022 by the authors. Licensee MDPI, Basel, Switzerland. This article is an open access article distributed under the terms and conditions of the Creative Commons Attribution (CC BY) license (https://creativecommons.org/licenses/by/4.0/).