Article

Chitosan and Titanium Dioxide Are More Effective in Improving Seed Yield and Quality in Nanoparticle Compared to Non-Structured Form: A Case Study in Five Milk Thistle Ecotypes (Silybum marianum (L.) Gaertn.)

by
Samira Jafari
1,
Sadegh Mousavi-Fard
1,*,
Abdolhossein Rezaei Nejad
1,
Hasan Mumivand
1,
Karim Sorkheh
2,
Nikolaos Nikoloudakis
3 and
Dimitrios Fanourakis
4
1
Department of Horticultural Science, Faculty of Agriculture, Lorestan University, Khorramabad P.O. Box 465, Iran
2
Department of Production Engineering and Plant Genetics, Faculty of Agriculture, Shahid Chamran University of Ahvaz, Ahvaz P.O. Box 61355/144, Iran
3
Department of Agricultural Sciences, Biotechnology and Food Science, Cyprus University of Technology, Limassol CY-3603, Cyprus
4
Laboratory of Quality and Safety of Agricultural Products, Landscape and Environment, Department of Agriculture, School of Agricultural Sciences, Hellenic Mediterranean University, Estavromenos, 71004 Heraklion, Greece
*
Author to whom correspondence should be addressed.
Agronomy 2022, 12(8), 1827; https://doi.org/10.3390/agronomy12081827
Submission received: 9 June 2022 / Revised: 27 July 2022 / Accepted: 29 July 2022 / Published: 31 July 2022
(This article belongs to the Section Crop Breeding and Genetics)

Abstract

:
Milk thistle is an important medicinal crop. In this two-year field study, the optimal form [bulk (non-structured), nanoparticles (NPs)] and concentration (0, 50, 100 mg L−1) of chitosan and titanium dioxide (TiO2) applications for improving seed yield, as well as seed mineral (N, Mg, Fe, Ti), protein, and oil contents were investigated in five ecotypes. Leaf gas exchange, ratio of variable to maximum fluorescence (Fv/Fm), and hydration were also evaluated in situ. Chitosan and TiO2 improved all traits under study, with the former generally being more effective. When applied in the NP form, the positive effect was stronger. For chitosan NPs, a low concentration was optimal. Increased hydration status was associated with enhanced stomatal conductance, which, together with Fv/Fm, were positively related to photosynthetic rate. The seed yield per plant was positively related to main capitulum traits (i.e., diameter, number, and weight of seeds), as well as to seed weight and number of capitula per plant. In conclusion, the improvement of seed yield and quality by application of chitosan and TiO2 in either form was underlain by the same components, though their relative importance depends on the ecotype. Chitosan NPs were most effective, demonstrating an economical, eco-friendly, and sustainable means to stimulate milk thistle yield.

1. Introduction

Milk thistle (Silybum marianum L. Gaertn.) is an important medicinal crop, widely cultivated in Europe, Egypt, China, and Argentina, while it is currently being evaluated as a commercial crop in other parts of the world including Canada [1,2]. Milk thistle leaves, flowers, and young stems are consumed fresh, while seeds are conventionally employed as an herbal medicine in large parts of the globe [3]. The main pharmaceutical value of milk thistle comes from a mixture of flavonolignans (silybin, isosilybin, silychristin, silydianin) and minor fractions of other flavonoids (e.g., toxifolin) (collectively composing the so-called silymarin [4,5]). Silymarin is traceable throughout the plant, with the highest content in seeds [3]. Seeds are also rich in edible oil [6]. This oil is classified as high quality owing to an abundance of unsaturated fatty acids such as linoleic (polyunsaturated omega-6) and oleic (mono-unsaturated omega-9). Both fatty acids have been repeatedly associated with health and aesthetic benefits [7,8]. Furthermore, this oil is a natural source of vitamin E, which represents a complex mixture of four tocopherols (α-tocopherol, β-tocopherol, γ-tocopherol, and δ-tocopherol) and four tocotrienols [7,9]. As a by-product of oil pressing, milk thistle oilseed cake flour has a high content of useful components (i.e., carbohydrates, oleochemicals, phytochemicals with antioxidant activity, proteins, ash, fiber, vitamins, and minerals), which are widely employed in food, cosmetic, and pharmaceutical industries [10]. Apart from the medicinal use, milk thistle is commonly employed for other purposes, including biomass production, as a forecrop in arable crop rotation and soil phytoremediation [1,4,5,11]. From this perspective, there is a great demand for stimulating milk thistle plant growth and productivity.
Chitosan is a natural, non-toxic, and low-cost biopolymer [12]. Although its mode of action still has not been fully elucidated, exogenous chitosan application has been shown to improve plant growth and the productivity of several crops (reviewed in Malerba and Cerana [13]). For instance, the foliar application of chitosan improved a range of growth attributes (e.g., plant dry mass, seed yield, oil yield) in origanum, maize, barley, and sunflower [14,15,16,17]. The phenological stage, wherein the chitosan application was performed, ranged between the seedling stage (thus close to planting) and prior to flowering (thus close to harvest) [18,19,20]. Although much less explored, titanium application in various forms, such as titanium dioxide (TiO2), has also been associated with beneficial effects on several plant traits, including yield (reviewed in Lyu et al. [21]). For example, TiO2 promoted plant performance in coriander, soybean, and safflower [22,23,24]. The stage of the plants receiving TiO2 application varied widely depending on the study [22,23,24]. To the best of our knowledge, the effects of either chitosan or TiO2 application on milk thistle plant growth and productivity have not been addressed. Therefore, the appropriate growth stage for application, as well as the optimal concentration remain unknown. To fully explore the potential of their application as a means to improve milk thistle growth and productivity, it is also essential to include several representative ecotypes. In this way, the importance of genetic characteristics in shaping the effect of exogenous application will be explored.
A rising body of evidence suggests that the positive effects of either chitosan or TiO2 are generally amplified when these are used in the form of nanoparticles (NPs; [13,21]). Plants uptake NPs far more effectively, and in this way, a lower dose is required compared to their natural counterparts [25]. On this basis, NPs appear to be a more potent and less costly alternative and can be expected to promote sustainable large-scale cultivation.
In this two-year field study, the optimal form [bulk (non-structured), NPs] and concentration (50, 100 mg L−1) of chitosan and TiO2 application for improving seed yield and quality were investigated. To explore genetic variation in the range these effects are expressed, five milk thistle ecotypes were evaluated. The results provide a cost-effective tool to increase yield, which may be potentially enhanced by selecting an appropriate ecotype.

2. Materials and Methods

2.1. Plant Material and Growth Conditions

The experiment was carried out at the research field of the Faculty of Agriculture, Lorestan University (Khorramabad, Iran; latitude 33°29′ N, longitude 48°22′ E). The field was located on a hilltop (slope < 2%) at an altitude of 1125 m. Soil texture was mostly made up of clay (thus having a fine texture) with an organic carbon content of 0.4% and an electrical conductivity of 2.4 dS m−1 (Table 1). Available N, P, and K contents were 0.06%, 11.8, and 275 ppm, respectively (Table 1). Soil properties were rather uniform across the two experimental years (Table 1). Prior to sowing, N, P2O5, and K2O fertilizers were embedded at 4, 12, and 12 g m−2, respectively.
Five milk thistle ecotypes (‘Ahvaz’, ‘Budakalazi’, ‘Khomin’, ‘Khoram Abad’, and ‘Sari’) were evaluated for two successive seasons (2019/2020 and 2020/2021), which are referred to as experimental years 1 and 2, respectively. Seeds were obtained from a commercial seed company (Pakan Bazr, Esfahan, Iran) and were manually sown on November 14 of each year (2019 and 2020). The sowing depth was ∼1 cm, and seeds were covered with soil immediately after sowing. The spacing between rows and plants was 0.8 and 0.4 m, respectively. In this way, a density of 3.12 plants m−2 was achieved. The experiment consisted of 45 treatments (5 ecotypes × 9 spray treatments) with three replications. The experimental units were distributed according to a randomized complete block design.
Foliar application of nine concentrations of chitosan and TiO2 included: control (sprayed with distilled water), 50 mg L−1 bulk chitosan, 100 mg L−1 bulk chitosan, 50 mg L−1 nano chitosan, 100 mg L−1 nano chitosan, 50 mg L−1 bulk TiO2, 100 mg L−1 bulk TiO2, 50 mg L−1 nano TiO2, and 100 mg L−1 nano TiO2. Foliar sprays were applied at the rosette stage (7–8 leaves) and the inflorescence emergence stage. In the former stage, each plant received 100 mL, while in the latter, this was 300 mL. The suitable concentration range and spray volume were selected based on both a comprehensive literature survey [26,27,28,29,30,31] and a pilot experimental study.
During cultivation, plants were watered once a week. When necessary, weeds were manually removed. Pesticide application was not required. The final harvest was carried out in the morning after dew (17–20 °C during harvest; [32,33]) on June 17 of each year (2020 and 2021). Temperature, relative air humidity, and precipitation data during the two experimental years are provided in Table S1.
Plant and leaf level measurements were conducted [34]. For leaf-level measurements, sampled leaves had grown under direct light and were fully expanded. Replicate leaves were collected from separate plants. Non-invasive evaluations were performed 1–9 d earlier than the destructive harvest. In all cases, the time between sampling and the start of the evaluation did not exceed 15 min.

2.2. Preparation of Spray Solutions (Chitosan) and Suspensions (TiO2)

Chitosan (de-acetylation degree of 85%) was obtained from Sigma Chemical Company (Saint Louis, MO, USA). Chitosan was dissolved in 1.0% (w/v) acetic acid and remained under stirring for 1 h. The pH was then adjusted to 6.0 with 2 M NaOH.
Chitosan nanoparticles were prepared through the ionotropic gelation of chitosan with tripolyphosphate (TPP) according to Anitha et al. [35], with some modifications, as described below. Chitosan was dissolved, as earlier indicated. The resulting suspension was subsequently filtered. The chitosan nanoparticles were spontaneously synthesized by slowly adding 1 mL of filtered 1% TPP [pH of 4, by using 20% (v/v) acetic acid] to 10 mL of chitosan solution under constant stirring at room temperature (25 °C) for 30 min. The obtained gel was centrifuged (8000 g for 10 min). Then, the supernatant was discarded, and the resulting sediment containing nanoparticles was washed five times with double deionized water. The collected precipitate of chitosan nanoparticles sorbent was dried at 60 °C. Chitosan nanoparticles were characterized in the University of Kurdistan (Sanandaj, Iran) using a field-emission scanning electron microscope (FESEM). A representative image is provided in Figure 1, wherein the majority of the depicted nanoparticles had a size smaller than 20 nm.
TiO2 nanoparticles in the anatase form (˃99% purity) were obtained from a commercial supplier (Iranian Nanomaterial Pioneers Company, Mashhad, Iran). The average diameter of TiO2 nanoparticles was 20 nm, while their density was 0.24 g cm−3. The structural properties of TiO2 nanoparticles were investigated by using high-resolution transmission electron microscopy (HRTEM). A representative image is provided in Figure 2. The crystal properties of TiO2 nanoparticles were examined by X-ray diffraction (XRD), validating that all nanoparticles were in the anatase form (Figure 2).
Spray solutions (chitosan) and suspensions (TiO2) were prepared by using double-distilled water. The ones containing nanoparticles were homogenized by exposure to ultrasonic waves (Hielscher UP400s, Teltow, Germany) for 10 min [36].
To ensure that the materials under investigation are nano-sized, their properties were not only examined after synthesis (Figure 1 and Figure 2) but also following application. For bulk (non-structured) samples, microscopy was not employed, since certified products were used with known particle sizes [29,37].

2.3. Stem Length, Capitulum, and Seed Characteristics

Stem length (from the root-to-shoot junction to the apical meristem) was determined. The number of capitula per plant, the total number of seeds per plant (including all capitula), the diameter of the main capitulum (also referred to as terminal head or capitulum), and the number of seeds in the main capitulum were measured. The dry weight of the seeds in the main capitulum and of 1000 seeds were also assessed (±0.01 g; MXX-412; Denver Instruments, Bohemia, NY, USA). Seeds had been harvested at maturity, cleaned for impurities, and dried under shade until constant weight. At that state, seed residual moisture content, assessed by oven drying (48 h at 80 °C), was 7 ± 0.01%, which is considered optimal for either storage or the extraction of bioactive compounds.

2.4. Leaf Photosynthetic Pigment Content

Samples were processed immediately after collection. Following fine chopping, portions weighing 0.1 g were homogenized with the addition of 10 mL of 100% acetone. The extract was then centrifuged (14,000× g for 20 min), and the supernatant was collected. Since chlorophyll is light-sensitive, the extraction took place in a dark room [38,39]. The obtained extract was subjected to being read on a spectrophotometer (Mapada UV-1800; Shanghai Mapada Instruments Co., Ltd., Shanghai, China). Total chlorophyll and carotenoid contents were calculated according to Lichtenthaler and Wellburn [40].

2.5. Leaf Water Status

Leaf water status was in situ assessed by measuring relative water content (RWC, also referred as relative turgidity). Samples were collected 3 h following the onset of the photoperiod [41]. Following excision, fresh weight was gravimetrically obtained (±0.0001 g; Mettler AE 200, Giessen, Germany). Immediately after, samples were floated on distilled water inside a Petri dish and covered with a lid. Following 24 h of incubation, the recorded weight was regarded as turgid (saturated). Then, dry weight (48 h at 80 °C) was determined. RWC was calculated according to Taheri-Garavand et al. [42].

2.6. Ratio of Variable to Maximum Chlorophyll Fluorescence

As a valid indicator of leaf photosynthetic performance [43,44,45], the ratio of variable to maximum chlorophyll fluorescence (Fv/Fm) was assessed. Measurements were performed by using an analyzer fluorimeter (Pocket PEA, Hansatech Instruments, King’s Lynn, Norfolk, UK). Prior to evaluation, leaves were dark adapted (≥20 min) by employing leaf clips. Fv/Fm was assessed by applying a photosynthetic photon flux density of 125 µmol m−2 s−1. Measurements were in situ conducted (8.00–10.00 a.m.) in the attached leaves of intact plants.

2.7. Leaf Gas-Exchange Traits

In situ net photosynthetic rate (Pn), transpiration rate (Tr), and stomatal conductance (gs) evaluations were performed on attached leaves. Measurements were taken using a portable photosynthesis system (CI-340; CID, Inc., Camas, WA, USA). Leaf chamber (6.25 cm2) conditions were 34 ± 1 °C air temperature, 50 ± 2% relative air humidity, and an incoming air CO2 concentration of 376 ± 2 μmol mol−1. Light intensity was set at 200 μmol m−2 s−1. Evaluations took place 2 h following the onset of the light period to assure steady state gs [42].

2.8. Seed Oil Content

The seed oil was extracted according to the method of Estaji et al. [46]. Dried seeds (20 g) were powdered and placed into a Soxhlet extractor, where n-hexane solvent (150 mL) was included. Temperature was maintained at 70 °C for 6 h. Then, the solvent was separated from the oil, using a rotary-evaporator (Buchi R-124, Switzerland) at 35 °C (150 g). The weight of the extracted oil was then determined (±0.01 g; MXX-412; Denver Instruments, Bohemia, NY, USA).

2.9. Seed Mineral Content

Seeds were washed with distilled water and then dried (80 °C for 6 h). Afterward, they were grounded into fine powder and assessed using a 30-mesh screen [47]. A homogenized portion of 0.5 g was dry-ashed in a muffle furnace (500 °C for 6 h). Then, the ash was dissolved in 5 mL of 2 N HCl. The samples were then digested at 75 °C for 45 min. The digested samples were allowed to cool at room temperature (25 °C) and then filtered by Whatman No 1 filter paper and diluted with double-distilled water up to 50 mL [48,49]. These extracts were used for the determination of minerals (Mg, Fe, and Ti) by using a 240FS Agilent Technologies atomic absorption spectrometer (Agilent, Santa Clara, CA, USA). N was determined by the Kjeldahl method. Based on N content, seed protein content was calculated according to Bishni and Hughes [50]. For each replicate, the assay was performed twice.

2.10. Statistical Analysis

Data analysis was performed using SPSS software (version 23; SPSS Inc., Chicago, IL, USA). A three-way ANOVA was employed (ecotype × treatment × year). Data were firstly tested for normality (Shapiro–Wilk test) and homogeneity of variances (Levene’s test). The means were determined, using Fisher’s least significant difference test, to be significant at p ≤ 0.05.

3. Results

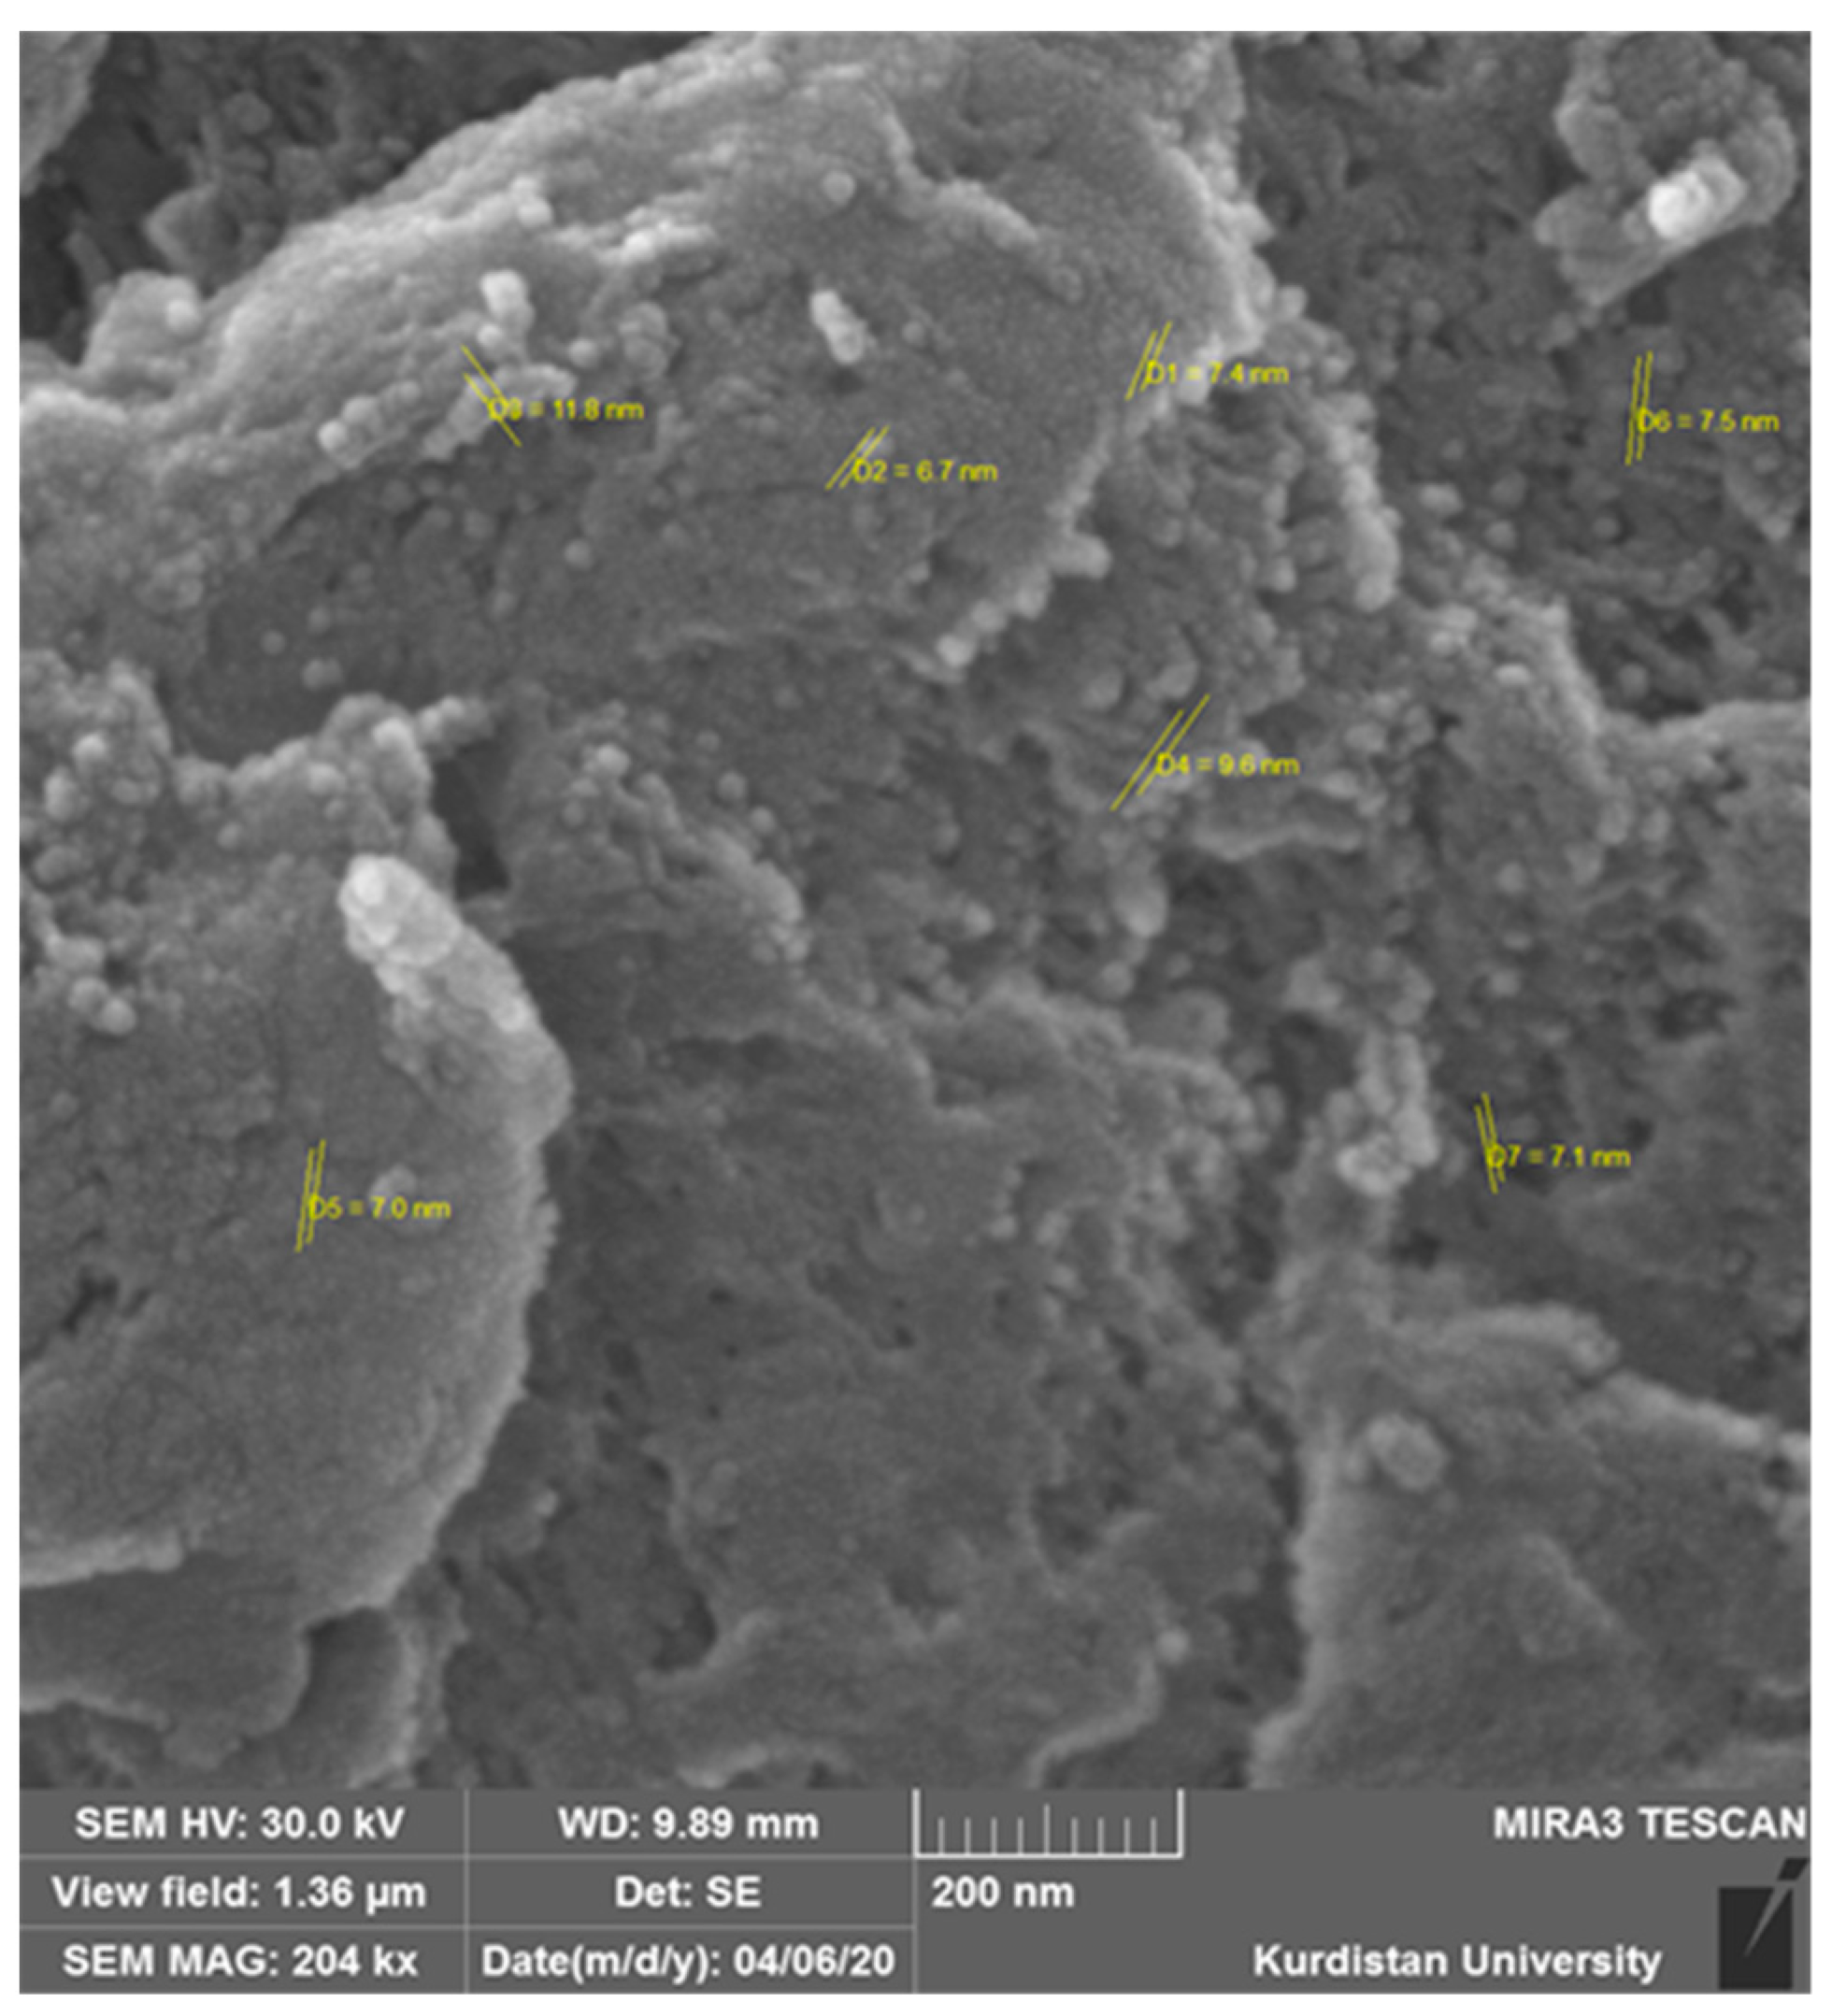
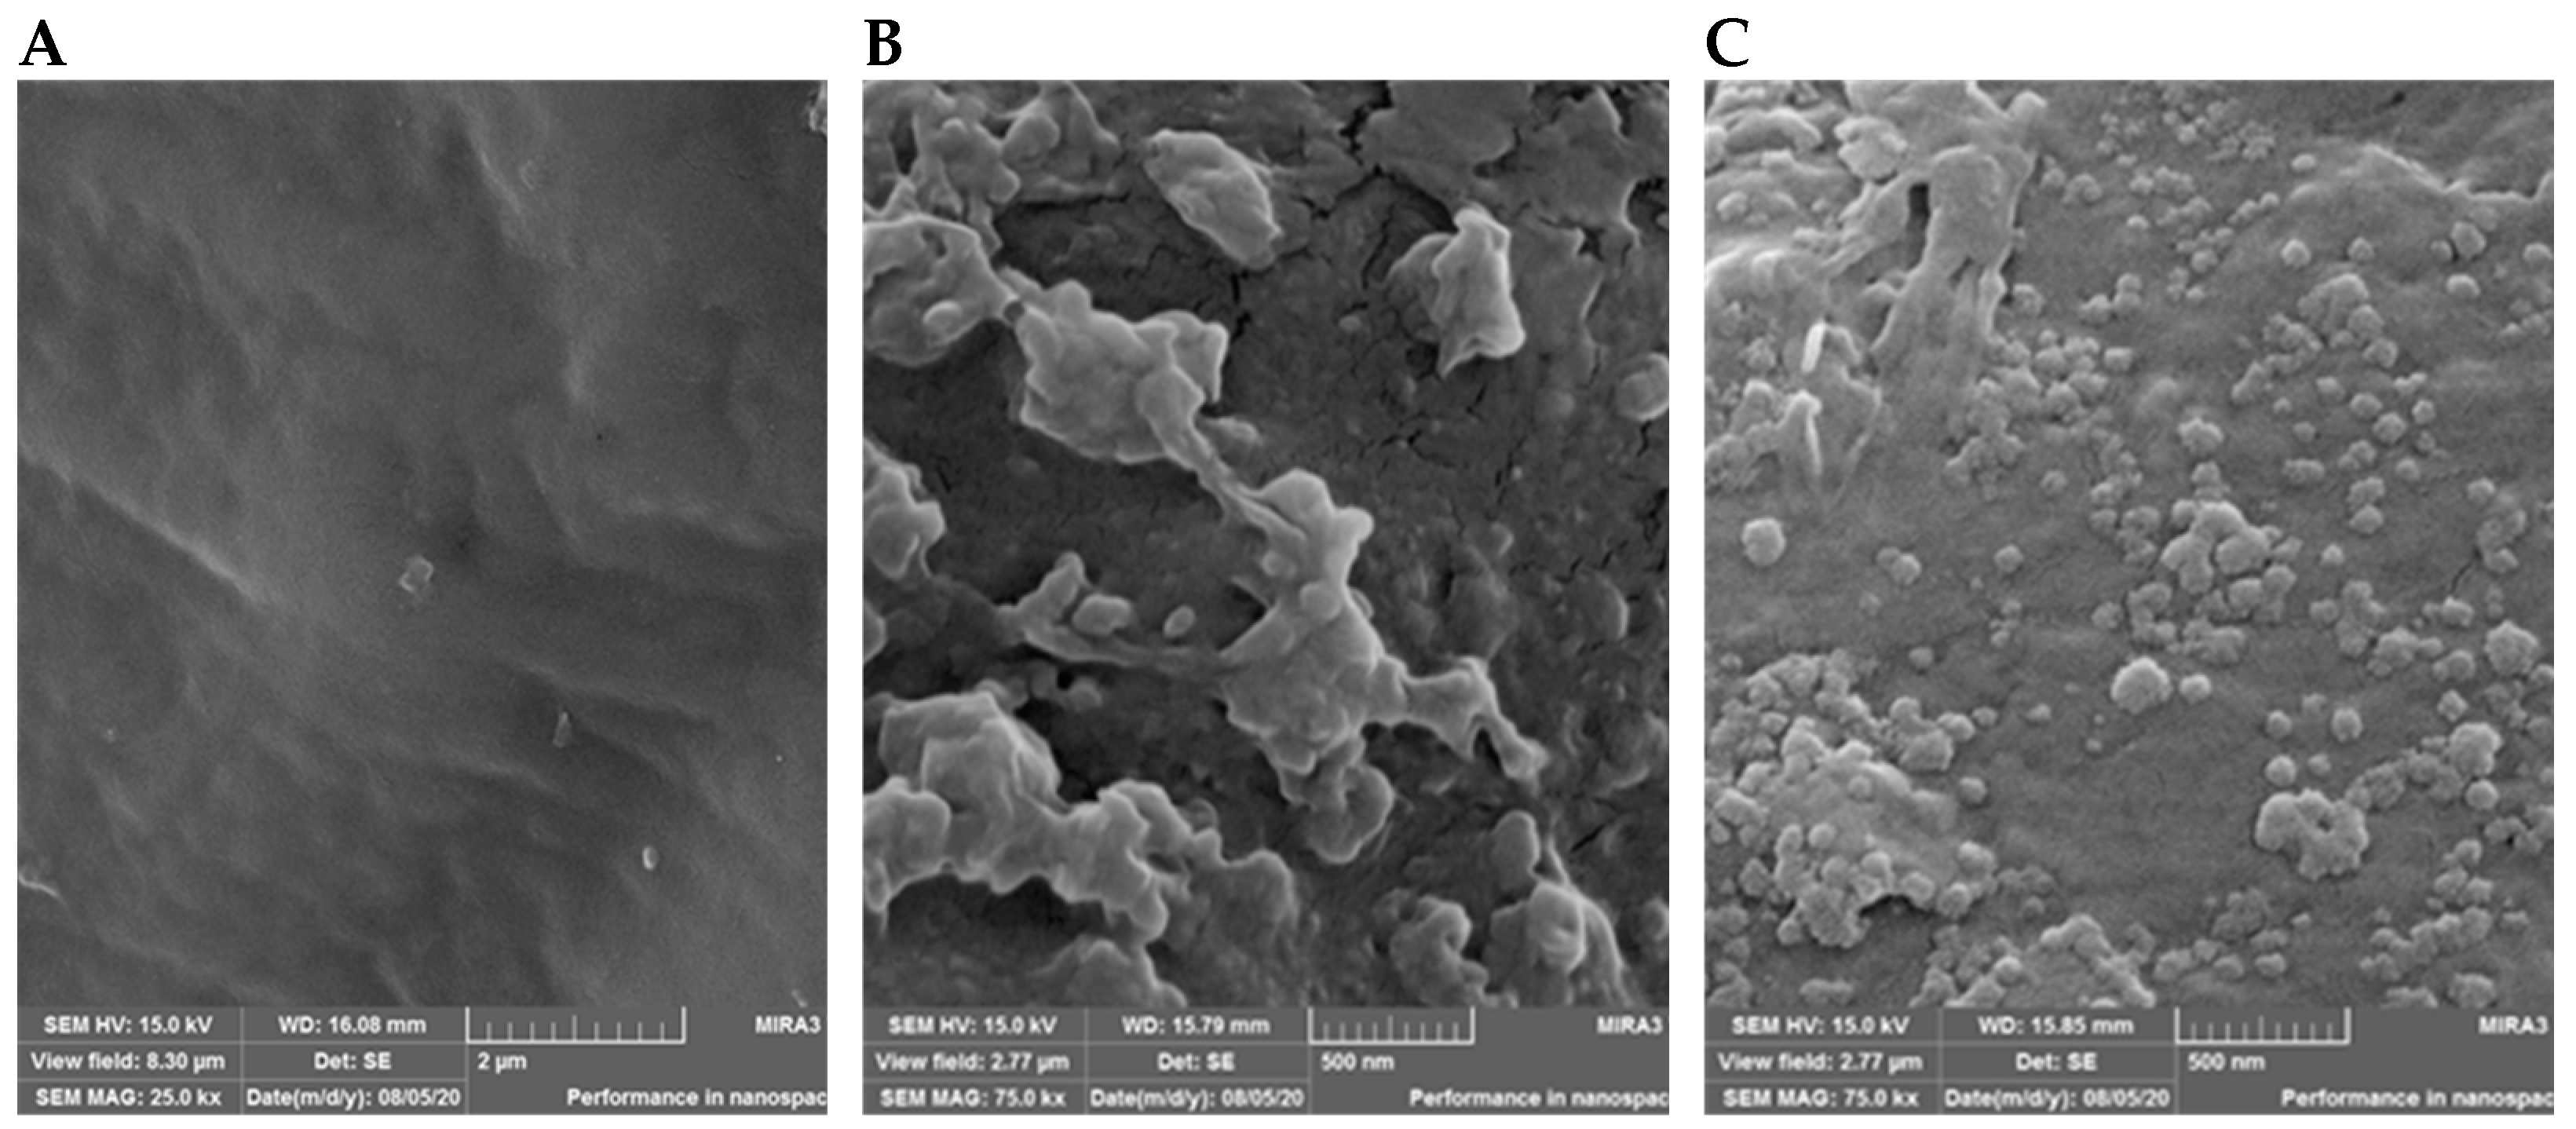
3.1. Validation of the Presence of NPs on the Leaf Surface

The retention of chitosan and TiO2 NPs on the leaf surface was validated by field-emission scanning electron microscopy. A dense film of NPs was apparent in treated plants, which was absent in controls (Figure 3). The estimated size of singlet NPs was around 10 nm (Figure 3). In some instances, larger dimensions were noted as compared to those of singlet NPs, indicating that NPs may coagulate in clusters and form larger particles.

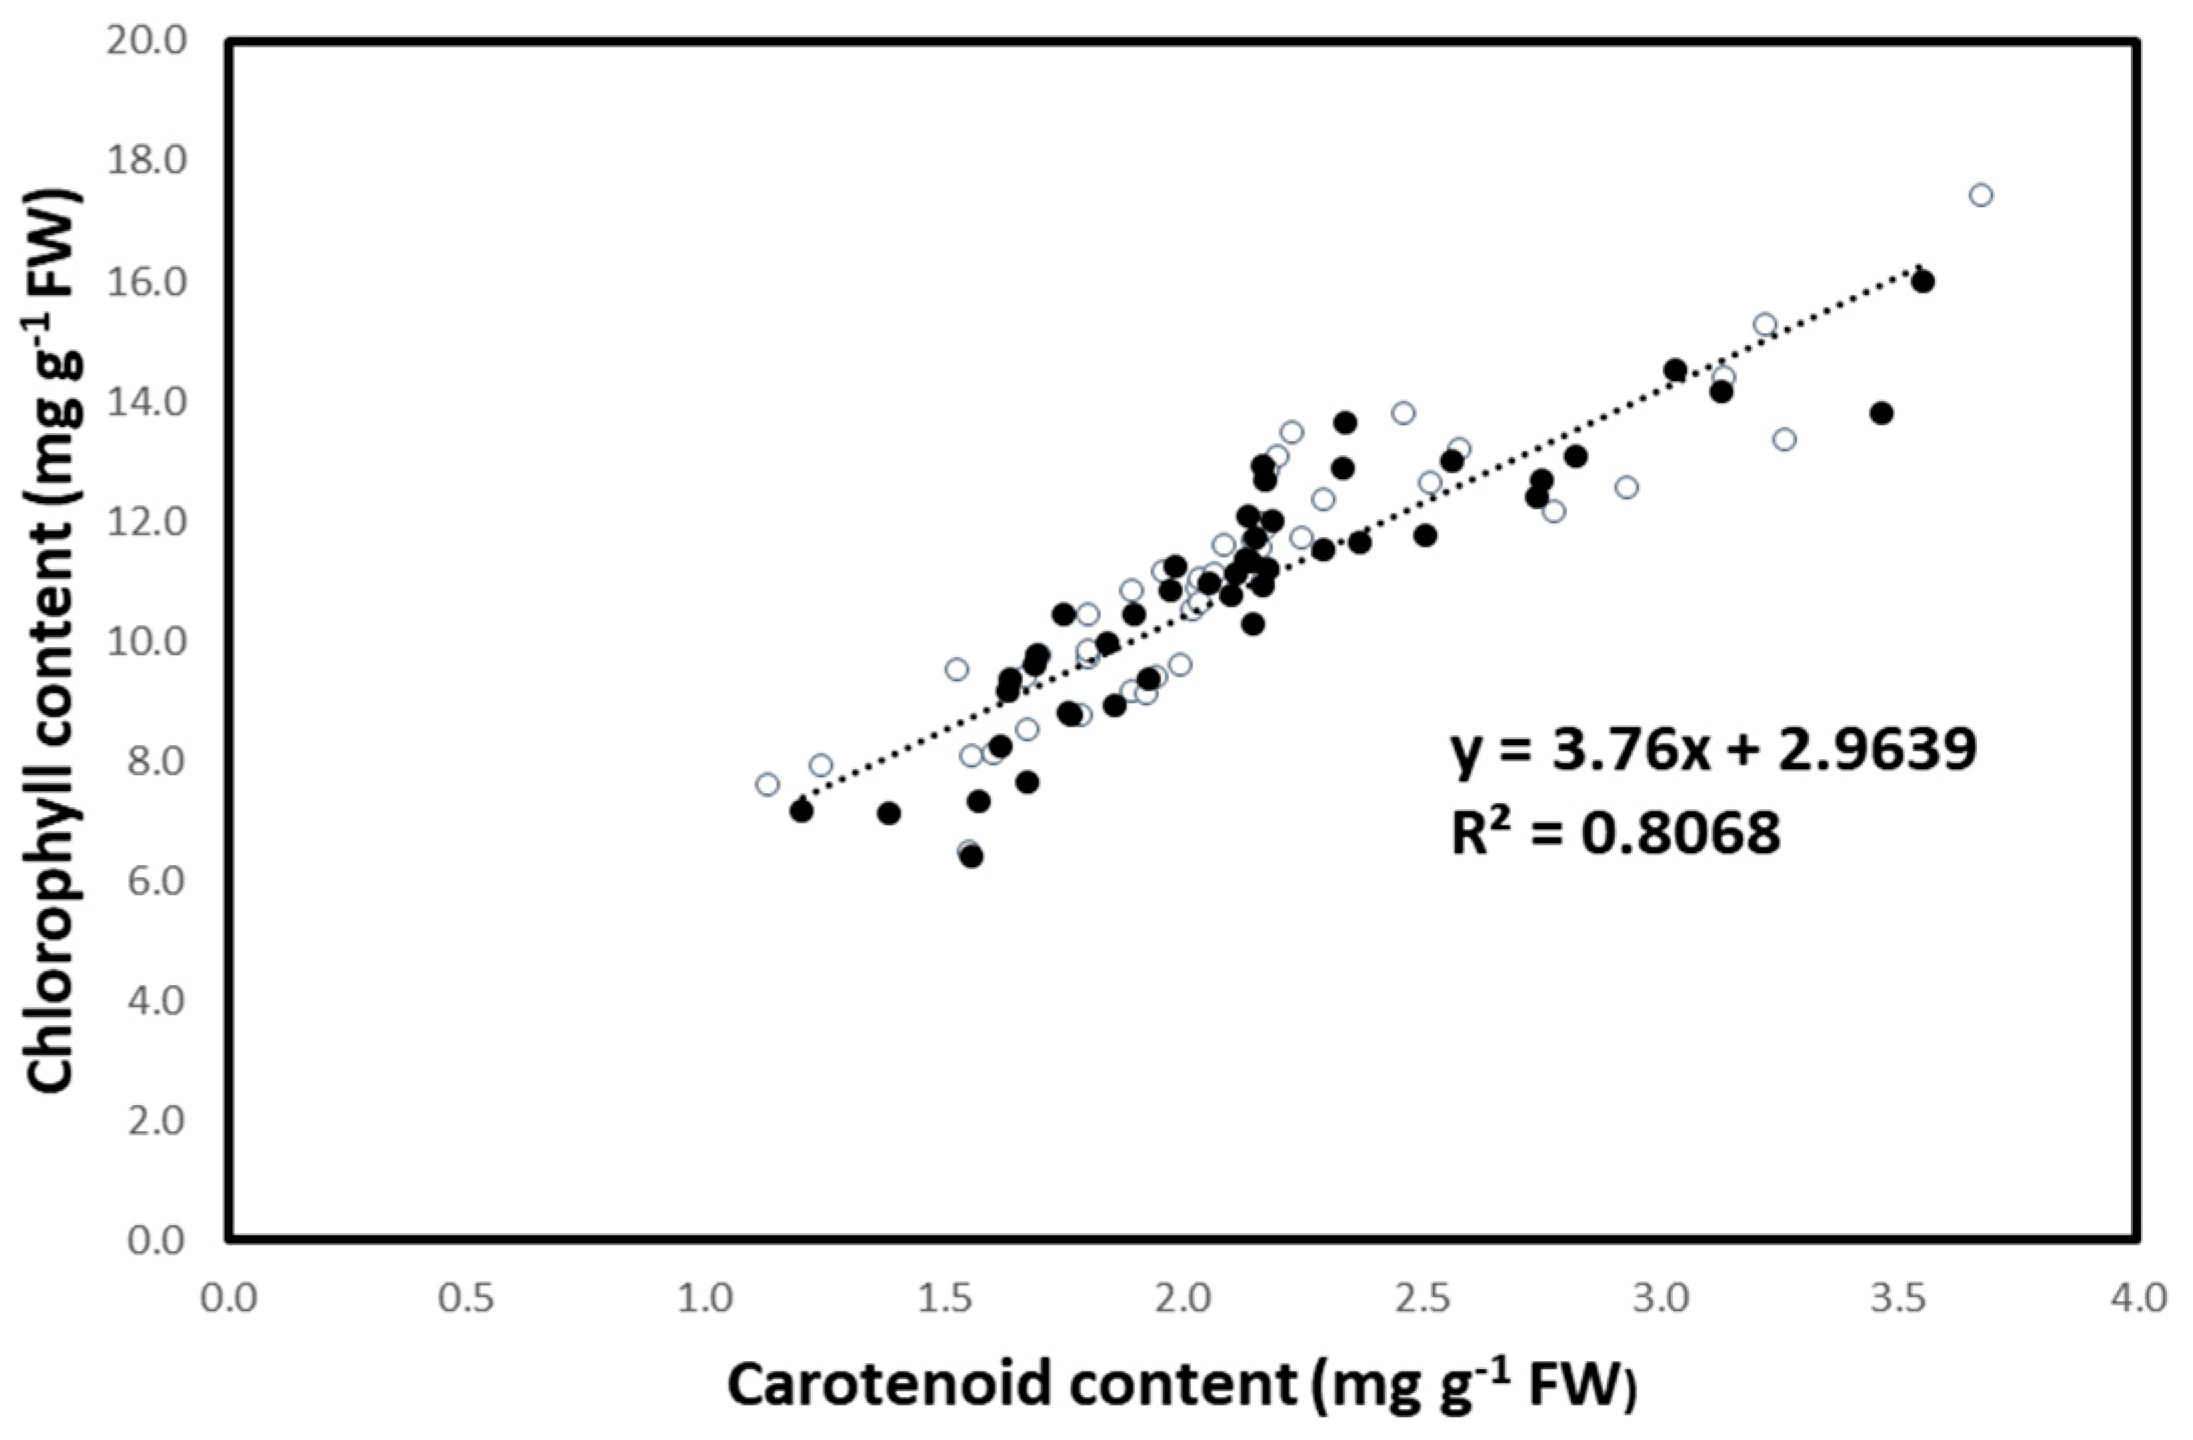
3.2. Stem Length and Leaf Photosynthetic Pigment Content

Stem length and photosynthetic pigment (chlorophyll, carotenoid) content were significantly affected by the treatments (Table 2). Stem length (140.66–158.33 cm), as well as chlorophyll (6.42–8.78 mg g−1), and carotenoid (1.16–1.77 mg g−1) contents of control plants, varied among the five ecotypes under study (Table 3). The application of either chitosan or TiO2 was associated with increased stem length (range 0.54–13.47%, average 4.09%), as well as chlorophyll (range 6.72–113.40%, average 52.22%) and carotenoid (range 5.81–169.83%, average 50.17%) contents, compared to control plants (Table 3). This effect was more prominent when these compounds were applied in NP form compared to the bulk one (a 70.87 versus a 33.56% increase for chlorophyll; Table 3). Chitosan was generally more efficient at increasing stem length and photosynthetic pigment content compared to TiO2 (a 62.71 versus a 41.73% increase for chlorophyll; Table 3).
For chitosan NPs, the lowest concentration (50 mg L−1) was generally optimal for stem length and photosynthetic pigment content, while, in the bulk form, the respective concentration was 100 mg L−1 (Table 3). For TiO2 NPs, the concentration of 100 mg L−1 mostly stimulated stem length and photosynthetic pigment content, while in the bulk form, the same concentration (100 mg L−1) was optimal (Table 3).
Among ecotypes, the effect of either chitosan or TiO2 application was the lowest in the ecotype ‘Budakalazi’ (2.56, 39.66, and 47.67% increase in stem length, chlorophyll content, and carotenoid content, respectively) and the highest in ecotype ‘Khomin’ (3.34, 57.8, and 86.53%, respectively, increase; Table 3).
The promotive effect of spray treatments on stem length and photosynthetic pigment content was generally more prominent in experimental year 2 compared to year 1 [4.37 versus 3.84% increase (stem length); 54.38 versus 47.51% increase (total chlorophyll); 48.27 vs. 51.48% (carotenoids)].
By pooling the data of all ecotypes and treatments across the two experimental years, it becomes apparent that leaf chlorophyll and carotenoid contents were highly associated (R2 = 0.8068; Figure 4).

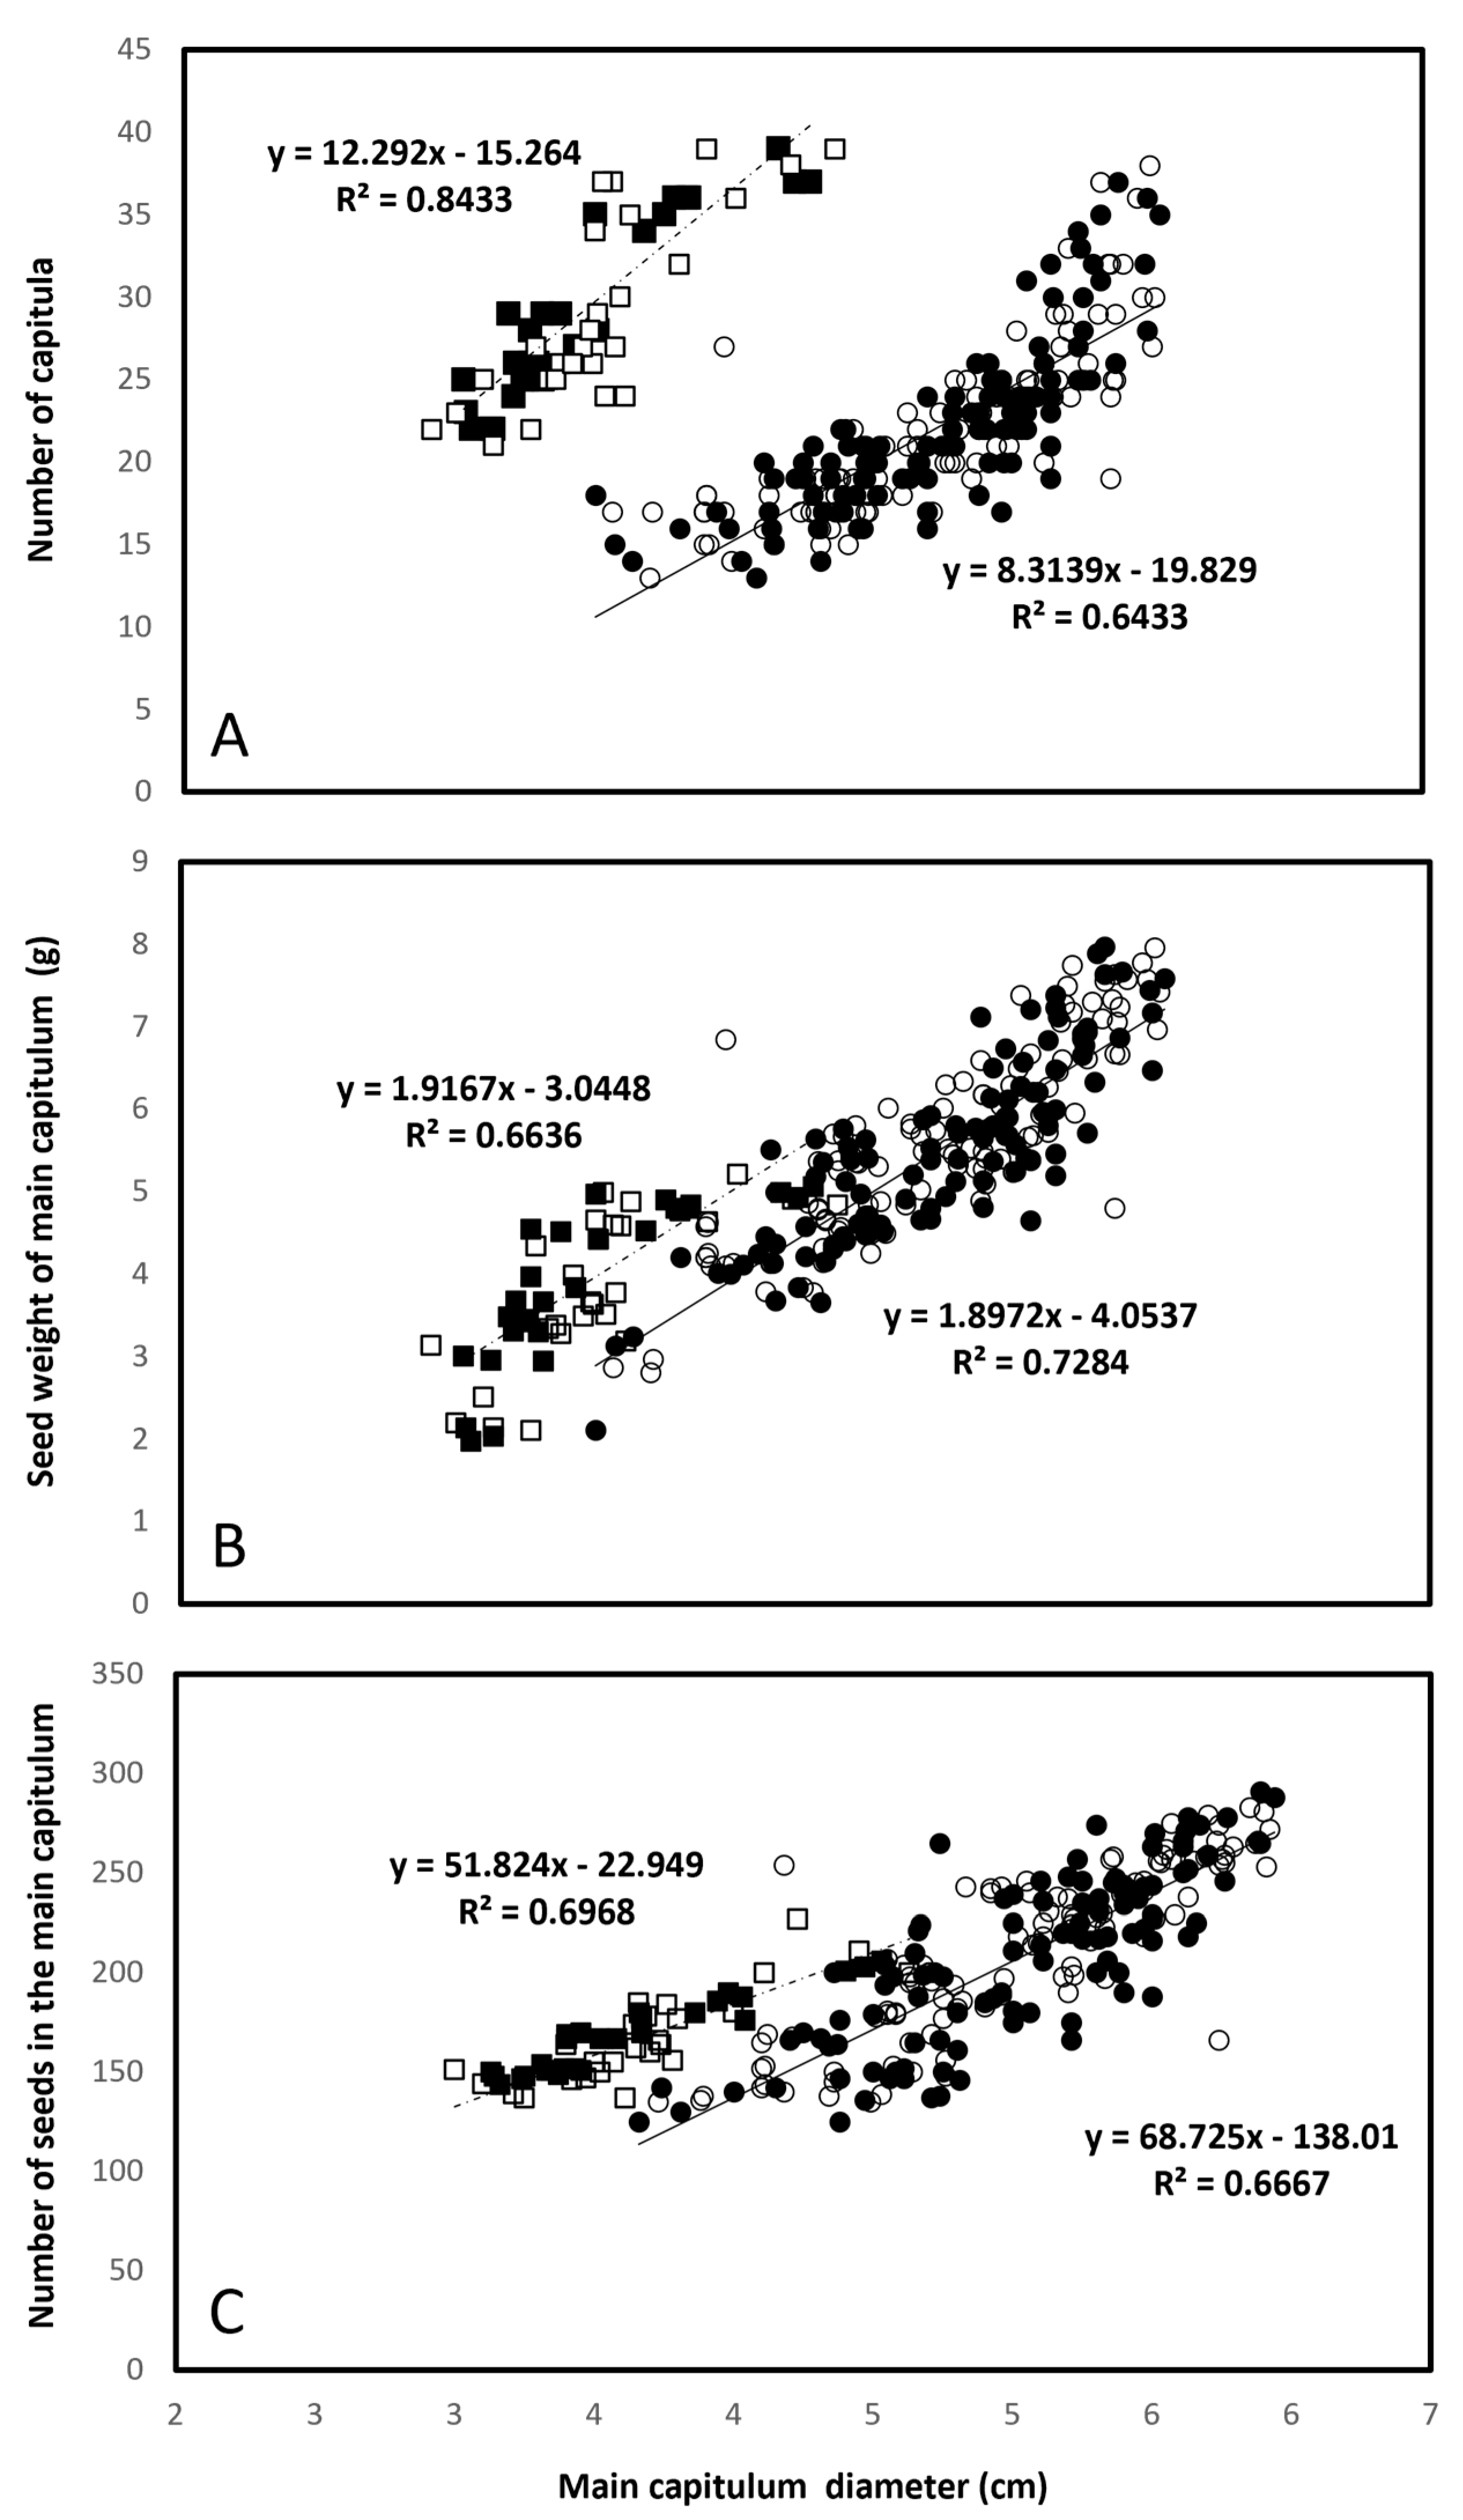
3.3. Traits Underlying Seed Yield

All seed yield traits under study were significantly affected by the treatments (Table 4). Number of seeds in the main capitulum (134.33–205.66), seed weight in the main capitulum (2.10–5.33 g), 1000 seed weight (15.5–19.48 g), number of capitula per plant (15.44–19.41), main capitulum diameter (3.21–4.63), and seed yield (29.80–47.70 g plant−1) ranged between the five ecotypes (Table 5). Chitosan or TiO2 application improved the number of seeds in the main capitulum (range 1.02–86.97%, average 30.23%), seed weight in the main capitulum (range 3.19–137.62%, average 55.83%), 1000-seed weight (range 0.67–33.29%, average 14.63%), number of capitula per plant (range 5.88–130.57%, average 44.26%), main capitulum diameter (range 1.56–38.63%, average 21.05%), and seed yield per plant (range 12.14–110.20%, average 52.15%), compared to controls (Table 5). This increase was more prominent when chitosan and TiO2 were in NP form as compared to the bulk one (a 50.10 versus a 22.3% increase; Table 5). Chitosan generally induced a higher increase in seed yield traits compared to TiO2 (43.27 versus 29.44% increase; Table 5). For chitosan NPs, the lowest concentration (50 mg L−1) was superior across seed yield traits (number of seeds in the main capitulum, weight of seeds in the main capitulum, the weight of 1000 seeds, the capitulum number and main capitulum diameter, and the seed yield per plant), while for TiO2, the 100 mg L−1 level was optimal (Table 5).
Considering all seeds traits together, the effect of either chitosan or TiO2 application was the lowest in ecotype ‘Khomin’ and the highest in ecotypes ‘Sari’ and ‘Ahvaz’ (Table 5). The promotive effect of spray treatments was found to be rather consistent across years, even though it was slightly elevated in experimental year 2 compared to year 1 (34.61 versus 33.38% increase).
The seed yield per plant was positively related to three main capitulum traits (diameter, number, and weight of seeds), as well as to 1000-seed weight and number of capitula per plant (Figure 5). The relation of seed yield per plant with either main capitulum diameter or number of capitula per plant was ecotype-specific (Figure 5A,B).
As may be expected, the main capitulum diameter was positively related to the number and weight of seeds in the main capitulum (Figure 6B,C). Notably, the number of capitula per plant was also positively related to the main capitulum diameter (Figure 6A), indicating that there was no tradeoff between these two traits. The relationship of the main capitulum diameter with the three above–mentioned traits was strongly ecotype–specific (Figure 6).

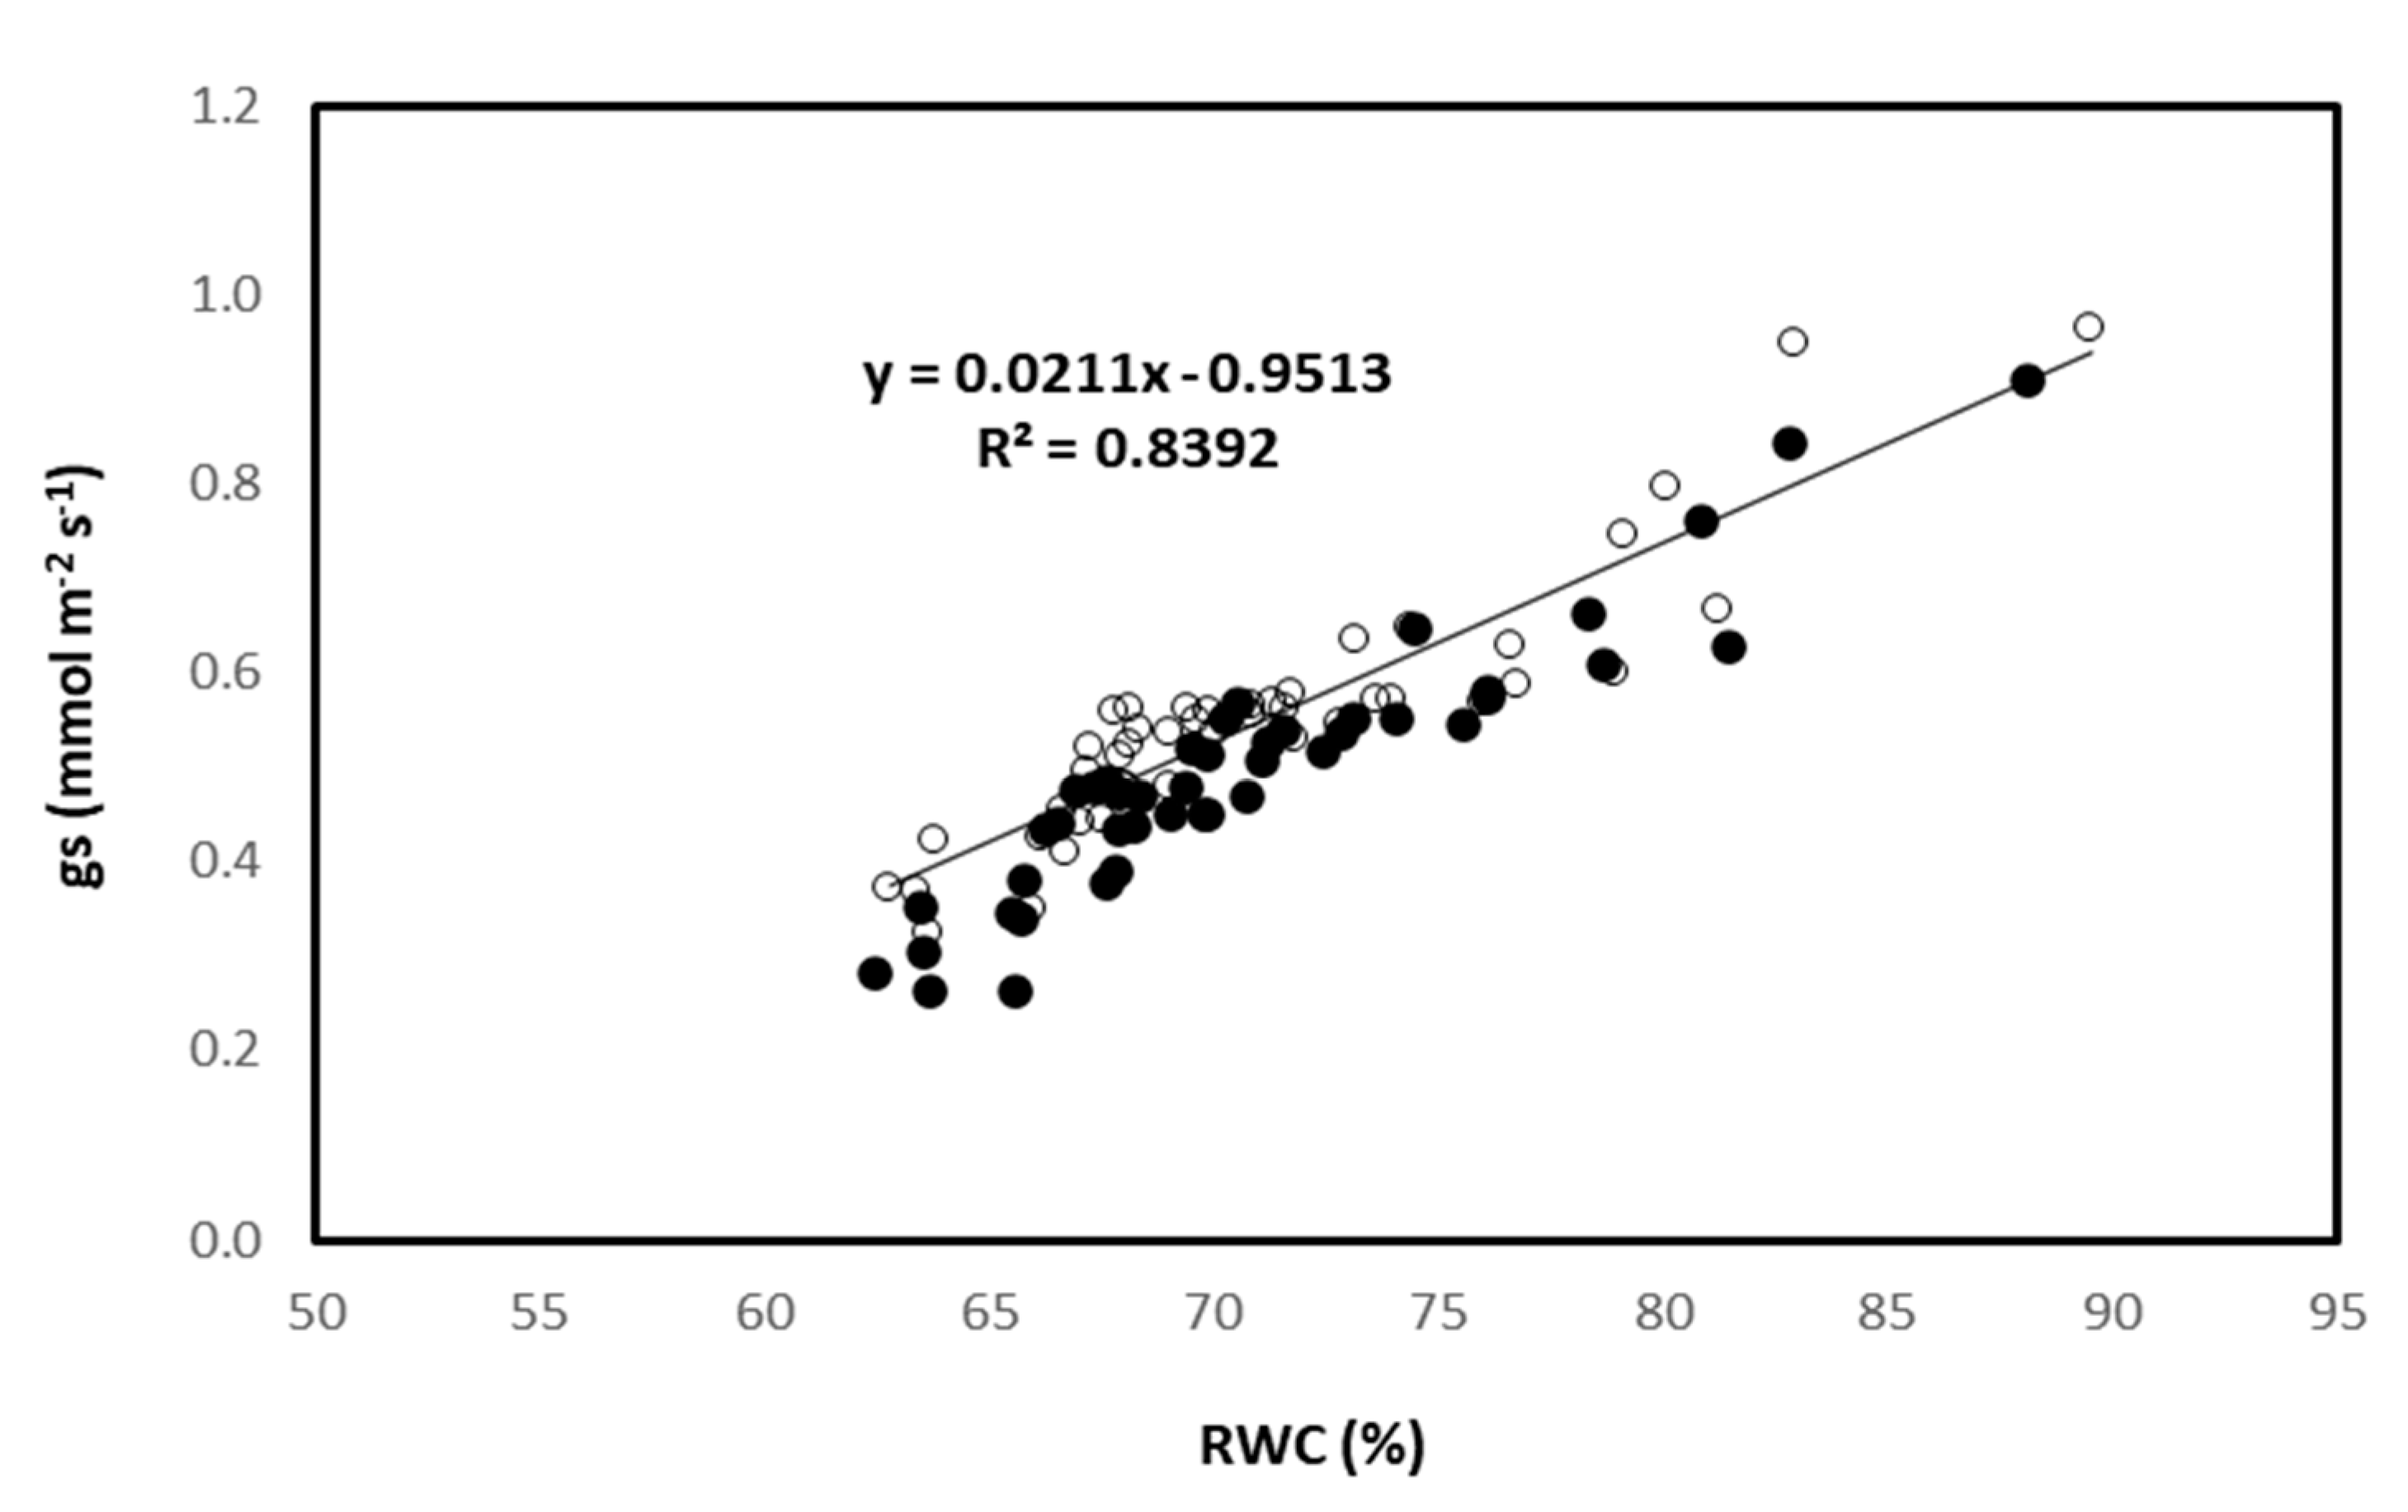
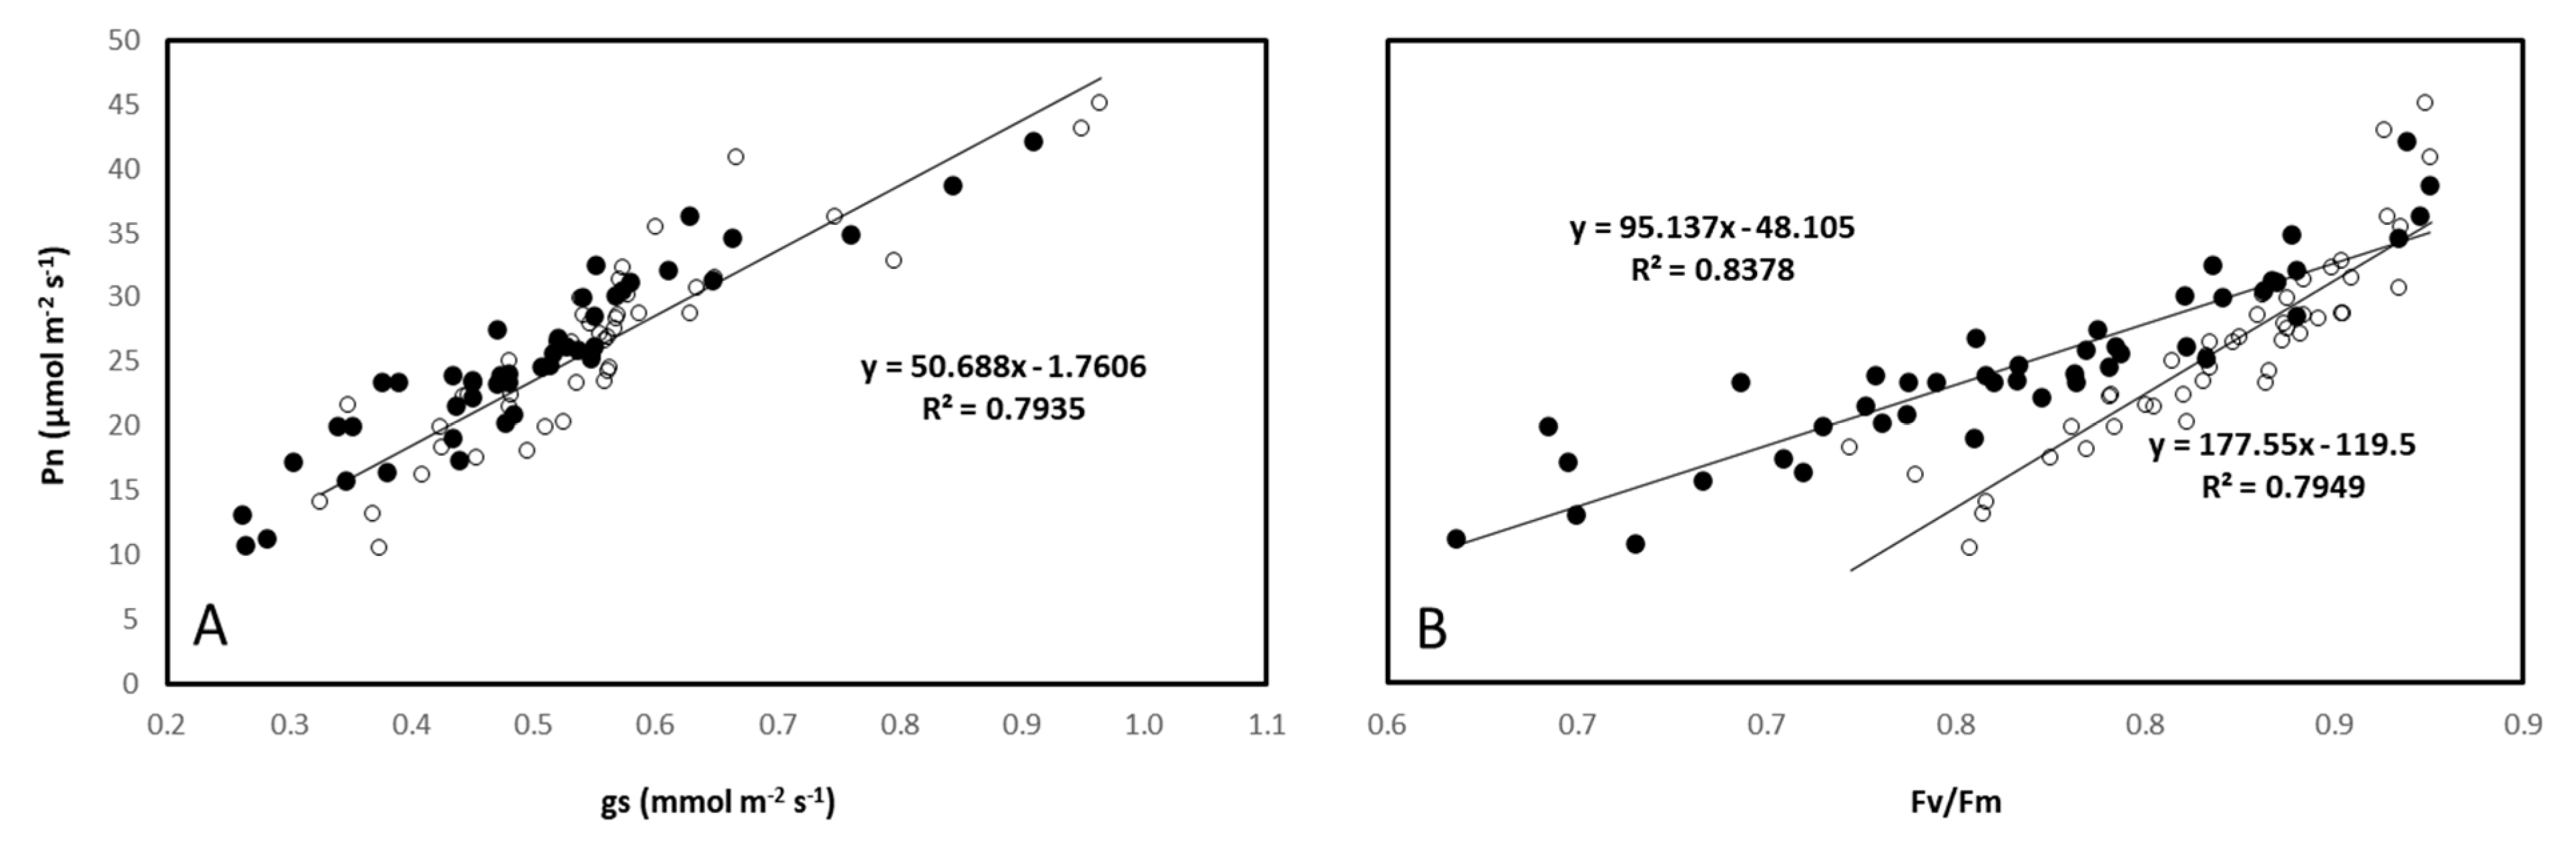
3.4. Leaf Gas–Exchange Traits, Chlorophyll Fluorescence, and Hydration Status

Leaf gas–exchange traits (Pn, gs, Tr), Fv/Fm, and hydration status (RWC) were significantly affected by the treatments (Table 6). Pn (10.85–19.89 µmol m−2 s−1), gs (0.31–0.68 mmol m−2 s−1), Tr (3.07–5.39 mmol m−2 s−1), Fv/Fm (0.68–0.71), and RWC (62.63–65.87%) varied widely depending on the ecotype (Table 7). Chitosan or TiO2 application led to an increase in Pn (range 4.07–197.48%, average 81.82%), gs (range 9.68–187.1%, average 38.58%), Tr (range 5.59–158.96%, average 65.39%), Fv/Fm (range 1.41–27.94%, average 15.16%), and RWC (range 2.25–39.57%, average 12.50%) compared to controls (Table 7). This improvement was higher when the NP form of either compound was employed compared to the bulk one (a 64.16 versus a 31.71% increase; Table 7). Chitosan generally stimulated a higher increase in leaf gas exchange, photosynthetic state, and hydration status compared to TiO2 (a 57.90 versus a 37.98% increase on average; Table 7). For chitosan NPs, the lowest concentration (50 mg L−1) was ideal for gas exchange traits (Pn, gs, Tr), Fv/Fm, and RWC, whereas for TiO2, 100 mg L−1 was found to be most favorable (Table 7).
Considering all traits together (gas exchange, Fv/Fm, RWC), the effect of either chitosan or TiO2 application was the lowest in the ecotype ‘Budakalazi’ and the highest in the ecotype ‘Khoram Abad’ (Table 7). The second experimental year had a more promoting effect as compared to the first one (a 53.66 versus a 42.07% increase; Table 7).
A better leaf hydration status (RWC) was associated with enhanced gs (R2 = 0.8392; Figure 7). Leaf Pn was positively related to both leaf gs (R2 of 0.7935) and Fv/Fm [R2 of 0.7949 (year 1) and R2 of 0.8378 (year 2), respectively; Figure 8].

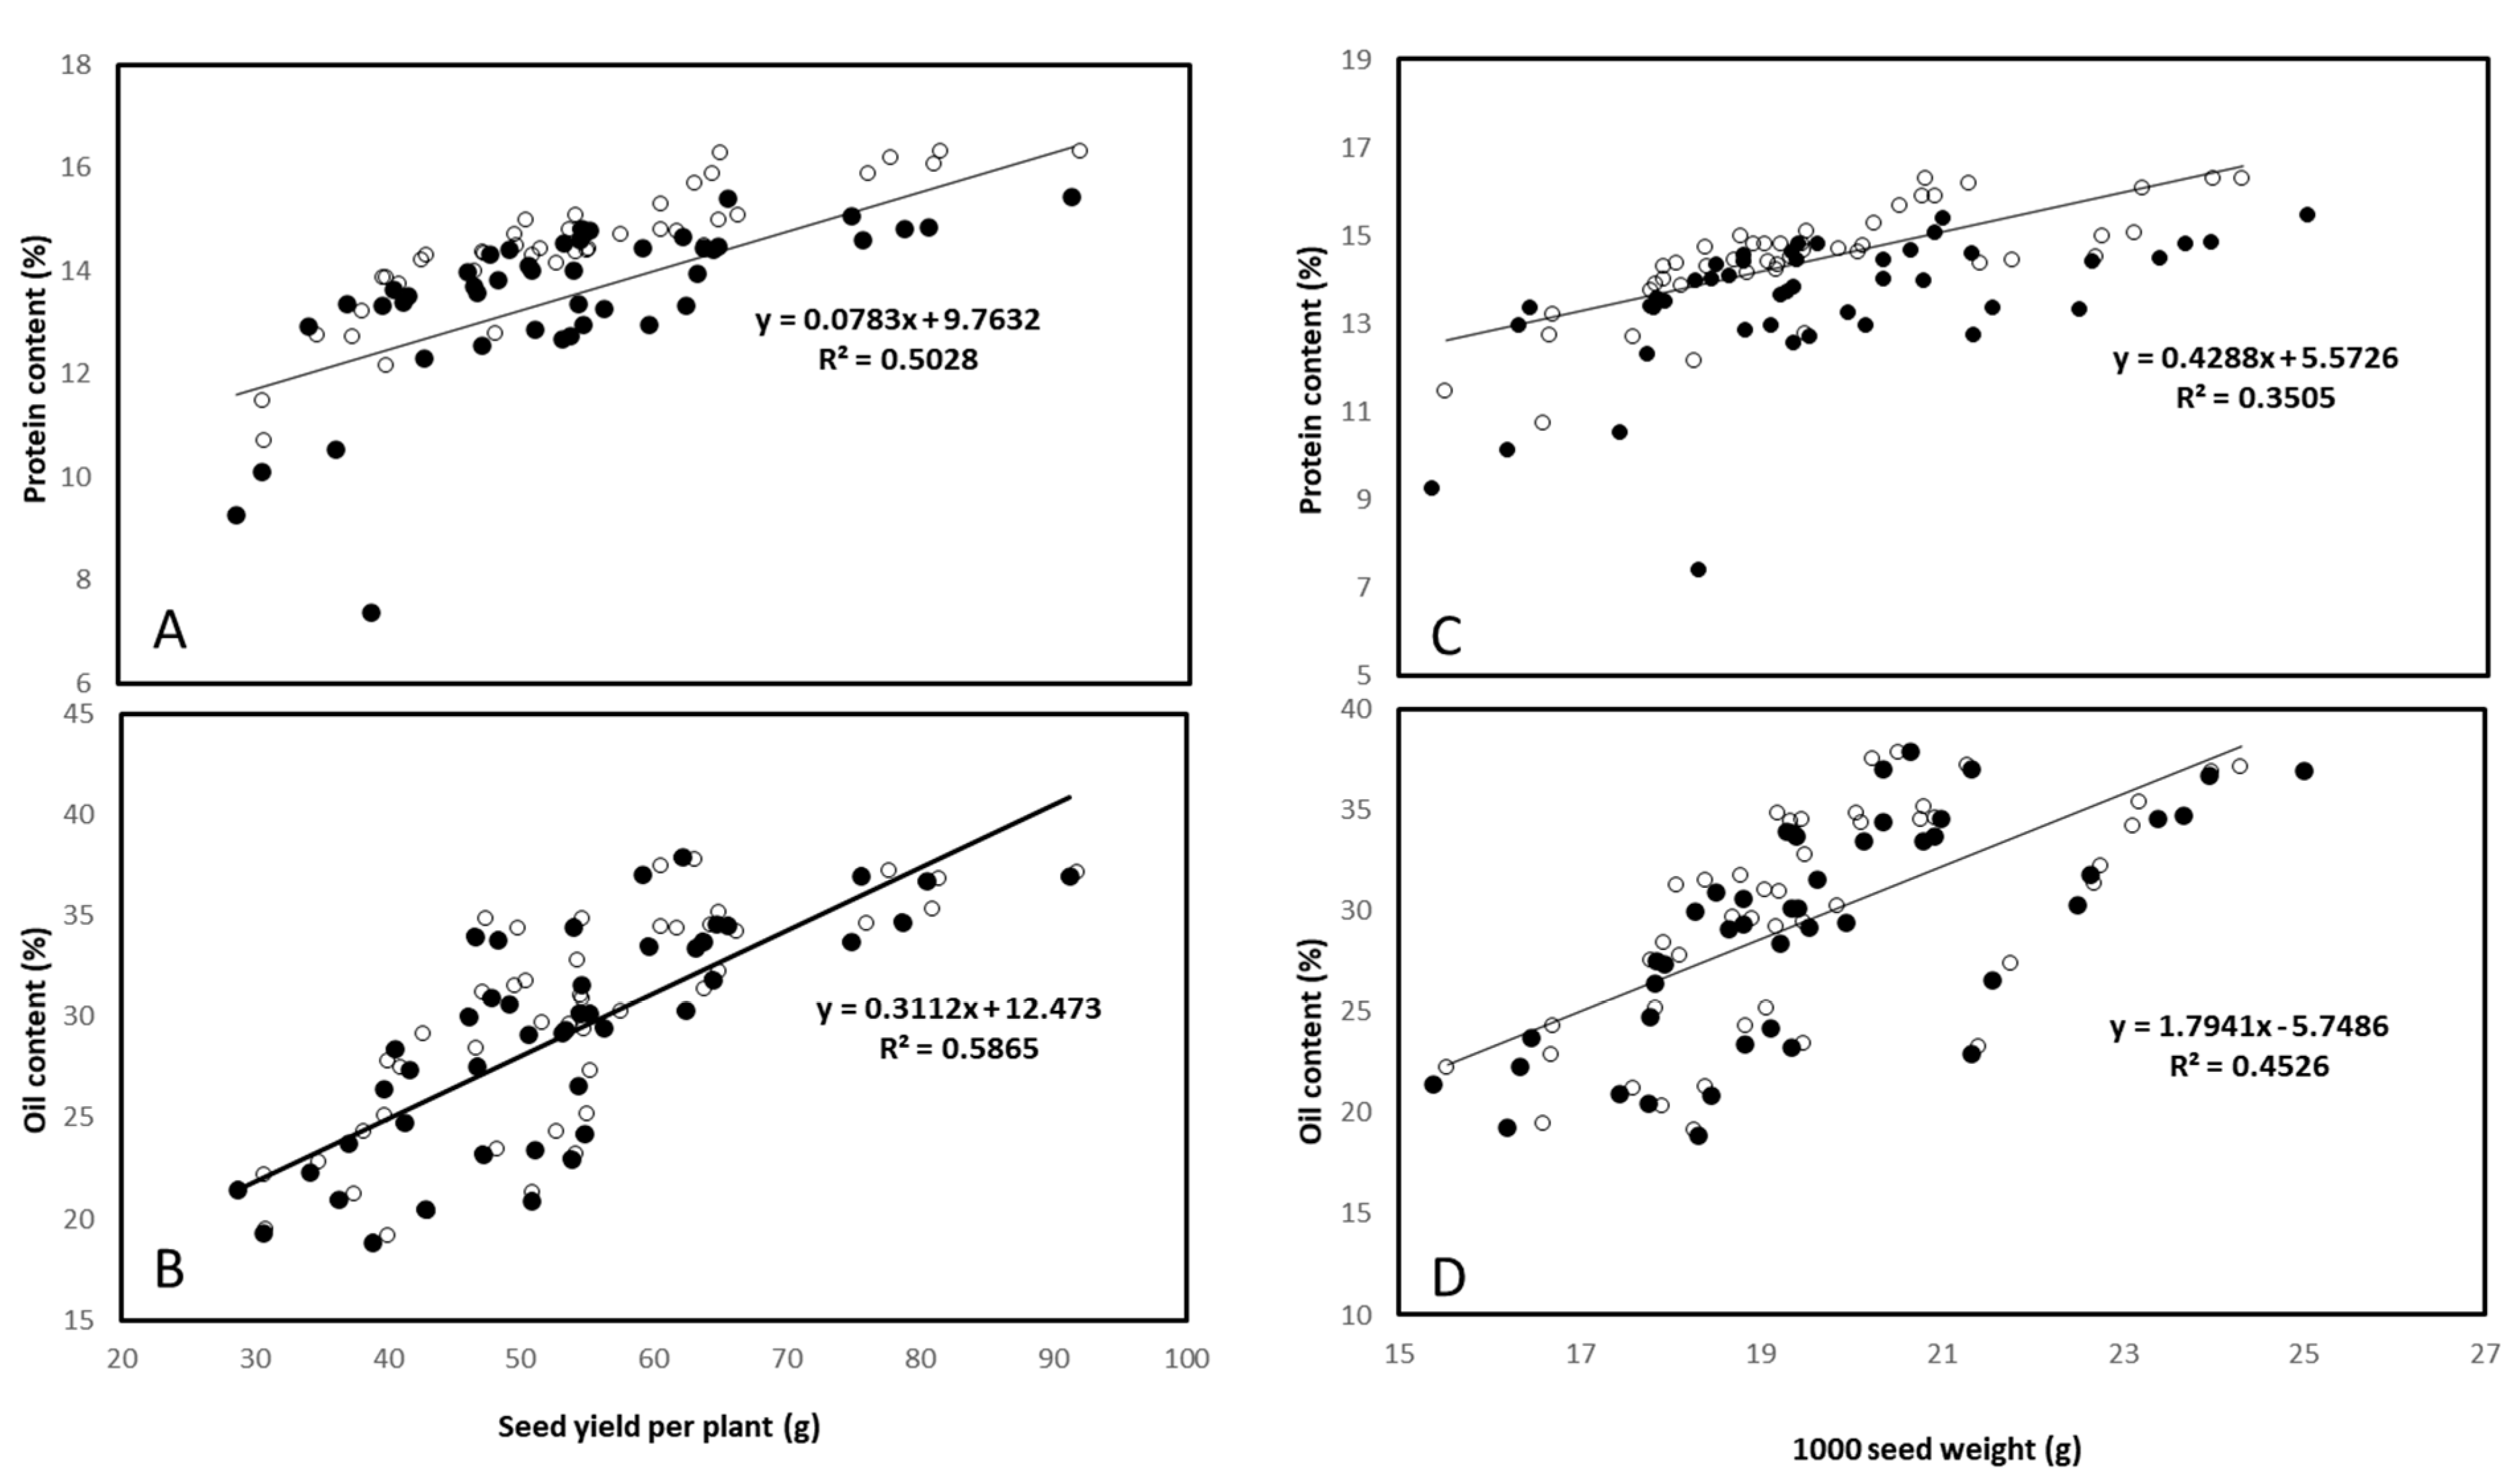
3.5. Seed Mineral, Protein, and Oil Contents

Seed mineral (N, Mg, Fe, Ti), protein, and oil contents were significantly affected by the treatments (Table 8). Mineral, as well as protein (7.38–12.78%) and oil (18.84–23.41%), contents differed between the five ecotypes (Table 9). Applying chitosan or TiO2 led to an improvement in mineral, protein (range 6.95–58.50%, average 30.92%), and oil (range 0.50–95.26%, average 45.79%) contents compared to controls (Table 9). This improvement was enhanced, when chitosan and TiO2 were in the form of NPs compared to the bulk form (a 36.95 versus a 26.83% increase; Table 9). With a single exception (Ti content), chitosan exerted a more stimulatory effect in mineral (N, Mg, Fe) content compared to TiO2 (Table 9). Chitosan also exerted a more positive effect on protein and oil contents compared to TiO2 (a 45.38 versus a 32.79% increase; Table 9). In chitosan NPs, the lowest concentration (50 mg L−1) was better in stimulating mineral, protein, and oil contents, whereas 100 mg L−1 was consistently optimal for TiO2 (Table 9).
Considering protein and oil contents collectively, the effect of either chitosan or TiO2 application was the lowest in the ecotype ‘Khomin’ and the highest in the ecotype ‘Sari’ (Table 9). Year 2 was found to have a more promoting effect as compared to year 1 (42.74 vs. 34.68%).
Seed protein and oil contents had a mild positive correlation with either seed yield per plant (Figure 9A,B) or 1000–seed weight (Figure 9C,D), indicating that a tradeoff between these traits can be critically ruled out.

4. Discussion

In this study, the optimal application form [bulk (non–structured), NPs] and concentration (50, 100 mg L−1) of chitosan and TiO2 for stimulating seed yield and quality were evaluated for two successive seasons. Genetic variation in the range these effects are expressed was addressed by studying five milk thistle ecotypes.
Chitosan and TiO2 application improved both seed yield and quality depending on the milk thistle ecotype (Table 5 and Table 9). This positive effect was consistently more prominent when applying chitosan compared to TiO2 (Table 5 and Table 9). In addition, the positive effect of either chitosan or TiO2 was always more pronounced when these were applied in the form of NPs compared to the bulk form (Table 5 and Table 9). By examining different plant traits in other taxa, the superiority of NPs compared to the bulk form has been previously suggested [13,21]. In chitosan NPs, a low concentration (50 mg L−1) was optimal for maximizing seed yield and quality (Table 5 and Table 9), suggesting a priming effect. Therefore, chitosan NPs (50 mg L−1) was proven to be the most effective means of promoting both seed yield and quality, while its effect may be maximized when selecting the appropriate (responsive) ecotype.
Chitosan and TiO2 application improved seed yield per plant (number of seeds per capitulum × individual seed weight × number of capitula) by increasing individual seed weight (recorded for both the main capitulum and the others), number of seeds (recorded for the main capitulum), and the number of capitula depending on the milk thistle ecotype (Table 9; see also Figure 5). However, the contribution of the number of capitula to the yield increase was ecotype–dependent, as manifested by the different slope of the respective curve (Figure 5B). Notably, there was no competition between the main capitulum growth (diameter) and the number of capitula per plant, since these two were positively associated with a highly significant relation, which was ecotype–dependent (Figure 6). Therefore, the components underlying the increase in seed yield per plant were the same among chitosan and TiO2, as well as between ecotypes (Table 9; see also Figure 5). Instead, the relative contribution of these components to the seed yield increase was ecotype–dependent (Figure 5B).
The number of capitula per plant has been described as a key component in increasing seed yield [51]. The results of this study validate the relation between the number of capitula per plant and the seed yield within a single ecotype while suggesting that this relation is not valid when comparing different ecotypes (Figure 5B). Therefore, for analyzing genetic differences in seed yield, it is strongly suggested that all underlying components (number of seeds per capitulum × individual seed weight × number of capitula) are examined and treated with equal importance.
Earlier studies indicated that either exposure to (biotic/abiotic) stress factors or the application of elicitors may alter milk thistle seed silymarin content, oil composition, and, in this way, the respective pharmaceutical properties [52,53,54]. For instance, chitosan application has been shown to promote silybin content [53], while chitosan NPs increased essential oil and alkaloid contents (reviewed in [55]). In the current study, chitosan and TiO2 application also improved seed quality, as expressed by protein and oil contents, depending on the milk thistle ecotype (Table 9). Clearly, there was no tradeoff between seed quality and either seed yield per plant or individual seed weight (Figure 9). Therefore, chitosan and TiO2 stimulated oil yield per plant (seed weight per plant × oil content) by increasing both underlying components (Table 5 and Table 9). Although they are features critical for pharmaceutical value [3,4,5,6], seed silymarin content and constituents, as well as oil composition, were not assessed in the present study and ought to be included in future investigations.
Chitosan and TiO2 application also enhanced seed mineral content (N, Mg, Fe, Ti) depending on the milk thistle ecotype (Table 9). Seed Ti content was the only trait for which the positive effect of TiO2 was more pronounced compared to chitosan. In other species, chitosan has also been associated with increased seed mineral content [56].
Several processes underlying the promotive effect of chitosan and TiO2 on plant growth and productivity were also evaluated. Chitosan and TiO2 application increased chlorophyll and carotenoid contents depending on the milk thistle ecotype (Table 3). The chitosan–induced increase in chlorophyll content has been earlier attributed to enhanced leaf N content [57], cytokinin accumulation (a chlorophyll–synthesis promoter; [58]), chloroplast size, and chloroplastic gene expression [59]. Chlorophyll and carotenoid contents were highly associated (Figure 4), indicating that these were equally stimulated. Chitosan and TiO2 application also increased Fv/Fm, depending on the milk thistle ecotype (Table 6), indicating improved photosynthetic efficiency. Therefore, chitosan– and TiO2–treated plants not only have elevated chlorophyll content but also chloroplasts that are able to perform photosynthesis in a more efficient context compared to the chloroplasts of untreated plants.
Chitosan and TiO2 application also improved leaf hydration status (RWC) depending on the milk thistle ecotype (Table 7). The positive effect of chitosan on plant water status has been earlier related to the improved adjustment of cell osmotic pressure [60]. Under an improved leaf hydration state, plants expressed higher gs (Figure 7). An increased gas–exchange rate (gs) and the enhanced photosynthetic efficiency (Fv/Fm) of chitosan– and TiO2–treated plants was highly and positively associated with higher Pn (Figure 8). The chitosan– and TiO2–induced increase in the photosynthesis rate and in gs has been shown previously in other species [13,21,61]. Therefore, enhanced assimilation contributed to the better milk thistle growth and productivity following chitosan and TiO2 application, and this effect is partly related to improved water relations.
Although their mode of action is not currently fully understood, accumulating evidence suggests that appropriate doses of chitosan and TiO2 bear a wide range of beneficial biological properties [55,62,63]. Elucidating the underlying mechanism(s), along with the ecological consequences, of large–scale (commercial) use will be fundamental to discovering the full benefits of these substances for both plant yield and product quality [26,55,64]. Our experiments denote that the application of either chitosan or TiO2 favorably affected the same plant processes independently of the employed type [bulk, NPs], with the former being consistently more effective than the latter. In both chitosan and TiO2, the NP form expectedly further facilitated the documented biological properties. In this way, NPs represent a more eco–friendly approach, reducing the amount of required materials [26,53,55,65].
In the present experiments, plants were cultivated following commercial practices to imitate realistic conditions and in the absence of stress, as indicated by the obtained yields. Earlier studies report that the promotive effects of chitosan and TiO2 application persist under stress conditions [53,66,67]. Under stress conditions, however, the magnitude of the effects and their relative benefits will most likely be different than those reported here [53,66,67]. From this perspective, the direct application of the obtained findings in stress environments may be treated with caution.

5. Conclusions

In this case study, the optimal form and concentration (0–100 mg L−1) of chitosan and TiO2 application for enhancing seed yield and quality were determined in five milk thistle ecotypes over two experimental years. Chitosan and TiO2 application stimulated seed yield and quality, with the former being consistenly superior. Nanoparticles (NPs) were more efficient in promoting seed yield and quality compared to the bulk (non–structured) form. A low chitosan NP concentration (50 mg L−1) was optimal, suggesting a priming effect. These effects were ecotype–dependent. Increased hydration status led to enhanced stomatal conductance, which, in association with improved Fv/Fm, contributed to a higher photosynthetic rate. Seed quality (oil, protein content) was weakly positively associated with seed weight and yield. All of the components (number of seeds per capitulum × individual seed weight × number of capitula) underlying seed yield were improved by chitosan and TiO2 application, though their relative importance was ecotype–specific. For instance, the relation of seed yield per plant with the number of capitula per plant was ecotype–dependent. In conclusion, chitosan and TiO2 in either form improved seed yield and quality, while chitosan NPs were most effective. On this basis, chitosan NPs represent a cost–effective and environmentally friendly avenue to stimulate both productivity and quality.

Supplementary Materials

The following supporting information can be downloaded at https://www.mdpi.com/article/10.3390/agronomy12081827/s1, Table S1: Temperature, relative air humidity, and precipitation data in the field site across the two experimental years (2019/2020 and 2020/2021); Table S2: Effects of chitosan and titanium dioxide (denoted as Ch and Ti, respectively) treatments [bulk, nanoparticle (NP)] applied at three concentrations (0, 50 and 100 mg L−1) for two successive seasons (2019/2020 and 2020/2021) on net photosynthetic rate (Pn) and stomatal conductance (gs) of five milk thistle ecotypes. Three plants per treatment were assessed. Different letters within a column indicate statistically significant differences (p < 0.05); Table S3: Effects of chitosan and titanium dioxide (denoted as Ch and Ti, respectively) treatments [bulk, nanoparticle (NP)] applied at three concentrations (0, 50 and 100 mg L−1) for two successive seasons (2019/2020 and 2020/2021) on transpiration rate (Tr) and ratio of variable to maximum fluorescence (Fv/Fm) of five milk thistle ecotypes. Three plants per treatment were assessed. Different letters within a column indicate statistically significant differences (p < 0.05); Table S4: Effects of chitosan and titanium dioxide (denoted as Ch and Ti, respectively) treatments [bulk, nanoparticle (NP)] applied at three concentrations (0, 50 and 100 mg L−1) for two successive seasons (2019/2020, and 2020/2021) on seed N, and protein contents of five milk thistle ecotypes. Three plants per treatment were assessed. Different letters within a column indicate statistically significant differences (p < 0.05).

Author Contributions

Conceptualisation, S.M.-F.; methodology, S.M.-F. and S.J.; software, S.M.-F., N.N. and D.F.; validation, S.M.-F., H.M. and D.F.; formal analysis, S.M.-F., N.N. and D.F.; resources, S.M.-F. and K.S.; data curation, S.M.-F., S.J. and D.F.; writing–original draft preparation, S.J., S.M.-F., A.R.N. and D.F.; writing–review and editing, S.M.-F., N.N. and D.F.; supervision, S.M.-F.; project administration, and funding acquisition, S.M.-F., All authors have read and agreed to the published version of the manuscript.

Funding

This research received no external funding.

Data Availability Statement

Raw data are available upon request from the corresponding author.

Acknowledgments

The authors gratefully acknowledge the laboratory staff for their contributions, continued diligence, and dedication to their craft. The valuable comments of the editor and two anonymous reviewers are greatly appreciated.

Conflicts of Interest

All authors declare no conflict of interest.

Abbreviations

Fv/Fm: ratio of variable to maximum fluorescence; gs, stomatal conductance; NPs, nanoparticles; Pn, net photosynthetic rate; RWC, relative water content; TiO2, titanium dioxide; TPP, tripolyphosphate; Tr, transpiration.

References

  1. Khan, M.A.; Blackshaw, R.E.; Marwat, K.B. Biology of milk thistle (Silybum marianum) and the management options for growers in north-western Pakistan. Weed Biol. Manag. 2009, 9, 99–105. [Google Scholar] [CrossRef]
  2. Bielski, S. Milk thistle (Silybum marianum L. Gaertn.) achene yield had a positive response to nitrogen fertilization, row spacing, sowing date, and weed control methods. Ind. Crops Prod. 2021, 160, 113104. [Google Scholar] [CrossRef]
  3. Zhang, Z.S.; Wang, S.; Liu, H.; Li, B.Z.; Che, L. Constituents and thermal properties of milk thistle seed oils extracted with three methods. LWT 2020, 126, 109282. [Google Scholar] [CrossRef]
  4. Haban, M.; Otepka, P.; Kobida, L.; Habanova, M. Production and quality of milk thistle (Silybum marianum L. Gaertn.) cultivated in cultural conditions of warm agri–climatic macroregion. Hortic. Sci. 2009, 36, 69–74. [Google Scholar] [CrossRef] [Green Version]
  5. Karkanis, A.; Bilalis, D.; Efthimiadou, A. Cultivation of milk thistle (Silybum marianum L. Gaertn.), a medicinal weed. Ind. Crops Prod. 2011, 34, 825–830. [Google Scholar] [CrossRef]
  6. Alemardan, A.; Karkanis, A.; Salehi, R. Breeding Objectives and Selection Criteria for Milk Thistle [Silybum marianum L. Gaertn.] Improvement. Not. Bot. Horti Agrobot. Cluj Napoca 2013, 41, 340–347. [Google Scholar] [CrossRef] [Green Version]
  7. Lukic, I.; Milovanovic, S.; Pantic, M.; Srbljak, I.; Djuric, A.; Tadic, V.; Tyśkiewicz, K. Separation of high–value extracts from Silybum marianum seeds: Influence of extraction technique and storage on composition and bioactivity. LWT 2022, 160, 113319. [Google Scholar] [CrossRef]
  8. Grajzer, M.; Szmalcel, K.; Kuźmiński, Ł.; Witkowski, M.; Kulma, A.; Prescha, A. Characteristics and antioxidant potential of cold–pressed oils—Possible strategies to improve oil stability. Foods 2020, 9, 1630. [Google Scholar] [CrossRef] [PubMed]
  9. Rahal, N.B.; Barba, F.J.; Barth, D.; Chevalot, I. Supercritical CO2 extraction of oil, fatty acids and flavonolignans from milk thistle seeds: Evaluation of their antioxidant and cytotoxic activities in Caco–2 cells. Food Chem. Toxicol. 2015, 83, 275–282. [Google Scholar] [CrossRef]
  10. Bárta, J.; Bártová, V.; Jarošová, M.; Švajner, J.; Smetana, P.; Kadlec, J.; Filip, V.; Kyselka, J.; Berčíková, M.; Zdráhal, Z.; et al. Oilseed Cake Flour Composition, Functional Properties and Antioxidant Potential as Effects of Sieving and Species Differences. Foods 2021, 10, 2766. [Google Scholar] [CrossRef] [PubMed]
  11. Liava, V.; Karkanis, A.; Tsiropoulos, N. Yield and silymarin content in milk thistle (Silybum marianum L. Gaertn.) fruits affected by the nitrogen fertilizers. Ind. Crops Prod. 2021, 171, 113955. [Google Scholar] [CrossRef]
  12. Malerba, M.; Cerana, R. Chitosan effects on plant systems. Int. J. Mol. Sci. 2016, 17, 996. [Google Scholar] [CrossRef] [PubMed]
  13. Malerba, M.; Cerana, R. Recent advances of chitosan applications in plants. Polymers 2018, 10, 118. [Google Scholar] [CrossRef] [PubMed] [Green Version]
  14. Mohammadi, H.; Aghaee Dizaj, L.; Aghaee, A.; Ghorbanpour, M. Chitosan–mediated changes in dry matter, total phenol content and essential oil constituents of two origanum species under water deficit stress. Gerund Pflanz. 2021, 73, 181–191. [Google Scholar] [CrossRef]
  15. Rabêlo, V.M.; Magalhães, P.C.; Bressanin, L.A.; Carvalho, D.T.; Reis, C.O.D.; Karam, D.; Doriguetto, A.C.; Santos, M.H.D.; Santos Filho, P.R.D.S.; Souza, T.C.D. The foliar application of a mixture of semisynthetic chitosan derivatives induces tolerance to water deficit in maize, improving the antioxidant system and increasing photosynthesis and grain yield. Sci. Rep. 2019, 9, 8164. [Google Scholar] [CrossRef] [PubMed]
  16. Hafez, Y.; Attia, K.; Alamery, S.; Ghazy, A.; Al–Doss, A.; Ibrahim, E.; Rashwan, E.; El–Maghraby, L.; Awad, A.; Abdelaal, K. Beneficial effects of biochar and chitosan on antioxidative capacity, osmolytes accumulation, and anatomical characters of water–stressed barley plants. Agronomy 2020, 10, 630. [Google Scholar] [CrossRef]
  17. Bakhoum, G.S.; Sadak, M.S.; Badr, E.A.E.M. Mitigation of adverse effects of salinity stress on sunflower plant (Helianthus annuus L.) by exogenous application of chitosan. Bull. Natl. Res. Cent. 2020, 44, 79. [Google Scholar] [CrossRef]
  18. Kahromi, S.; Khara, J. Chitosan stimulates secondary metabolite production and nutrient uptake in medicinal plant Dracocephalum kotschyi. Sci. Food Agric. 2021, 101, 3898–3907. [Google Scholar] [CrossRef]
  19. Tantawy, I.A.A.; Soltan, H.H.; Ezzat, A.S. Efficiency of foliar application by chitosan and royal jelly on growth, yield and quality of two garlic cultivars. SVU Int. J. Agric. Sci. 2021, 3, 119–131. [Google Scholar] [CrossRef]
  20. Saad–Allah, K.M.; Fetouh, M.I.; Elhaak, M.A. Induction of milk thistle (Silybum marianum L. Gaertn) growth and phytochemicals production by natural stimulants. J. Appl. Res. Med. Aromat. Plants 2017, 6, 101–110. [Google Scholar] [CrossRef]
  21. Ahmad, B.; Shabbir, A.; Jaleel, H.; Khan, M.M.A.; Sadiq, Y. Efficacy of titanium dioxide nanoparticles in modulating photosynthesis, peltate glandular trichomes and essential oil production and quality in Mentha piperita L. Curr. Plant Biol. 2018, 13, 6–15. [Google Scholar] [CrossRef]
  22. Khater, R.M.; Sabry, R.M.; Pistelli, L.; Abd–ElGawad, A.M.; Soufan, W.; El–Gendy, A.N.G. Effect of Compost and Titanium Dioxide Application on the Vegetative Yield and Essential Oil Composition of Coriander. Sustainability 2021, 14, 322. [Google Scholar] [CrossRef]
  23. Hussain, S.; Shafiq, I.; Chattha, M.S.; Mumtaz, M.; Brestic, M.; Rastogi, A.; Chen, G.; Allakhverdiev, S.I.; Liu, W.; Yang, W. Effect of Ti treatments on growth, photosynthesis, phosphorus uptake and yield of soybean (Glycine max L.) in maize–soybean relay strip intercropping. Environ. Exp. Bot. 2021, 187, 104476. [Google Scholar] [CrossRef]
  24. Janmohammadi, M.; Mohamadi, N.; Shekari, F.; Abbasi, A.; Esmailpour, M. The effects of silicon and titanium on safflower (Carthamus tinctorius L.) growth under moisture deficit condition. Acta. Agric. Slov. 2017, 109, 443–455. [Google Scholar] [CrossRef] [Green Version]
  25. Mohammadhassan, R.; Ferdosi, A.; Seifalian, A.M.; Seifalian, M.; Malmir, S. Nanoelicitors Application Promote Antioxidant Capacity of Asparagus officinalis (In Vitro). J. Trop. Life Sci. 2021, 11, 259–265. [Google Scholar] [CrossRef]
  26. Sathiyabama, M.; Manikandan, A. Chitosan nanoparticle induced defense responses in finger millet plants against blast disease caused by Pyricularia Grisea. Carbohydr. Polym. 2021, 154, 241–246. [Google Scholar] [CrossRef] [PubMed]
  27. Behnam, H.; Feizi, H.; Alipanah, M. Alleviation the effects of salinity stress using titanium dioxide nano and bulk particles in Echinacea seeds and seedlings. Adv. Hortic. Sci. 2021, 35, 351–360. [Google Scholar] [CrossRef]
  28. Aghdam, M.T.B.; Mohammadi, H.; Ghorbanpour, M. Effects of nanoparticulate anatase titanium dioxide on physiological and biochemical performance of Linum usitatissimum (Linaceae) under well–watered and drought stress conditions. Rev. Bras. Bot. 2016, 39, 139–146. [Google Scholar] [CrossRef]
  29. Asgari–Targhi, G.; Iranbakhsh, A.; Ardebili, Z.O. Potential benefits and phytotoxicity of bulk and nano–chitosan on the growth, morphogenesis, physiology, and micropropagation of Capsicum annuum. Plant Physiol. Biochem. 2018, 127, 393–402. [Google Scholar] [CrossRef]
  30. Jafari, L.; Abdollahi, F.; Feizi, H.; Adl, S. Improved Marjoram (Origanum majorana L.) Tolerance to Salinity with Seed Priming Using Titanium Dioxide (TiO2). Iran. J. Sci. Technol. Trans. Sci. 2022, 46, 361–371. [Google Scholar] [CrossRef]
  31. Lei, C.; Ma, D.; Pu, G.; Qiu, X.; Du, Z.; Wang, H.; Liu, B. Foliar application of chitosan activates artemisinin biosynthesis in Artemisia annua L. Ind. Crops Prod. 2011, 33, 176–182. [Google Scholar] [CrossRef]
  32. Mumivand, H.; Shayganfar, A.; Tsaniklidis, G.; Emami Bistgani, Z.; Fanourakis, D.; Nicola, S. Pheno–Morphological and Essential Oil Composition Responses to UVA Radiation and Protectants: A Case Study in Three Thymus Species. Horticulturae 2022, 8, 31. [Google Scholar] [CrossRef]
  33. Yousefzadeh, K.; Houshmand, S.; Shiran, B.; Mousavi–Fard, S.; Zeinali, H.; Nikoloudakis, N.; Gheisari, M.M.; Fanourakis, D. Joint Effects of Developmental Stage and Water Deficit on Essential Oil Traits (Content, Yield, Composition) and Related Gene Expression: A Case Study in Two Thymus Species. Agronomy 2022, 12, 1008. [Google Scholar] [CrossRef]
  34. Safari, M.; Mousavi–Fard, S.; Rezaei Nejad, A.; Sorkheh, K.; Sofo, A. Exogenous salicylic acid positively affects morpho–physiological and molecular responses of Impatiens walleriana plants grown under drought stress. Int. J. Environ. Sci. Technol. 2021, 19, 969–984. [Google Scholar] [CrossRef]
  35. Anitha, A.; Rani, V.D.; Krishna, R.; Sreeja, V.; Selvamurugan, N.; Nair, S.V.; Tamura, h.; Jayakumar, R. Synthesis, characterization, cytotoxicity and antibacterial studies of chitosan, O–carboxymethyl and N, O–carboxymethyl chitosan nanoparticles. Carbohydr. Polym. 2009, 78, 672–677. [Google Scholar] [CrossRef]
  36. Zomorrodi, N.; Rezaei Nejad, A.; Mousavi–Fard, S.; Feizi, H.; Tsaniklidis, G.; Fanourakis, D. Potency of titanium dioxide nanoparticles, sodium hydrogen sulfide and salicylic acid in ameliorating the depressive effects of water deficit on periwinkle ornamental quality. Horticulturae 2022, 8, 675. [Google Scholar] [CrossRef]
  37. Ivani, R.; Sanaei Nejad, S.H.; Ghahraman, B.; Astaraei, A.R.; Feizi, H. Role of bulk and Nanosized SiO2 to overcome salt stress during Fenugreek germination (Trigonella foenumgraceum L.). Plant Signal. Behav. 2018, 13, e1044190. [Google Scholar] [CrossRef] [Green Version]
  38. Ahmadi–Majd, M.; Mousavi–Fard, S.; Rezaei Nejad, A.; Fanourakis, D. Carbon nanotubes in the holding solution stimulate flower opening and prolong vase life in carnation. Chem. Biol. Technol. Agric. 2022, 9, 15. [Google Scholar] [CrossRef]
  39. Ahmadi–Majd, M.; Rezaei Nejad, A.; Mousavi–Fard, S.; Fanourakis, D. Postharvest application of single, multi–walled carbon nanotubes and nanographene oxide improves rose keeping quality. J. Hortic. Sci. Biotechnol. 2022, 97, 346–360. [Google Scholar] [CrossRef]
  40. Lichtenthaler, H.K.; Wellburn, A.R. Determinations of total carotenoids and chlorophylls a and b of leaf extracts in different solvents. Biochem. Soc. Trans. 1983, 11, 591–592. [Google Scholar] [CrossRef] [Green Version]
  41. Seif, M.; Aliniaeifard, S.; Arab, M.; Mehrjerdi, M.Z.; Shomali, A.; Fanourakis, D.; Li, T.; Woltering, E. Monochromatic red light during plant growth decreases the size and improves the functionality of stomata in chrysanthemum. Funct. Plant Biol. 2021, 48, 515–528. [Google Scholar] [CrossRef] [PubMed]
  42. Taheri–Garavand, A.; Rezaei Nejad, A.; Fanourakis, D.; Fatahi, S.; Ahmadi–Majd, M. Employment of artificial neural networks for non–invasive estimation of leaf water status using color features: A case study in Spathiphyllum wallisii. Acta. Physiol. Plant. 2021, 43, 78. [Google Scholar] [CrossRef]
  43. Sørensen, H.K.; Fanourakis, D.; Tsaniklidis, G.; Bouranis, D.; Nejad, A.R.; Ottosen, C.O. Using artificial lighting based on electricity price without a negative impact on growth, visual quality or stomatal closing response in Passiflora. Sci. Hortic. 2020, 267, 109354. [Google Scholar] [CrossRef]
  44. Javadi Asayesh, E.; Aliniaeifard, S.; Askari, N.; Roozban, M.R.; Sobhani, M.; Tsaniklidis, G.; Woltering, E.J.; Fanourakis, D. Supplementary light with increased blue fraction accelerates emergence and improves development of the inflorescence in Aechmea, Guzmania and Vriesea. Horticulturae 2021, 7, 485. [Google Scholar] [CrossRef]
  45. Yang, L.; Fanourakis, D.; Tsaniklidis, G.; Li, K.; Yang, Q.; Li, T. Contrary to red, blue monochromatic light improves the bioactive compound content in broccoli sprouts. Agronomy 2021, 11, 2139. [Google Scholar] [CrossRef]
  46. Estaji, A.; Souri, M.K.; Omidbaigi, R. Evaluation of different levels of nitrogen and flower pruning on milk thistle (Silybum marianum L.) yield and fatty acids. J. Med. Spice Plants 2011, 16, 170–175. [Google Scholar]
  47. Chatzistathis, T.; Fanourakis, D.; Aliniaeifard, S.; Kotsiras, A.; Delis, C.; Tsaniklidis, G. Leaf age–dependent effects of boron toxicity in two cucumis melo varieties. Agronomy 2021, 11, 759. [Google Scholar] [CrossRef]
  48. Chapman, H.D.; Pratt, P.F. Methods of analysis for soils, plants and waters. Soil. Sci. 1962, 93, 68. [Google Scholar] [CrossRef] [Green Version]
  49. Waling, I.; Van Vark, W.; Houba, V.J.G.; Van der Lee, J.J. Soil and plant analysis, a series of syllabi: Part 7. In Plant Analysis Procedures; Wageningen Agriculture University: Wageningen, The Netherlands, 1989. [Google Scholar]
  50. Bishni, U.R.; Hughes, I.L. Agronomic performance and protein content of fall planted triticale, wheat and Rye. Agronomy 1979, 71, 359–360. [Google Scholar] [CrossRef]
  51. Qavami, N.; Labbafi, M.R.; Dehghani–Meshkani, M.R.; Mehrafarin, A. Determination of seed and oil yield and yield components in two variety of milk thistle (Silybum marianum Gaetrn.) based on path analysis and regression. J. Med. Plant 2012, 11, 78–85. [Google Scholar]
  52. Yaghoubian, I.; Antar, M.; Ghassemi, S.; Modarres–Sanavy, S.A.M.; Smith, D.L. The Effects of Hydro–Priming and Colonization with Piriformospora indica and Azotobacter chroococcum on Physio–Biochemical Traits, Flavonolignans and Fatty Acids Composition of Milk Thistle (Silybum marianum) under Saline Conditions. Plants 2022, 11, 1281. [Google Scholar] [CrossRef] [PubMed]
  53. Ghanbari Moheb Seraj, R.; Behnamian, M.; Ahmadikhah, A.; Shariati, V.; Dezhsetan, S. Chitosan and salicylic acid regulate morpho–physiological and phytochemical parameters and improve water–deficit tolerance in milk thistle (Silybum marianum L.). Acta. Physiol. Plant 2021, 43, 101. [Google Scholar] [CrossRef]
  54. Zangani, E.; Zehtab–Salmasi, S.; Andalibi, B.; Zamani, A.A.; Hashemi, M. Exogenous nitric oxide improved production and content of flavonolignans in milk thistle seeds under water deficit system. Acta. Physiol. Plant. 2021, 43, 87. [Google Scholar] [CrossRef]
  55. Balusamy, S.R.; Rahimi, S.; Sukweenadhi, J.; Sunderraj, S.; Shanmugam, R.; Thangavelu, L.; Mijakovic, I.; Perumalsamy, H. Chitosan, chitosan nanoparticles and modified chitosan biomaterials, a potential tool to combat salinity stress in plants. Carbohydr. Polym. 2022, 284, 119189. [Google Scholar] [CrossRef]
  56. Dzung, N.A.; Khanh, V.T.P.; Dzung, T.T. Research on impact of chitosan oligomers on biophysical characteristics, growth, development and drought resistance of coffee. Carbohydr. Polym. 2011, 84, 751–755. [Google Scholar] [CrossRef]
  57. Behboudi, F.; Tahmasebi–Sarvestani, Z.; Kassaee, M.Z.; Modarres–Sanavy, S.A.M.; Sorooshzadeh, A.; Mokhtassi–Bidgoli, A. Evaluation of chitosan nanoparticles effects with two application methods on wheat under drought stress. J. Plant Nutr. 2019, 42, 1439–1451. [Google Scholar] [CrossRef]
  58. Abdelaal, K.; Attia, K.A.; Niedbała, G.; Wojciechowski, T.; Hafez, Y.; Alamery, S.; Alateeq, T.K.; Arafa, S.A. Mitigation of drought damages by exogenous chitosan and yeast extract with modulating the photosynthetic pigments, antioxidant defense system and improving the productivity of garlic plants. Horticulturae 2021, 7, 510. [Google Scholar] [CrossRef]
  59. Limpanavech, P.; Chaiyasuta, S.; Vongpromek, R.; Pichyangkura, R.; Khunwasi, C.; Chadchawan, S.; Lotrakul, P.; Bunjongrat, R.; Chaidee, A.; Bangyeekhun, T. Chitosan effects on floral production, gene expression, and anatomical changes in the Dendrobium orchid. Sci. Hortic. 2008, 116, 65–72. [Google Scholar] [CrossRef]
  60. Guan, Y.J.; Hu, J.; Wang, X.J.; Shao, C.X. Seed priming with chitosan improves maize germination and seedling growth in relation to physiological changes under low temperature stress. J. Zhejiang Univ. Sci. B 2009, 10, 427–433. [Google Scholar] [CrossRef] [Green Version]
  61. Van, S.N.; Minh, H.D.; Anh, D.N. Study on chitosan nanoparticles on biophysical characteristics and growth of Robusta coffee in green house. Biocatal. Agric. Biotechnol. 2013, 2, 289–294. [Google Scholar]
  62. Ramadan, T.; Sayed, S.A.; Abd–Elaal, A.K.; Amro, A. The combined effect of water deficit stress and TiO2 nanoparticles on cell membrane and antioxidant enzymes in Helianthus annuus L. Physiol. Mol. Biol Plants 2022, 28, 391–409. [Google Scholar] [CrossRef] [PubMed]
  63. Gohari, G.; Mohammadi, A.; Akbari, A.; Panahirad, S.; Dadpour, M.R.; Fotopoulos, V.; Kimura, S. Titanium dioxide nanoparticles (TiONPs) promote growth and ameliorate salinity stress effects on essential oil profile and biochemical attributes of Dracocephalum Moldavica. Sci. Rep. 2020, 10, 912. [Google Scholar] [CrossRef]
  64. Shabbir, A.; Khan, M.M.A.; Ahmad, B.; Sadiq, Y.; Jaleel, H.; Uddin, M. Efficacy of TiO2 nanoparticles in enhancing the photosynthesis, essential oil and khusimol biosynthesis in Vetiveria zizanioides L. Nash. Photosynth. 2019, 57, 599–606. [Google Scholar] [CrossRef] [Green Version]
  65. Sheikhalipour, M.; Esmaielpour, B.; Behnamian, M.; Gohari, G.; Giglou, M.T.; Vachova, P.; Rastogi, A.; Brestic, M.; Skalicky, M. Chitosan–selenium nanoparticle (Cs–Se NP) foliar spray alleviates salt stress in bitter melon. Nanomaterials 2021, 11, 684. [Google Scholar] [CrossRef] [PubMed]
  66. Hidangmayum, A.; Dwivedi, P. Chitosan Based Nanoformulation for Sustainable Agriculture with Special Reference to Abiotic Stress: A Review. J. Polym. Environ. 2022, 30, 1264–1283. [Google Scholar] [CrossRef]
  67. Kolesnikov, L.E.; Popova, E.V.; Novikova, I.I.; Kolesnikova, Y.R.; Balagurova, E.D. Application of Chitosan to Protect Wheat from Diseases and Boost Yields. Appl. Biochem. Microbiol. 2022, 58, 329–335. [Google Scholar] [CrossRef]
Figure 1. Representative field-emission scanning electron microscope image of chitosan nanoparticles.
Agronomy 12 01827 g001
Figure 2. Representative high-resolution transmission electron microscopy image (A) and X-ray diffraction pattern of TiO2 nanoparticles (B).
Agronomy 12 01827 g002
Figure 3. Representative field-emission scanning electron microscope image of untreated leaf (A), as well as leaf treated with either chitosan (B) or TiO2 (C) nanoparticles.
Agronomy 12 01827 g003
Figure 4. Leaf chlorophyll content as a function of leaf carotenoid content in five milk thistle ecotypes (‘Ahvaz’, ‘Budakalazi’, ‘Khomin’, ‘Khoram Abad’, and ‘Sari’), cultivated under the application of chitosan or TiO2 treatments (bulk, NPs) at three concentrations (0, 50, and 100 mg L−1). Data of all ecotypes and treatments were pooled across years (Year 1, open symbols; Year 2, closed symbols). FW, fresh weight.
Agronomy 12 01827 g004
Figure 5. Main capitulum diameter (A), number of capitula per plant (B), 1000–seed weight (C), seed weight of the main capitulum (D), and number of seeds in the main capitulum (E) as a function of seed yield per plant in five milk thistle ecotypes (‘Ahvaz’, ‘Budakalazi’, ‘Khomin’, ‘Khoram Abad’, and ‘Sari’), cultivated under application of chitosan or TiO2 treatments (bulk, nanoparticles) at three concentrations (0, 50, and 100 mg L−1). Data of all ecotypes and treatments were pooled across years (Year 1, open symbols; Year 2, closed symbols). In panels A and B, the dashed lines represent ecotype ‘Khoram Abad’ (denoted by squares), which was analyzed separately from the remaining four ecotypes.
Agronomy 12 01827 g005
Figure 6. Number of capitula per plant (A), seed weight of the main capitulum (B), and number of seeds in the main capitulum (C) as a function of the main capitulum diameter in five milk thistle ecotypes (‘Ahvaz’, ‘Budakalazi’, ‘Khomin’, ‘Khoram Abad’, and ‘Sari’), cultivated under the application of chitosan or TiO2 treatments (bulk, nanoparticles) at three concentrations (0, 50, and 100 mg L−1). Data of all ecotypes and treatments were pooled across years (Year 1, open symbols; Year 2, closed symbols). In all panels, the dashed lines represent the ecotype ‘Khoram Abad’ (denoted by squares), which was analyzed separately from the remaining four ecotypes.
Agronomy 12 01827 g006
Figure 7. Leaf stomatal conductance (gs) as a function of relative water content (RWC) in five milk thistle ecotypes (‘Ahvaz’, ‘Budakalazi’, ‘Khomin’, ‘Khoram Abad’, and ‘Sari’), cultivated under the application of chitosan or TiO2 treatments (bulk, nanoparticles) at three concentrations (0, 50, and 100 mg L−1). Data of all ecotypes and treatments were pooled across years (Year 1, open symbols; Year 2, closed symbols).
Agronomy 12 01827 g007
Figure 8. Leaf net photosynthetic rate (Pn) as a function of stomatal conductance (gs; (A)) and chlorophyll fluorescence (Fv/Fm; (B)) in five milk thistle ecotypes (‘Ahvaz’, ‘Budakalazi’, ‘Khomin’, ‘Khoram Abad’, and ‘Sari’), cultivated under application of chitosan or TiO2 treatments (bulk, nanoparticles) at three concentrations (0, 50, and 100 mg L−1). Data of all ecotypes and treatments were pooled across years (Year 1, open symbols; Year 2, closed symbols).
Agronomy 12 01827 g008
Figure 9. Seed protein and oil content as a function of seed yield per plant ((A) and (B), respectively) and of 1000–seed weight ((C) and (D), respectively) in five milk thistle ecotypes (‘Ahvaz’, ‘Budakalazi’, ‘Khomin’, ‘Khoram Abad’, and ‘Sari’), cultivated under the application of chitosan or TiO2 treatments (bulk, nanoparticles) at three concentrations (0, 50, and 100 mg L−1). Data of all ecotypes and treatments were pooled across years (Year 1, open symbols; Year 2, closed symbols).
Agronomy 12 01827 g009
Table 1. Experimental field soil properties across the two experimental years (2019/2020 and 2020/2021).
ParameterYear
2019/2020 2020/2021
Sand (%)22.522.1
Slit (%)32.232.5
Clay (%)45.345.4
Electrical conductivity (dS m−1)2.42.3
Organic carbon (%)0.40.43
N (%)0.060.058
P (ppm)11.812.04
K (ppm)275268
Table 2. Analysis of variance on the effects of chitosan and titanium dioxide treatments (bulk, nanoparticles) on stem length and leaf photosynthetic pigment content of five milk thistle ecotypes.
Mean Square
S.O.VdfStem LengthChlorophyll ContentCarotenoid Content
Year (Y)112.03 ns1.16 ns0.014 ns
Replication (Year) (Ea)41.670.430.03
Cultivar (Cul)43357.06 **24.13 **3.34 **
Compound (Com)8547.87 **134.93 **6.09 **
Cul × Y40.20 ns0.09 ns0.006 **
Com × Y81.17 ns0.53 ns0.02 ns
Cul × Com3227.16 **1.20 **0.22 **
Cul × Com × Y321.08 ns0.16 ns0.01 ns
Error (Eb)1762.460.290.02
CV (%) 1.014.946.65
ns, not significant; **, significant at 0.01 probability level.
Table 3. Effects of chitosan and titanium dioxide (denoted as Ch and Ti, respectively) treatments [bulk, nanoparticle (NP)] applied at three concentrations (0, 50, and 100 mg L−1) on stem length and leaf photosynthetic pigment content of five milk thistle ecotypes. Three plants per treatment were assessed. Different letters within a column indicate statistically significant differences (p < 0.05). FW, fresh weight.
EcotypeCompound/Concentration (mg L−1)Stem Length (cm)Chlorophyll Content (mg g−1 FW)Carotenoid Content (mg g−1 FW)
‘Sari’Control140.66 b7.69 v1.56 t
Ti 50143 a8.91 r-t1.84 o-q
Ti 100145.83 xy10.62 mn1.89 n-q
Ti NP 50146.33 w–y11.67 i–k2.31 gh
Ti NP 100147.83 vw12.05 h–j2.40 g
Ch 50145.5 yz10.72 mn2 l–o
Ch 100146.83 v–y11.21 k–m2.10 j–l
Ch NP 50151.83 p–s14.89 b3.12 c
Ch NP 100150.66 r–t12.84 fg2.67 ef
‘Khomin’Control147.5 v–x7.37 v1.16 u
Ti 50149.83 tu9.33 p–s1.58 t
Ti 100150.33 st9.89 op1.82 p–r
Ti NP 50152.16 o–r11.83 ij2.16 h–l
Ti NP 100153.33 n–q12.76 fg2.17 h–k
Ch 50150.33 st10.43 no1.77 p–s
Ch 100153 n–q11.47 j–l2.10 j–l
Ch NP 50156.83 jk14.25 c3.13 c
Ch NP 100154.66 l–n13.08 ef2.57 f
‘Khorramabad’Control158.33 ij7.51 v1.31 u
Ti 50160.5 gh8.37 tu1.64 st
Ti 100161.66 fg954 qr1.67 r–t
Ti NP 50163.83 de10.63 mn2.06 k–m
Ti NP 100168.66 c11.44 j–l2.16 h–l
Ch 50163 ef9.03 q–s1.87 n–q
Ch 100163.83 de9.93 pq2.07 j–m
Ch NP 50179.66 a13.16 d–f2.28 g–i
Ch NP 100177.66 b11.92 ij2.18 h–l
‘Ahvaz’Control144 za’6.42 w1.55 t
Ti 50145.16 yz7.86 uv1.64 st
Ti 100145.66 yz9.49 p–r1.68 r–t
Ti NP 50150.83 r–t11 l–n2.07 j–m
Ti NP 100151.66 q–s12.01 h–j2.15 i–l
Ch 50146.16 w–y9.74 q1.74 q–s
Ch 100148.16 uv11.04 l–n2 l–n
Ch NP 50155.5 k–m13.70 cd2.40 g
Ch NP 100152.66 o-q12.98 ef2.18 h–k
‘Budakalazi’Control153.16 n–q8.78 st1.77 q–s
Ti 50153.5 n–p9.37 p–s1.93 m-p
Ti 100154.5 mn11.14 k–m2.01 l–n
Ti NP 50156.66 jk12.26 g–i2.76 de
Ti NP 100159.83 hi12.60 f–h2.84 d
Ch 50153.66 no10.94 l–n2.17 h–l
Ch 100156.33 kl11.51 j–l2.23 h–j
Ch NP 50165.00 d16.72 a3.61 a
Ch NP 100161.33 f–h13.56 de3.36 b
Table 4. Analysis of variance on the effects of chitosan and titanium dioxide treatments (bulk, nanoparticles) on seed yield-related parameters of five milk thistle ecotypes.
Mean Square
S.O.VdfNumber Seed (Main Capitulum)Weight Seed (Main Capitulum)1000 Seed WeightCapitulum NumberMain Capitulum DiameterSeed Yield per Plant
Year (Y)1113.42 ns0.35 *0.038 ns1.20 ns0.07 ns37.72 ns
Replication (Year) (Ea)461.250.040.169.360.056.82
Cultivar (Cul)447847.83 **55.75 **176.5 **889.16 **25.54 **4807.31**
Compound (Com)831727.12 **26.37 **45.25 **602.26 **4.55 **3248.63 **
Cul × Y474.32 ns0.10 *0.03 ns0.55 ns0.01 ns4.46 ns
Com × Y833.6 ns0.007 ns0.175 **0.95 ns0.02 ns1.80 ns
Cul × Com32838.40 **0.45 *1.15 **25.78 **0.11 **74.5 **
Cul × Com × Y3226.41 ns0.006 ns0.03 ns0.9 ns0.02 ns1.33 ns
Error (Eb)17663.940.030.101.840.0312.2
CV (%) 3.973.741.675.794.122.7
ns, not significant; *, significant at the 0.05 probability level; **, significant at the 0.01 probability level.
Table 5. Effects of chitosan and titanium dioxide (denoted as Ch and Ti, respectively) treatments [bulk, nanoparticle (NP)] applied at three concentrations (0, 50, and 100 mg L−1) on seed yield-related parameters of five milk thistle ecotypes. Three plants per treatment were assessed. Different letters within a column indicate statistically significant differences (p < 0.05).
EcotypeCompound/Concentration (mg L−1)Number Seed (Main Capitulum)Weight Seed (Main Capitulum; g)1000 Seed Weight (g)Capitulum NumberMain Capitulum Diameter (cm)Seed Yield per Plant (g)
‘Sari’Control167.5 st4.13 v18.28 rs14.5 u4.19 n39.52 t
Ti 50177.16 p–r4.69 p-s18.83 m-o18.16 p–s4.61 m51.92 lm
Ti 100195.5 mn5.34 mn19.09 l–n19.33 n–p4.97 jk54.89 k
Ti NP 50231.67 g–i5.69 kl20.12 hi24.33 hi5.63 e–g60.71 hi
Ti NP 100239 fg5.94 ij20.78 f25.33 gh5.42 d–g63.78 e–g
Ch 50216 jk5.47 lm19.5 k20.16 mn5.28 f–i54 k
Ch 100226.33 i5.82 jk19.89 ij24.66 g–i5.31 f–h56.93 j
Ch NP 50270 b7.6 ab21.29 e32.66 c5.70 a–c76.69 c
Ch NP 100253.33 de4.94 e20.91 f28 de5.37 e–g75.41 c
‘Khomin’Control143 uv4.16 uv17.51 u17 r–t4.18 n36.94 u
Ti 50150.83 u4.55 r–t17.83 tu18.5 o–r4.49 m42.93 r
Ti 100162.5 t4.61 q–s18.42 qr18.83 n–q4.90 jk50.90 mn
Ti NP 50200.16 lm5.22 n19.18 k–m22.66 j–k5.29 f–i54.51 k
Ti NP 100228.8 hi5.36 mn19.3 kl23.16 j–k5.31 f–h54.96 k
Ch 50182.83 o–q4.72 pr18.67 o–q18 p–s4.9 jk51.10 mn
Ch 100185.16 op4.91 op19.85 m–o21.33 lm5.09 h–j53.53 kl
Ch NP 50255.56 cd6.97 de20.89 f25.16 gh5.59 b–d65.28 de
Ch NP 100253.5 de6.54 f19.41 kl23.83 h–j5.49 c–f62.13 gh
‘Khorramabad’Control147.5 u2.10 z16.39 v22.16 kl3.21 t30.81 w
Ti 50149 u2.96 y16.5 v28.83 h–j3.30 st34.55 v
Ti 100151.83 u3.38 x16.57 v25.33 gh3.46 rs37.67 u
Ti NP 50168.5 r–t4.47 st18.17 r–t28.5 de3.57 p–r46.66 q
Ti NP 100177.33 p–r4.74 p–r18.44 p–r35.16 b3.79 op48.73 op
Ch 50151.5 u3.5 x17.80 tu28 gf3.47 rs40.41 st
Ch 100166.5 st3.81 w17.88 tu27.16 ef3.26 qr46.74 q
Ch NP 50208 kl4.99 o19.55 jk37.66 a4.45 m54.43 k
Ch NP 100187 no4.81 oq18.79 n–p35.83 b3.95 o49.82 no
‘Ahvaz’Control134.33 v2.58 y15.44 v15.66 tu3.78 o–q29.80 w
Ti 50136.66 v3.76 w17.80 tu16.66 st4.46 m40.57 st
Ti 100150.33 u4.2 uv18.02 tu17.66 q–s4.52 m40.89 st
Ti NP 50195 mn5.31 mn19.34 kl18.33 p–r4.63 lm49.07 op
Ti NP 100201.67 lm5.61 kl20.20 hi20 m–o4.66 lm54.37 k
Ch 50151.5 u4.37 tu19.18 k–m17.16 r–t4.57 m41.61 rs
Ch 100175 q–s4.68 q–s19.21 kl18.16 p–s4.61 m46.97 q
Ch NP 50245.16 ef5.91 ij20.58 fg22.5 j–l5.06 ij62.64 g
Ch NP 100241.83 f5.77 jk20.29 gh21.33 mL4.84 kl59.89 i
‘Budakalazi’Control205.66 l5.33 mn19.41 kl15.83 tu4.63 lm47.70 pq
Ti 50215.83 jk5.5 lm21.37 e19.5 n–p5.099 ij53.98 k
Ti 100224.83 ij6.06 hi21.66 e22.33 j–l5.22 g–i54.79 k
Ti NP 50255.83 d7.12 de23.24 c28.16 de5.55 b–e65.53 d
Ti NP 100261 b–d7.17 cd23.43 c28.83 d5.61 b–d79.83 b
Ch 50226.83 i6.28 gh22.59 d22.5 j–l5.36 e–g63.14 fg
Ch 100237.16 f–h6.49 gf22.70 d24.5 g–i5.42 d–g64.68 d–f
Ch NP 50283.32 a7.62 a24.65 a36.5 ab5.84 a91.55 a
Ch NP 100265 bc7.39 bc23.96 b31.66 c5.76 ab80.99 b
Table 6. Analysis of variance on the effects of chitosan and titanium dioxide treatments (bulk, nanoparticles) on the leaf gas exchange, photosynthetic state, and hydration status of five milk thistle ecotypes. Pn, net photosynthetic rate; gs, stomatal conductance; Tr, transpiration rate; Fv/Fm, ratio of variable to maximum fluorescence; RWC, relative water content.
Mean Square
S.O.VdfPngsTrFv/FmRWC
Year (Y)191.83 *0.19 **117.16 **0.18 **4.82 ns
Replication (Year) (Ea)48.450.0020.210.000211.92
Cultivar (Cul)4290.56 **0.03 **5.66 **0.008 **207.12 **
Compound (Com)81395.41 **0.45 **51.48 **0.07 **827.06 **
Cul × Y410.11 **0.004 **2.08 **0.0006 *0.95 ns
Com × Y87.68 **0.003 **0.23 ns0.007 **0.48 ns
Cul × Com3222.51 **0.02 **1.02 **0.0003 *23.36 **
Cul × Com × Y326.17 **0.001 **0.40 **0.0005 **0.39 ns
Error (Eb)1762.390.00060.170.00026.12
CV (%) 6.054.696.101.803.48
ns, not significant; *, significant at the 0.05 probability level; **, significant at the 0.01 probability level.
Table 7. Effects of chitosan and titanium dioxide (denoted as Ch and Ti, respectively) treatments [bulk, nanoparticle (NP)] applied at three concentrations (0, 50, and 100 mg L−1) on leaf gas exchange, photosynthetic state, and hydration status of five milk thistle ecotypes. Three plants per treatment were assessed. Different letters within a column indicate statistically significant differences (p < 0.05). In parameters (Pn, gs, Tr, and Fv/Fm) showing significant interaction effects among all three factors involved (ecotype × treatment × year); a comparison of year means is provided in Tables S2 and S3. Pn, net photosynthetic rate; gs, stomatal conductance; Tr, transpiration rate; Fv/Fm, ratio of variable to maximum fluorescence; RWC, relative water content.
EcotypeCompound/Concentration
(mg L−1)
Pn
(µmol m−2 s−1)
gs
(mmol m−2 s−1)
Tr
(mmol m−2 s−1)
Fv/FmRWC (%)
‘Sari’Control15.58 u0. 31 v5.39 st0.70 t63.63 st
Ti 5020.74 s0.34 u6.07 qr0.75 op65.85 rs
Ti 10022.86 qr0.43 rs6.23 p–r0.77 mn67.92 n–r
Ti NP 5027.32 jk0.51 l–n7.53 f–i0.81 g–i70.80 i–m
Ti NP 10032.45 ef0.56 hi7.82 d–g0.83 d–f74.03 e–h
Ch 5023.40 pq0.49 n–p6.73 l–o0.79 j–l69.04 k–q
Ch 10025.06 m–p0.50 l–n7.26 i–k0.80 i–k69.85 j–o
Ch NP 5040.93 b0.89 b8.96 a0.86 aba82.92 b
Ch NP 10033.84 de0.77 c8.26 sd0.84 cd80.49 bc
‘Khomin’Control15.69 u0.34 u3.41 v0.68 u65.87 rs
Ti 5022.82 qr0.40 st5.51 s0.74 pq67.35 o–r
Ti 10023.7 p–q0.49 n6.15 qr0.77 m–o67.86 n–r
Ti NP 5026.83 kl0.55 h–j7.58 f–i0.81 g–i70.58 i–n
Ti NP 10029.36 hi0.56 g–i7.79 e–h0.82 e–g70.97 i–l
Ch 5024.22 o–q0.51 k–n6.49 n–q0.78 k–m68.02 m–r
Ch 10024.13 o–q0.52 k–n7.16 i–l0.80 h–j69.43 k–p
Ch NP 5038.64 c0.64 e8.80 ab0.87 a81.37 bc
Ch NP 10029.99 gh0.60 f8.23 c–e0.84 cd76.38 de
‘Khorramabad’Control10.85 v0.32 uv3.07 v0.68 u62.63 t
Ti 5016.61 tu0.40 t5.83 rs0.72 qr66.09 rs
Ti 10017.74 t0.46 o–q6.40 o–q0.74 pq66.88 p–r
Ti NP 5024.38 o–q0.50 l–n7.23 i–k0.79 i–k69.02 k–q
Ti NP 10026.48 k–n0.54 i–k7.33 h–k0.81 f–h71.43 h–k
Ch 5020.01 s0.49 no6.90 k–n0.76 no67.45 o–r
Ch 10020.58 s0.50 l–m7.01 j–m0.77 mn67.91 n–r
Ch NP 5029.61 h0.59 fg7.95 c–f0.85 bc73.14 f–i
Ch NP 10030.10 gh0.55 h–j7.50 f–i0.82 fg71.66 g–k
‘Ahvaz’Control11.92 v0.31 uv4.65 u0.71 st63.54 st
Ti 5016.24 tu0.39 t4.91 u0.72 rs66.27 q–s
Ti 10021.47 rs0.45 qr5.42 st0.76 no68.18 l–r
Ti NP 5027.29 jk0.52 k–m7.03 j–m0.80 h–k69.96 j–o
Ti NP 10028.63 h–j0.55 h–j7.41 g–j0.81 g–i73.25 f–i
Ch 5024.96 n–p0.50 mn5.78 rs0.78 l–m67.32 o–r
Ch 10027.71 i–k0.53 j–l6.68 m–p0.79 j–l68.93 k–q
Ch NP 5035.46 d0.70 d7.79 e–h0.86 ab78.73 cd
Ch NP 10031.42 fg0.64 e7.45 g–j0.84 cd74.46 e–g
‘Budakalazi’Control19.89 s0.38 t5 tu0.71 st63.64 st
Ti 5020.70 s0.43 qr5.80 rs0.77 m–o66.89 p–r
Ti 10023.58 pq0.46 pq6.10 qr0.79 kl69.46 k–p
Ti NP 5026.77 k–m0.55 h–j7.41 g–j0.83 d–f75.77 ef
Ti NP 10029.60 h0.57 f–h7.80 d–g0.84 c–e76.45 de
Ch 5025.49 l–o0.52 k–n6.35 o–q0.80 h–j71.46 h–k
Ch 10026.77 k–n0.53 j–l7.26 i–k0.81 g–i72.64 g–j
Ch NP 5043.62 a0.93 a9.91 a0.87 a88.82 a
Ch NP 10033.83 de0.60 f8.38 bc0.85 bc78.79 cd
Table 8. Analysis of variance on the effects of chitosan and titanium dioxide treatments (bulk, nanoparticles) on seed mineral, protein, and oil content of five milk thistle ecotypes.
Mean Square
S.O.VdfMgFeNTiProteinOil
Year (Y)17.21 ns0.98 ns1.57 **1.004 ns61.01 **24.19 ns
Replication (Year) (Ea)432875.363.060.010.600.4021.91
Cultivar (Cul)443008.02 **4247.36 **0.18 **52.78 **7.27 **169.48 **
Compound (Com)863107.58 **1946.56 **1.31 **803.69 **51.30 **859.9 **
Cul × Y4596.37 ns0.33 ns0.11 **0.19 ns4.62 **0.44 ns
Com × Y8189.53 ns0.39 ns0.033 **0.061 ns1.30 **0.16 ns
Cul × Com323473.95 **51.42 **0.024 **20.97 **0.97 **8.99 **
Cul × Com × Y32471.86 ns0.35 ns0.016 **0.065 ns0.63 **0.18 ns
Error (Eb)1761892.865.020.0070.740.270.47
CV (%) 2.524.023.764.493.762.33
ns, not significant; **, significant at the 0.01 probability level.
Table 9. Effects of chitosan and titanium dioxide (denoted as Ch and Ti, respectively) treatments [bulk, nanoparticle (NP)] applied at three concentrations (0, 50, and 100 mg L−1) on seed mineral, protein, and oil content of five milk thistle ecotypes. Three plants per treatment were assessed. Different letters within a column indicate statistically significant differences (p < 0.05). For parameters (N and protein contents) showing significant interaction effects among all three factors involved (ecotype × treatment × year), the comparison of year means is provided in Table S4.
EcotypeCompound/Concentration (mg L−1)Mg (μg/g)Fe (μg/g)N (%)Ti (μg/g)Protein (%)Oil (%)
‘Sari’control1705 j–s37.78 vw1.56 x5.01 z9.76 x18.99 u
Ti 501704.6 j–s43.34 tu2.16 q–s21.24 f–j13.50 q–s23.85 op
Ti 1001726.6 h–o51.45 no2.19 o–s21.40 f–i13.68 o–s24.67 mn
Ti NP 501745.5 e–l65.31 g2.21 n–s22.02 f13.85 n–s33.91e
Ti NP 1001769.5 e–h66.02 fg2.38 c–h25.62 c14.91 c–h33.96 e
Ch 501719.1 i–q46.57 q–s2.18 o–s15.34 v13.67 o–s29.29 ij
Ch 1001734.2 g–n55.38 j–m2.23 m–q18.73 o–q13.97 m–q29.85 hi
Ch NP 501881.1 a67.11 e–g2.46 a–e21.11 f–j15.38 a–e37.08 ab
Ch NP 1001832.5 a–c68 ef2.47 a–c20.69 h–l15.47 a–c34.13 de
‘Khomin’Control1669.6 q–u36.25 vw1.85 v6.40 xy11.61 v21.06 st
Ti 501678.2 o– u44.43 st2.12 r–t20.34 j–m13.30 r–t20.42 t
Ti 1001693.2 m–t45.17 r–t2.26 k–p20.82 g–k14.15 k–p21.07 st
Ti NP 501717.2 j–r56.02 i–l2.35 f–k24.22 e14.71 f–k30.59 gh
Ti NP 1001725.4 h–o58.17 hi2.36 e–i25.44 cd14.80 e–i30.53 gh
Ch 501699.1 k–t49.52 op2.28 i–o17.34 tu14.26 i–o29.37 ij
Ch 1001701.8 j–s54.72 lm2.34 f–k17.65 st14.67 f–k29.47 ij
Ch NP 501737.7 g–m59.56 h2.53 a20.43 i–m15.83 a34.84 cd
Ch NP 1001764 e–i58.89 h2.34 f–l17.69 r–t14.62 f–l34.09 de
‘Khorramabad’Control1631.1 u35.55 w1.66 w7.09 x10.41 w19.37 u
Ti 501675 p–u41.74 u2.05 t–u21.20 f–j12.84 tu22.56 qr
Ti 1001686.1 n–t44.53 st2.12 r–t21.23 f–j13.28 st23.99 no
Ti NP 501706.8 j–s54.89 k–m2.26 j–p21.70 fg14.18 j–p30.61 gh
Ti NP 1001727.3 h–o55.85 i–l2.32 g–m29.07 b14.51 g–m31.21 g
Ch 501694.8 m–t54.44 lm2.16 q–s19.53 m–o13.54 q–s26.96l
Ch 1001697.1 l–t53.23 mn2.20 n–s19.80 l–n13.79 n–s27.97 k
Ch NP 501727.9 h–n55.96 i–l2.39 c–g20.74 g–l14.95 c–g32.13 f
Ch NP 1001748.1 e–k57.51 h–j2.35 f–k20.56 i–l14.71 f–k31.16 g
‘Ahvaz’Control1634.9 u38.37 v1.65 wx5.50 yz10.36 wx21.82 rs
Ti 501650.8 tu44.06 s–u2.18 p–s20.43 i–m13.63 p–s24.93 m
Ti 1001684.9 n–t44.44 st2.19 o–s20.56 i–l13.69 o–s27.56 kl
Ti NP 501724.4 h–p53.61 l–n2.26 k–p21.62 f–h14.16 k–p34.11 de
Ti NP 1001738.9 f–m57.3 h–k2.29 h–n21.82 f14.32 h–n34.62 c–e
Ch 501699 k–t47.27 p–r2.23 m–q16.50 u13.93 m–q28.76 j
Ch 1001714.6 i–s48.06 pq2.24 l–q17.98 q–t14.02 l–q34.38 c–e
Ch NP 501750.3 e–j59.70 h2.42 b–f18.58 o–s15.17 b–f37.84 a
Ch NP 1001780.4 e–g58.25 hi2.37 d–h18.04 q–t14.86 d–i37.25 ab
‘Budakalazi’Control1669.2 r–u59.28 h2.02 u13.75 w12.67 u23.30 o–q
Ti 501665.2 s–t66.19 fg2.16 q–s19.30 n–p13.55 q–s23.09 pq
Ti 1001675.2 p–u67.24 e–g2.22 n–r20.08 k–n13.89 n–s26.94 l
Ti NP 501788 c–f72.11 bc2.36 f–j24.51 de14.77 f–j34.39 cde
Ti NP 1001792.7 c–e74.62 b2.47 a–d31.76 a15.43 a–d35.02 c
Ch 501756.7 e–i69.04 de2.22 n–q18.06 q–t13.90 n–q30.79 g
Ch 1001783.5 c–g70.89 cd2.35 f–k18.33 p–s14.71 f–k32.02 f
Ch NP 501830 b–d79.36 a2.54 a18.55 o–s15.87 a37.04 b
Ch NP 1001845.2 ab81.16 a2.49 ab18.65 o–r15.57 ab36.78 b
Publisher’s Note: MDPI stays neutral with regard to jurisdictional claims in published maps and institutional affiliations.

