Article

Driving Factor Identification for the Spatial Distribution of Soil Salinity in the Irrigation Area of the Syr Darya River, Kazakhstan

1
State Key Laboratory of Desert and Oasis Ecology, Xinjiang Institute of Ecology and Geography, Chinese Academy of Sciences, Urumqi 830011, China
2
Research Center for Ecology and Environment of Central Asia, Chinese Academy of Sciences, Urumqi 830011, China
3
University of Chinese Academy of Sciences, Beijing 100049, China
4
Kazakh Research Institute of Soil Science and Agrochemistry, Almaty 050060, Kazakhstan
*
Author to whom correspondence should be addressed.
Agronomy 2022, 12(8), 1912; https://doi.org/10.3390/agronomy12081912
Submission received: 15 July 2022 / Revised: 4 August 2022 / Accepted: 12 August 2022 / Published: 14 August 2022
(This article belongs to the Section Farming Sustainability)

Abstract

:
Soil salinization has become a worldwide issue affecting agricultural development. Statistical methods and spatial analysis were used to analyze the degree and type of saline soils and their spatial distribution. The driving factors of soil salinity were explored using Geodetetcor models. In this study, 84 soil samples were collected from a 0–20 cm soil layer, and the total salt concentration and salt ion composition were measured. The results of statistical analysis and cluster analysis showed that SO42− and Ca2+ had the highest concentrations of salt ions in terms of anion and cation contents, respectively. The interpolation results indicated that the study area was dominated by mild saline soils, with sulfate-type saline soils and chloride-sulfate-type soils dominating. Results of the factor detector suggested that the distance to the irrigation system (0.425), and distance to the drainage system (0.42), explained salinity more strongly in the Shardara district, and elevation (0.326) was the most important influencing factor for salinity in the Mahtaaral district. Results of the interaction detector indicate that human factors (distance to irrigation canals ∩ distance to drainage canals) had a stronger explanation both in the Shardara and Mahtaaral districts. This research provides a scientific basis for soil salinity regulation and management, which is crucial for sustainable agricultural development.

1. Introduction

The world’s saline land area exceeds 1 billion hectares, accounting for approximately 25% of global irrigated land, and nearly 50% of land suffers from secondary soil salinization, to varying degrees [1]. Soil salinization has become a global issue threatening arable land quality and health, and seriously affecting the development of agriculture and productivity of arable land [2,3]. A large amount of land has been discarded due to secondary salinization of the soil, as a result of irrational farming practices that increases salinization of the land [4]. Humankind today is facing an increasingly serious food problem; however, currently, there are only 93 million hectares of land on earth suitable for development, which is far from meeting demand, prompting people to develop and use large areas of saline soils to alleviate the crisis [2]. The management and utilization of saline land present a recognized technical challenge: and the utilization of saline land is more challenging due to the wide variation in saline soil formation conditions; the lack of water resources; and global climate change [5,6]. Based on a study of saline soil types and spatial distribution characteristics, and combined with local climatic and economic conditions, the integrated planning and comprehensive management of saline land in a certain area is of great significance for regional agricultural stability, and sustainable development.
Central Asia is a typical inland, arid, and semiarid region that is situated in the heart of the hinterland of the Eurasian continent [7]. Starting in the 1960s, the former Soviet Union conducted a series of massive agricultural construction activities in the Syr Darya River Basin, with irrigation canals being built, along with reclamation. The uncontrolled abstraction of water from the Syr Darya River for irrigation, coupled with the degradation of supporting drainage facilities, has resulted in widespread salinization of croplands. In addition, since irrigation areas in the upper and middle regions draw a large amount of runoff from the Syr Darya [8,9], the amount of water flowing into the Aral Sea is drastically reduced, leading to its rapid reduction in size and the emergence of a large, dry lake bottom [10]. Under the action of strong winds, a large amount of salt dust blows from the dry lake bottom and is then deposited on the soil surface [11,12], intensifying the local soil salinization process [13]. Overall, the ultimate outcome of soil salinization is a reduction in the quantity and quality of arable land in Central Asia, which will continue to endanger agriculture, livestock, and infrastructure; cause damage to the vegetated environment; and severely limit local socioeconomic and agricultural development.
As one of the two major rivers in Central Asia, research on the ecological environmental changes of the Syr Darya River, and its basin, has always been a hot spot of current research. Many fruitful studies have been carried out on climate change and surface water hydrological processes [14,15]; water resources and management [8,16,17]; land cover and irrigation suitability evaluation [18,19]; and soil degradation and its environmental effects [20,21,22]. Among them, Konstantinovna and Zheksembaevna [23], in the study of soil degradation in the basin, found that by investigating land cover changes in the modern delta of the Syr Darya River, from 1956 to 2008, that the trend of soil salinization was more pronounced due to the shrinking of the Aral Sea and the effects of aridification. Shirokova et al. [24] studied the salinity of soils in Central Asia, including the Syr Darya Basin, and determined the chemical components of soil solutions and water extracts, providing a basis for soil degradation research. Bezborodov et al. [25] studied the variation in soil salinity in the Syr Darya Basin under different irrigation intensities, and its effects on cotton yield and crop water productivity. Egamberdiev et al. [26,27] investigated the effect of secondary salinization due to irrigation on soil microbial community biomass, in traditionally grown areas of cotton crops in the Syr Darya Basin. Funakawa et al. [28] analyzed the potential risk of secondary salinization of soils due to the development of irrigated agriculture, concluding that the risk of secondary salinization in the lower Syr Darya Basin is high. Funakawa et al. [29] also investigated the distribution pattern of salinity-affected soils around rice and cotton plantations, to understand the water–salt dynamics of soils in the Syr Darya River Basin, Uzbekistan. In summary, the lack of research on the salinity composition of cultivated soils in the Syr Darya irrigation area, and the spatial distribution characteristics of saline soil types and their influencing factors, has restricted the use of land resources and the control and improvement of soil salinization in the region.
The main objective of this study is to identify the spatial distribution of soil salinity, and its main driving factors in the cropland soils of the Syr Darya River Basin, Kazakhstan. In addition, the spatial characteristics of soil salinity and saline soil types, as well as the interaction relationships between influencing factors, are systematically studied. The conclusions of this study will provide first-hand guidelines for decision-making on the conservation, management and rational development, and use of land resources in this district.

2. Materials and Methods

2.1. Regional Setting

Shardara irrigated land and Mahtaaral irrigated land are located in Kazakhstan (N40°36′~42°18′, E67°54′~68°36′). The Syr Darya River flows through the area from south to north, providing sufficient water for agricultural irrigation in the area. The study area has a temperate continental climate, with most rainfall occurring in winter and spring. Based on temperature and precipitation data released by the CRU (Climate Research Unit) [30], the average annual temperature is 15.5 °C, the total annual precipitation in the Shardara district is 295.3 mm, in the Mahtaaral district it is 338.7 mm, and the average annual temperature in this region is approximately 15.5 °C. The elevation range of this area obtained from the FABDEM dataset is 211–269 m [31]. Based on the FAO/UNESCO soil map of the world [32], the soil type of the Mahtaaral district is classified as Haplic calcisols and Cumulic anthrosols, and the soil type of the Shanara district is classified as Gleyic solonchaks and Molic gleysols. Natural vegetation includes sedges, Artemisia argyi, and reeds. According to data provided by the online tool, WUEMoCA, the main crops are cotton, wheat, mulberry, and alfalfa. The common irrigation method is furrow irrigation through the Dustlik canal, which is a cross-border canal that feeds the farmlands of Kazakhstan and Uzbekistan. Based on the Syr Darya Project Report released by the European Union [33], the saline soils of Shardara and Mahtaaral irrigated lands occupied 50.4% and 62.8%, respectively.

2.2. Sampling and Laboratory Analysis

Sampling sites were set up in irrigated fields in the Shadara Reservoir, near the Syr Darya River watershed, from 10–15 May 2018. Eighty-four sampling points were set in the irrigated land along the Syr Darya River, including 28 sample points (T01–T28) in the Shardara district and 56 sample points (S01–S56) in the Mahtaaral district (Figure 1). The specific sampling principles were as follows: taking the preselected sampling site as the center, the remaining four sampling sites were designed within a 10-m radius. Samples used for salinity analysis were collected at a depth of 0–20 cm, we then mixed the collected samples after removing stones, plastic, and other debris. Finally, approximately 1 kg of the soil sample was preserved by quartering [34] and transported to the laboratory, while the surplus soil was abandoned. During the sampling period, the soil sample number and location information were also recorded. The first step in laboratory analysis was to air dry the soil under natural conditions. The second step was to grind the soil in a mortar until it passed through a 2 mm sieve [35]. The next step was to weigh 20 g soil, add 100 mL deionized water, shake for 3 min, leave to clarify, then filter the soil—water leachate. The aim of the previous operation was to attain a soil and water suspension with a ratio of 1:5. The last step of the experimental analysis was to measure the content of salt ions. The content of the major cations, Na+ and K+, were measured by flame photometry (FP6410; Shanghai Analytical Instrument Factory, Shanghai, China), and Ca2+ and Mg2+ were determined by EDTA complexation titration. The content of the main anions, CO3 and HCO3, was determined by dual indicator neutralization, and Cl and SO42− were determined by the standard AgNO3 titration and EDTA indirect determination methods, respectively. Total salt concentration was determined by the evaporation method. The pH was measured using a pH meter (PHS-2C; Shanghai Lida Instrument Factory, Shanghai, China).

2.3. Data Handling

2.3.1. Evaluation Index of Soil Salinity

Soil alkalization is a process in which soil colloids adsorb liquid-phase sodium ions. There is a certain proportional relationship between sodium ions, calcium ions, and magnesium ions in soil solution. If the ratio is out of balance, it will affect the soil structure and crop growth. For instance, if the sodium ion content is too high, it will destroy soil structure and change soil ventilation and water permeability [36]. The sodium adsorptive ratio (SAR) is used to evaluate the soil alkalization hazard:
SAR = [ Na + ] / [ Ca 2 +   ] + [ Mg 2 + ] / 2
where the ion concentration unit and SAR unit are meq·L−1 [37].
Soil salinity is often defined as the abundance of salts more soluble than gypsum [38]. The salinity class of the soil was classified according to the salt content of the surface layer, 0–20 cm [39], and the type of salt soil was classified according to the Cl/SO42− equivalent ratio in Table 1 [5].

2.3.2. Statistical Analysis and Spatial Analysis

Basic statistical parameters, such as the mean, median, maximum, and minimum values, were used to describe the concentrated trends of soil salinity. The coefficient of variation was used to describe the variability in soil salinity: CV < 10% indicates low variation; 10–100% indicates intermediate variation; and >100% indicates high variation [40]. Cluster analysis group variables that were similar in nature were placed into a class according to the characteristics of the variables, which was used to explore the relationship between the interior of the salt ions. Pearson correlation analysis was used to measure the correlation coefficient between salt ions, and the significance level of the correlation coefficient was measured by t test. Statistical analysis and graphing were performed with Origin Pro 2022 learning edition software. The spatial distribution of soil salinity was analyzed by the inverse distance weighted tool (IDW) in ArcGIS.

2.3.3. Analysis of Factors Influencing Soil Salinity

Geodetector is a tool that measures the degree of spatial differentiation of spatial variables, and the explanatory power of their influencing factors [41]. The factor detector quantifies the degree of interpretation of the spatial distribution of soil salinity by various natural and human factors:
q = 1 h = 1 L N h σ h 2 N σ 2 = 1 SSW SST  
where h is the stratification of soil salinity impact factors, i.e., classification or zoning. N and Nh represent the number of samples for the entire study area and stratum h, respectively; whereas σ2 and σ2h indicate the variance of soil samples in the study area and stratum h, respectively. SSW is the within sum of squares, and SST is the total sum of squares. The q values indicate the spatial heterogeneity of influencing factors on soil salinity, and its value ranges from 0 to 1.
The interaction detector is used to study the combined effects of the joint action of influencing factors on the spatial differentiation of soil salinity. By comparing the q value under the action of a single factor, the sum of the two single factors and the interaction of the two factors, the interactions were classified into five categories based on the results between the three, in Table 2.

3. Results

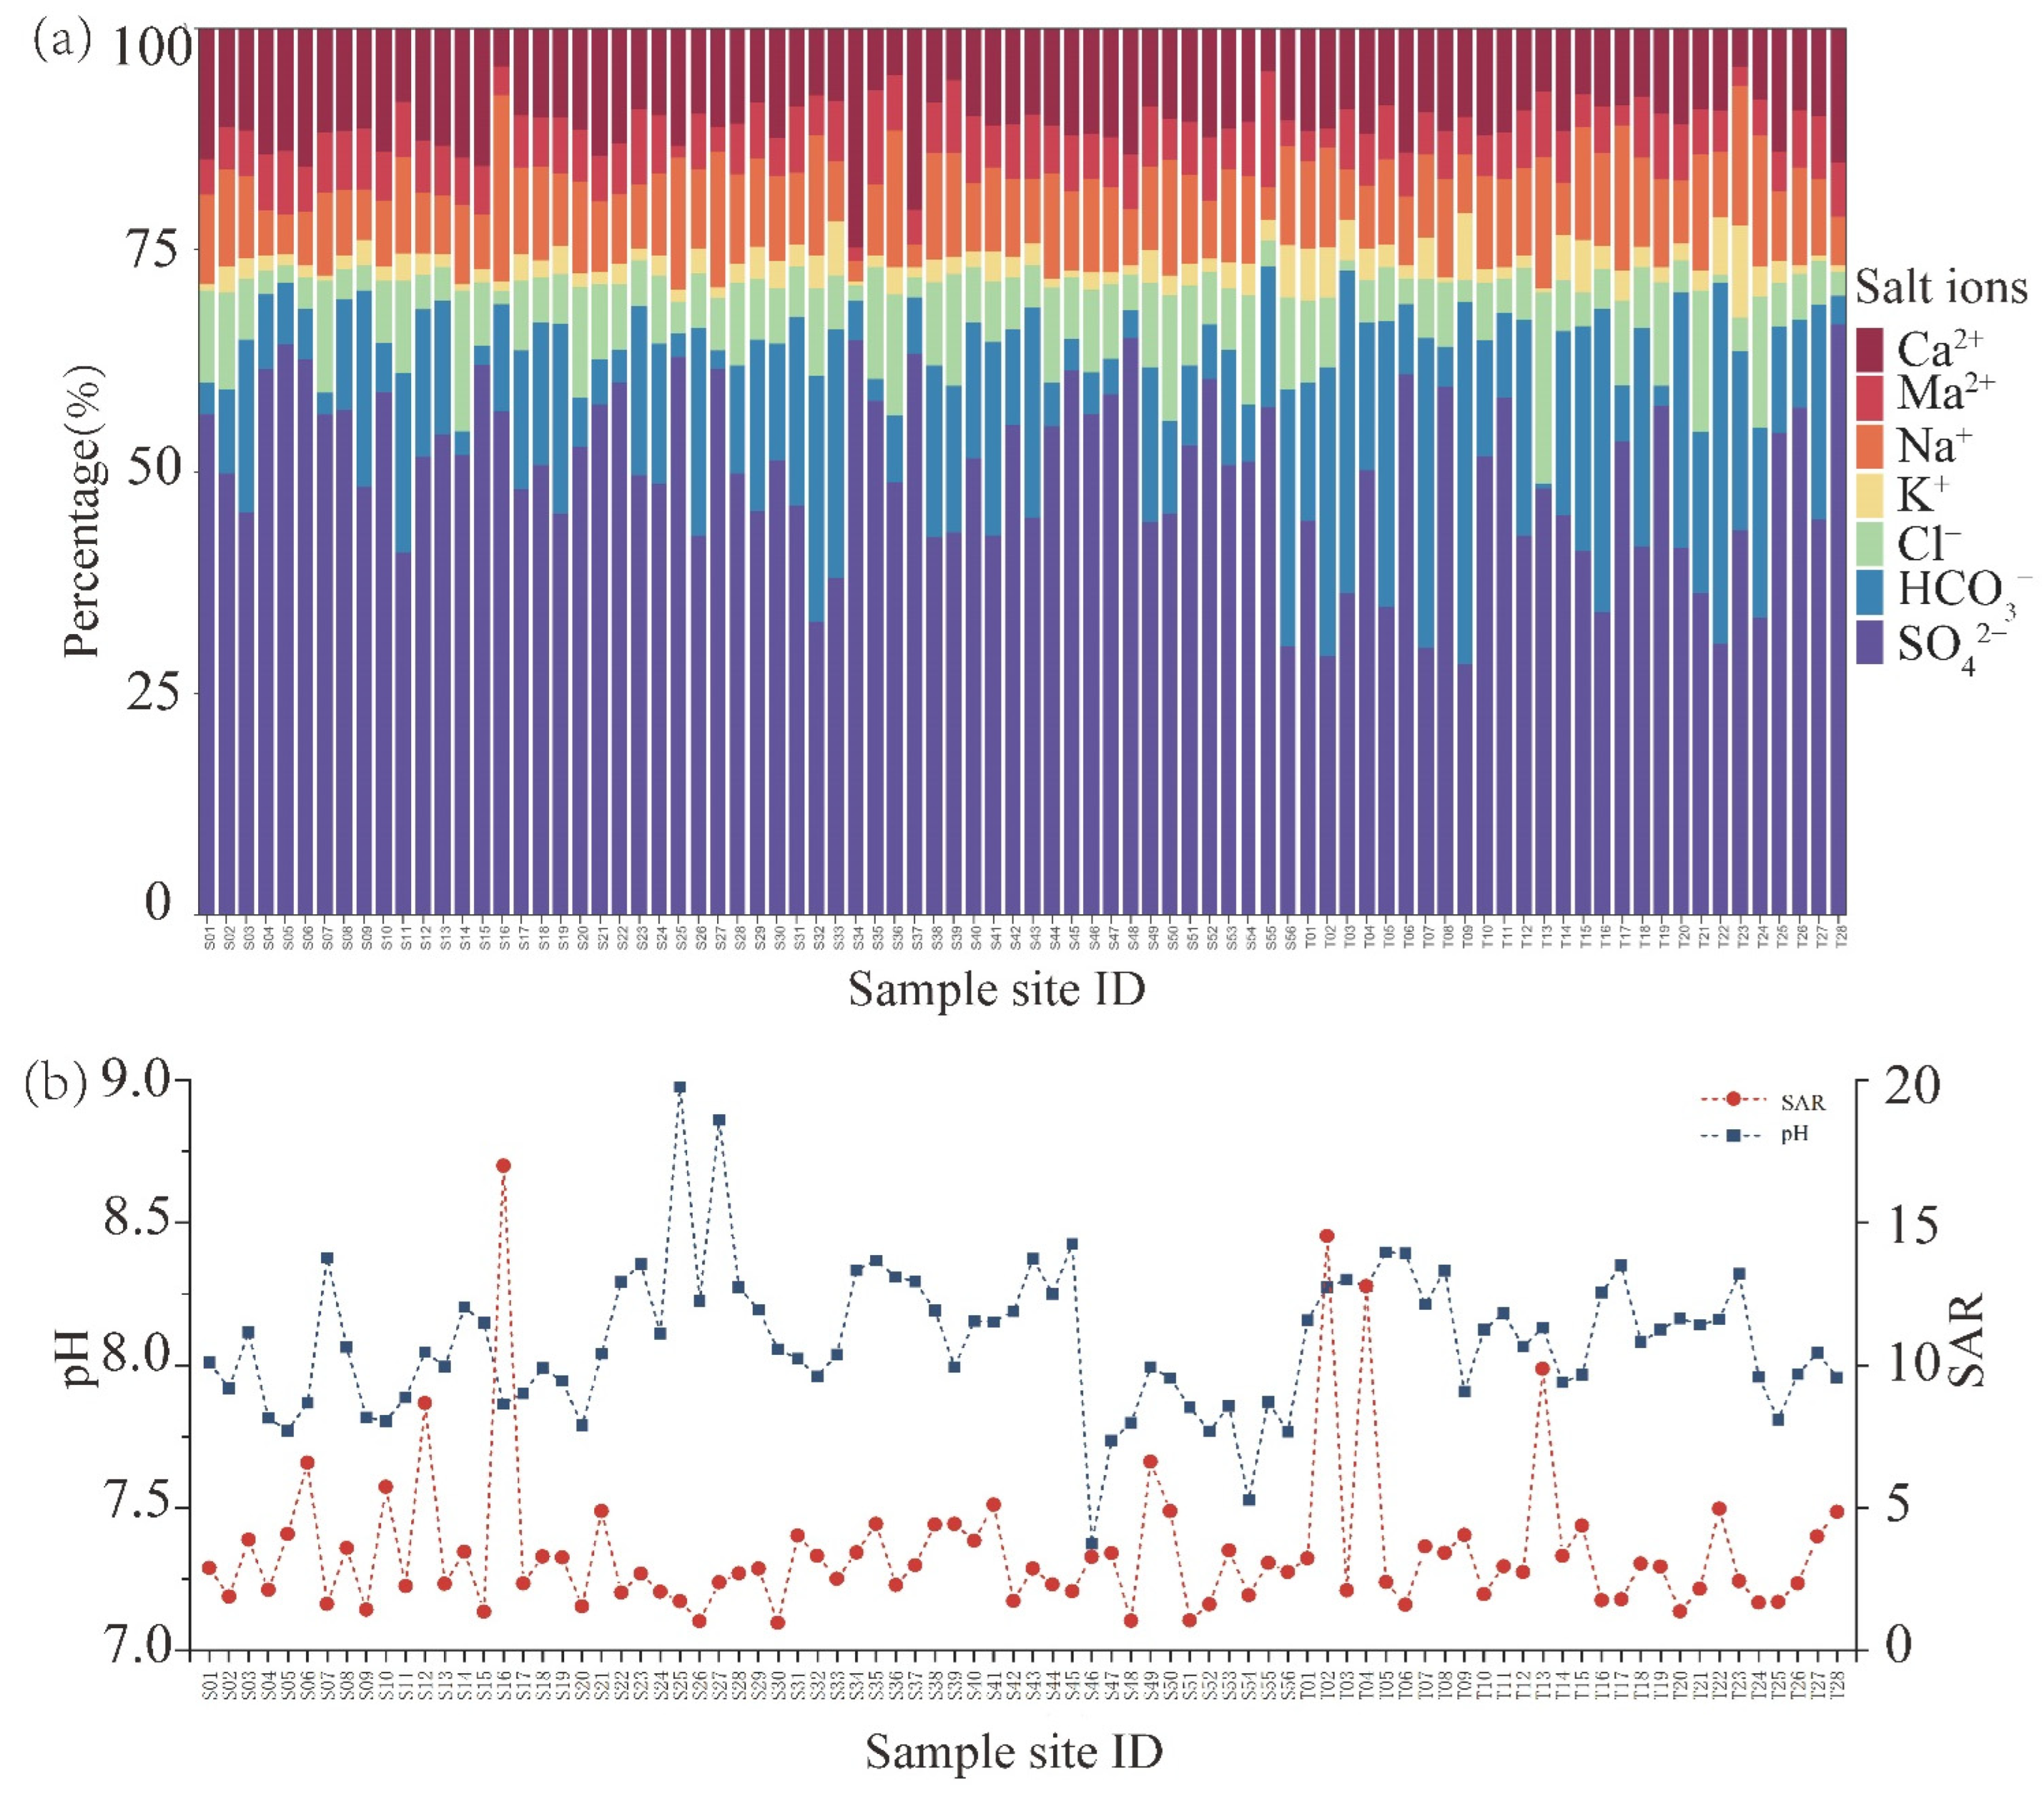
3.1. Statistical Analysis of Soil Salinity Ions, PH, and SAR

The average soil salt concentration (TSC) was higher than 3, as shown in Table 3. According to the classification standard of soil salinity, the soil was classified as mildly saline soil. Based on the Cl/SO42− equivalent ratio, the Cl/SO42− equivalent ratio in the soil sample sites of the study area ranged from 0 to 0.6, demonstrating that the type of surface salt soil was dominated by sulfate and chloride-sulfate types. In this paper, because the content of CO32− was too low, HCO3 was used instead of HCO3 + CO32−. In terms of anions, the order of content in the surface soil was SO42− > Cl > HCO3; in terms of cations, the order of content in the surface soil was Ca2+ > Na+ > Mg2+ > K+. Ca2+ and SO42− accounted for 66.16% of the total salt concentration, which shows that CaSO4 was the main salt source in this area (Figure 2).
Comparing the CV for all ions, the coefficient of variation was highest for Na+ and Cl, both of which showed strong variability (Table 3). The reason for this may be that the movement of soil salinity and moisture are interconnected. Cl is the monovalent anion, and it is mostly driven by water, which means that it is difficult to form compounds with other ions that are not easily adsorbed by soil colloids. The small hydration radius of Na+ causes it to be weakly adsorbed by soil colloids, in addition to which the high content of Na+ causes it to be one of the most active ions. However, HCO3, SO42−, Ca2+, and Mg2+ are influenced by properties such as ionic charge number, hydration radius, ionic concentration, and selective plant uptake, and have a high adsorption capacity for soil colloids. The salt ions had relatively little spatial variation and were more uniformly distributed in the surface soil than Na+ and Cl [42]. Statistical results showed large fluctuations in the main salt ions, which indicates that soil salt ions accumulated in the surface layer, under the influence of natural conditions and anthropogenic activities [43]. In addition, the ions SO42− and Ca2+ have low stressing effects on plants, and the ions Na+ and Cl have a more serious effects on plant growth [44,45].
Soil pH is the basic standard for measuring soil acidity and alkalinity. The average pH of the soil in the study area was higher than 8 (Table 3), indicating that the soil is weakly alkaline. In addition, the average SAR was 3.49, and the range was 0.97–16.99 (Table 3), showing that soil alkalinity is generally weak. However, in local areas, such as S16 in the Mahtaaral area, and T02, T04, and T13 in the Shardara area, the SAR range was between 10 and 18, which means that the content of sodium ions is relatively high relative to calcium and magnesium ions, and the potential danger of surface soil structure damage is high. According to the percentage of major salt ions in the sampling sites (Figure 2), SO42− dominated the major ion content, ranging from 28.3% to 66.6%; Cl content ranged from 0.9% to 21.5%; and HCO3 content ranged from 0.6% to 48%. Notably, the HCO3 content fluctuated greatly, especially in the Shardara district, and the high content of HCO3 in the total salt content was also one of the manifestations of soil alkalinization [46].
From the spatial distribution of TSC and major salt ions, in the Shardara irrigation area (Figure 3), high values of total salt concentration were found in the central area, and only sporadically high values were found in the southern area, while low values of total salt concentration were mainly concentrated in the northern area. The spatial distribution of Mg2+ and Ca2+ was consistent with that of TSC (Figure 3). The spatial distribution of Cl, SO42− and Na+ was more consistent, with the high-value areas mainly concentrated in the central area, and the low-value areas in the northern area (Figure 3). The spatial distribution of HCO3 was the opposite of the whole salt distribution, with low values in the central region and high values in the northern and southern areas (Figure 3).
However, the high values of total salt concentration in the Mahtaaral irrigation area were mainly concentrated in the northwestern region (Figure 4). In addition, the southern and southwestern regions of the study area also had high total salt concentrations, and low values of total salt concentration were in the northern area. The spatial distributions of SO42−, Ca2+, and Mg2+ were basically the same, with high values concentrated in the western area, and low values in the northern area (Figure 4). The spatial distribution of Cl and Na+ was consistent, with high values in the western region and low values scattered throughout the region (Figure 4). The spatial distribution of HCO3 was the opposite of the distribution of other ions, with high values concentrated in the northern and northeastern regions, and low values in the southern region (Figure 4).
The spatial distribution of different levels of salinized soils was mapped by the inverse distance weight interpolation method. After excluding other land use plots, the area of irrigated land could be calculated. As shown in Table 4, the area of irrigated land in the Mahtaaral district was 148.8 thousand hectares and in the Shardara district, it was 53 thousand hectares. The overall irrigated area of the study area was 201.8 thousand hectares. According to the results of a study by the Kazakh Scientific Research Institute of Water Economy, the irrigated area of Mahtaaral and Shardara was approximately 212 thousand hectares [33], and their results basically matched our results. The percentage of mild saline soils in the total area was 49.9% (Table 4), and mild saline soils predominated throughout the region. The percentage of nonsaline and slightly saline soils was 34.6% and 55.9% in Mahtaaral, and 59.13% and 33.15% in Shardara, respectively (Table 4). Shardara was less saline than Mahtaaral. According to Central Asia Irrigation Institute estimates, cotton yield loss on lightly saline land was approximately 20–30%; on moderately saline land, it reached 40–60%; and on heavily saline land, cotton yield loss even reached 80% [39].
Based on the data provided by the online tool, WUEMoCA, the estimated cotton yields per hectare in the Shardara and Mahtaaral districts are 3.11 and 1.66 ton, respectively. Affected by different degrees of soil salinity, the estimated loss of cotton yields in Shardara and Mahtaaral district is approximately 17.91–25.47 thousand tons, and 38.05–56.01 thousand tons, respectively. Soil salinization is not only a threat to cotton production in this region, but also to sustainable agricultural development. In view of the current salinization situation, governmental agricultural departments and farms urgently need to take some measures to prevent and improve salinized soils as soon as possible.

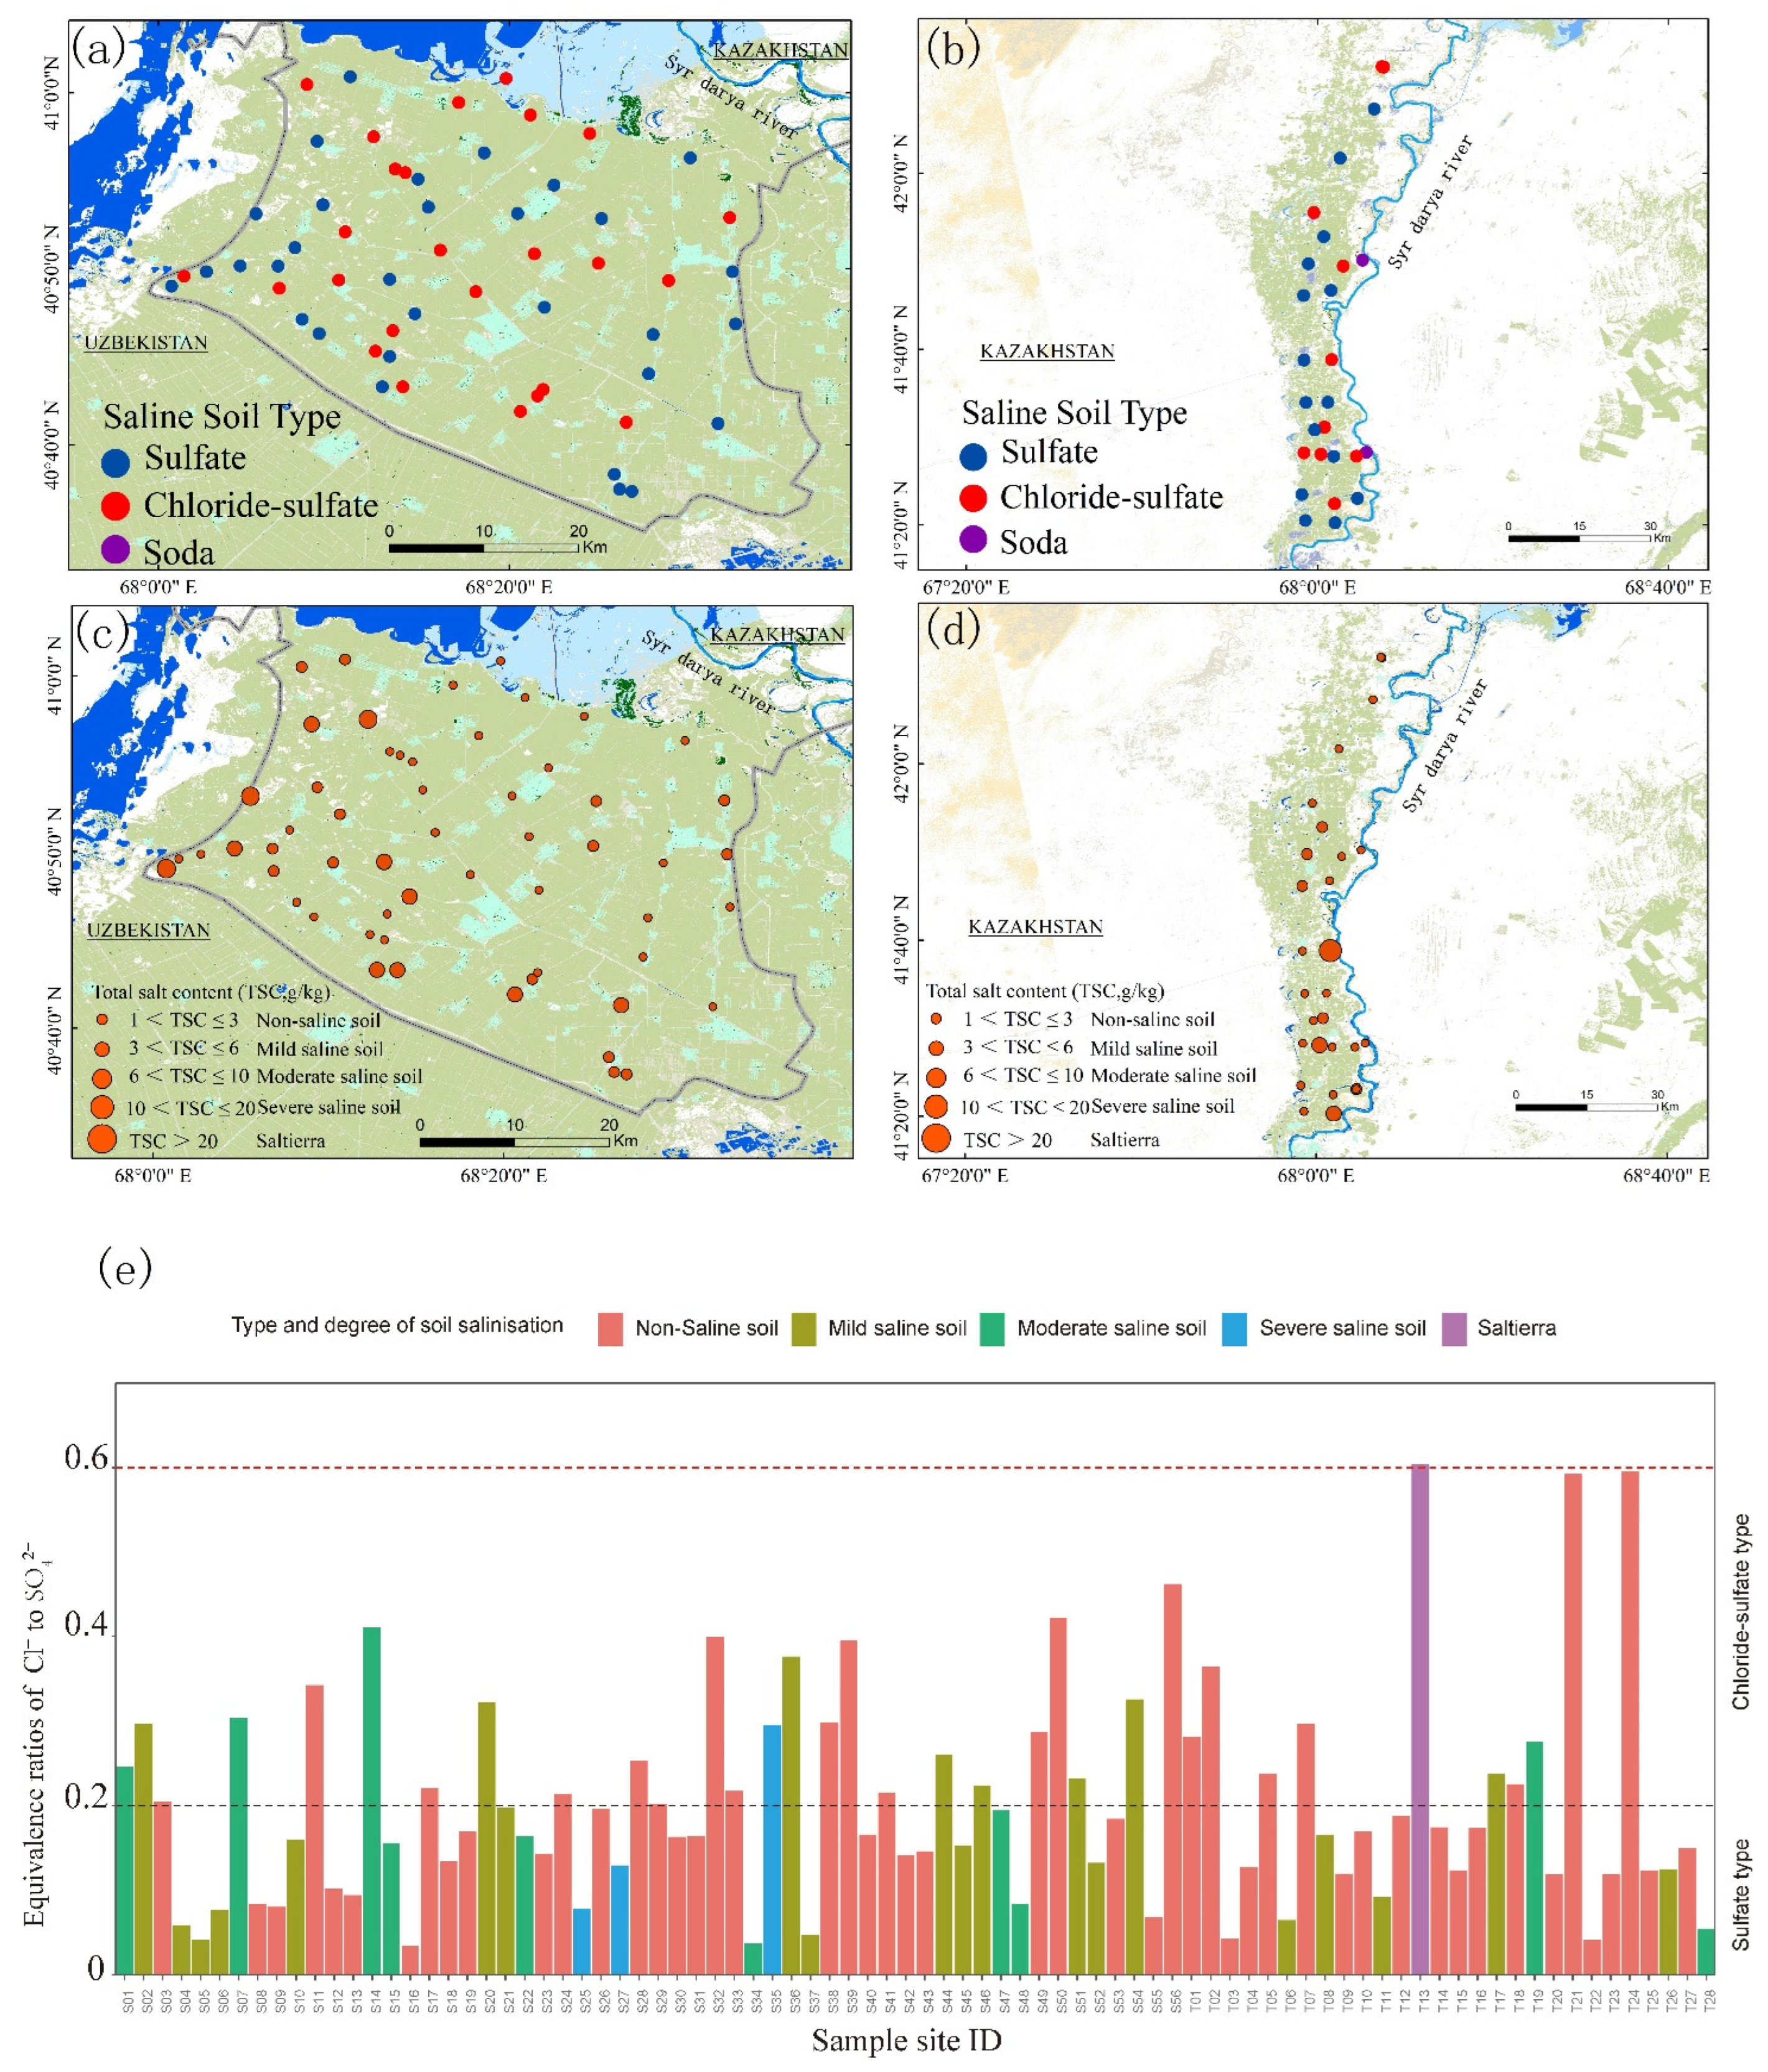
3.2. Distribution of Soil Salinity Degrees and Salt Soil Types

Soil sample sites were divided according to the degree of soil salinity, and results showed that 84 sample sites exhibited different degrees of salinity, with nonsaline soils accounting for 59.5% of all sample sites, while the proportions of lightly saline, moderately saline, heavily saline, and saline soils were 23.8%, 11.9%, 3.6%, and 1.2%, respectively (Figure 5). Considering the characteristics of soil alkalinization, saline soils can be classified into three types, based on the Cl/SO42− equivalence ratio, as well as combining this with the HCO3 + CO32−/ Cl + SO42− equivalence ratio, in which sulfate saline soils were the main salt soil type in the study area, followed by the chloride-sulfate type, and the soda type was the least, which was only present at two sample sites, T09 and T22, in the Shardara district. The percentages of the three different types of saline soils were 56%, 41.7%, and 2.3%, respectively.

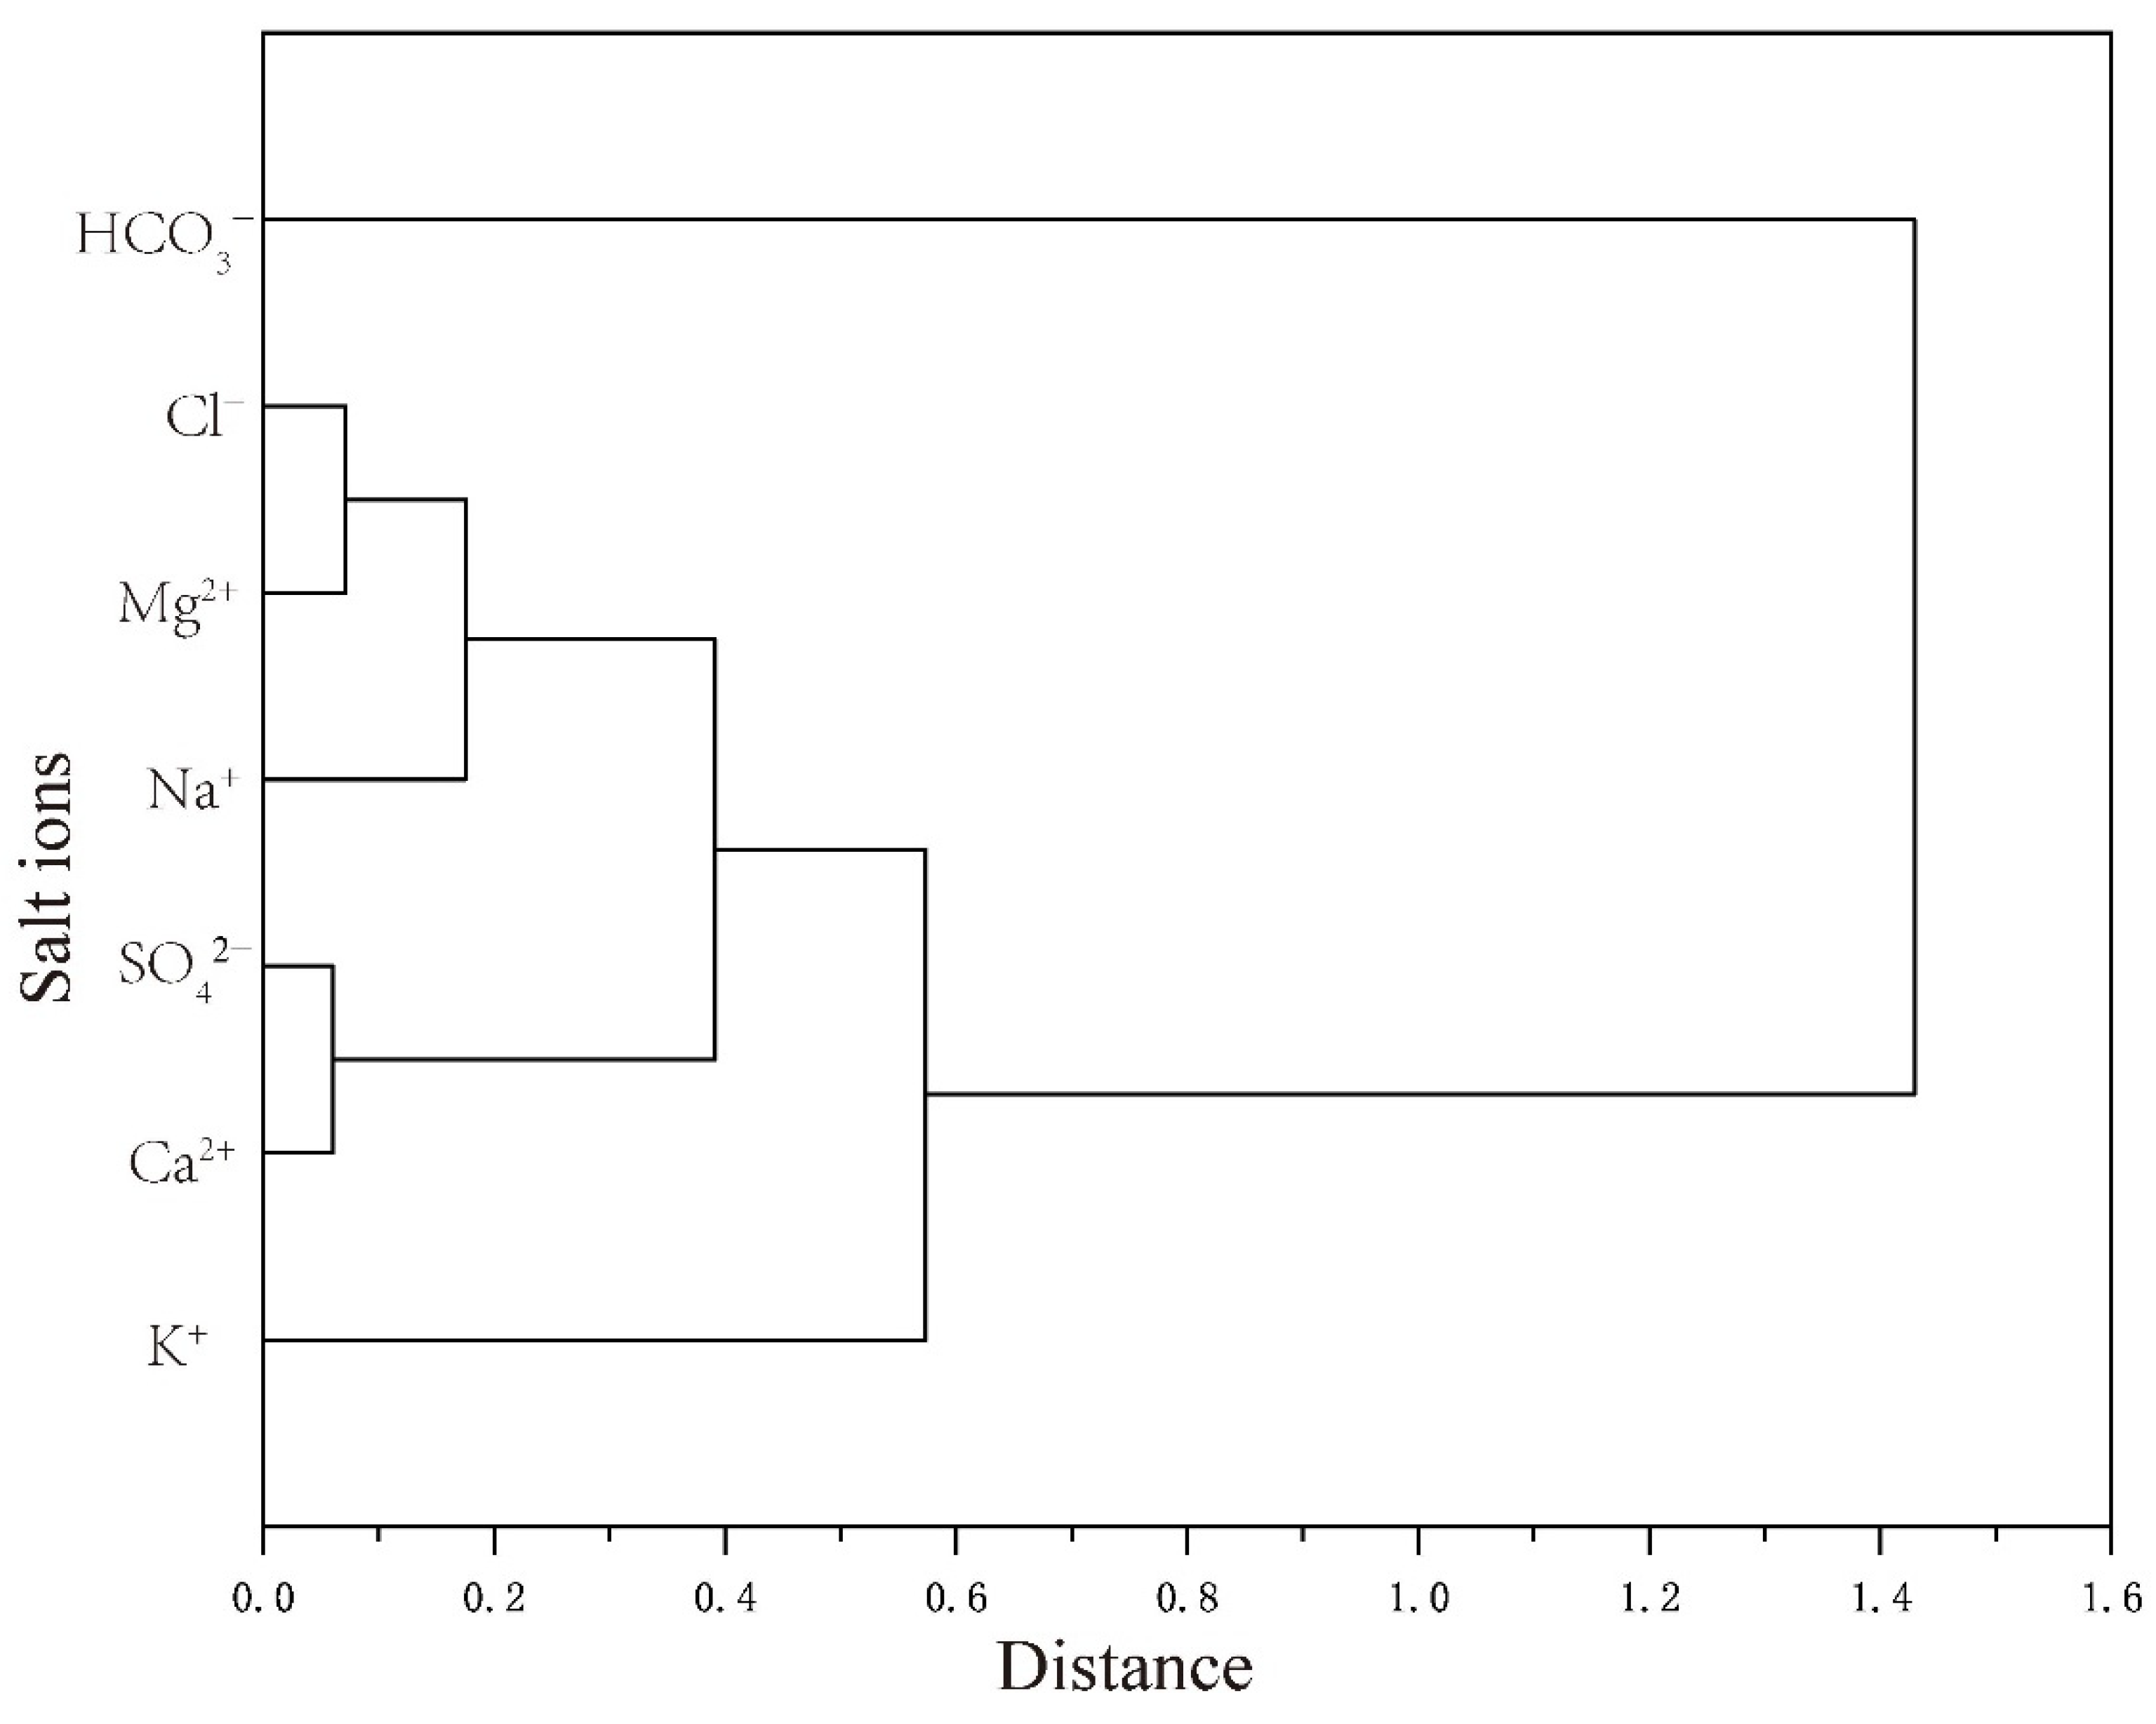
3.3. Soil Salt Ion Cluster Analysis and Correlation Analysis

Cluster analysis allows variables with similar properties to be grouped together according to their characteristics, and salt ions in the same category may have the same origin [46]. To understand the relationship between soil salinity variables within the study area, an R-type clustering analysis of seven soil salt ions was conducted, based on the longest distance method, and a distance coefficient threshold of 0.3 was used as the classification criterion. The seven salt ions were divided into four categories: SO42− and Ca2+ was the first category; Cl, Mg2+, and Na+ was the second category; K+ was the third category; and HCO3 was the fourth category (Figure 6). The results of the cluster analysis further verified that the ion content of the study area was dominated by SO42#x2212; and Ca2+ throughout the region. Cl and Na+ were consistently distributed in space, and the clustering results also indicated that the two salt ions were highly similar; NaCl was also an important compound in the saline soils of the study area. In contrast, K+ was classified as a separate category due to its low content and lack of an obvious pattern, and HCO3 was not similar to other ions in terms of content characteristics; therefore, it was classified as a separate category. Correlation analysis between salt ions can reveal similarities, which can reflect the relationship between salt ions in soil. The content of SO42− had the strongest relationship with Ca2+ (0.96), with a significance level of 0.01, the content of Cl is positively correlated with Mg2+ (0.92) and Na+ (0.88), with a significance level of 0.01, the content of HCO3 is negatively correlated with other ions, with a significance level of 0.05.

4. Discussion

4.1. The Influencing Factors of Soil Salinity

Soil salinization is a complicated, dynamic process under the influence of natural and human factors [47]. Previous studies have shown that topographic factors can alter the horizontal and vertical flow of soil salinity; therefore, elevation, slope, and aspect were chosen to reflect the influence of topography on soil salinity (Figure 7). Elevation data were obtained from a dataset provided by the University of Bristol, UK, and the slope and aspect were calculated based on elevation data. Improper irrigation is one of the causes of secondary soil salinization [48,49], and studies have shown that salts accumulate easily in districts where irrigation canals are dense [45]. In addition, there is a close connection between the distance to the drainage canal and soil salinity; irrigation systems and drainage systems have an impact on salinization through agricultural water abstraction and drainage activities [50,51]. Therefore, the distance to the irrigation canal and the distance to the drainage canal were selected as the human factors affecting soil salinity (Figure 8). The irrigation and drainage canal system data in the Syr Darya River Basin were derived from the Syr Darya Project Report released by the European Union [33].

4.2. Analysis of the Driving Force of Soil Salinity

The factor detector was used to analyze the drivers of soil salinity and calculate the q-value of the drivers, which reflects the extent to which various environmental factors affect salinized soils. The main drivers of soil salinity in the Shardara district were distance to the irrigation canal (0.425) and distance to the drainage canal (0.42), which showed that the distribution of salinity was related to the working conditions of irrigation and drainage facilities and their density, followed by slope (0.26) and aspect (0.218), indicating that slope and aspect affected the transport of salinity in horizontal and vertical directions to some extent, while elevation (q = 0.0056) did not explain the spatial distribution of saline soils in this area very well (Figure 9).
The main driver of soil salinity in the Mahtaaral district was elevation (0.326), followed by distance to irrigation canals (0.263), distance to drainage canals (0.225), and slope (0.124), while aspect (0.048) of the saline soil had little effect (Figure 9). The Mahtaaral district is part of the Golodnaya steppe in Kazakhstan, where agricultural water is mainly obtained from the Dustlik canal, which transports water from the Syr Darya River to the fields. Most irrigation canals are unlined earth canals [33]. The results showed that soil salinity was high in the northwestern and southwestern areas of the Mahtaaral district, which is characterized by lower elevations and dense irrigation canals. The area is heavily flooded due to topographic factors; therefore, elevation is a critical factor affecting the spatial distribution of salinity in the Mahtaaral area. Human factors in the Mahtaaral and Shardara regions both showed strong explanatory power, which may be influenced by long-term agricultural irrigation activities.
The interaction detector investigates the degree of salinity explanation when two influencing factors act together on salinity. Results showed that the interaction of the two influencing factors was a nonlinearly enhanced effect, and only a few influences resulted in a two-factor enhancement (Figure 10). In the Shardara zone, the interactions between elevation and slope (X1 ∩ X2, 0.92), elevation and aspect (X1 ∩ X3, 0.93), and slope and aspect (X2 ∩ X3, 0.98), showed strong explanatory power for the spatial variation in salinity. Although the explanation of elevation on soil salinity was relatively weak in the factor detector, any two factors of elevation, slope, and aspect could explain salinity higher than that of a single factor, and the interactions of other topographic factors with elevation showed nonlinear enhancement, which indicates that elevation can enhance the explanation of salinity by other factors. Therefore, topographic factors are not negligible in exploring salinity management in this region.
The interactions between distance to the irrigation canal and distance to the drainage canal were strong in both Shardara and Mahtaaral, indicating that the degradation of irrigation and drainage facilities had a strong effect on soil salinity. The perennial water volume in irrigation canals in the area is large, most channels are not lined, and the water level in the channels is higher than groundwater level, which is very likely to raise the groundwater level on both sides of the channels and aggravate the accumulation of soil salts. In addition, a large amount of saline wastewater collects in low-lying areas, due to poor drainage caused by degraded drainage facilities [52]. The damage caused by the degradation of irrigation and drainage facilities is an important factor in increasing soil salinity.
In Shardara, the interactions between aspect and distance to the irrigation canal (X3 ∩ X4,0.95), and aspect and distance to the drainage canal (X3 ∩ X5,0.96), were strong. In Mahtaaral, elevation and distance to the drainage canal (X1 ∩ X5,0.73), and elevation and distance to the irrigation canal (X1 ∩ X5,0.68), showed strong explanatory power. It is noteworthy that the interactions between topographic factors and human activity factors had a stronger explanatory power than a single factor in both the Mahtaaral and Shardara zones.
In addition to the above factors, the influencing factors of soil salinity were also affected by many factors, such as groundwater depth, groundwater mineralization, cultivation years, rotation system, and fertilizer. The nature of irrigation water and its type were also closely related to soil salinity. The dynamics of groundwater level and groundwater mineralization in the Mahtaaral district were studied, and it was shown that the rise in groundwater level and increase in mineralization led to salinity of the soil [52]. Soil salinization is a complex, dynamic process, especially in areas affected by high-intensity agricultural irrigation activities. Geodetectors can help us quantify the explanatory power of various factors and their interactions, and we will collect more data to explain the factors influencing soil salinity in future work.

4.3. Potential Hazards of Soil Salinization and Implications for Soil Management

Soil salinization has affected agricultural development in the Syr Darya River Basin, as well as the surrounding ecosystems, due to the degradation of irrigation and drainage systems. A total of 20 million tons of salt enters the Syr Darya River through drainage every year, causing the river’s salt content to increase from 0.3–0.6 g/L upstream to 3 g/L downstream. Soil salinization has seriously threatened the health and welfare of residents in the middle and lower reaches [36]. On the Golodnaya steppe, more than 38% of the irrigated area is affected by salinization [53]. In the Aydar–Arnasay Lake system, 70,000 to 10,000 tons of water-soluble salts are discharged from farmland along the lake every year. In the shallow depressions near Arnasay Bay, some small, permanent saline–alkali water bodies have gradually formed. Increased fish catches and changes in fish fauna in the lakes have even threatened the security of the Aydarkul–Arnasay Lake ecosystem and the continued development of fisheries [53,54].
In arid and semiarid regions, the source and transport of salts, and the factors affecting them, have been a hot issue. Due to the closed environment of the inland river basin, a large amount of salt is circulated in the soil of the oasis. With the construction of reservoirs and the implementation of large irrigation schemes, the salts originally carried to the coccyx lakes were trapped in farmland with irrigation diversions. Therefore, both residual salt accumulation and modern salt accumulation processes are very strong in irrigated soils. In the Nile [55], Indus [56], Amu Darya [57], Manas [58], and Tarim [59] river basins, secondary salinization is very obvious, which is induced by irrigation, and is a common obstacle to agricultural development worldwide. The restoration of irrigation and drainage facilities is crucial and can greatly improve salinization status. In addition, different measures have been taken to improve saline soils representing different salt soil types. Some measures have been taken to control saline soil on irrigated land affected by terrain factors, such as land leveling, deep tillage and crop rotation. Understanding the spatial variability of soil physicochemical properties is a prerequisite for the improvement of salinized soils. We studied the spatial distribution and influencing factors of soil salinity, proposed control measures and suggestions, and provided a theoretical reference and practical foundation for the efficient management, rational utilization, and precise improvement of saline soil in irrigation areas, for the agricultural departments in this area.

5. Conclusions

(1)
The study area was dominated by mild saline soil, and the type of salt soil was dominated by sulfate and chloride-sulfate types, with proportions of 56% and 41.7% in the total sample sites, respectively. The salinity degree in the Shardara area was lighter than that in the Mahtaaral area.
(2)
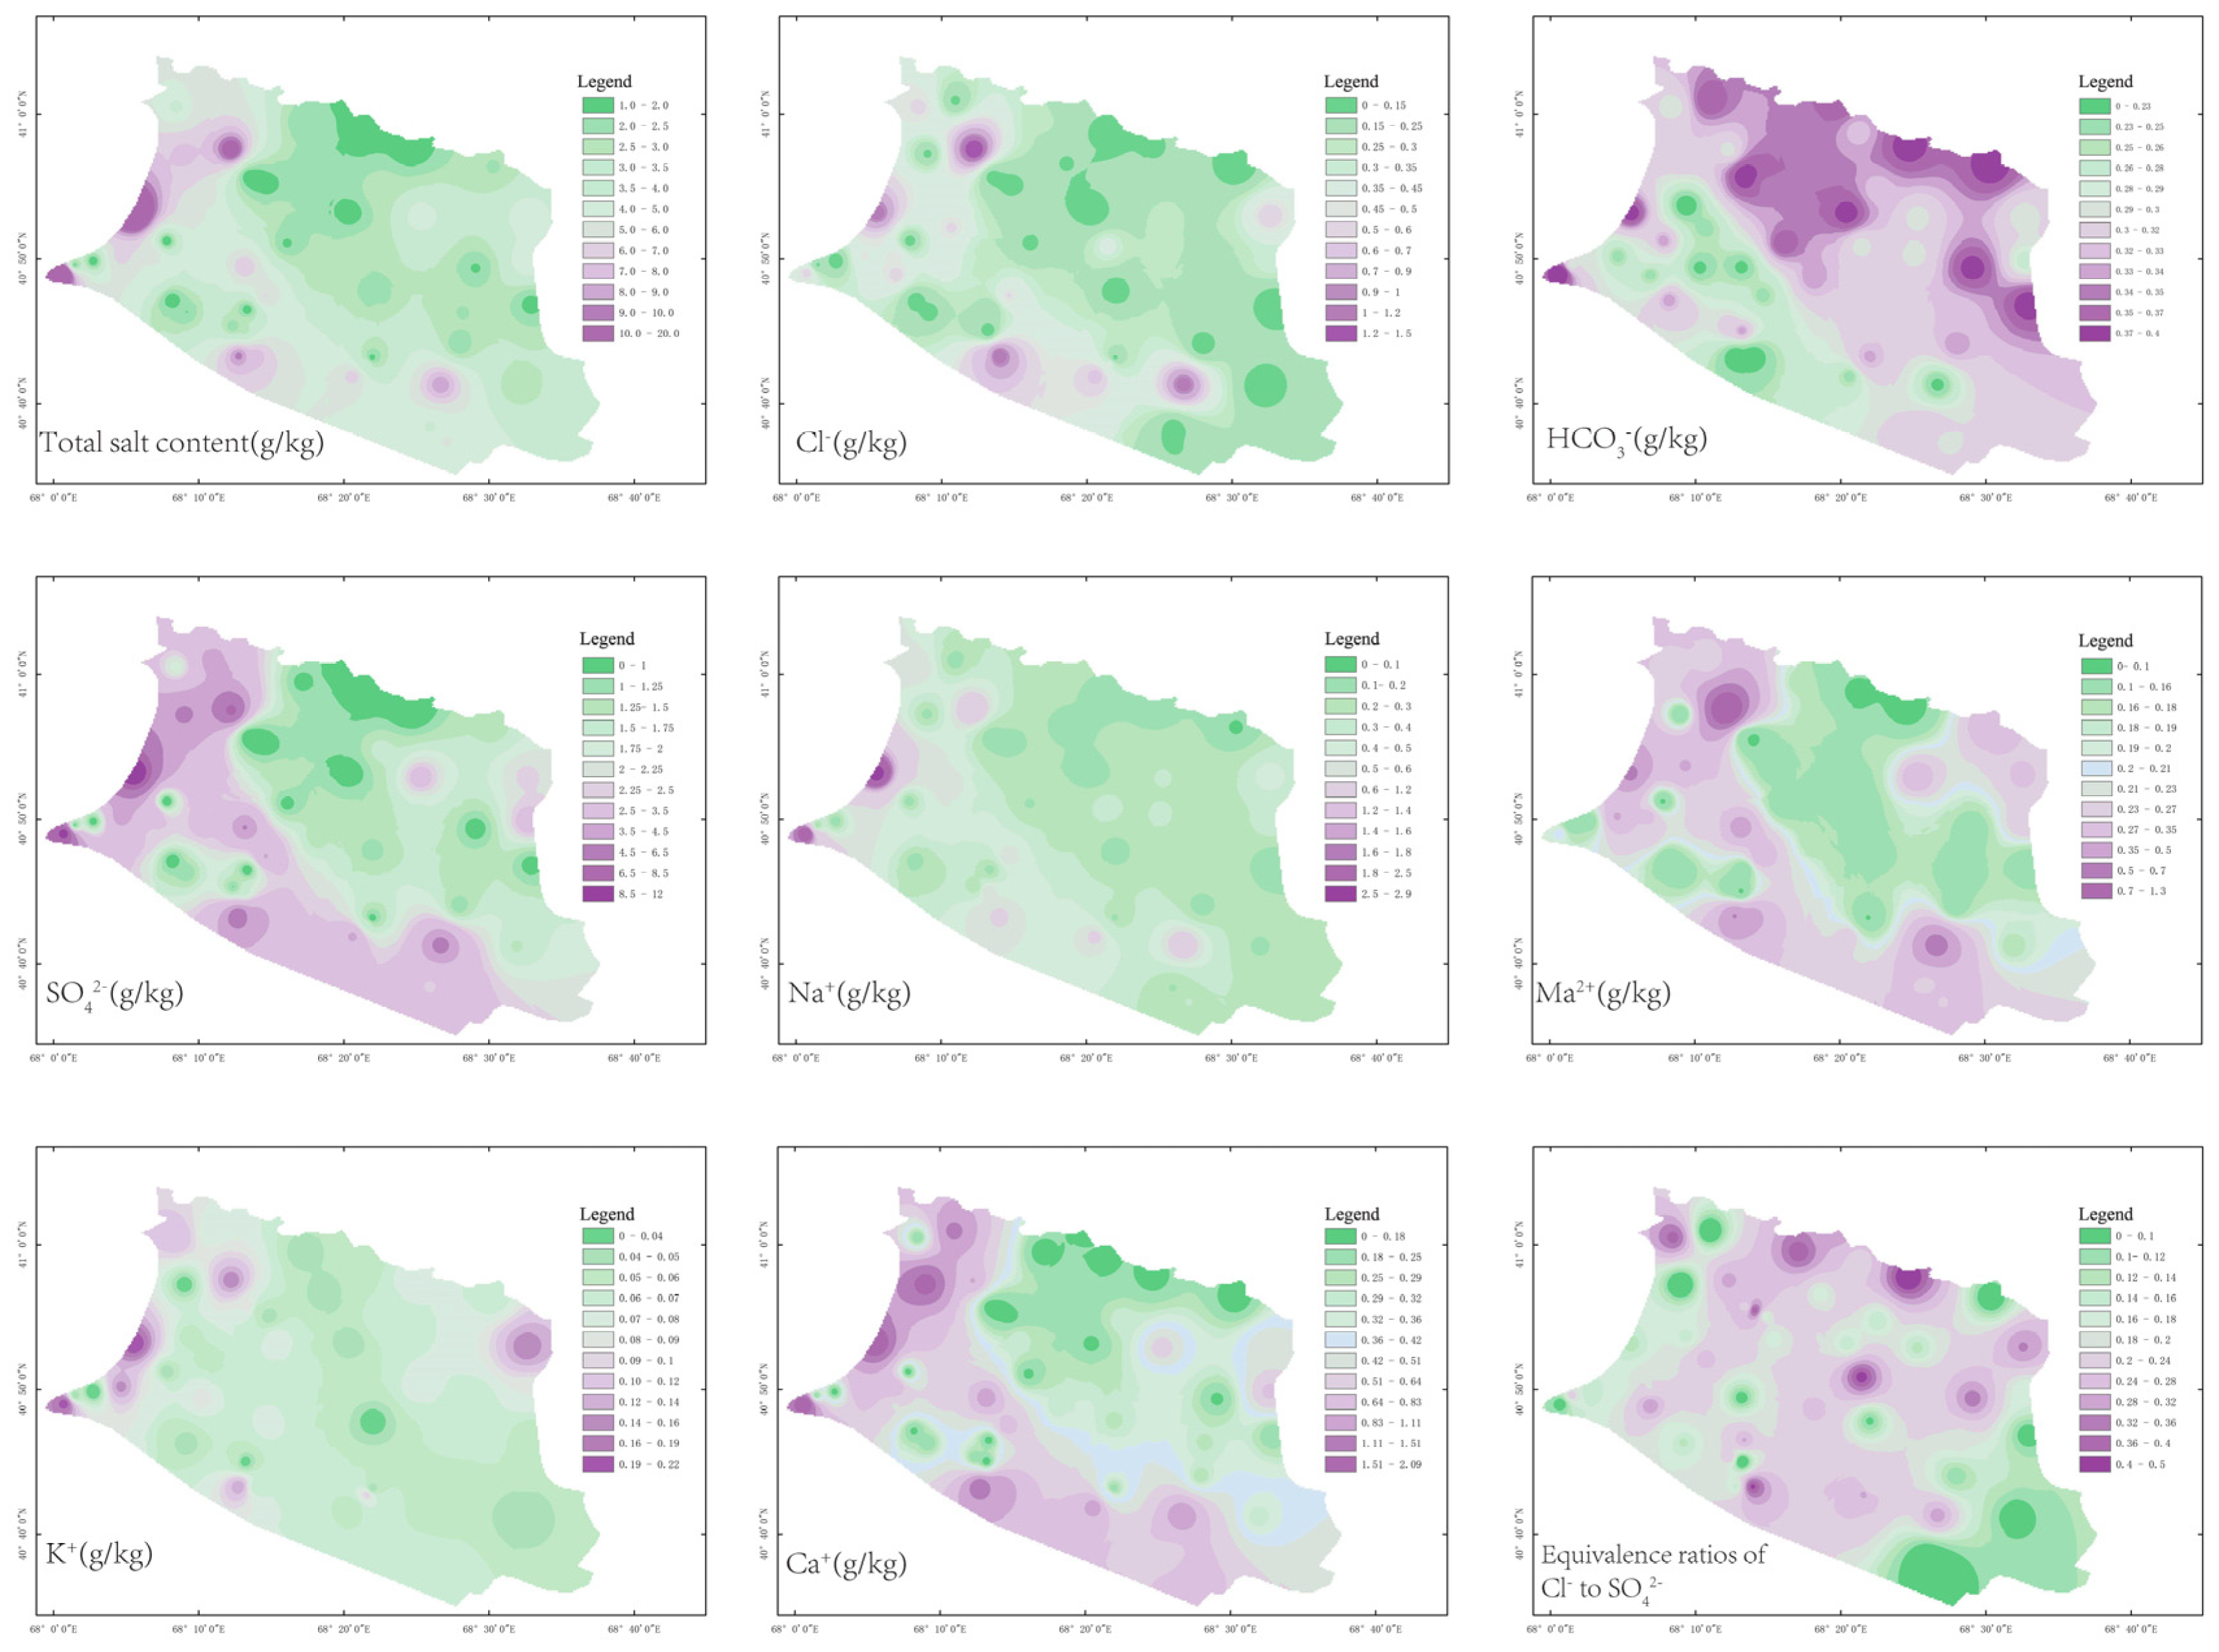
In the Shardara zone, the total salt content was higher in the central area adjacent to the Syr Darya River, and in the southern area close to the Shardara Reservoir. In the Mahtaaral region, the areas with higher total salt contents were mainly concentrated in the northwestern area near Anasay Bay. There were 119 thousand hectares of arable land both in the Shardara and Mahtarral area that were threatened by varying degrees of salinity, which was estimated to reduce cotton production in the area by 55.96–81.48 thousand tons per year.
(3)
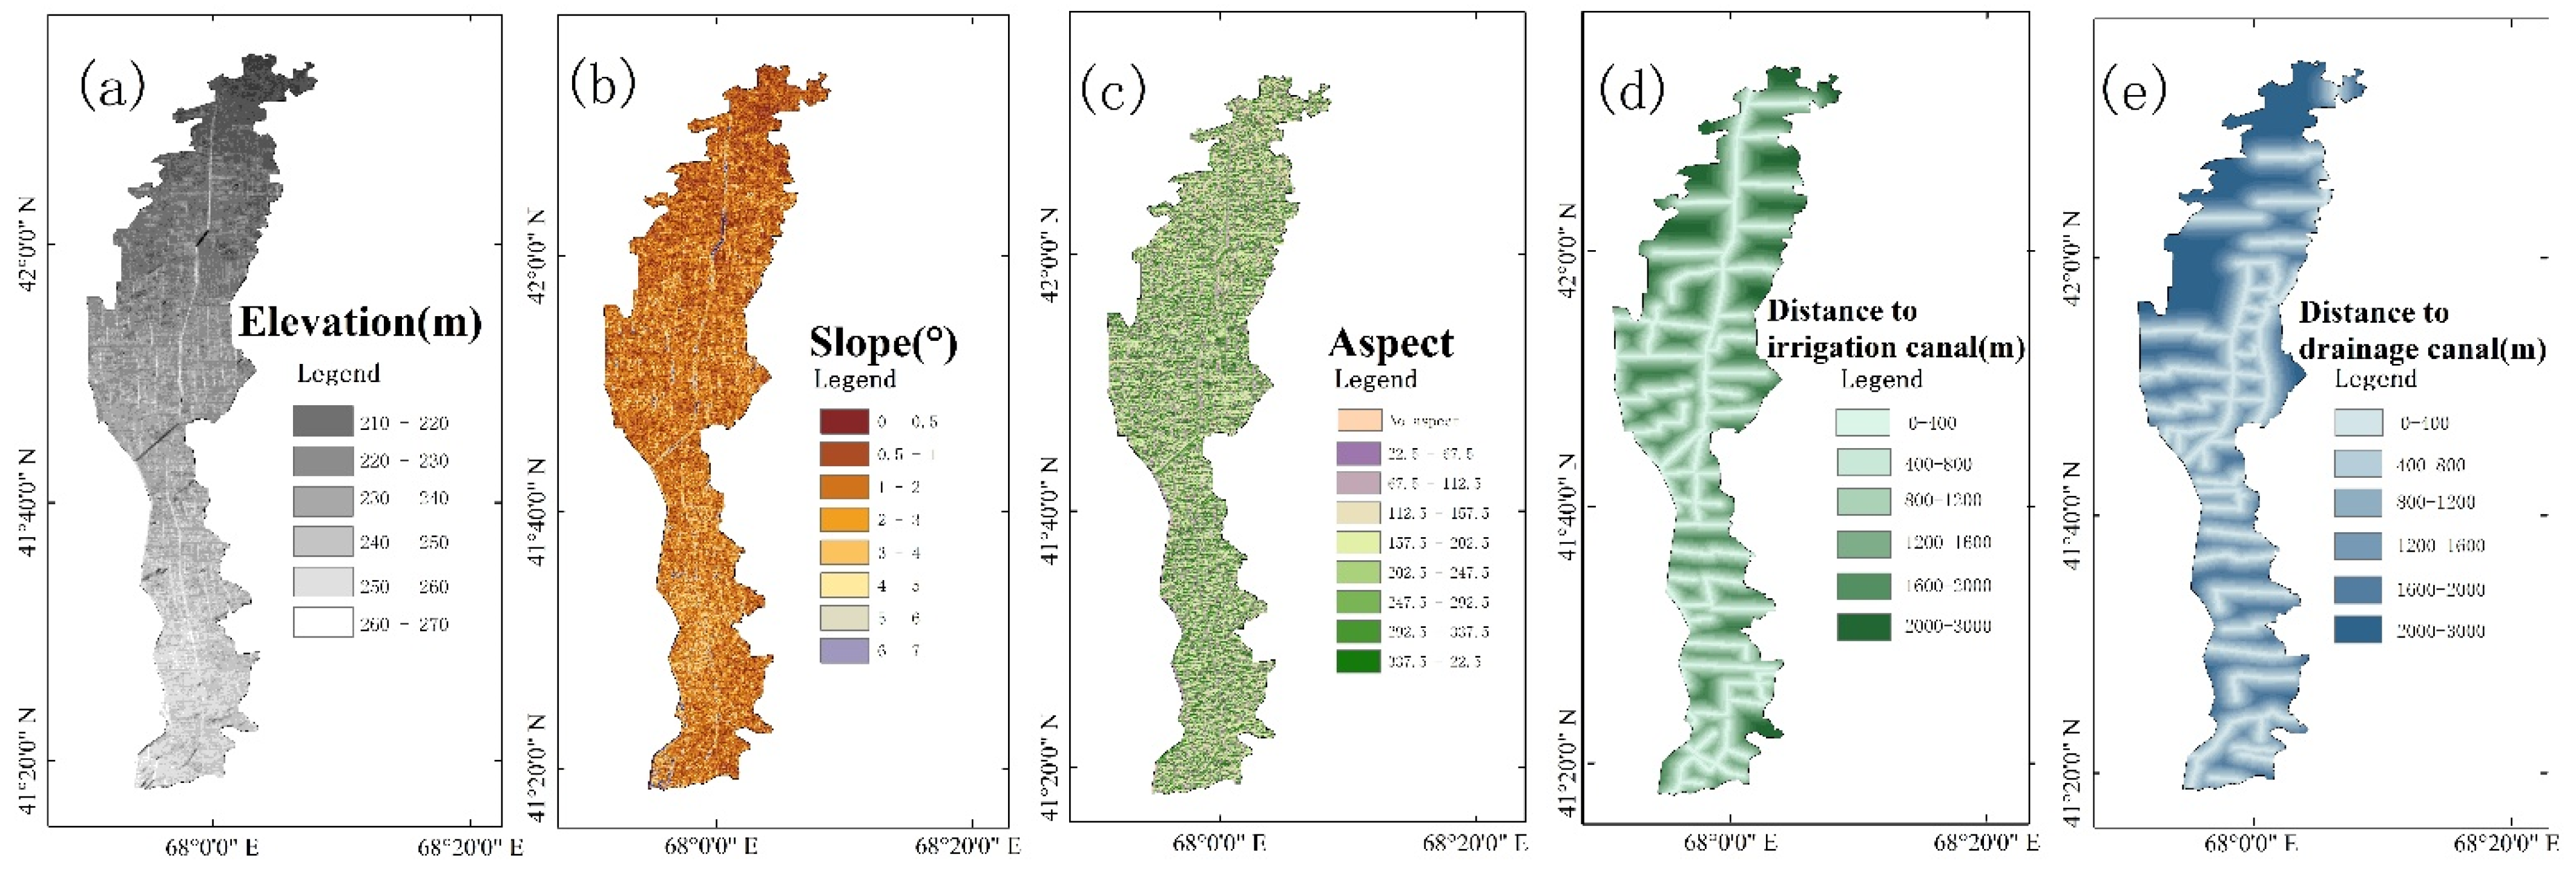
In the Shardara zone, the main drivers affecting the spatial distribution of salinity were distance from irrigation canals (0.425) and distance from drainage canals (0.420), while in the Mahtaaral zone, the main driver was elevation (0.326). The interactions between distance to the irrigation canal and distance to the drainage canal had the strongest explanatory power for salinity, with q values of 0.96 in Shardara and 0.98 in Mahtaaral. The interactions between various factors basically represented a nonlinear enhancement, and the interactions between topographic factors and human activity factors had stronger explanatory power than single factors.

Author Contributions

Funding acquisition, L.M. conceptualization, Y.D. and L.M.; methodology, Y.D.; investigation, W.L., Z.S. and G.S.; software, Y.D., Z.S. and G.S.; validation, W.L. and Z.S.; formal analysis, Y.D. and W.L.; writing—original draft preparation, Y.D.; writing—review and editing, L.M. and J.A.; visualization, Y.D., Z.S. and G.S.; supervision, L.M. and J.A. All authors have read and agreed to the published version of the manuscript.

Funding

This research was funded by the Regional Collaborative Innovation Project of Xinjiang Uygur Autonomous Region of China (2020E01013), National Natural Science Foundation of China (42171014), LU JIAXI International team program supported by the K.C. Wong Education Foundation (GJTD-2020-14), and the High-level Training Project of Xinjiang Institute of Ecology and Geography, CAS (E050030101).

Data Availability Statement

Not applicable.

Acknowledgments

We thank Kanat Samarkhanov for helping us in fieldwork. We thank two anonymous reviewers for their valuable comments and suggestions.

Conflicts of Interest

The authors declare no conflict of interest.

References

  1. Ivushkin, K.; Bartholomeus, H.; Bregt, A.K.; Pulatov, A.; Kempen, B.; De Sousa, L. Global mapping of soil salinity change. Remote Sens. Environ. 2019, 231, 111260. [Google Scholar] [CrossRef]
  2. Qadir, M.; Noble, A.; Schubert, S.; Thomas, R.J.; Arslan, A. Sodicity-induced land degradation and its sustainable management: Problems and prospects. Land Degrad. Dev. 2006, 17, 661–676. [Google Scholar] [CrossRef]
  3. Wong, V.N.; Greene, R.; Dalal, R.C.; Murphy, B.W. Soil carbon dynamics in saline and sodic soils: A review. Soil Use Manag. 2010, 26, 2–11. [Google Scholar] [CrossRef]
  4. Dregne, H.E. Land degradation in the drylands. Arid Land Res. Manag. 2002, 16, 99–132. [Google Scholar] [CrossRef]
  5. Wang, J.; Liu, Y.; Wang, S.; Liu, H.; Fu, G.; Xiong, Y. Spatial distribution of soil salinity and potential implications for soil management in the Manas River watershed, China. Soil Use Manag. 2020, 36, 93–103. [Google Scholar] [CrossRef]
  6. Vargas, R.; Pankova, E.A.I.; Balyuk, S.; Krasilnikov, P.; Khasankhanova, G. Handbook for Saline Soil Management; Global Soil Partnership: Rome, Italy, 2018. [Google Scholar]
  7. Lioubimtseva, E.; Cole, R. Uncertainties of climate change in arid environments of Central Asia. Rev. Fish. Sci. 2006, 14, 29–49. [Google Scholar] [CrossRef]
  8. Leng, P.; Zhang, Q.; Li, F.; Kulmatov, R.; Wang, G.; Qiao, Y.; Wang, J.; Peng, Y.; Tian, C.; Zhu, N. Agricultural impacts drive longitudinal variations of riverine water quality of the Aral Sea basin (Amu Darya and Syr Darya Rivers), Central Asia. Environ. Pollut. 2021, 284, 117405. [Google Scholar] [CrossRef] [PubMed]
  9. Shi, H.; Luo, G.; Zheng, H.; Chen, C.; Bai, J.; Liu, T.; Ochege, F.U.; De Maeyer, P. Coupling the water-energy-food-ecology nexus into a Bayesian network for water resources analysis and management in the Syr Darya River basin. J. Hydrol. 2020, 581, 124387. [Google Scholar] [CrossRef]
  10. Micklin, P. The Aral sea disaster. Annu. Rev. Earth Planet. Sci. 2007, 35, 47–72. [Google Scholar] [CrossRef]
  11. Karami, S.; Hamzeh, N.H.; Kaskaoutis, D.G.; Rashki, A.; Alam, K.; Ranjbar, A. Numerical simulations of dust storms originated from dried lakes in central and southwest Asia: The case of Aral Sea and Sistan Basin. Aeolian Res. 2021, 50, 100679. [Google Scholar] [CrossRef]
  12. Indoitu, R.; Kozhoridze, G.; Batyrbaeva, M.; Vitkovskaya, I.; Orlovsky, N.; Blumberg, D.; Orlovsky, L. Dust emission and environmental changes in the dried bottom of the Aral Sea. Aeolian Res. 2015, 17, 101–115. [Google Scholar] [CrossRef]
  13. Abuduwaili, J.; DongWei, L.; GuangYang, W. Saline dust storms and their ecological impacts in arid regions. J. Arid Land 2010, 2, 144–150. [Google Scholar] [CrossRef]
  14. Bissenbayeva, S.; Abuduwaili, J.; Saparova, A.; Ahmed, T. Long-term variations in runoff of the Syr Darya River Basin under climate change and human activities. J. Arid Land 2021, 13, 56–70. [Google Scholar] [CrossRef]
  15. Yao, J.; Chen, Y. Trend analysis of temperature and precipitation in the Syr Darya Basin in Central Asia. Theor. Appl. Climatol. 2015, 120, 521–531. [Google Scholar] [CrossRef]
  16. Sorg, A.; Mosello, B.; Shalpykova, G.; Allan, A.; Clarvis, M.H.; Stoffel, M. Coping with changing water resources: The case of the Syr Darya river basin in Central Asia. Environ. Sci. Policy 2014, 43, 68–77. [Google Scholar] [CrossRef]
  17. Zou, S.; Jilili, A.; Duan, W.; Maeyer, P.D.; de Voorde, T.V. Human and natural impacts on the water resources in the Syr Darya River Basin, Central Asia. Sustainability 2019, 11, 3084. [Google Scholar] [CrossRef]
  18. Samarkhanov, K.; Abuduwaili, J.; Samat, A.; Issanova, G. The Spatial and Temporal Land Cover Patterns of the Qazaly Irrigation Zone in 2003–2018: The Case of Syrdarya River’s Lower Reaches, Kazakhstan. Sustainability 2019, 11, 4035. [Google Scholar] [CrossRef]
  19. Wang, W.; Samat, A.; Abuduwaili, J.; Ge, Y. Quantifying the influences of land surface parameters on LST variations based on GeoDetector model in Syr Darya Basin, Central Asia. J. Arid Environ. 2021, 186, 104415. [Google Scholar] [CrossRef]
  20. Qushimov, B.; Ganiev, I.; Rustamova, I.; Haitov, B.; Islam, K. Land degradation by agricultural activities in Central Asia. In Climate Change and Terrestrial Carbon Sequestration in Central Asia; Taylor and Francis: London, UK, 2007; pp. 137–146. [Google Scholar]
  21. Lal, R. Soil and Environmental Degradation in Central Asia; Taylor and Francis: London, UK, 2007. [Google Scholar]
  22. Liu, W.; Ma, L.; Smanov, Z.; Samarkhanov, K.; Abuduwaili, J. Clarifying Soil Texture and Salinity Using Local Spatial Statistics (Getis-Ord Gi* and Moran’s I) in Kazakh–Uzbekistan Border Area, Central Asia. Agronomy 2022, 12, 332. [Google Scholar] [CrossRef]
  23. Konstantinovna, T.T.; Zheksembaevna, A.N. Impact of aridization on soil cover transformation of the Aral Sea and the modern Syr-Darya Delta. J. Arid Land 2011, 3, 150–154. [Google Scholar] [CrossRef]
  24. Shirokova, Y.; Forkutsa, I.; Sharafutdinova, N. Use of Electrical Conductivity Instead of Soluble Salts for Soil Salinity Monitoring in Central Asia. Irrig. Drain. Syst. 2000, 14, 199–206. [Google Scholar] [CrossRef]
  25. Bezborodov, G.; Shadmanov, D.; Mirhashimov, R.; Yuldashev, T.; Qureshi, A.S.; Noble, A.; Qadir, M. Mulching and water quality effects on soil salinity and sodicity dynamics and cotton productivity in Central Asia. Agric. Ecosyst. Environ. 2010, 138, 95–102. [Google Scholar] [CrossRef]
  26. Egamberdieva, D.; Renella, G.; Wirth, S.; Islam, R. Secondary salinity effects on soil microbial biomass. Biol. Fertil. Soils 2010, 46, 445–449. [Google Scholar] [CrossRef]
  27. Egamberdiyeva, D.; Garfurova, I.; Islam, K. Salinity effects on irrigated soil chemical and biological properties in the Aral Sea basin of Uzbekistan. In Climate Change and Terrestrial Carbon Sequestration in Central Asia; Taylor-Francis: New York, NY, USA, 2007; pp. 147–162. [Google Scholar]
  28. Funakawa, S.; Kosaki, T. Potential risk of soil salinization in different regions of Central Asia with special reference to salt reserves in deep layers of soils. Soil Sci. Plant Nutr. 2007, 53, 634–649. [Google Scholar] [CrossRef]
  29. Funakawa, S.; Kosaki, T.; Suzuki, R.; Kanaya, S.; Karbozova, E.; Mirzojonov, K. Soil salinization under the large-scale irrigation agriculture along Ili and Syr-Daria River. Sustainable Use of Natural Resources of Central Asia. Environmental Problems of the Aral Sea and Surrounding Areas. 1998, pp. 37–41. Available online: https://portals.iucn.org/library/node/24245 (accessed on 14 July 2022).
  30. Harris, I.; Osborn, T.J.; Jones, P.; Lister, D. Version 4 of the CRU TS monthly high-resolution gridded multivariate climate dataset. Sci. Data 2020, 7, 109. [Google Scholar] [CrossRef]
  31. Hawker, L.; Uhe, P.; Paulo, L.; Sosa, J.; Savage, J.; Sampson, C.; Neal, J. A 30m global map of elevation with forests and buildings removed. Environ. Res. Lett. 2022, 17, 024016. [Google Scholar] [CrossRef]
  32. Nachtergaele, F.; van Velthuizen, H.; Verelst, L.; Batjes, N.; Dijkshoorn, K.; van Engelen, V.; Fischer, G.; Jones, A.; Montanarela, L. The harmonized world soil database. In Proceedings of the 19th World Congress of Soil Science, Soil Solutions for a Changing World, Brisbane, Australia, 1–6 August 2010; pp. 34–37. [Google Scholar]
  33. Otarov, A.; Ibrayeva, M. Co-ordination of scientific activities towards elaboration of common strategy for environmental protection and sustainable management in Syr Darya River Basin. Uzbekistan and Kazakhstan. Community Research and Development Information Service; Report Proposal. European Commission, 2002. Available online: https://cordis.europa.eu/ (accessed on 14 July 2022).
  34. Liu, W.; Ma, L.; Abuduwaili, J. Potentially Toxic Elements in Oasis Agricultural Soils Caused by High-Intensity Exploitation in the Piedmont Zone of the Tianshan Mountains, China. Agriculture 2021, 11, 1234. [Google Scholar] [CrossRef]
  35. Sonmez, S.; Buyuktas, D.; Okturen, F.; Citak, S. Assessment of different soil to water ratios (1:1, 1:2.5, 1:5) in soil salinity studies. Geoderma 2008, 144, 361–369. [Google Scholar] [CrossRef]
  36. Zhang, W.; Ma, L.; Abuduwaili, J.; Ge, Y.; Issanova, G.; Saparov, G. Hydrochemical characteristics and irrigation suitability of surface water in the Syr Darya River, Kazakhstan. Environ. Monit. Assess. 2019, 191, 572. [Google Scholar] [CrossRef]
  37. Allison, L. Diagnosis and Improvement of Saline and Alkali Soils; US Department of Agriculture: Washington, DC, USA, 1954; p. 26.
  38. Daliakopoulos, I.N.; Tsanis, I.K.; Koutroulis, A.; Kourgialas, N.N.; Varouchakis, A.E.; Karatzas, G.P.; Ritsema, C.J. The threat of soil salinity: A European scale review. Sci. Total Environ. 2016, 573, 727–739. [Google Scholar] [CrossRef]
  39. Kulmatov, R.; Khasanov, S.; Odilov, S.; Li, F. Assessment of the space-time dynamics of soil salinity in irrigated areas under climate change: A case study in Sirdarya Province, Uzbekistan. Water Air Soil Pollut. 2021, 232, 216. [Google Scholar] [CrossRef]
  40. Fang, K.; Li, H.; Wang, Z.; Du, Y.; Wang, J. Comparative analysis on spatial variability of soil moisture under different land use types in orchard. Sci. Hortic. 2016, 207, 65–72. [Google Scholar] [CrossRef]
  41. Wang, J.F.; Li, X.H.; Christakos, G.; Liao, Y.L.; Zhang, T.; Gu, X.; Zheng, X.Y. Geographical detectors-based health risk assessment and its application in the neural tube defects study of the Heshun Region, China. Int. J. Geogr. Inf. Sci. 2010, 24, 107–127. [Google Scholar] [CrossRef]
  42. Li, S.; Lu, L.; Gao, Y.; Zhang, Y.; Shen, D. An Analysis on the Characteristics and Influence Factors of Soil Salinity in the Wasteland of the Kashgar River Basin. Sustainability 2022, 14, 3500. [Google Scholar] [CrossRef]
  43. Kulmatov, R.; Groll, M.; Rasulov, A.; Soliev, I.; Romic, M. Status quo and present challenges of the sustainable use and management of water and land resources in Central Asian irrigation zones-The example of the Navoi region (Uzbekistan). Quat. Int. 2018, 464, 396–410. [Google Scholar] [CrossRef]
  44. Rahman, M.M.; Mostofa, M.G.; Keya, S.S.; Siddiqui, M.N.; Ansary, M.M.U.; Das, A.K.; Rahman, M.A.; Tran, L.S.-P. Adaptive Mechanisms of Halophytes and Their Potential in Improving Salinity Tolerance in Plants. Int. J. Mol. Sci. 2021, 22, 10733. [Google Scholar] [CrossRef]
  45. Feng, J.; Liu, H.; Wang, G.; Tian, R.; Cao, M.; Bai, Z.; He, T. Effect of Periodic Winter Irrigation on Salt Distribution Characteristics and Cotton Yield in Drip Irrigation under Plastic Film in Xinjiang. Water 2021, 13, 2545. [Google Scholar] [CrossRef]
  46. Zhang, J.; Du, D.; Ji, D.; Bai, Y.; Jiang, W. Multivariate Analysis of Soil Salinity in a Semi-Humid Irrigated District of China: Concern about a Recent Water Project. Water 2020, 12, 2104. [Google Scholar] [CrossRef]
  47. Su, Y.; Li, T.; Cheng, S.; Wang, X. Spatial distribution exploration and driving factor identification for soil salinisation based on geodetector models in coastal area. Ecol. Eng. 2020, 156, 105961. [Google Scholar] [CrossRef]
  48. Suska-Malawska, M. Spatial and In-Depth Distribution of Soil Salinity and Heavy Metals (Pb, Zn, Cd, Ni, Cu) in Arable Irrigated Soils in Southern Kazakhstan. Agronomy 2022, 12, 1207. [Google Scholar] [CrossRef]
  49. Thorslund, J.; Bierkens, M.F.; Oude Essink, G.H.; Sutanudjaja, E.H.; van Vliet, M.T. Common irrigation drivers of freshwater salinisation in river basins worldwide. Nat. Commun. 2021, 12, 4232. [Google Scholar] [CrossRef] [PubMed]
  50. Qian, T.; Tsunekawa, A.; Masunaga, T.; Wang, T. Analysis of the spatial variation of soil salinity and its causal factors in China’s Minqin Oasis. Math. Probl. Eng. 2017, 2017, 974526. [Google Scholar] [CrossRef]
  51. Akramkhanov, A.; Martius, C.; Park, S.; Hendrickx, J. Environmental factors of spatial distribution of soil salinity on flat irrigated terrain. Geoderma 2011, 163, 55–62. [Google Scholar] [CrossRef]
  52. Bekbayev, R.K.; Balgabayev, N.N.; Zaparkulova, E.; Bekbayev, N.R. Dynamics of Condition of Groundwater and Using if for Sub-Irrigation on Irrigated Lands of the Golodnostepsky Massif. Orient. J. Chem. 2015, 31, 219–230. [Google Scholar]
  53. Burkhanovich, A.S.; Tairovna, S.N. Aydar-Arnasay lake system: Ecological safety and its problems of sustainable development. Eur. Sci. Rev. 2018, 5–6, 275–278. [Google Scholar]
  54. Groll, M.; Kulmatov, R.; Mullabaev, N.; Opp, C.; Kulmatova, D. Rise and decline of the fishery industry in the Aydarkul–Arnasay Lake System (Uzbekistan): Effects of reservoir management, irrigation farming and climate change on an unstable ecosystem. Environ. Earth Sci. 2016, 75, 921. [Google Scholar] [CrossRef]
  55. Hammam, A.; Mohamed, E. Mapping soil salinity in the East Nile Delta using several methodological approaches of salinity assessment. Egypt. J. Remote Sens. Space Sci. 2020, 23, 125–131. [Google Scholar] [CrossRef]
  56. Tripathi, R.; Nayak, A.; Shahid, M.; Raja, R.; Panda, B.; Mohanty, S.; Kumar, A.; Lal, B.; Gautam, P.; Sahoo, R. Characterizing spatial variability of soil properties in salt affected coastal India using geostatistics and kriging. Arab. J. Geosci. 2015, 8, 10693–10703. [Google Scholar] [CrossRef]
  57. Awan, U.K.; Ibrakhimov, M.; Tischbein, B.; Kamalov, P.; Martius, C.; Lamers, J.P. Improving irrigation water operation in the lower reaches of the Amu Darya River–current status and suggestions. Irrig. Drain. 2011, 60, 600–612. [Google Scholar] [CrossRef]
  58. Abuduwaili, J.; Yang, T.; Abulimiti, M.; DongWei, L.; Long, M. Spatial distribution of soil moisture, salinity and organic matter in Manas River watershed, Xinjiang, China. Arid Land 2012, 4, 441–449. [Google Scholar] [CrossRef]
  59. Wang, F.; Yang, S.; Wei, Y.; Shi, Q.; Ding, J. Characterizing soil salinity at multiple depth using electromagnetic induction and remote sensing data with random forests: A case study in Tarim River Basin of southern Xinjiang, China. Sci. Total Environ. 2021, 754, 142030. [Google Scholar] [CrossRef] [PubMed]
Figure 1. (a) Study area in Kazakhstan. (b) Location of sampling sites in Shardara (T01–T28). (c) Location of sampling sites in Mahtaaral (S01–S56).
Agronomy 12 01912 g001
Figure 2. (a) Percentage stacked bar chart of salt content; and (b) pH and SAR of sample sites.
Agronomy 12 01912 g002
Figure 3. Spatial distribution of salinity, major salt ions, and Cl/SO42− equivalent ratio of cropland in the Shardara district.
Agronomy 12 01912 g003
Figure 4. Spatial distribution of salinity, major salt ions, and Cl/SO42− equivalent ratio of cropland in the Mahtaaral district.
Agronomy 12 01912 g004
Figure 5. (a) The spatial distribution of saline soil type in Mahtaaral district; (b) The spatial distribution of saline soil type in Shardara district; (c) The spatial distribution of soil salinity levels in Mahtaaral district; (d) The spatial distribution of soil salinity levels in Shardara district; and (e) The Cl/SO42 equivalent ratio of sample sites.
Agronomy 12 01912 g005
Figure 6. Soil salinity variable cluster analysis diagram.
Agronomy 12 01912 g006
Figure 7. Spatial distribution of factors influencing soil salinity in the Shardara district: (a) elevation; (b) slope; (c) aspect; (d) distance to drainage canal; and (e) distance to irrigation canal.
Agronomy 12 01912 g007
Figure 8. Spatial distribution of factors influencing soil salinity in the Mahtaaral district: (a) elevation; (b) slope; (c) aspect; (d) distance to drainage canal; and (e) distance to irrigation canal.
Agronomy 12 01912 g008
Figure 9. The explanatory power of different influencing factors on soil salinity in Shardara and Mahtaaral regions.
Agronomy 12 01912 g009
Figure 10. Two-factor explanatory power of the interactions between different influencing factors on soil salinity.
Agronomy 12 01912 g010
Table 1. Categorization standard of soil salinity and salt soil type.
Total Salt ConcentrationSalinity ClassificationCl/SO42−Salt Soil Type
0–3Nonsaline soilCl/SO42− > 4.0Chloride
3–6Mild saline soil1.0 < Cl/SO42− < 4.0Sulfate-chloride
6–10Moderate saline soil0.2 < Cl/SO42− < 1.0Chloride-sulfate
10–20Severe saline soilCl/SO42− < 0.2Sulfate
>20SaltierraHCO3 + CO32−/ Cl/SO42− > 1.0Soda
Table 2. Interaction relationships between factors.
TypeComparison
Nonlinear-weaken q { X 1   X 2 } < M i n { q ( X 1 ) , q ( X 2 ) }
Uni-weaken Min { q ( X 1 ) , q ( X 2 ) }   <   q { X 1   X 2 }   <   Max { q ( X 1 ) , q X 2 }
Bi-enhance q { X 1   X 2 } > Max { q ( X 1 ) , q X 2 }
Independent q { X 1   X 2 } = q ( X 1 ) + q ( X 2 ) ,
Nonlinear-enhance q { X 1   X 2 } > q ( X 1 ) + q ( X 2 ) ,
Table 3. Statistical parameters of major ions, total salt concentration (TSC), pH, Cl/SO42−, and SAR.
Statistics (N = 84)MeanMedianSd aSe bCv cMin dMax e
pH8.098.070.250.033%7.378.98
TSC (g/kg)3.992.464.580.50115%0.833.77
HCO3 (g/kg)0.310.320.060.0119%0.20.49
Cl (g/kg)0.350.150.820.09236%0.017.26
SO42− (g/kg)2.181.252.560.28118%0.2616.25
Ca2+ (g/kg)0.460.270.490.05107%0.082.4
Mg2+ (g/kg)0.220.120.310.03139%0.022.49
Na+ (g/kg)0.40.220.650.07163%0.055
K+ (g/kg)0.070.060.040.0164%0.010.23
Cl/SO42−0.20.170.130.0162%0.030.6
SAR3.492.882.700.2977%0.9716.99
a—Standard deviation; b—Standard Error; c—coefficient of variation; d—minimum; e—maximum;
Table 4. Distribution area of different degrees of saline soils.
Study AreaNonsalineMild SalineModerate SalineSevere SalineSaltierraSum
Mahtaaral51.583.212.51.60.0148.8
Shardara31.417.62.61.00.553.1
Total82.9100.815.12.60.5201.9
Units: thousand hectares.
Publisher’s Note: MDPI stays neutral with regard to jurisdictional claims in published maps and institutional affiliations.

