Article

Classification of Monofloral Honeys by Measuring Electrical Impedance Based on Neural Networks

by
Eduardo González María
1,*,
Antonio Madueño-Luna
2,
Antonio Ruiz-Canales
1 and
José Miguel Madueño Luna
3
1
Engineering Department, Miguel Hernández University of Elche, 03312 Orihuela, Spain
2
Aerospace Engineering and Fluid Mechanical Department, University of Seville, 41013 Seville, Spain
3
Graphics Engineering Department, University of Seville, 41013 Seville, Spain
*
Author to whom correspondence should be addressed.
Agronomy 2022, 12(8), 1929; https://doi.org/10.3390/agronomy12081929
Submission received: 29 July 2022 / Revised: 12 August 2022 / Accepted: 15 August 2022 / Published: 17 August 2022

Abstract

:
The study of electrical impedance applied to food has become a method with great potential for use in the food industry, which allows the monitoring and control of quality processes in a safe and non-invasive way. Recent research has shown that this technique can be an alternative method to determine the floral origin of the honey bee (Apis mellifera L.) and acquire information on chemical and physical properties such as conductivity, ash content and acidity. In this work, the electrical impedance of six monofloral honey samples from diverse origins and one commercial multi-floral honey were measured using a low-cost impedance meter, obtaining 101 samples (reactance (X) versus resistance (R)), with a frequency sweep between 1 Hz and 25 MHz in all the honeys analyzed. This shows that it is possible, by using a multilayer neural network trained from these data, to classify with 100% accuracy between these honeys and, thereby, quickly and easily determine the floral origin of the honey. This is without the need to use the chemical data or equivalent electrical models.

1. Introduction

Electrical impedance (Z) [1] is defined as the total opposition a device, circuit, substance or living tissue offers to the flow of an alternating current (AC) to a specific frequency. It is represented as a complex number with a graphic representation on a complex plane with a real part (resistance, R) and an imaginary part (reactance, X), expressed by using the rectangular coordinates in the form of R + j·X, or in the polar form as a magnitude and phase angle: | Z | Φ ] [2].
There are two alternatives for impedance measurement, the LCR meter, also known as the LCR bridge (with various configurations such as Schering [3] and the Maxwell bridge [4]), and the Impedance/Gain-Phase analyzer [5,6]. The first one is only suitable for pure components: inductors (L), capacitors (C), or resistors (R).
The Impedance/Gain-Phase analyzer is a powerful device capable of obtaining diagrams separately, both in magnitude and in the phase of any network, electronic circuit, substance or living tissue which has an input and an output [7,8,9]. These variables are represented according to frequency [10]. A frequency sweep with a sinusoidal signal is performed on the network with a specific criterion regarding the initial, intermediate and final frequency values; the number of points; linear or logarithmic sweep, etc. The magnitude diagram at each frequency is obtained by dividing the output amplitude by the input amplitude to the network. The phase diagram for each frequency is obtained from the phase difference between the network output and input signals.
The use of electrical impedance (EI) in the agri-food industry represents multiple advantages, such as its speed, economy, easy implementation, as well as being non-destructive and respectful of the environment, and represents great potential to replace traditional methods, which saves time, costs and staff training [11].
It is a very good option compared to traditional analysis methods, since it allows field and real-time measurements, as well as being easy to move and use [12].
Most of the studies carried out with this technique focus on the evaluation of the quality of meat and fish products, as well as on the characterization of the changes generated during the thermal processes and ripening of fruits [12].
In recent literature reviews, the electrical impedance technique has been used to detect and quantify toxic adulterants in food and bioconsumables, including honey, showing a constant variation in electrical impedance with the increase in the percentage of adulterant in the solution [13].
Likewise, this method has also been used to determine different botanical origins of honey [14,15] and as an alternative method to complement the labeling according to European legislation [16], in order to avoid unfair competition through false labeling.
Honey adulteration is a prominent global problem in the modern food supply chain. The most common case is cutting honey with cheap and readily available sugar-based sweeteners, such as high-fructose corn syrup [17]. Numerous studies have sought to detect the presence of sucrose as an adulterant in honey varieties selected from different floral origins using the electrical impedance spectroscopy technique with success [18].
Classically, the determination of the botanical origin of honey has been carried out by melissopalynological methods. Depending on the number of species used to obtain nectar for honey production, it can be classified into mono-floral and multifloral honey. This information allows the producer to classify the product according to the botanical origin, according to the predominant species in the area [19].
The composition of honey, in addition to being influenced by the flora visited by foraging bees [3,20], also depends on the edaphic and climatological conditions of the region, factors that influence pollen content, color, smell, flavor, texture and relative humidity [21].
The use of statistical methods on physical–chemical results has been a useful tool to characterize different types of honey. Electrical conductivity, pH and hydroxymethylfurfural (HMF) are the chemical parameters that are most used to predict the floral origin of honey samples [22].
On the other hand, the use of data mining methods and decision trees for the analysis of physical–chemical parameters can very well produce the structure of the data set [23].
Artificial neural networks are a computational model inspired by the behavior observed in its biological counterpart [24]. For example, the use of remote sensing and photogrammetric tools using artificial neural networks as a tool to support the practical use and improvement of precision agriculture techniques is becoming more and more common [25].
Rodriguez et al. studied the physicochemical properties through a probabilistic neural network (PNN) system with a Bayesian classifier with attributes and physicochemical properties, obtaining statistically significant differences and classifications between 95 and 100% accuracy [26]. Other physical parameters such as temperature, humidity, carbon dioxide concentration and hive weight have also been used to identify population variation through the use of artificial neural networks, allowing the future prediction of physical variables that directly affect health and hive population production [27].
Neural networks have also been successfully applied to pollen grain classification in palynology [28].
Its use is widespread in many fields. In honey analysis, comparative studies of various machine learning algorithms have been carried out for the classification of unifloral honeys [29]. In this study, a classifying neural network of the patternnet type [30] is used.
A principal component analysis (PCA) has been used to reduce the number of inputs to the neural network and for an adequate visualization of the experimental results [31], either directly, to reduce the dimensionality when chemical parameters are used directly [23], or on the parameters of the equivalent electrical model [7].
Through this work, a novel approach is provided, since we show that it is possible to classify the type of honey directly from the complex impedance data with a neural network without the need to refer to the data of the melissopalynological analysis or a previously adjusted electrical model.

2. Materials and Methods

2.1. Description of the Honeys Used

Six of the seven samples, corresponding to sample numbers 1, 2, 3, 4, 5 and 7, were provided by the Association of Beekeepers of the Community of Madrid (APIS-CAM). These samples were from local beekeepers, with settlements located in different areas of the central peninsular plateau.
Sample number 6, corresponding to the “thousand flowers” honey, is a commercial multifloral honey, whose physicochemical values have been determined according to the Guide-to-mieles-monoflorales-Ibéricas-Apinevada-Pajuelo-2018, and according to the Directive 110/2001 CE, RD 1049/2003 in Spain.
The six samples provided by Apiscam were harvested in the months of June and July of the year 2020 and analyzed in the same period using methods established according to current legislation to determine the pollen content and other chemical physical parameters, such as moisture content, hydroxymethylfurfural (HMF), conductivity and pH, among others. All the samples used in this study are classified as monofloral, according to the percentage of dominant pollen present in the honey.
The value that differentiates one honey from another is mainly associated with the botanical origin, since the composition of the pollen determines both the organoleptic characteristics and the physicochemical parameters of the honeys obtained [32].
In the samples analyzed (Table 1) the values of humidity, electrical conductivity, HMF and pH are within the values established in current legislation [33].
In relation to pH, there is a direct relationship between the pH of honey and its floral origin [34]. In our study, no honey exceeds values of 4.5 (Table 1), although samples 3 and 4 represent higher values than the rest of the honeys, which is probably associated with their botanical origin (viborera and rapeseed).
The normal values of the pH of honey range between 3.2 and 4.5, in such a way that this natural acidity allows the inhibition of the growth of microorganisms and preserves the honey [35], while forest honeys present higher values [36].
The color is also very important to define the origin and be able to grant its commercial classification as a monofloral honey, being a primary characteristic for commercial classification. The units in which the different classes of color in honey are expressed are the Pfund scale units, and this measurement can be made by comparing the honey with a reference standard that indicates the floral origin of the honey [35].
Regarding the humidity percentage of the samples obtained, all have values below 20%, complying with the values established in Royal Decree 1049/2003. These moisture values indicate, regardless of other parameters, that these honeys have a greater tendency toward granulation and less fermentation.
On the other hand, all the samples have low contents of hydroxymethylfurfural (HMF), with rapeseed honey showing the highest value but far from the legal maximum of 40 mg/kg [37]. This indicator, composed of an aldehyde and a furan resulting from the decomposition of monosaccharides, particularly fructose in an acid medium [38], is an important quality factor for honey, as it reflects the freshness of the samples and the conditions in which it was stored, as well as the treatment received and the age of the honey.
With respect to the floral origin, there is no criterion in the legislation that requires a honey to be florally named. For this reason, the criterion that is applied is related to the production and the melissopalynological analysis, in such a way that it is the beekeeper, who, taking into account the percentage of predominant pollen and the main botanical species present in the place of production, provides the monofloral denomination of honey.
The percentage of predominant pollens of the five samples in which the pollen analysis was carried out is: Sample 1: Echium 50%; Sample 2: Echium 62%; Sample 3: Echium 74%; Sample 4: Brassica 57%; Sample 5: Lavender 50%.
Table 2 shows the percentages of pollens identified according to the analysis method indicated above:
The current regulations that regulate the European honey market [37] consider, among other aspects, that honey can be labeled with indications that refer to its vegetable and geographical origin, as long as it comes from the indicated origin, and also differentiates two types of honey according to its vegetable origin, flower honeys or nectar and honeydew honeys.
The lack of specificity in the current regulations, both national and European, to delimit the botanical and geographical origin of nectar honeys through palynological criteria has led to consideration in recent decades of honey as monofloral when the percentage of the representation of a pollen type is greater than 45% [39].
Numerous authors have directly related the influence they have on the characteristics, both physicochemical and organoleptic, of the plant species and the flora visited by foraging bees [3,20], as well as the influence of the climatic and soil conditions of the place of cultivation, where they are collected [40], and the handling practices carried out by the beekeeper during their extraction and storage [41].

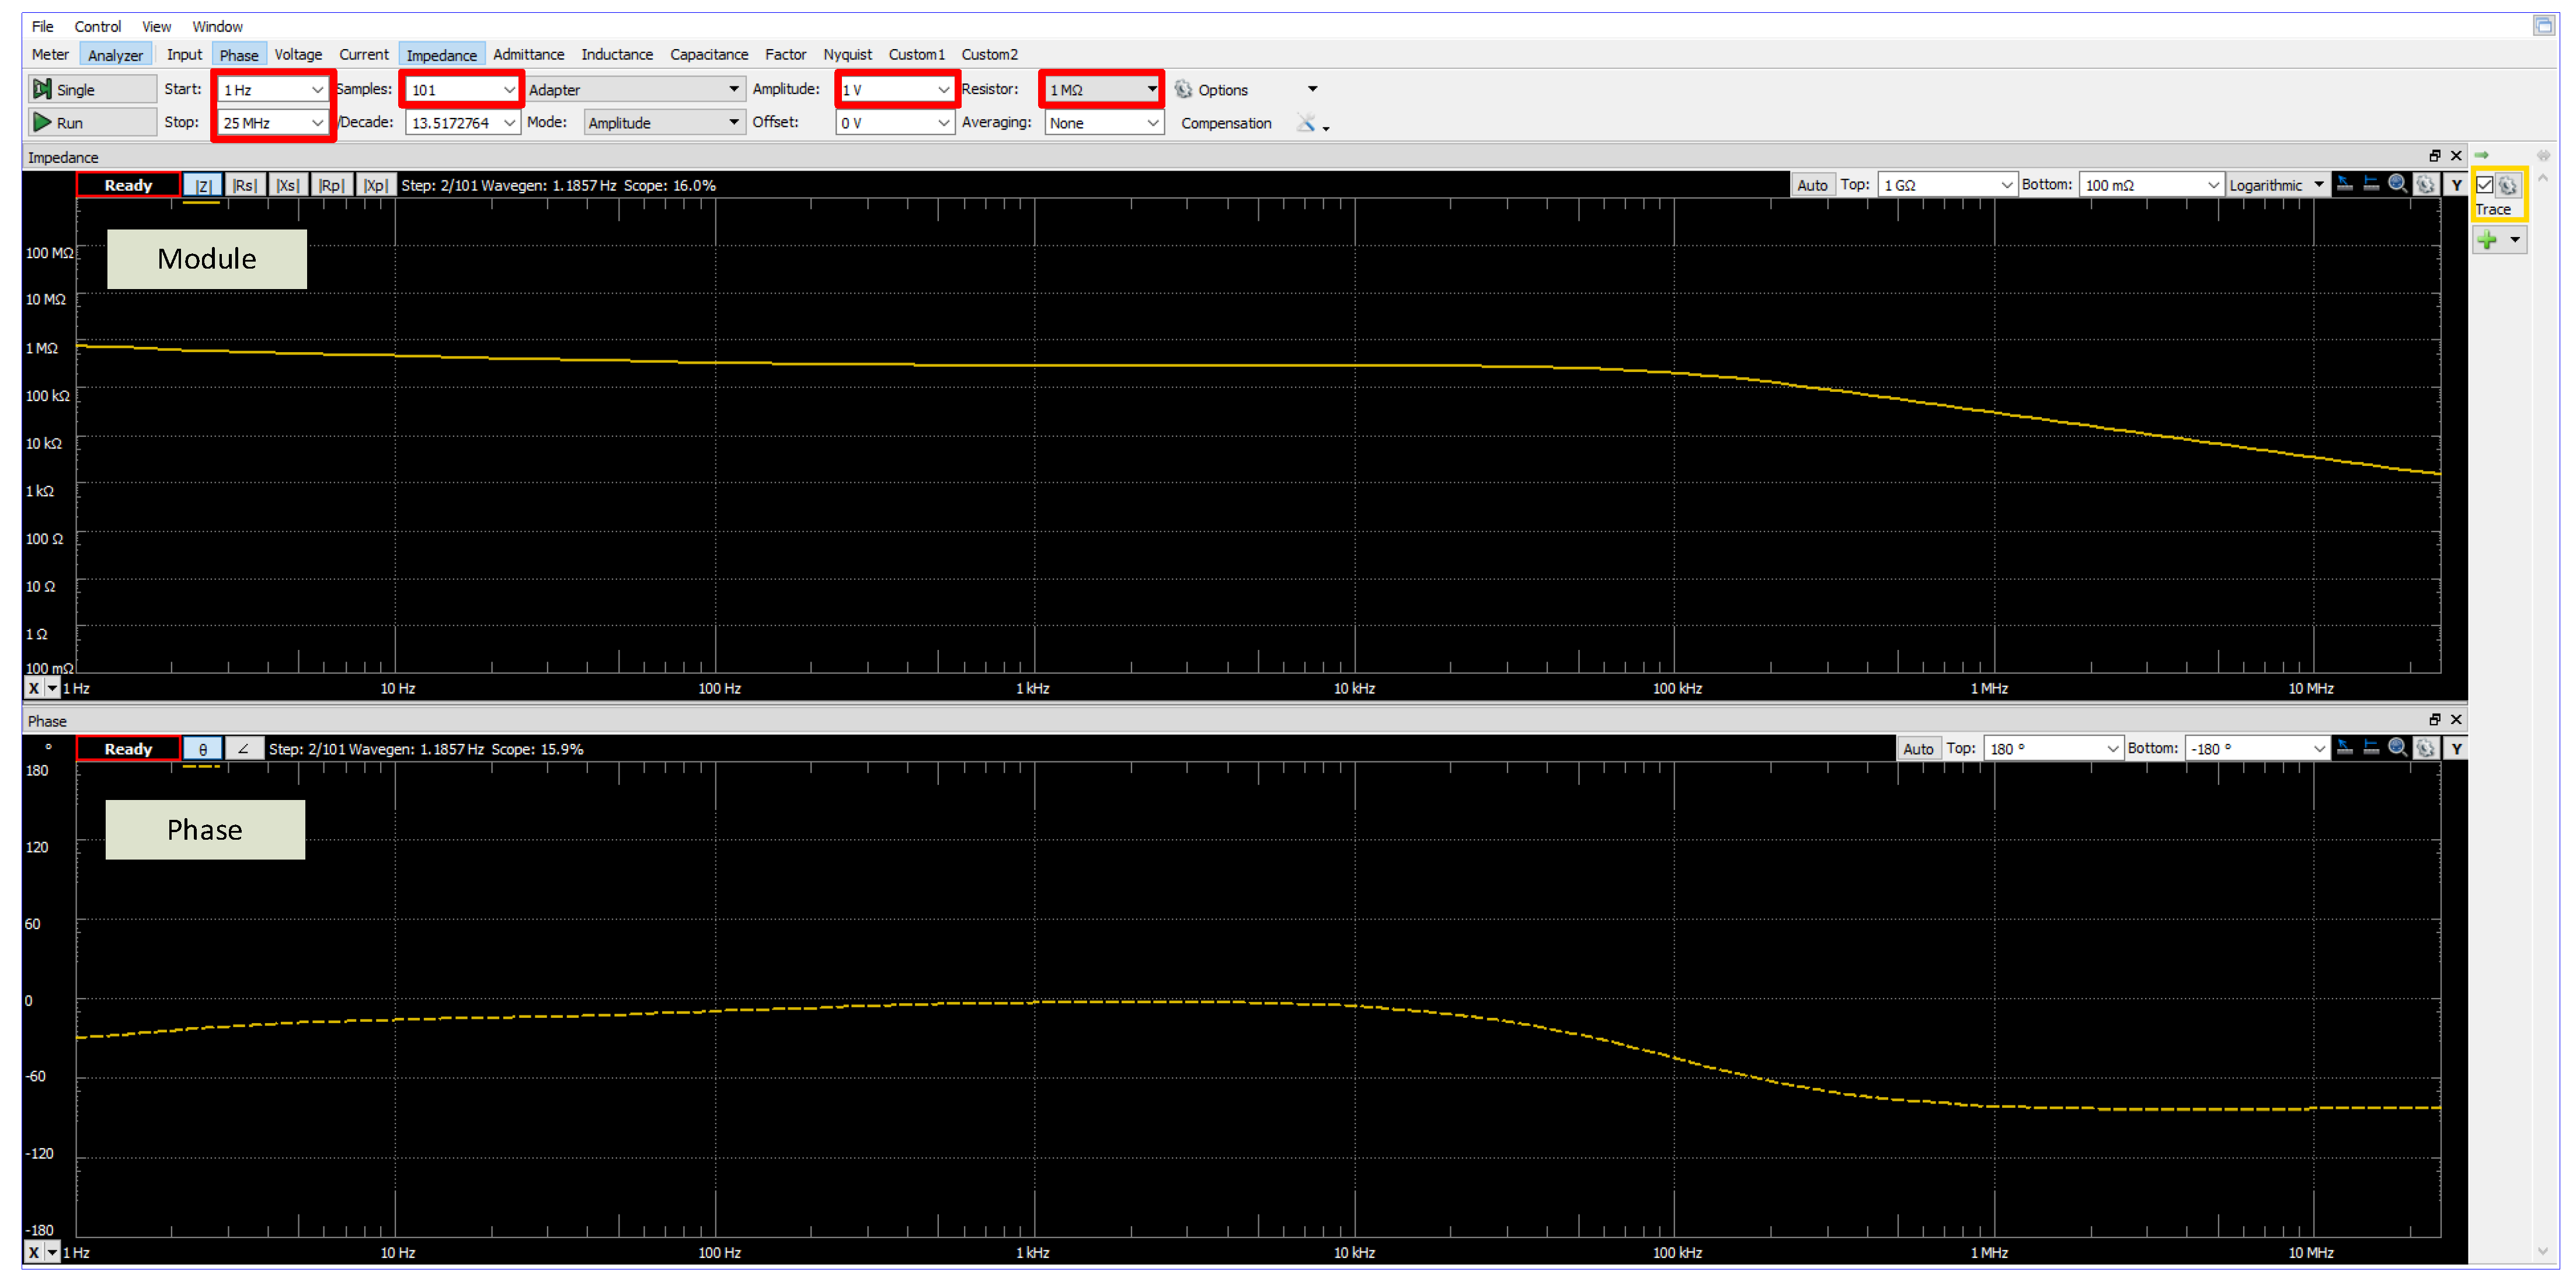
2.2. Equipment Used to Measure Electrical Impedance

A Digilent Analog Discovery 2™ (Digilent Inc.®, Pullman, Washington, DC, USA; henceforth DAD2) [42] was used for the impedance measurement. DAD2 is a low-cost multi-function instrument that allows users to measure, visualize, generate, record and control mixed signal circuits of all kinds. To facilitate the impedance measurement, an adapter module specially designed for this function was used [43].
Figure 1 shows the DAD2, the adapter card for impedance measurement and the standard 2.54 mm tip used with equal spacing.
For the measurement, the meter application was configured with a frequency sweep range from 1 Hz to 25 MHz with logarithmic increment and 101 samples. The range for the impedance modulus was established at 100 MΩ and a sinusoidal excitation of 1 V amplitude, which is adequate for all the analyzed myeles. Figure 2 shows the configured application.

2.3. Neural Networks to Sorting

One type of neural network was used from the Matlab libraries: A sorting network, “patternnet” [30], to distinguish between the 6 cases of unifloral honey and the commercial multifloral honey. This multilayer neural network model employs only 1 internal layer with 5 neurons using the proportion 75/15/15 of the data for the process of Training, Validation and Testing during learning in a total of 50 repetitions. The Training Function selected was the scaled conjugate gradient backpropagation (“trainscg” in Matlab language). This pattern recognition network is a type of feedforward network that can be trained to classify inputs according to target classes, and internally uses a sigmoid function as the activation function [44]. The target data consist of vectors of all zero values except for a 1 in element i, where i is the class they are to represent.

3. Results and Discussion

3.1. Evolution of the Impedance Depending on the Varieties of Honey

Figure 3 shows the evolution of the impedance expressed as reactance versus resistance for the seven types of honey analyzed at an ambient temperature of about 25 °C. The electrical equivalent corresponds to a series R/C circuit.
Each curve has a characteristic evolution, see Table 3, Table 4 and Table 5:
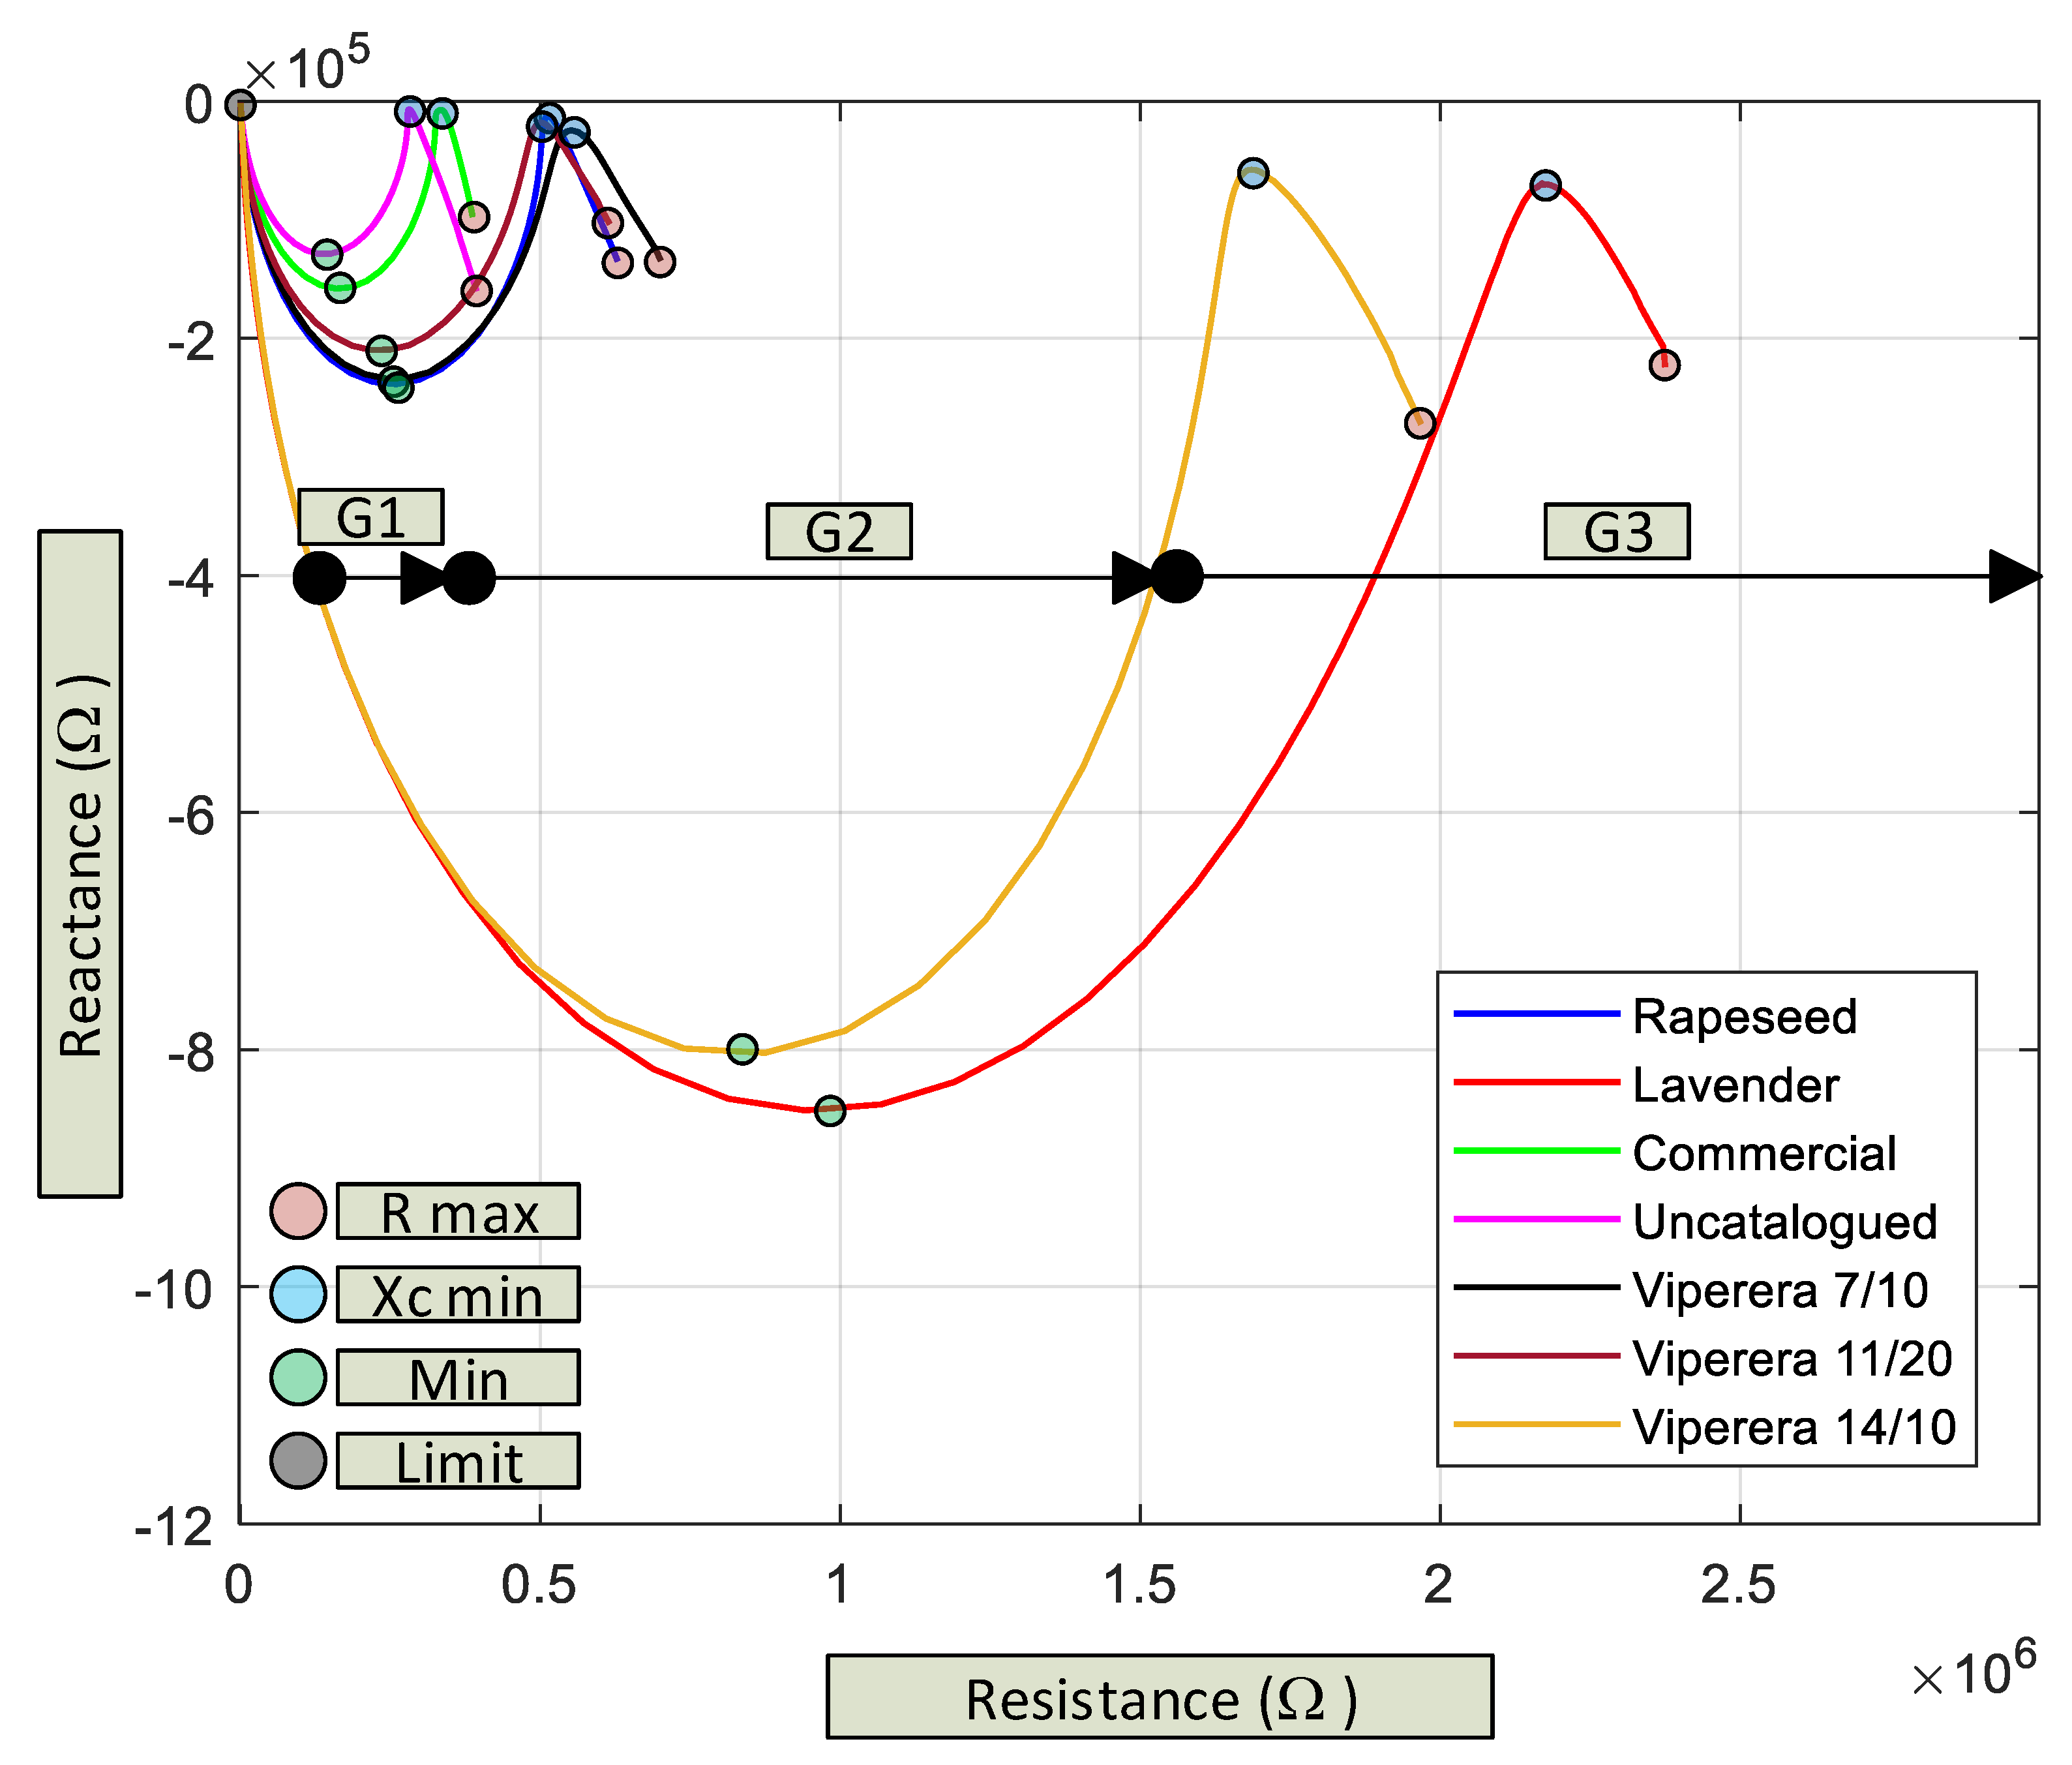
  • Value of the high resistive component at low frequencies (red dot), between 0.35 MΩ and 2.5 MΩ for a frequency of 1 Hz.
  • Relative maximum (blue dot) at medium frequencies (between 30 Hz and 1 kHz). In this area, the capacitive behavior is minimized with reactancy values between 6 kΩ and 70 kΩ.
  • Relative minimum (green point) (with a negative maximum value of the capacitive component) with frequency values between 10 kHz and 100 kHz and reactance values between 0.1 MΩ and 1 MΩ.
  • Common point (grey dot) at high frequency (25 MHz), where all the curve-confluence and the effect of the parasitic components of the measurement system are already evident.
As can be seen in Figure 3, if the position of the points (red and blue) is analyzed, the honeys can be grouped into three clearly differentiated groups (G1, G2 and G3). On the other hand, it is clearly seen that each type of honey has its own zone in the graph, which at first glance already allows us to intuit that the neural network will behave well when classifying and require little complexity in its structure. On the other hand, this goes to show that it is not necessary to extract the parameters of equivalent electric models or use a PCA analysis to classify honey varieties, as has been previously commented.

3.2. Results of the Classified with Patternnet Neural Network

As mentioned in Section 2.3, a distribution of the data was made for the training of the neural network and a total of 15 repetitions was used for each honey sample, allocating 10 to the training process and five to the challenge process.
Table 6, Table 7, Table 8 and Table 9 show the result of the sorting process (value = 1: case selected by the NN; value→0: case discarded by the NN) for 35 challenges (five for each type of honey).
Figure 4 shows the confusion matrices for Training, Validation and Test. The tests with the challenges showed that the neural network is capable of detecting 100% of the cases correctly.
Similar sorting results with this type of neural network can be found in this work by other authors [1] with table olives.

3.3. Relationship of Physical–Chemical Parameters of the Samples with the Characteristic Values of Electrical Impedance of Each Variety of Unifloral Honey

In the graph (Figure 3), three groups of honeys can be seen, from lowest to highest resistive value (R); a first group (G1) that corresponds to uncatalogued honey and commercial honey (values less than 0.5 × 10⁶ Ω); a second group (G2) that would include the two viperera samples and the rapeseed one (near values to 0.5 × 10⁶ Ω); and a third more resistive group (G3) with sample 14/10 of viperera and lavender honey (higher values than 1.5 × 10⁶ Ω).
Regarding the viperera samples, two of them are in the middle of the graph, and the third in the group with the highest resistive values. This may be due to the influence of the botanical origin and the botanical diversity of the geographical area of honey production. Numerous authors conclude that the differences observed in the samples for all the parameters analyzed are mainly associated with the botanical origin, since the composition of the pollen and the botanical diversity determine both the organoleptic characteristics and the physical–chemical parameters of the honeys [32].
On the other hand, uncatalogued honey, together with commercial honey, shows much less resistance (R) than the rest of the honeys, placing it in the first group of the graph. This may be because they are products derived from honeydew or myelates, with very different physical–chemical characteristics from nectar honeys, which could justify the lower resistance (R) compared to the monofloral honeys analyzed in the study.
On the other hand, it should be noted that the official quality standard for Spanish honey (BOE 186 of 5/8/2013) already requires defining the type of honey according to its origin (flower honey or nectar and honeydew honey) and establishing the minimum characteristics of the specific composition that each honey must contain.

3.3.1. Humidity

In relation to this parameter, the moisture content does seem to have a direct relationship with the impedance values.
Honey samples with low moisture values, corresponding to viborera 14/10 (14.8%) and lavender sample (15.1%), have higher resistive values, whose relative maximums in the graph (Figure 3) are above 1.5 × 10⁶ Ω on the R axis corresponding to the resistance.
On the other hand, the honey samples that offer less resistance are sample uncatalogued honey and commercial honey, with higher percentages of moisture, ranging between 17 and 18%.

3.3.2. HMF (Hidroximetilfurfural)

The HMF does not seem to influence the resistive curve of the samples.

3.3.3. Coloration

The color of the honey is very important to define the origin and grant its commercial classification as monofloral honeys, being a primary characteristic for the commercial classification [35].
It is a composition factor that is linked almost exclusively to its botanical origin. In turn, it is also linked to conductivity, since it depends on the content of mineral salts. Honeys with high mineral content are dark in color and have high conductivities [45].
In this study, a direct relationship between honey color and electrical impedance has not been observed.
However, other studies have contrasted conductivity versus color values. According to the study carried out by Santos et al., it was determined that the darkest honeys present the highest conductivity values [45]. Likewise, Blanco et al. also concluded that darker honeys such as honeydew have higher conductivity values than honeys with lighter colors (rosemary, orange blossom, lavandula stoechas...) [46]. In general, honeys of floral origin have lower conductivities (and lighter colors) than honeydew honeys (darker) [47].
Table 10 shows the relationship of the color and conductivity of the monofloral honeys shown.
For this parameter, it is not observed that the coloration influences the resistance values of the honey, although it should do since it is linked to conductivity.

3.3.4. Conductivity

As with color, it has not been observed that conductivity influences the position of the varieties in the electrical impedance evolution graph (Figure 3).
However, we consider that there should have been a relationship given that, according to other authors, it depends on the salt content and serves to differentiate nectar honey from honeydew honey, which is richer in salts, given that the higher the electrical conductivity, the greater the amount of salts [45].
On the other hand, ash is a parameter that, despite not being included in the analysis of the samples, also expresses the content of mineral salts and is usually proportional to the tone of the honey [48].
The Honey Regulation [21] obliges a name on the label if a honey is of floral origin or has its origin in the honeydew of some trees (cork oak, holm oak, oak, fir, chestnut, etc.), and sets a conductivity limit of 800 µS/cm (=0.8 mS/cm). Honeydew honeys or their mixtures with floral honeys must have more than that limit, and floral honeys less, except heather (Ericassp); biercol (Callunavulgaris); eucalyptus (Eucaliptusssp); and strawberry tree (Arbutusunedo) honeys.

3.3.5. pH

No relationship is observed between the pH and the resistance of the honeys.

3.3.6. BRIX Degrees

As with humidity, the sugar content does seem to have a relationship with the impedance and the representation of the curves obtained with the neural network.
The two samples that present the highest values of Brix degrees (viperera14/10 and lavender) are located in the third group, with a maximum relative resistance above 1.5 × 10⁶ Ω.
On the other hand, it is observed that honeys with values between 80.5 and 81.1 have lower resistive values, which could be due to the fact that the sugar composition of honey is affected by the type of nectar used by bees, as well as by the region and climatic conditions where the honey has been produced [49].

3.3.7. Pollen

Regarding the pollen content of the studied samples, the samples with the highest resistive values correspond to sample 1 (viperera 14/10) and sample 5 (lavender), with a dominant pollen percentage of 50% for both cases.
This predominant value for both samples represents the lowest percentage of the honeys studied, whose values in ascending order are rapeseed (57%); viperera 07/10 (62%); and viperera 11/20 (74%).
The samples with higher pollen percentages are framed in less resistive areas of the impedance evolution graph (Figure 3).
The other two honey samples (commercial honey and uncatalogued honey) do not have a pollen analysis.
The pollen content influences the total ash content [49], so it could have a relationship with the impedance of the honey.
The monofloral variety is determined by the highest proportion of pollen of the botanical species, but not exclusively. To avoid possible commercial fraud and preserve the interests of consumers, it is admitted that the predominant pollen may be variable depending on the botanical variety and the amount of pollen it contains. For this reason, the pollen residue of monofloral honey varies between a minimum of 12% in the case of rosemary honey, up to minimum values of 75% in chestnut honey.

4. Conclusions

The method applied in this study, using the DAD2 device and the analysis of the reactance vs. resistance data in the patternnet-type classifying neural network, was able to discriminate the honey samples according to their botanical origin without the need to process the data previously with other statistical techniques such as PCA, or using equivalent electric models.
The neural network used for the study uses only one internal layer with five neurons and could detect 100% of the cases.
Each honey has a characteristic profile in the X vs. R diagram, showing three groups of similar electrical properties.
The X vs. R curves tend asymptotically to the same values at high frequencies, so they are no longer useful for classification; on the other hand, at higher frequencies there is an increase in parasitic components, which can lead to the misinterpretation of the results. In a practical way, the frequency sweep could be limited to a maximum of 10 MHz.
Around the physicochemical parameters studied, humidity and the percentage of Brix degrees do seem to have a direct relationship with electrical impedance.
The pH and the conductivity do not seem to have a relationship with the discrimination of the honeys, according to the results obtained in the graph of the evolution of electrical impedance.
It has not been observed that coloration influences the resistance values of honey, although it should since it is linked to conductivity.
The pollen content influences the total ash content and consequently the conductivity; however, in this study it has not been possible to establish a direct relationship between the evolution of the impedance and the pollen content of the sample.
In this study, it was verified that the impedance values in the viperera monofloral samples do not allow regrouping of the three samples in the same resistance range. Although there are studies that justify the discrepancy between the physicochemical parameters of the same unifloral honey depending on the geographical area, climatology or diversity of flora of the land, a future line of work is opened in order to emphasize these results and study in depth the discrepancies in the impedance values for honeys of the same floral classification.

Author Contributions

Conceptualization, E.G.M., A.M.-L., A.R.-C. and J.M.M.L.; Formal analysis, E.G.M., A.M.-L., A.R.-C. and J.M.M.L.; Investigation, E.G.M., A.M.-L., A.R.-C. and J.M.M.L.; Writing—original draft, E.G.M., A.M.-L., A.R.-C. and J.M.M.L.; Supervision, E.G.M., A.M.-L., A.R.-C. and J.M.M.L. All authors have read and agreed to the published version of the manuscript.

Funding

This research received no external funding.

Institutional Review Board Statement

The study did not require ethical approval.

Informed Consent Statement

Not applicable.

Data Availability Statement

Conflicts of Interest

The authors declare no conflict of interest.

References

  1. Luna, J.M.M.; Luna, A.M.; Fernández, R.E.H. Characterization and Differentiation between Olive Varieties through Electrical Impedance Spectroscopy, Neural Networks and IoT. Sensors 2020, 20, 5932. [Google Scholar] [CrossRef] [PubMed]
  2. Okada, K.; Sekino, T. Agilent Impedance Measurement Handbook. In A Guide to Measurement Technology and Techniques; Agilent Technologies: Santa Clara, CA, USA, 2009. [Google Scholar]
  3. Elbanna, K.; Attalla, K.; Elbadry, M.; Abdeltawab, A.; Gamal-Eldin, H.; Fawzy Ramadan, M. Impact of Floral Sources and Processing on the Antimicrobial Activities of Different Unifloral Honeys. Asian Pac. J. Trop. Dis. 2014, 4, 194–200. [Google Scholar] [CrossRef]
  4. Wikipedia. Maxwell Bridge. Available online: https://en.wikipedia.org/wiki/Maxwell_bridge (accessed on 10 August 2022).
  5. A Low Cost RF Impedance Analyzer. Available online: https://www.nutsvolts.com/magazine/article/a_low_cost_rf_impedance_analyzer (accessed on 11 August 2022).
  6. Analizador Impedancia Valencia. Available online: https://pdfcoffee.com/analizador-impedancia-valencia-pdf-free.html (accessed on 11 August 2022).
  7. Paszkowski, B.; Wilczek, A.; Szypłowska, A.; Nakonieczna, A.; Skierucha, W. A Low-Frequency Sensor for Determination of Honey Electrical Properties in Varying Temperature Conditions. J. Food Eng. 2014, 138, 17–22. [Google Scholar] [CrossRef]
  8. Nelson, S. Dielectric Properties of Agricultural Products: Measurements and Applications. IEEE Trans. Electr. Insul. 1991, 26, 845–869. [Google Scholar] [CrossRef]
  9. Repo, T.; Paine, D.; Taylor, A. Electrical Impedance Spectroscopy in Relation to Seed Viability and Moisture Content in Snap Bean (Phaseolus vulgaris L.). Seed Sci. Res. 2002, 12, 17–29. [Google Scholar] [CrossRef]
  10. Tegam. The LCR Meter as an Impedance Analyzer. Available online: http://www.tegam.com/wp-content/uploads/2015/10/AN303.pdf (accessed on 11 August 2022).
  11. El Khaled, D.; Castellano, N.N.; Gazquez, J.A.; García Salvador, R.M.; Manzano-Agugliaro, F. Cleaner Quality Control System Using Bioimpedance Methods: A Review for Fruits and Vegetables. J. Clean. Prod. 2017, 140, 1749–1762. [Google Scholar] [CrossRef]
  12. Caicedo-Eraso, J.C.; Díaz-Arango, F.O.; Osorio-Alturo, A. Espectroscopia de impedancia eléctrica aplicada al control de la calidad en la industria alimentaria. Cienc. Tecnol. Agropecu. 2019, 21, 100–119. [Google Scholar] [CrossRef]
  13. Das, C.; Chakraborty, S.; Karmakar, A.; Chattopadhyay, S. Comparative Study for the Impedimetric Detection and Quantification of Adulterants in Different Bio-Consumables. In Proceedings of the 2020 International Symposium on Devices, Circuits and Systems (ISDCS), Howrah, India, 4–6 March 2020; pp. 1–6. [Google Scholar]
  14. Elamine, Y.; Inácio, P.M.C.; Lyoussi, B.; Anjos, O.; Estevinho, L.M.; da Graça Miguel, M.; Gomes, H.L. Insight into the Sensing Mechanism of an Impedance Based Electronic Tongue for Honey Botanic Origin Discrimination. Sens. Actuators B Chem. 2019, 285, 24–33. [Google Scholar] [CrossRef]
  15. Karabagias, I.; Maia, M.; Karabagias, V.; Gatzias, I.; Badeka, A. Characterization of Eucalyptus, Chestnut and Heather Honeys from Portugal Using Multi-Parameter Analysis and Chemo-Calculus. Foods 2018, 7, 194. [Google Scholar] [CrossRef]
  16. Scandurra, G.; Tripodi, G.; Verzera, A. Impedance Spectroscopy for Rapid Determination of Honey Floral Origin. Journal of Food Engineering 2013, 119, 738–743. [Google Scholar] [CrossRef]
  17. Huang, T.-K.; Chuang, M.-C.; Kung, Y.; Hsieh, B.-C. Impedimetric Sensing of Honey Adulterated with High Fructose Corn Syrup. Food Control 2021, 130, 108326. [Google Scholar] [CrossRef]
  18. Das, C.; Chakraborty, S.; Acharya, K.; Bera, N.K.; Chattopadhyay, D.; Karmakar, A.; Chattopadhyay, S. FT-MIR Supported Electrical Impedance Spectroscopy Based Study of Sugar Adulterated Honeys from Different Floral Origin. Talanta 2017, 171, 327–334. [Google Scholar] [CrossRef] [PubMed]
  19. Insuasty-Santacruz, E.; Martínez-Benavides, J.; Jurado-Gámez, H. Determinación Melisopalinológica de Miel de Abejas Apis Mellifera Producida Con Flora de Clima Frío, Principalmente Trifolium repens L. Vet. Zootec. 2017, 11, 74–82. [Google Scholar] [CrossRef]
  20. Pospiech, M.; Ljasovská, S.; Titěra, D.; Kružík, V.; Javůrková, Z.; Tremlová, B. Pollen Diversity in Honeys of the Czech Republic in the 2019 Season. Potravin. Slovak J. Food Sci. 2020, 14, 1115–1123. [Google Scholar] [CrossRef]
  21. Karabournioti, S.; Thrasyvoulou, A.; Eleftheriou, E.P. A Model for Predicting Geographic Origin of Honey from the Same Floral Source. J. Apic. Res. 2006, 45, 117–124. [Google Scholar] [CrossRef]
  22. Pineda Ballesteros, E.; Castellanos Riveros, A.; Téllez Acuña, F.R. Determinantes físicoquímicos de la calidad de la miel: Una revisión bibliográfica. Cuad. Des. Rural 2019, 16, 83. [Google Scholar] [CrossRef]
  23. Popek, S.; Halagarda, M.; Kursa, K. A New Model to Identify Botanical Origin of Polish Honeys Based on the Physicochemical Parameters and Chemometric Analysis. LWT 2017, 77, 482–487. [Google Scholar] [CrossRef]
  24. van Gerven, M.; Bohte, S. Editorial: Artificial Neural Networks as Models of Neural Information Processing. Front. Comput. Neurosci. 2017, 11, 114. [Google Scholar] [CrossRef]
  25. Hara, P.; Piekutowska, M.; Niedbała, G. Selection of Independent Variables for Crop Yield Prediction Using Artificial Neural Network Models with Remote Sensing Data. Land 2021, 10, 609. [Google Scholar] [CrossRef]
  26. Rodriguez, N.; Reyes Méndez, L.; Salamanca Grosso, G. Aplicación de análisis de cluster y redes neuronales artificiales para la clasificación de mieles colombianas. In Proceedings of the Congreso Iberoamericano de Ingeniería de Alimentos-Cibia9, Valencia, Spain, 13–16 January 2014; Volume 9. [Google Scholar]
  27. Gavilanes Proaño, D.A. Sistema de Monitoreo Apícola Mediante el uso de Redes Neuronales Artificiales para Identificar la Variación de Población; Universidad Técnica de Ambato: Ambato, Ecuador, 2020. [Google Scholar]
  28. Martínez, L.; Arguijo, P.; López, J.A.; Melendez-Armenta, R. Configuración de Red Neuronal Para El Análisis de Polen. Res. Comput. Sci. 2019, 148, 91–98. [Google Scholar] [CrossRef]
  29. Mateo, F.; Tarazona, A.; Mateo, E.M. Comparative Study of Several Machine Learning Algorithms for Classification of Unifloral Honeys. Foods 2021, 10, 1543. [Google Scholar] [CrossRef] [PubMed]
  30. Generate Pattern Recognition Network—MATLAB Patternnet—MathWorks España. Available online: https://es.mathworks.com/help/deeplearning/ref/patternnet.html;jsessionid=370562d44f3c46b93a717f92677f (accessed on 12 June 2022).
  31. Nikolova, K.; Tsankova, D.; Eftimov, T. Fluorescence spectroscopy, colorimetry and neural networks in distinguishing different types of honey. In Proceedings of the V International Conference Industrial Engineering and Environmental Protection 2015 (IIZS 2015), Zrenjanin, Serbia, 15–16 October 2015. [Google Scholar]
  32. Caston, M.J.P.; González, I.N.; Alaminos, A.B.; Torales, L.I.E.; Alonso, F.J.G. Paramétros de calidad en mieles de diferentes orígenes botánicos producidas en la alpujarra granadina. Anales de Veterinaria de Murcia 2016, 32, 59–71. [Google Scholar]
  33. DIRECTIVA 2001/110/CE. Available online: https://www.boe.es/doue/2002/010/L00047-00052.pdf. (accessed on 10 June 2022).
  34. Caracterización Físico-Química y Evaluación Sanitaria de la miel de Mozambique. 290. Available online: http://hdl.handle.net/10803/5701 (accessed on 5 September 2021).
  35. da Silva, P.M.; Gauche, C.; Gonzaga, L.V.; Costa, A.C.O.; Fett, R. Honey: Chemical Composition, Stability and Authenticity. Food Chem. 2016, 196, 309–323. [Google Scholar] [CrossRef]
  36. Revista Veterinaria Argentina. Comparación de Parámetros Fisicoquímicos En Muestras de Miel Ecológica y Convencional. Available online: https://www.veterinariargentina.com/revista/2022/05/comparacion-de-parametros-fisicoquimicos-en-muestras-de-miel-ecologica-y-convencional/ (accessed on 10 August 2022).
  37. BOE.Es—DOUE-L-2002-80034 Directiva 2001/110/CE Del Consejo, de 20 de Diciembre de 2001, Relativa a La Miel. Available online: https://www.boe.es/buscar/doc.php?id=DOUE-L-2002-80034 (accessed on 10 August 2022).
  38. Pérez García, M.R. Universitat Politècnica de València. Ingeniería Del Agua 2014, 18, ix. [Google Scholar] [CrossRef]
  39. de la Cruz, D.R.; Reyes, E.S.; Durán, S.S.; Sánchez, J.S. Análisis palinológico de mieles comerciales monoflorales. Bot. Complut. 2013, 37, 171–180. [Google Scholar] [CrossRef]
  40. Montenegro, G.; Gómez, M.; Díaz-Forestier, J.; Pizarro, R. Aplicación de La Norma Chilena Oficial de Denominación de Origen Botánico de La Miel Para La Caracterización de La Producción Apícola. Ciencia e Investigación Agraria 2008, 35, 181–190. [Google Scholar] [CrossRef]
  41. López Candel, A. Caracterización Fisicoquímica de Mieles de Espliego y Tomillo de la Comunidad Valenciana. 2014. Available online: hdl.handle.net/10251/57240 (accessed on 10 August 2022).
  42. Analog Discovery 2—Digilent Reference. Available online: https://digilent.com/reference/test-and-measurement/analog-discovery-2/start (accessed on 12 June 2022).
  43. Impedance Analyzer for Analog Discovery. Available online: https://digilent.com/shop/impedance-analyzer-for-analog-discovery/ (accessed on 12 June 2022).
  44. Sigmoid Layer—MATLAB—MathWorks España. Available online: https://es.mathworks.com/help/deeplearning/ref/nnet.cnn.layer.sigmoidlayer.html (accessed on 11 August 2022).
  45. Santos, E.I.; Meerhoff, E.; Rosa, E.G.D.; Ferreira, J.; Raucher, M.; Quintana, W.; Martínez, A.; González, C.; Mancebo, Y. Color and Electrical Conductivity of Honeys Produced by Apis Mellifera in Uruguay. INNOTEC 2018, 16, 51–55. [Google Scholar] [CrossRef]
  46. Blanco Pérez, M. Parámetros Fisicoquímicos En mieles Monoflorales Españolas de la Campaña 2020. Master’s Thesis, Universitat Politècnica de València, Valencia, Spain, 2021. [Google Scholar]
  47. Control de Calidad de Las Mieles, ¿qué Medir? Available online: https://www.hannainst.es/blog/1609/Control-de-calidad-de-las-mieles (accessed on 10 August 2022).
  48. Staniškienė, B.; Matusevičius, P.; Budreckienė, R. Honey as an Indicator of Environmental Pollution. Medus—Aplinkos Taršos Indikatorius 2006, 36, 53–58. [Google Scholar]
  49. Tornuk, F.; Karaman, S.; Ozturk, I.; Toker, O.S.; Tastemur, B.; Sagdic, O.; Dogan, M.; Kayacier, A. Quality Characterization of Artisanal and Retail Turkish Blossom Honeys: Determination of Physicochemical, Microbiological, Bioactive Properties and Aroma Profile. Ind. Crops Prod. 2013, 46, 124–131. [Google Scholar] [CrossRef]
Figure 1. Device used for impedance measurement: (a) DAD2, the adapter card for impedance measurement; (b) standard tip used of s = 2.54 mm in length and equal separation.
Agronomy 12 01929 g001
Figure 2. Application configured with a frequency sweep range from 1 Hz to 25 MHz with logarithmic increment and 101 samples.
Agronomy 12 01929 g002
Figure 3. Evolution of the electrical impedance in the honey samples obtained.
Agronomy 12 01929 g003
Figure 4. Training confusion matrix for sorting unifloral honeys.
Agronomy 12 01929 g004
Table 1. Physicochemical analysis of the analyzed samples.
Number of SamplePollen AnalysisHumidityHmf (mg/kg)ColorationMm PfundConductivity (mS/cm)pHBrix (%)
1 (14/10)Viperera14.85.89Extra-light amber370.274.0582.3
2 (07/10)Viperera174.23Extra-light amber37.30.263.8480.5
3 (11/20)Viperera17.43.96Extra-light amber430.304.480.5
4Rapeseed188.16White280.324.281.1
5Lavender15.13.88Extra-light amber40.30.163.682
6 (commercial)Honey of a “thousand flowers”18 **4.0 *Extra-light amber48 **0.3 **--
7 (uncatalogued)Uncatalogued18 **4.0 *Dark amber90 **0.9 **--
* Included value according to EC Directive 110/2001 CE, RD 1049/2003 in Spain. ** Data according to Guía-de-mieles-monoflorales-ibéricas-Apinevada-Pajuelo-2018. Page nº 48 prairie honey and page 44 forest honey.
Table 2. Pollen analysis of the analyzed samples.
Number of SamplePollen AnalysisDominant Pollens
>45%
Accompanying Pollens
>16–45%
Minority Pollens
>3–15%
Residual or Isolated Pollens <3%
1 (14/10)VipereraEchium 50%-Cistus 11%
Vicia 20%
Prunus 9%
Lavandula stoechas 5%
Cytisus 3%
Trifolium 2%
2 (07/10)VipereraEchium 62%-Cistus 14%
Type “Rubus” 6%
Rosmarius 5%
Cruciferous 5%
Cytisus 4%
Lavender 2%
Anchusa 2%
3 (11/20)VipereraEchium 74%-Rosmarius 9%
Cruciferous 8%
Cistus 6%
Cytisus 3%
-
4RapeseedBrassica 57%-Prunus 10%
Cytisus 9%
Diplotaxis 8%
Rosmarius 7%
Helianthus 6%
Anchusa 3%
5LavenderLavender 50%Prunus 20%Citisus 9%
Rubus 6%
Cirisium 3%
6 ** (commercial)Honey of a “thousand flowers”----
7 ** (uncatalogued)Uncatalogued----
** Data according to Guía-de-mieles-monoflorales-ibéricas-Apinevada-Pajuelo-2018. Page nº 48 prairie honey and page 44 forest honey.
Table 3. Characteristic values at minimum frequency (1 Hz).
F_minUncataloguedCommercialVip11/20RapeseedVip 07/10Vip14/10Lavender
R (Ω)3.94 × 1053.87 × 1056.16 × 1056.29 × 1057.01 × 1051.97 × 1062.38 × 106
X (Ω)−1.60 × 10⁵−9.76 × 10⁴−1.04 × 10⁵−1.35 × 10⁵−1.34 × 10⁵−2.72 × 10⁵−2.24 × 10⁵
F (Hz)1111111
GroupG1G1G2G2G2G3G3
Table 4. Characteristic values at minimum reactance (more negative).
X_minUncataloguedCommercialVip 11/20RapeseedVip 07/10Vip 14/10Lavender
R (Ω)1.29 × 1051.59 × 1052.18 × 1052.60 × 1052.44 × 1058.75 × 1059.41 × 105
X (Ω)−1.29 × 10⁵−1.58 × 10⁵−2.10 × 10⁵−2.39 × 10⁵−2.34 × 10⁵−8.03 × 10⁵−8.51 × 10⁵
F (Hz)1.07 × 1059.05 × 1045.43 × 1045.43 × 1044.58 × 1041.65 × 1041.39 × 104
GroupG1G1G2G2G2G3G3
Table 5. Characteristic values at maximum reactance (less negative).
X_maxUncataloguedCommercialVip 11/20RapeseedVip 07/10Vip 14/10Lavender
R (Ω)2.81 × 1053.35 × 1054.99 × 1055.13 × 1055.52 × 1051.69 × 1062.17 × 106
X (Ω)−6.86 × 10³−7.32 × 10³−1.80 × 10⁴−1.23 × 10⁴−2.46 × 10⁴−5.77 × 10⁴−6.93 × 10⁴
F (Hz)7.68 × 1022.33 × 1022.76 × 1023.28 × 1022.33 × 1021.40 × 1025.03 × 101
GroupG1G1G2G2G2G3G3
Table 6. Results of the neural network against 35 challenges (from 1 to 10).
Challenges
12345678910
HoneysRapeseed111111.09 × 10−87.88 × 10−77.45 × 10−76.99 × 10−76.42 × 10−7
Lavender5.81 × 10−75.78 × 10−75.75 × 10−75.67 × 10−75.65 × 10−711111
Commercial1.79 × 10−81.79 × 10−81.79 × 10−81.78 × 10−81.77 × 10−84.21 × 10−41.43 × 10−41.19 × 10−49.61 × 10−37.25 × 10⁻³
Uncatalogued3.15 × 10−43.15 × 10−43.15 × 10−43.15 × 10−43.14 × 10−42.83× 10−12.10 × 10−22.98 × 10−24.45 × 10−27.55 × 10⁻²
Viperera 7/101.20 × 10−71.20 × 10−71.20 × 10−71.21 × 10−71.20 × 10−71.69 × 10−75.87 × 10−77.28 × 10−79.34 × 10−71.30 × 10−8
Viperera 11/201.19 × 10−71.19 × 10−71.18 × 10−71.16 × 10−71.16 × 10−79.39 × 10−73.06 × 10−83.76 × 10−84.77 × 10−86.52 × 10−8
Viperera 14/106.56 × 10−76.56 × 10−76.56 × 10−76.56 × 10−76.57 × 10−71.27 × 10−81.32 × 10−81.33 × 10−81.34 × 10−81.35 × 10−8
Table 7. Results of the neural network against 35 challenges (from 11 to 20).
Challenges
11121314151617181920
HoneysRapeseed1.95 × 10−81.95 × 10−81.95 × 10−81.95 × 10−81.95 × 10−84.01 × 10−54.01 × 10−54.01 × 10−54.01 × 10−54.02 × 10⁻⁵
Lavender3.40 × 10−23.40 × 10−23.40 × 10−23.40 × 10−23.40 × 10−29.18 × 10−99.18 × 10−99.19 × 10−99.19 × 10−99.19 × 10⁻⁹
Commercial111115.06 × 10−85.06 × 10−85.07 × 10−85.07 × 10−85.07 × 10−8
Uncatalogued4.24 × 10−84.24 × 10−84.24 × 10−84.24 × 10−84.24 × 10−811111
Viperera 7/101.60 × 10−51.60 × 10−51.60 × 10−51.60 × 10−51.60 × 10−58.65 × 10−78.65 × 10−78.65 × 10−78.66 × 10−78.66 × 10−7
Viperera 11/201.36 × 10−51.36 × 10−51.36 × 10−51.36 × 10−51.36 × 10−54.59 × 10−74.59 × 10−74.59 × 10−74.59 × 10−74.59 × 10−7
Viperera 14/101.30 × 10−81.30 × 10−81.30 × 10−81.30 × 10−81.30 × 10−84.65 × 10−64.65 × 10−64.65 × 10−64.65 × 10−64.66 × 10−6
Table 8. Results of the neural network against 35 challenges (from 21 to 30).
Challenges
21222324252627282930
HoneysRapeseed1.03 × 10−79.49 × 10−61.10 × 10−71.51 × 10−71.34 × 10−71.62 × 10−71.64 × 10−71.70 × 10−71.73 × 10−71.88 × 10⁻⁷
Lavender2.70 × 10−72.43 × 10−72.72 × 10−75.49 × 10−74.47 × 10−73.81 × 10−73.84 × 10−73.97 × 10−74.02 × 10−74.30 × 10⁻⁷
Commercial5.48 × 10−34.86 × 10−35.91 × 10−31.08 × 10−48.80 × 10−33.13 × 10−63.16 × 10−63.31 × 10−63.39 × 10−63.83 × 10⁻⁶
Uncatalogued1.97 × 10−81.82 × 10−82.09 × 10−82.92 × 10−82.59 × 10−81.44 × 10−81.44 × 10−81.41 × 10−81.40 × 10−81.34 × 10⁻⁸
Viperera 7/10111117.12 × 10−77.12 × 10−77.10 × 10−77.10 × 10−77.07 × 10−7
Viperera 11/201.59 × 10−81.34 × 10−81.73 × 10−84.39 × 10−83.25 × 10−811111
Viperera 14/101.33 × 10−71.32 × 10−71.33 × 10−71.41 × 10−71.39 × 10−72.45 × 10−12.48 × 10−12.55 × 10−12.59 × 10−12.76 × 10−1
Table 9. Results of the neural network against 35 challenges (from 31 to 35).
Challenges
3132333435
HoneysRapeseed2.01 × 10−72.01 × 10−72.01 × 10−72.01 × 10−72.01 × 10−7
Lavender1.06 × 10−81.06 × 10−81.06 × 10−81.06 × 10−81.06 × 10−8
Commercial1.75 × 10−81.75 × 10−81.75 × 10−81.75 × 10−81.75 × 10−8
Uncatalogued3.04 × 10−63.04 × 10−63.04 × 10−63.04 × 10−63.04 × 10−6
Viperera 7/101.13 × 10−71.13 × 10−71.13 × 10−71.13 × 10−71.13 × 10⁻⁷
Viperera 11/202.60 × 10−12.60 × 10−12.60 × 10−12.60 × 10−12.60 × 10⁻¹
Viperera 14/1011111
Table 10. Relationship of conductivity and coloration of the samples provided by the Association of Beekeepers of the Community of Madrid (Spain).
Pollen AnalysisMm PfundColorationConductivity (mS/cm)
Lavender40.3Extra-light amber0.16
Viperera 7/2037.3Extra-light amber0.26
Viperera 14/2037Extra-light amber0.27
Viperera 11/2043Extra-light amber0.30
Rapeseed28White0.32
Publisher’s Note: MDPI stays neutral with regard to jurisdictional claims in published maps and institutional affiliations.

