Article

Ethylenediurea Reduces Grain Nitrogen but Enhances Protein and Carbon Yield in Rice Cultivars

1
Key Laboratory of Agrometeorology of Jiangsu Province, School of Applied Meteorology, Nanjing University of Information Science & Technology, Nanjing 210044, China
2
Changwang School of Honors, Nanjing University of Information Science & Technology, Nanjing 210044, China
3
College of Wetland, Southwest Forestry University, Kunming 650224, China
4
Agricultural College, Yangzhou University, Yangzhou 225009, China
*
Authors to whom correspondence should be addressed.
These authors contributed equally to this work.
Agronomy 2022, 12(9), 1988; https://doi.org/10.3390/agronomy12091988
Submission received: 16 July 2022 / Revised: 19 August 2022 / Accepted: 20 August 2022 / Published: 23 August 2022

Abstract

:
Ethylenediurea (EDU) is an indicator of surface ozone (O3), has a high potential to be developed as an applicable protectant for crops against O3 phytotoxicity. Studies on the effects of EDU on grain quality are few, limiting evaluation of the efficiency of EDU protection. In order to understand the effects of EDU on grain quality in rice, a field study was conducted in a rice paddy, where EDU solutions were foliar applied to rice plants. At maturity, grain nitrogen concentrations (GN) in 21 rice cultivars and related traits were analyzed. Mean across 21 cultivars, GN was reduced by EDU by 3.81%, suggesting that O3 in ambient air is affecting grain quality. GN negatively correlated with grain weight and source/sink ratio, but positively correlated with spikelet density. Moreover, GN changes to EDU were rice type dependent, which were −0.43%, −0.72%, and 1.19% in indica, japonica, and hybrid rice, respectively. These results suggest that EDU promotes sink in rice, which helps to increase grain yield, but allocation of nitrogen is not enough to maintain GN in both indica and japonica cultivars. Rice types and cultivars’ variations in the responses of GN to EDU highlight a possibility to adjust grain quality by EDU, combining cultivar selection and agricultural management in response to surface O3 pollution.

1. Introduction

Rising concentrations of surface ozone (O3) reduce crop production [1,2], threatening the supply and accessibility of food to a large number of populations. The spatiotemporal variations in the rise of O3 [3,4] further increase the difficulty in developing adaptations to achieve sustainable food security. Ethylenediurea (EDU), a synthetic compound, is known to protect plants and crops from the negative effects induced by O3 [5,6], is likely to be developed as an applicable O3 protectant. Previous studies on the effects of EDU on crops mainly focused on grain production; grain quality changes to EDU are not yet well clarified, limiting the evaluation of EDU protection. Rice is one of the most important crops, providing staple food for more than half of the world’s population. Grain nitrogen concentration (GN) is one of the important grain quality traits in rice, a change that affects issues such as malnutrition, especially in Asia [7]. We therefore adopted this study, using 21 rice cultivars of different types: indica inbred, japonica inbred and hybrid. At maturity, GN as well as grain carbon concentration (GC), grain protein (GP), nitrogen yield (NY), carbon yield (CY) and protein yield (PY) among the rice types and cultivars were analyzed. This is actually a further analysis of the grains harvested in an EDU application experiment [8] but is notably the first investigation of GN changes in rice by EDU application across three types of 21 rice cultivars.
In this study, we hypothesized that GN, which is usually enhanced by high concentrations of surface O3, shall be decreased by EDU. As the plant growth and yield were more sensitive to elevated O3 in hybrid cultivars than the inbred [9] and EDU could not fully protect hybrid rice against the concentration of surface O3 at the experimental site [8], changes of GN in hybrid rice remain to be clarified.

2. Materials and Methods

The block control experiment was conducted in a rice paddy (32°16′ N, 119°33′ E) located in a lower reach of the Yangtze River Delta (YRD), China in 2018. The site is one of the major rice production areas but is under rising concentrations of surface O3 [2,8]. In a paddy field of 46 m × 35 m, we set 5 plots (9.6 m × 5.5 m each) of the EDU treatment and another 5 plots for the control treatment. In each plot, planting lines were designed for different rice cultivars (1 cultivar per line, randomly, and at least 2 lines of plant were used as buffer), and 21 rice cultivars (8 hybrid, 8 indica inbred and 5 japonica inbred) were investigated (Table 1). Rice cultivation, fertilizer and water management, pest and animal controls as well as other field practices were performed following the local farmers’ practices.
EDU solution (450 ppm) was prepared by dissolving EDU powder (100%) in warm water (with 0.01% of Tween 20) [8]. EDU application by foliar spray was started on 26 June (from 8:00 to 9:00 AM) and repeated 9 more times at an interval of 10 days. In the control treatment, plants were sprayed with the same volume of Tween 20 buffer solution without EDU.
Rice was harvested at physiological maturity, when 85% of the grains became straw-colored and the grain moisture content fell to ca. 20% [8]. The plant and grains were airdried to a constant weight. After determining the grain yield, sub samples were collected for grain quality analysis. Grains were peeled [10] and then grounded using a ball mill. GN and GC were determined by an elemental analyzer (Flashsmart CN, Italy). GP (5.95 × GN × GW) was calculated by the conversion coefficient of 5.95 [11] from GN and grain weight (GW). NY, CY and PY were calculated by GN and GC with GW and grain yield. In order to understand the mechanisms of GN changes, aboveground biomass, sink capacity (SC, spikelet number per square meter × single grain weight), harvest index (HI, grain yield per square meter/aboveground biomass per square meter) and source/sink ratio (aboveground biomass/sink capacity) were adopted for the analysis.
The results were subjected to ANOVA to check the effects of rice type (indica, japonica or hybrid), EDU application (EDU or control), interaction between rice type and EDU application, and interaction between cultivar and EDU application. Simple linear regression and Row-wise [12] methods were used to check the relations among the investigated traits. The statistical work was conducted with JMP-Pro ver. 16.

3. Results

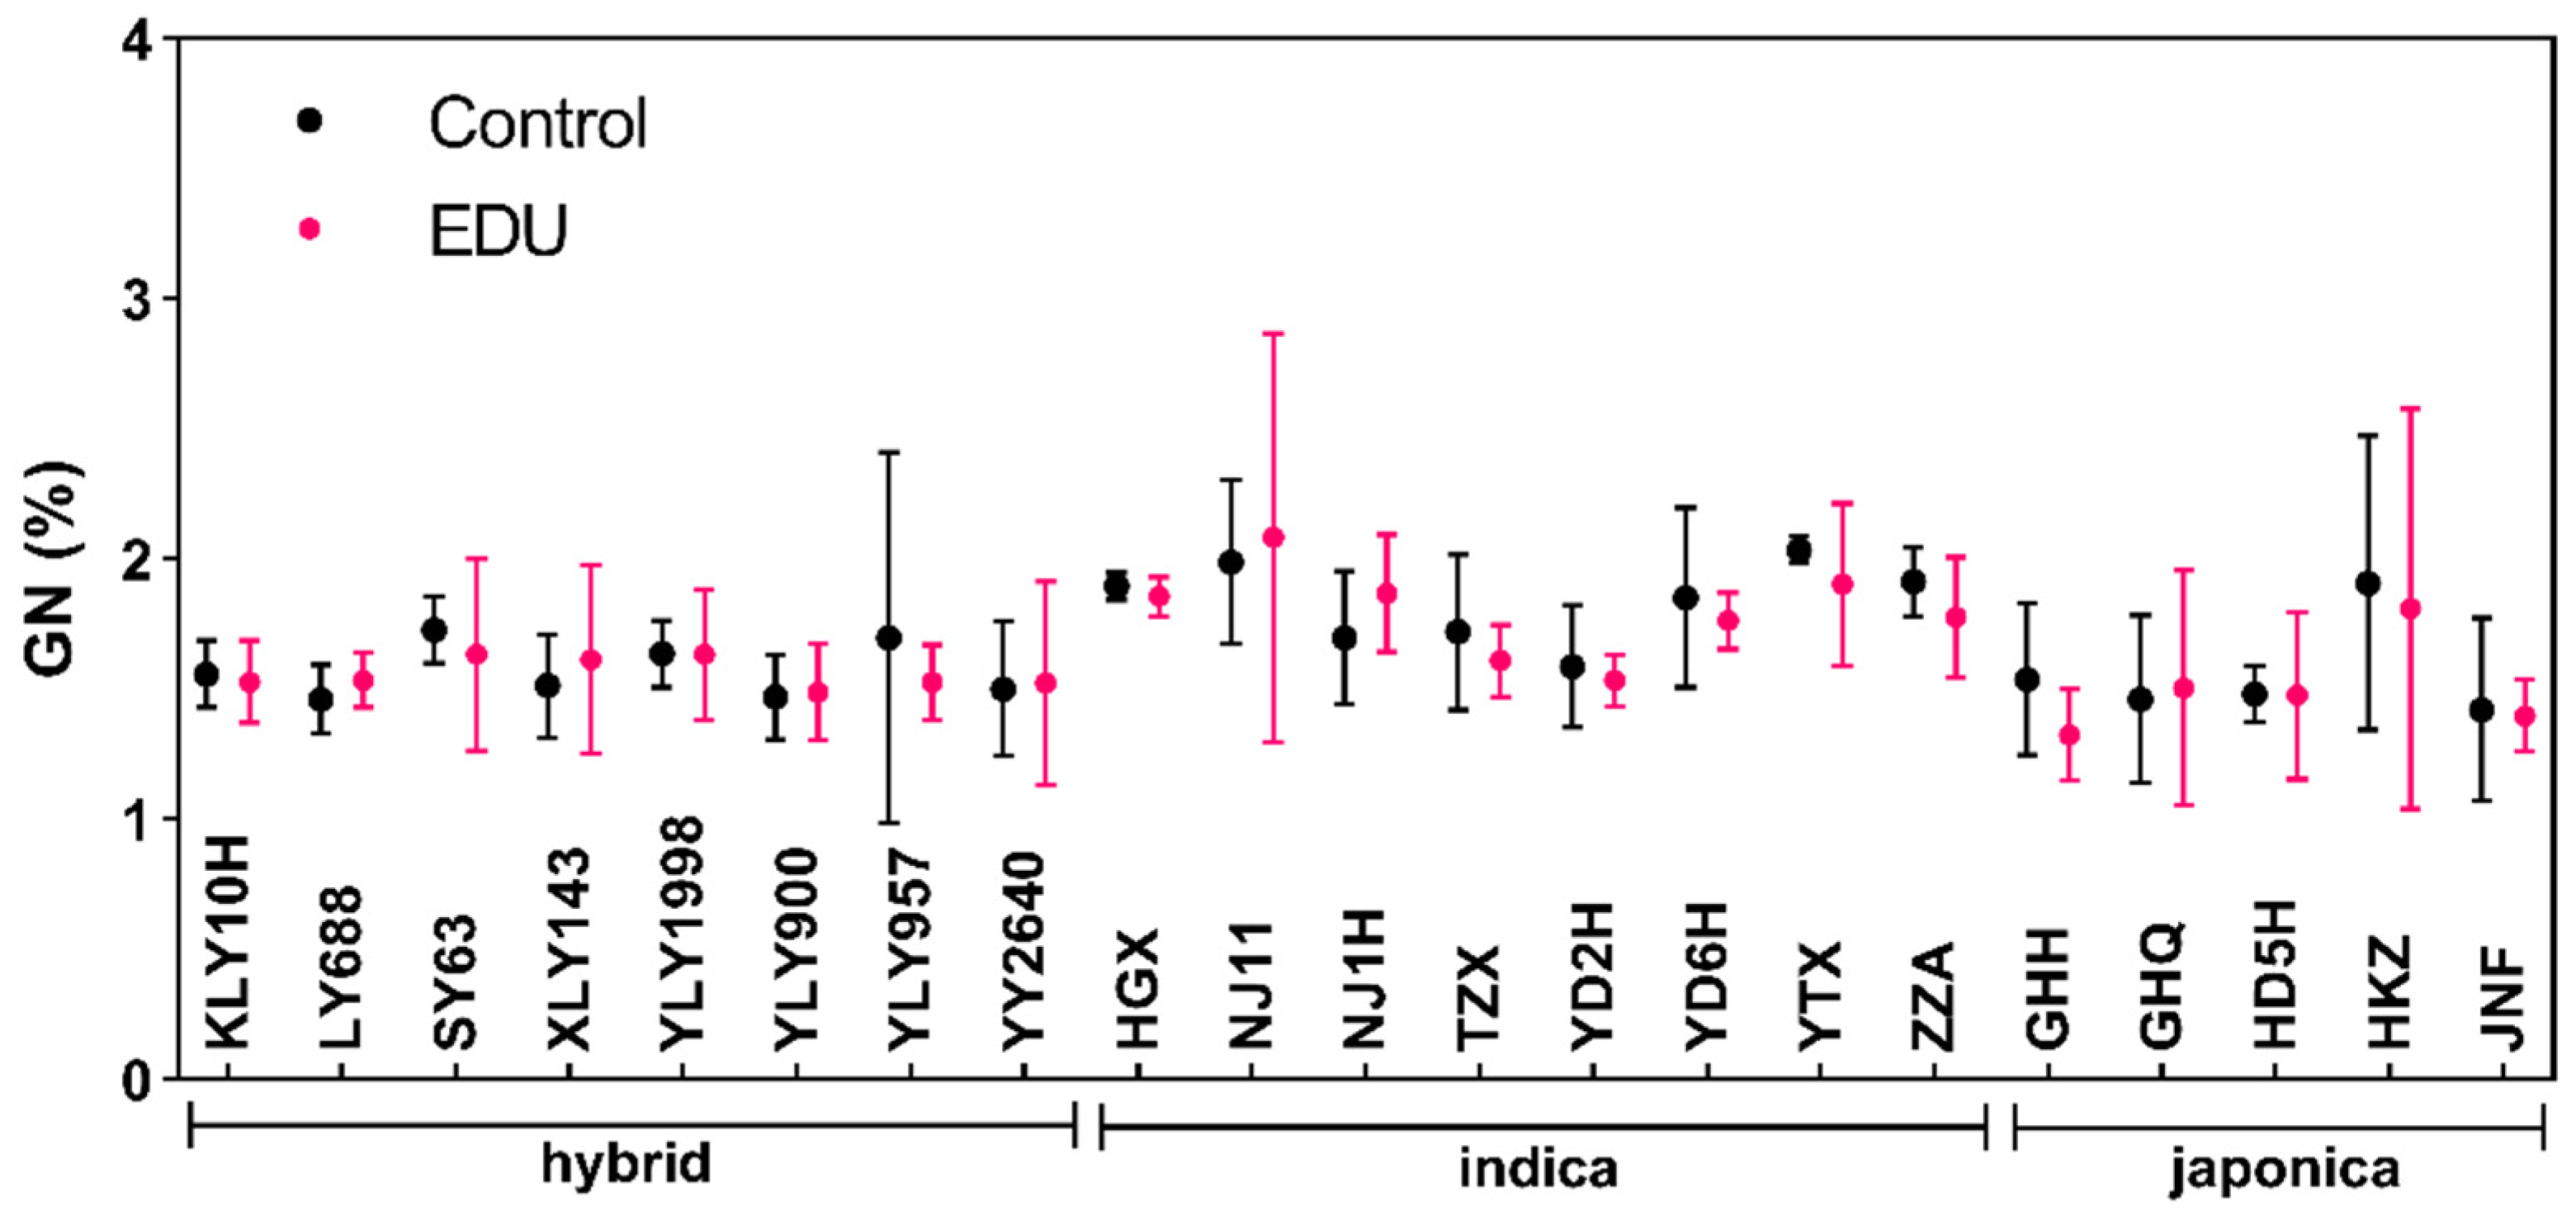
3.1. EDU Reduced Grain Nitrogen but Increased Grain Protein in Rice Cultivars

GN in the control and EDU plots across 21 rice cultivars are shown in Figure 1. When averaged across all the cultivars, GN is 3.81% lower in EDU than in the control (p = 0.0028, Table 2). Variations among the rice types are significant (p < 0.0001): GN is highest in indica rice (1.82%), followed by hybrid (1.56%) and japonica rice (1.53%).
Moreover, there is no significant interaction effect between rice type and the treatment (p = 0.0948), so we checked EDU effect on different types of rice, and the changes of GN to EDU are 1.19%, −0.43%, and −0.72% in hybrid, indica and japonica rice, respectively. GP is 4.9% higher in EDU than in the control, and japonica rice has smaller GP (1.76 g) than hybrid (1.92 g) and indica (1.93 g) rice. There are significant variations among cultivars for both GN (p < 0.0001) and GP (p < 0.0001).

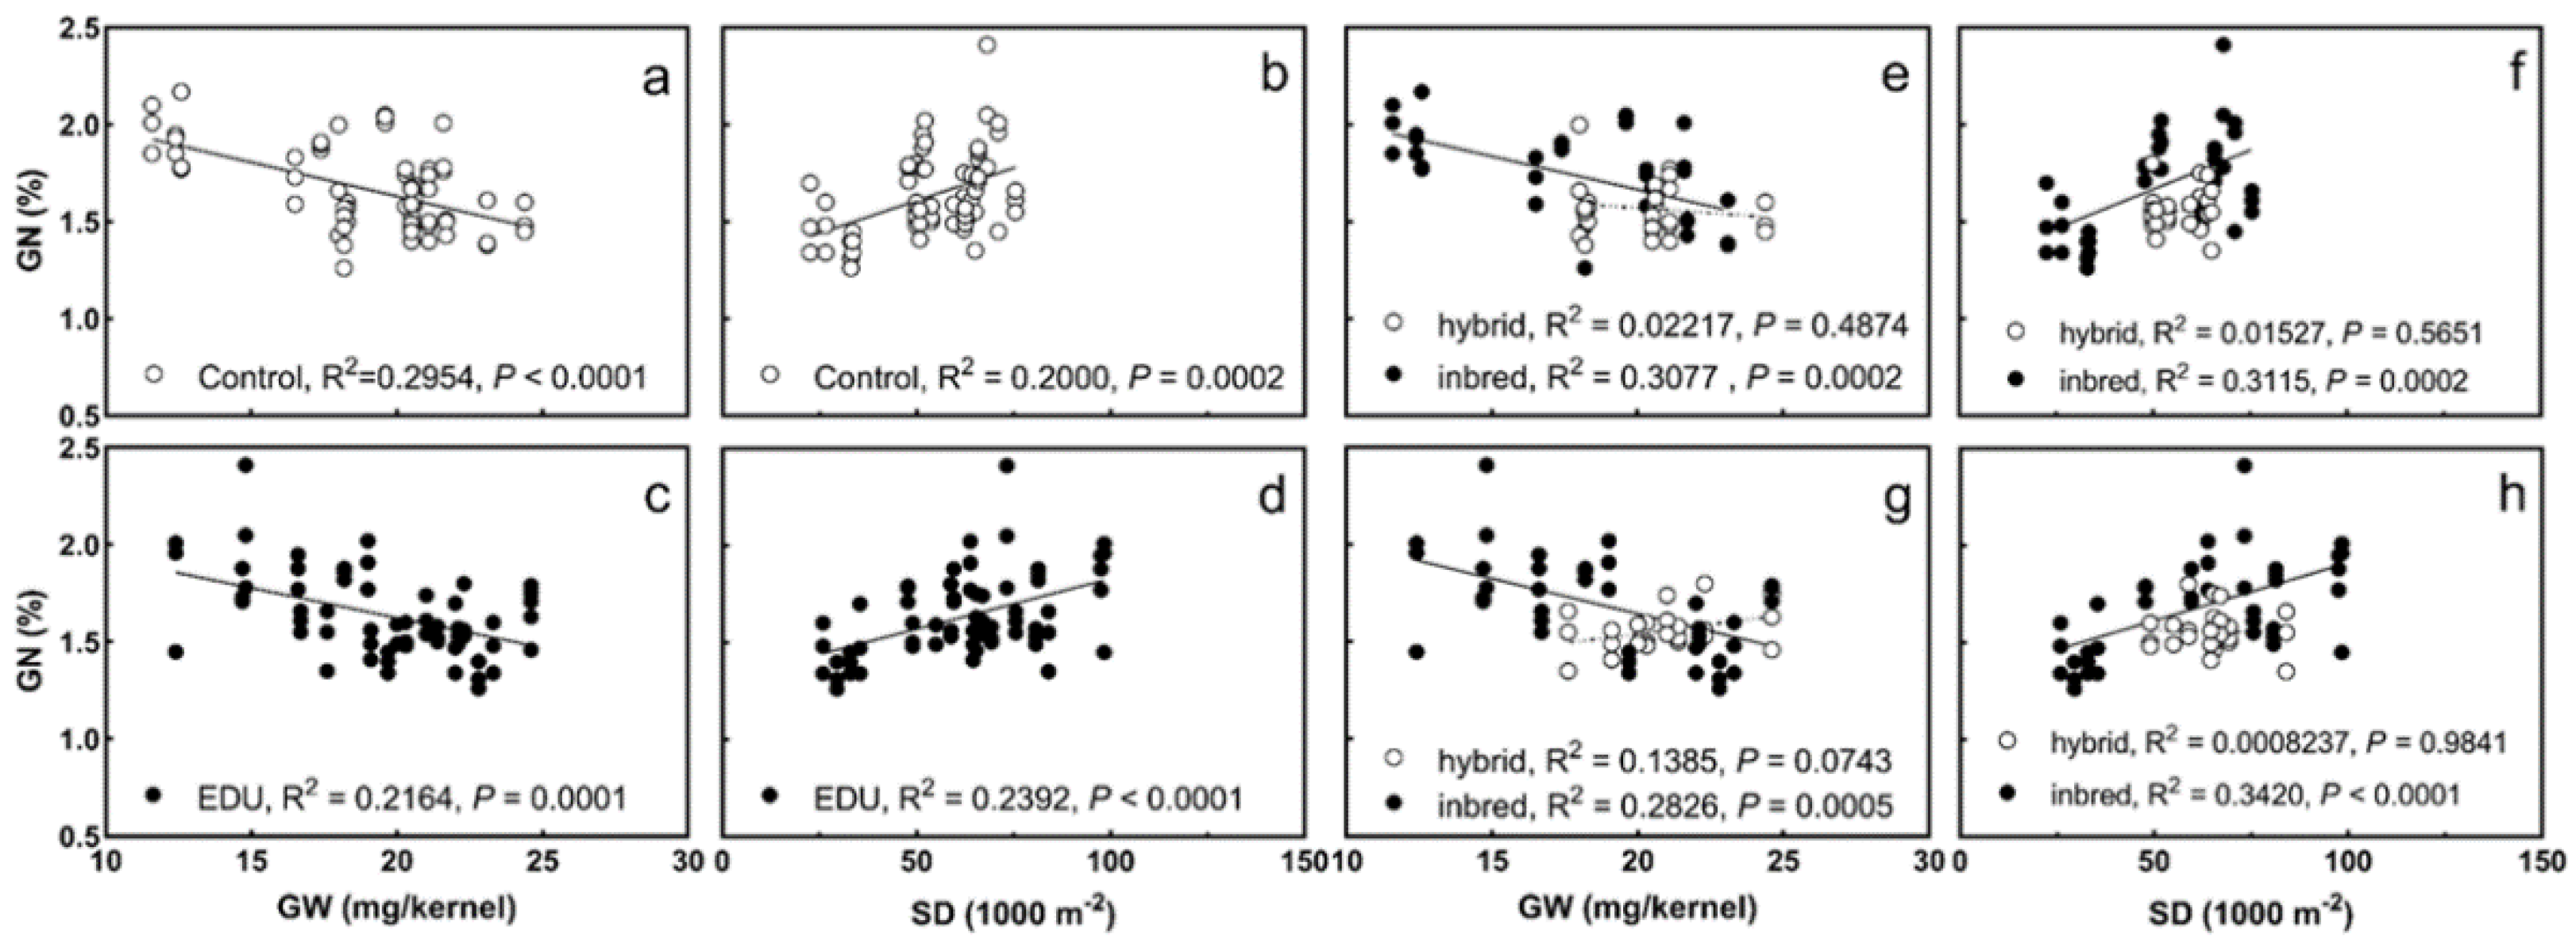
3.2. GN Significantly Correlates with Grain Number and Grain Weight

Results of multivariable correlations are shown in Table 3, GN is positively correlated with panicle density (PD, panicle number per square meter, control: r = 0.5285, p < 0.05; EDU: r = 0.4877, p < 0.05) and spikelet density (SD, panicle number per square meter × spikelet number per panicle, is usually used to stand for grain number, control: r = 0.5183, p < 0.05; EDU: r = 0.5721, p < 0.01), and it is negatively correlated with percentage of ripened spikelet (RS, control: r = −0.6641, p < 0.01; EDU: r = −0.6725, p < 0.001) and grain weight (GW, control: r = −0.6068, p < 0.05; EDU: r = −0. 5422, p < 0.05). For inbred rice, GN is positively correlated with spikelet number per panicle (SPP, control: r = 0.6266, p < 0.05; EDU: r = 0.6995, p < 0.01) and SD (control: r = 0.7247, p < 0.01; EDU: r = 0.6738, p < 0.05), and it is negatively correlated with GW (control: r = −0.6097, p < 0.05; EDU: r = −0.6109, p < 0.05).
The changes of GN with grain weight and grain number are shown in Figure 2 in which we plotted GN with GW, and with SD. When we plot the GN in three types of rice cultivars against GW and SD, significant negative correlations between GN and GW in both the control (Figure 2a) and the EDU (Figure 2c) plots are clearly shown, as well as significant positive correlations between GN and SD (Figure 2b,d). When we separate the rice types by hybrid and inbred (indica and japonica), the correlations between GN, GW, and SD are found only in inbred rice (Figure 2e–h).

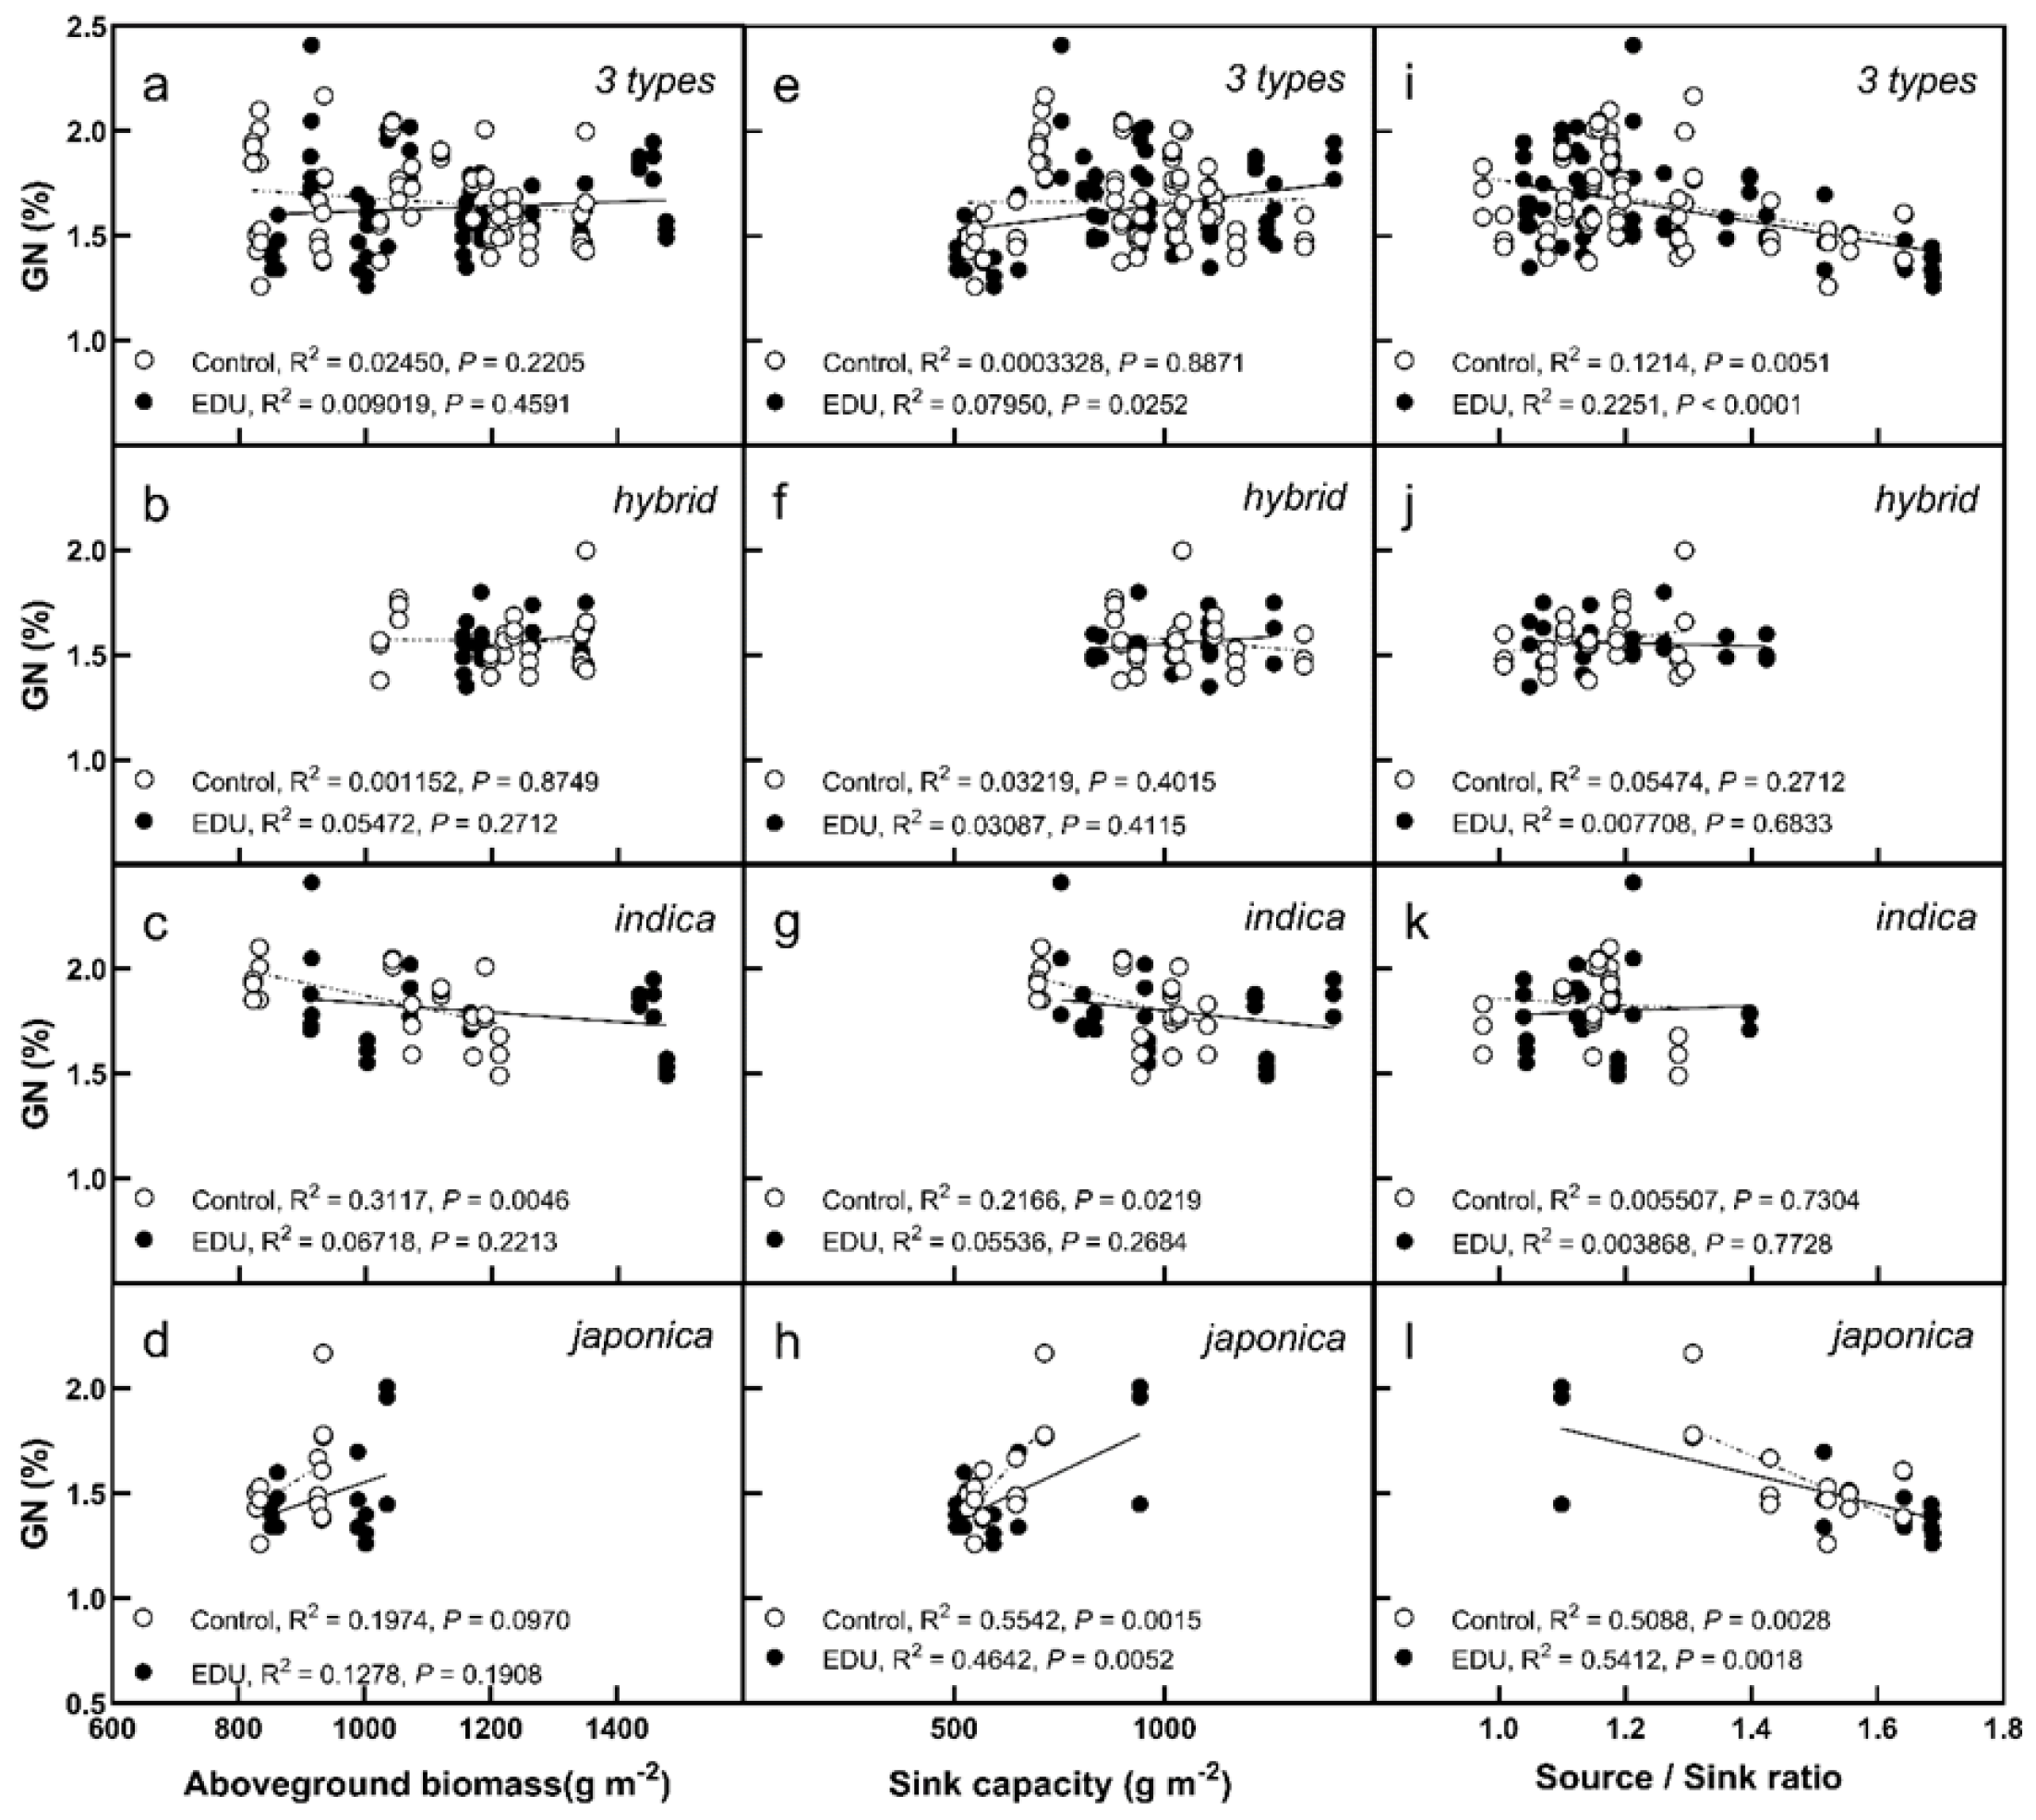
3.3. GN Changes with Sink and Source

Figure 3 shows the correlations of GN with aboveground biomass (source), sink capacity (SC, spikelet number per square meter × single grain weight) and source/sink ratio (aboveground biomass/sink capacity). When three types of rice cultivars are analyzed together, source does not affect GN (Figure 3a); SC positively correlates with GN, especially at EDU plots (Figure 3e, p < 0.05); Source/sink ratio negatively correlates with GN (Figure 3i). When the three types of rice are analyzed separately, changes of source (Figure 3b), sink (Figure 3f) and source/sink ratio (Figure 3j) do not affect GN in hybrid rice; in indica rice, source (Figure 3c, p < 0.01) and sink (Figure 3g, p < 0.05) negatively affect GN in control plots; GN is positively correlated with SC in japonica rice in both of EDU and control plots (Figure 3h, p < 0.01).

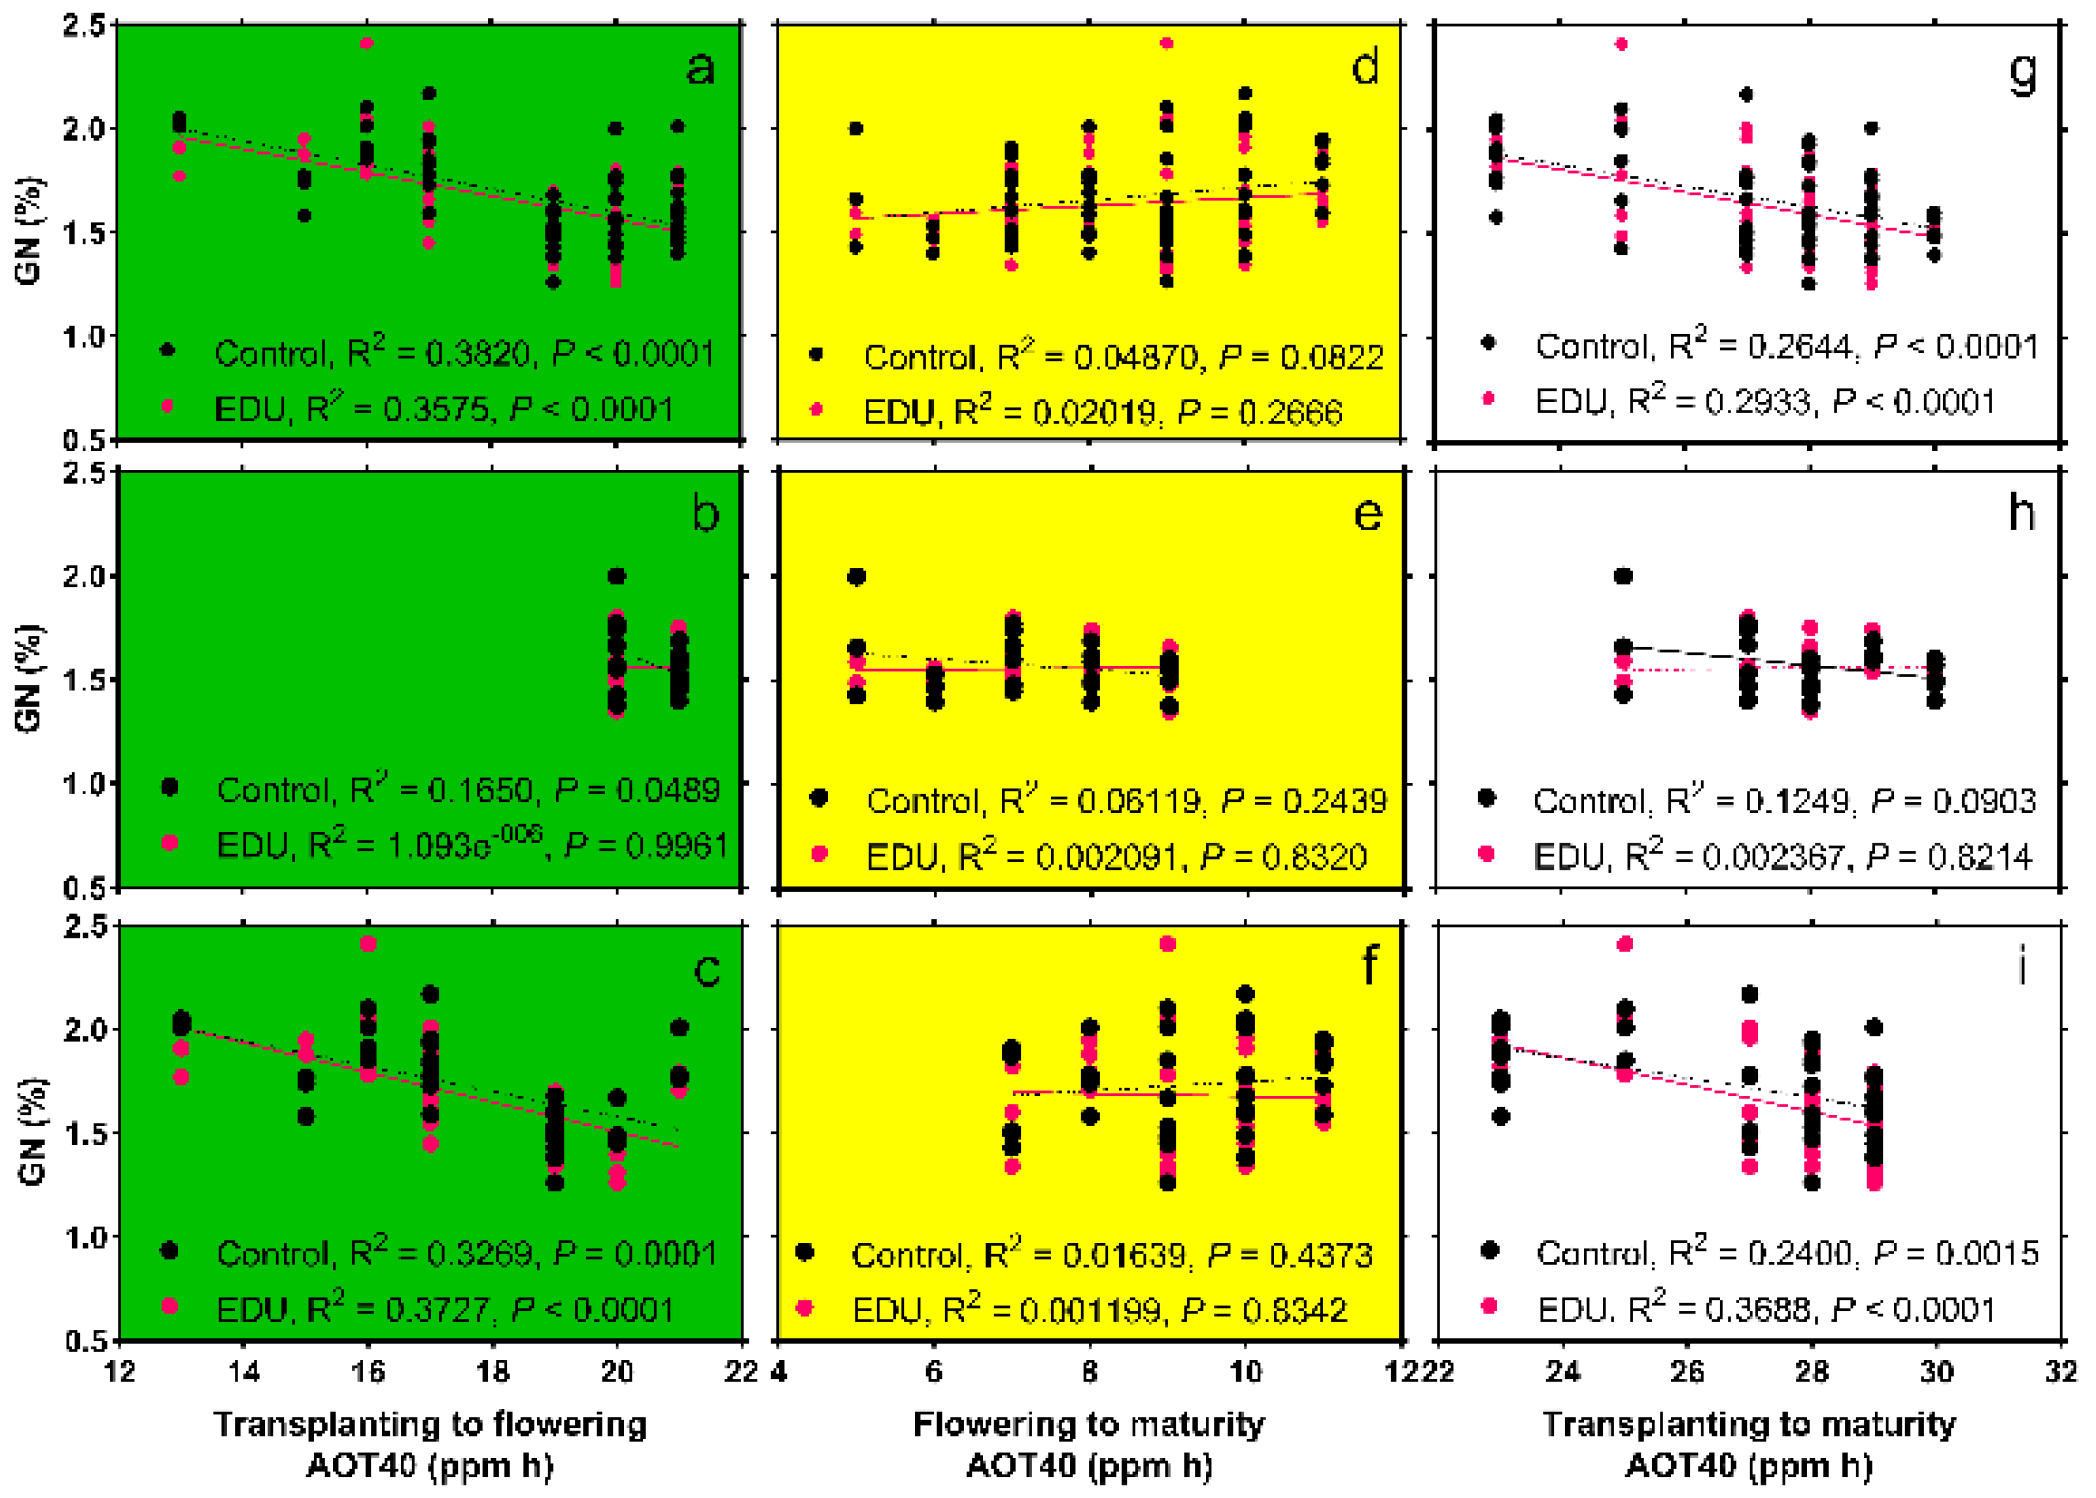
3.4. GN Is Negatively Correlated with the Concentration of Surface O3

AOT40, the accumulating hourly O3 concentration above the threshold of 40 ppb for daylight hours is used to quantify the O3 stress [8]. GN in the three types of rice cultivars, and separated into inbred and hybrid cultivars are plotted with AOT40 during the growth season (Figure 4). Negative correlations between GN and AOT40 during the growth season, as well as during the stage from transplanting to flowering, are significant in both the control and the EDU (Figure 4a,g p < 0.0001). Changes of GN are not correlated with AOT40 during the grain filling stage (from flowering to maturity, Figure 4d–f).

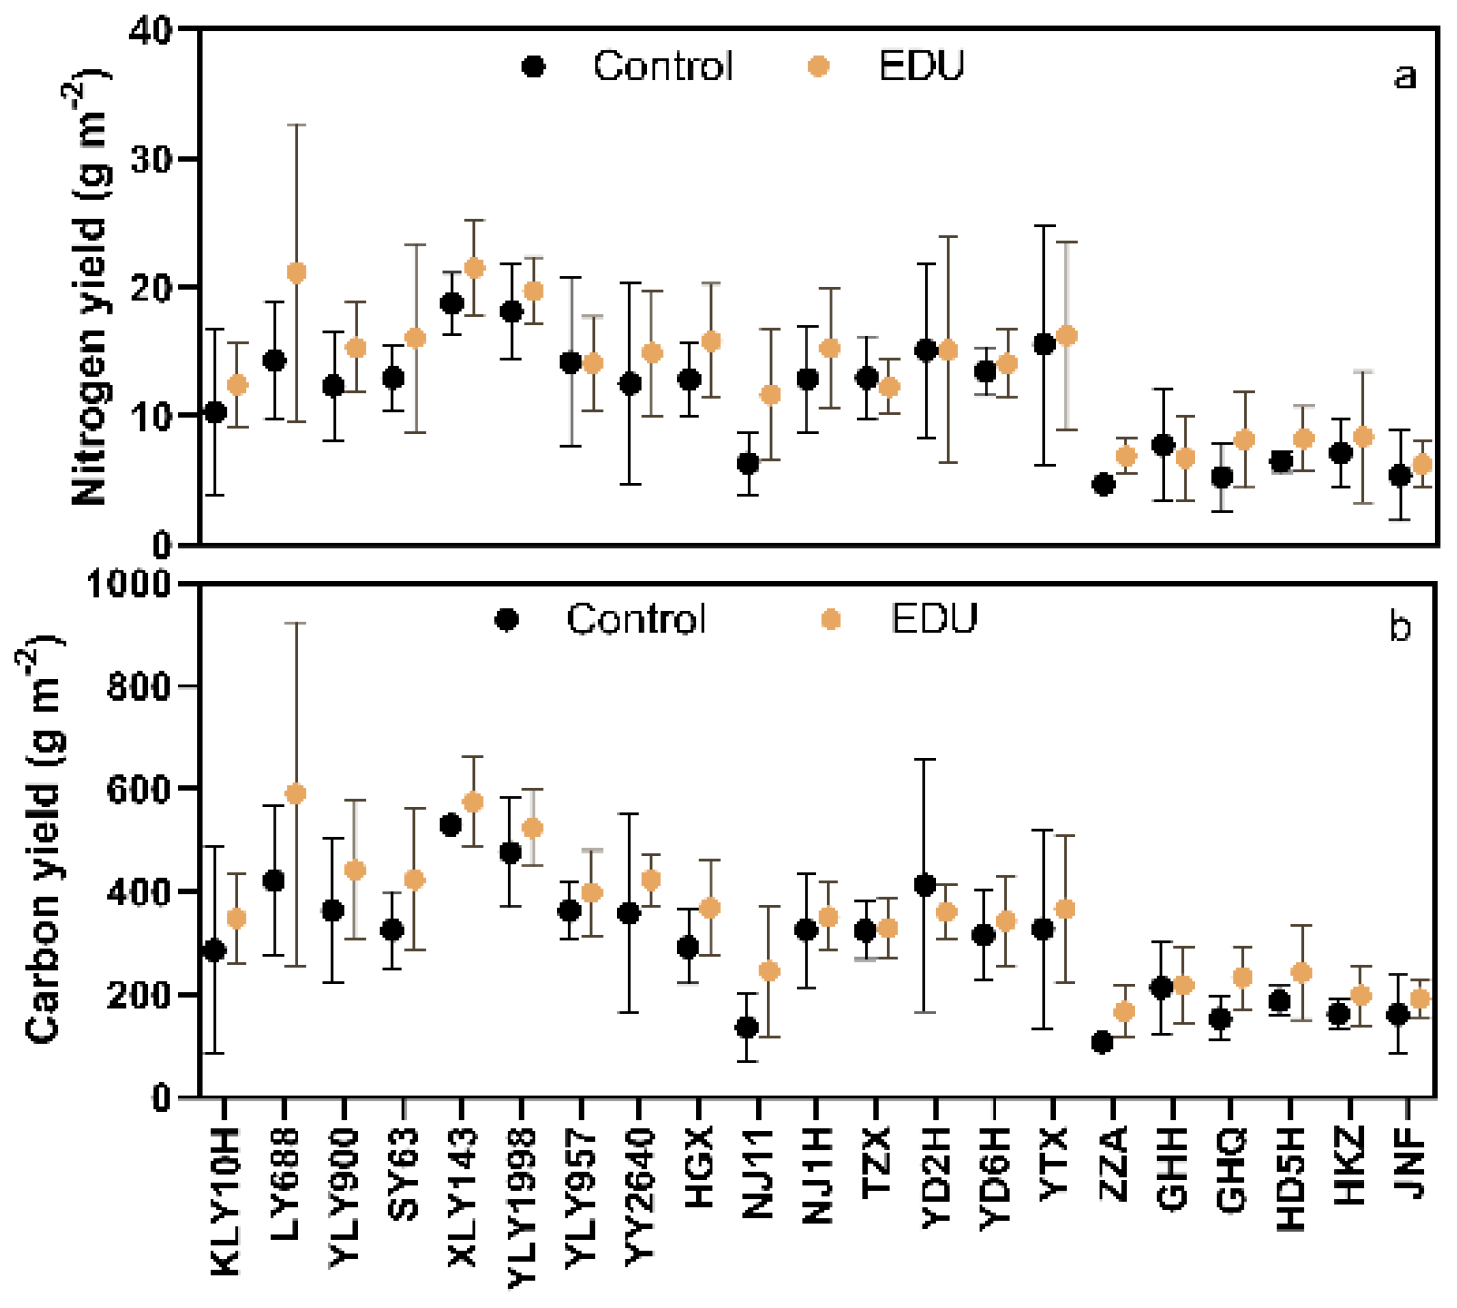
3.5. EDU Increased Nitrogen and Carbon Yield

Mean across all the rice cultivars, EDU increased NY and PY by 17.89% (p < 0.0001, Table 2). NY and PY were largest in hybrid rice, followed by indica rice and japonica rice. GC was not significantly affected by EDU, neither were the variations among rice types and cultivars significant. However, CY was increased by EDU by 19.92% (p < 0.0001). CY also ranked as hybrid, indica and japonica. NY and CY were significantly different among rice cultivars (Figure 5, p < 0.0001).

4. Discussion

4.1. EDU Reduces Grain Nitrogen but Increases Grain Protein

The results of our experiment support our first hypothesis: EDU reduces GN (Table 2, p < 0.01). GN reduces with the increase of AOT40 during rice growth (Figure 3g), especially during the stage from transplanting to flowering (Figure 3a). A higher concentration of surface O3 usually increases GN in rice [13,14,15]. It is therefore suggested that the grain nutritional quality is significantly affected by surface O3 at the current levels in the major rice producing area of this study. Although GN was reduced, GP was increased by EDU. GP is the result of GN and GW, the changes of GN in indica and japonica rice are −0.43% and −0.72%, and the increment of GW by EDU reached 3.7% [8], thus GW is mainly responsible for the GP increment in inbred cultivars. In hybrid cultivars, EDU did not reduce but increased GN by 1.19%. The reason why GN in hybrid rice was increased by EDU could be the incomplete protection of EDU on hybrid rice cultivars [8], and biomass loss by O3 phytotoxicity induced a concentration effect [13]. The GN increment in hybrid rice could also be induced by the allocation of leaf nitrogen to GN accumulation [10] and be related with other mechanisms by which EDU protects plants against higher O3.

4.2. Mechanisms for the Grain Nitrogen Change to EDU and Remaining Uncertainties

GN changes to higher concentrations of surface O3 involves accelerated foliar senescence [9,16], concentration effect induced by decreased biomass [13,17], and imbalance in the nitrogen distribution between source and sink [18], adjusted by the biochemical and physiological mechanisms [5,19]. Although uncertainties remain, GN changes in this study could be discussed as follows:

4.2.1. EDU Protection against O3-Induced Accelerated Senescence

EDU could completely protect accelerated foliar senescence induced by higher concentrations of surface O3 in a potato study [20]. EDU also prolongs the senescence of maize and protects protein expressions [21]. Our former studies also reported that EDU extended the duration of rice from transplanting to maturity [8], and EDU promoted the allocation of leaf nitrogen to grain [10]. These suggest that GN changes to EDU could possibly be explained by the prolonged senescence, which is usually shortened by O3 stress.

4.2.2. Opposite to Concentration Effect Induced by O3 Phytotoxicity, EDU Reduces GN by Dilution

The dilution effect could be seen from the significant relationships between GN and GW (Figure 2a,c), where GN declines with the increase of GW, but this dilution effect could only be found in inbred cultivars. Moreover, the amount of available nitrogen allocated to each grain decreases with the increase of grain number, thus the increase of SD may also dilute GN. SD was reported to be more responsible for the yield loss induced by higher concentrations of O3 [22]. As an O3 protectant, EDU enhances rice yield primarily by the increase of SD [8]. These suggest that the increment of SD by EDU may dilute GN.
However, when we plot GN with SD, GN is positively correlated with SD (Figure 2b,d), especially in inbred rice (Figure 2f,h), and the correlation coefficient (R2) is larger at EDU than at the control. Why did the increment of SD by EDU not dilute GN? This could possibly be explained by EDU acting as nitrogen fertilizer [6], application of which during the early stage of rice growth, affects the number of panicles and spikelets per panicle [23,24] and decides SD. In previous studies, we found that EDU stimulated GN accumulation in hybrid rice [10]. Thus, the positive correlations between GN and SD in this study suggest that larger SD stimulates nitrogen allocation to the grain. Once the amount of nitrogen to SD is decided, the increase in the percentage of ripened spikelet (RS) dilutes GN, which could be seen from the negative correlation between GN and RS (Table 3, r = −0.6641, p < 0.01 at control; r = −0.6725, p < 0.001 at EDU). Thus, dilution of GN by grain number could be found from the increased RS under EDU [8].

4.2.3. Source and Sink Related GN Changes

Nitrogen distributions between source and sink determines grain yield and grain quality [25,26,27]. Plant senescence and poor sink-source balance after heading is attributed to its high GN [27], both plant senescence and sink-source balance could be adjusted by fertilization [28]. Oppositely, EDU mitigates senescence by extending the duration from flowering to maturity [8], and source/sink ratio negatively correlated with GN (Figure 3i). These suggest that EDU reduces GN through alterations on source-sink balance. Variations among rice types and rice cultivars exist in the relations between GN and source/sink ratio (Figure 3l) [26], which may be related to physiological and biochemical factors that determine sink strength and grain filling [29]. Sink strength is determined by phenotype, molecular physiology, and cultivars [30,31,32]. Grain filling is a complex process, during which grain growth is affected by both genetic and environmental factors [33,34,35], and both grain yield and grain quality are determined by grain growth [36,37]. Future studies on the effect of EDU on grain filling are suggested; as grain growth response to O3 is affected by its position on panicle [22], positional variations should be considered [38].

4.3. Imbalanced Increase in Nitrogen and Carbon Yield by EDU

The increment of NY and CY by EDU are 17.89% and 19.92% (Table 2, p < 0.0001), which are primarily achieved by the enhancement of grain yield [8]. The imbalanced increase of NY and CY also shows the dilution of nitrogen by carbon. Both NY and CY in hybrid rice are largest in comparison to inbred rice, owing to its larger GW and SD (Figure 2e,f). SD is the result of PD and SPP, which could be adjusted by cultivar selection [39,40] and agricultural management [41,42]. While, source/sink ratio and nitrogen distribution affect grain yield and grain quality, the application of EDU to hybrid, indica, and japonica rice were the same in this study; the different efficiencies in the protection among rice types suggest that further studies on the adjusted application of EDU on hybrid rice should be conducted.

5. Conclusions

Foliar application of EDU reduced grain nitrogen but increased grain protein. Mechanisms by which EDU regulate grain nutritional quality involve protection effects against O3-induced accelerated senescence, dilution effect, and source sink distributions. Source sink distributions depend on fertilization, thus a combination of EDU application and fertilizer management should be studied to better understand the mechanism by which EDU regulates grain nutrition. Variations exist in the responses of different rice types and cultivars to EDU, suggesting a possibility to improve the efficiency of EDU protection by cultivar selection. For hybrid rice, studies on the adjusted application of EDU should be conducted in the future. As GN changing to O3 depends on growth stages, and spatiotemporal variations exist in the rise in O3, studies on the growth-stage-dependent application of EDU are suggested for improving protection efficiency.

Author Contributions

G.Z.: conceptualization, methodology, investigation, data curation, formal analysis, funding acquisition, writing—original draft. R.C.: conceptualization, investigation, data curation, formal analysis. H.R.: investigation. Q.H.: investigation. X.P.: investigation. Y.H.: investigation. H.W.: investigation. B.S.: investigation. Z.Z.: conceptualization, resources. Z.F.: project administration, methodology, funding and resources acquisition. All authors have read and agreed to the published version of the manuscript.

Funding

The research was supported by the National Natural Science Foundation of China (42077209, 30099413), the National Key Research and Development Program of China (2019YFA0607403), the Sino-German Mobility Programme (M-0105), the Open Project of Jiangsu Key Laboratory of Crop Genetics and Physiology (YCSL202004), and the Open Fund of Key Laboratory of Agrometeorology of Jiangsu Province (JKLAM2001). The design of the study and collection of data was supported by the Startup Foundation for Introducing Talent of Nanjing University of Information Science and Technology (002998, 003035, and 003320), Nanjing, China.

Institutional Review Board Statement

Not applicable.

Informed Consent Statement

Not applicable.

Data Availability Statement

Not applicable.

Conflicts of Interest

The authors declare no conflict of interest.

References

  1. Chuwah, C.; van Noije, T.; van Vuuren, D.P.; Stehfest, E.; Hazeleger, W. Global impacts of surface ozone changes on crop yields and land use. Atmos. Environ. 2015, 106, 11–23. [Google Scholar] [CrossRef]
  2. Feng, Z.; Xu, Y.; Kobayashi, K.; Dai, L.; Zhang, T.; Agathokleous, E.; Calatayud, V.; Paoletti, E.; Mukherjee, A.; Agrawal, M.; et al. Ozone pollution threatens the production of major staple crops in East Asia. Nat. Food 2022, 3, 47–56. [Google Scholar] [CrossRef]
  3. Li, X.B.; Wang, D.S.; Lu, Q.C.; Peng, Z.R.; Lu, S.J.; Li, B.; Li, C. Three-dimensional investigation of ozone pollution in the lower troposphere using an unmanned aerial vehicle platform. Environ. Pollut. 2017, 224, 107–116. [Google Scholar] [CrossRef] [PubMed]
  4. Yang, G.; Liu, Y.; Li, X. Spatiotemporal distribution of ground-level ozone in China at a city level. Sci. Rep. 2020, 10, 7229. [Google Scholar] [CrossRef]
  5. Lee, E.H.; Upadhyaya, A.; Agrawal, M.; Rowland, R.A. Mechanisms of ethylenediurea (EDU) induced ozone protection: Reexamination of free radical scavenger systems in snap bean exposed to O3. Environ. Exp. Bot. 1997, 38, 199–209. [Google Scholar] [CrossRef]
  6. Agathokleous, E.; Paoletti, E.; Saitanis, C.J.; Manning, W.J.; Shi, C.; Koike, T. High doses of ethylene diurea (EDU) are not toxic to willow and act as nitrogen fertilizer. Sci. Total Environ. 2016, 566–567, 841–850. [Google Scholar] [CrossRef]
  7. Deng, F.; Wang, L.; Mei, X.F.; Li, S.X.; Pu, S.L.; Li, Q.P.; Ren, W.J. Polyaspartic acid (PASP)-urea and optimised nitrogen management increase the grain nitrogen concentration of rice. Sci. Rep. 2019, 9, 313. [Google Scholar] [CrossRef]
  8. Zhang, G.; Kobayashi, K.; Wu, H.; Shang, B.; Wu, R.; Zhang, Z.; Feng, Z. Ethylenediurea (EDU) protects inbred but not hybrid cultivars of rice from yield losses due to surface ozone. Environ. Sci. Pollut. Res. Int. 2021, 28, 68946–68956. [Google Scholar] [CrossRef]
  9. Wang, Y.; Yang, L.; Han, Y.; Zhu, J.; Kobayashi, K.; Tang, H.; Wang, Y. The impact of elevated tropospheric ozone on grain quality of hybrid rice: A free-air gas concentration enrichment (FACE) experiment. Field Crops Res. 2012, 129, 81–89. [Google Scholar] [CrossRef]
  10. Shang, B.; Fu, R.; Agathokleous, E.; Dai, L.; Zhang, G.; Wu, R.; Feng, Z. Ethylenediurea offers moderate protection against ozone-induced rice yield loss under high ozone pollution. Sci. Total Environ. 2022, 806, 151341. [Google Scholar] [CrossRef]
  11. Zhu, Y.; Li, W.; Jing, Q.; Cao, W.; Horie, T. Modeling grain protein formation in relation to nitrogen uptake and remobilization in rice plant. Front. Agric. China 2007, 1, 8–16. [Google Scholar] [CrossRef]
  12. De Vries, H. The rowwise correlation between two proximity matrices and the partial rowwise correlation. Psychometrika 1993, 58, 53–69. [Google Scholar] [CrossRef]
  13. Frei, M.; Kohno, Y.; Tietze, S.; Jekle, M.; Hussein, M.A.; Becker, T.; Becker, K. The response of rice grain quality to ozone exposure during growth depends on ozone level and genotype. Environ. Pollut. 2012, 163, 199–206. [Google Scholar] [CrossRef]
  14. Wang, Y.; Song, Q.; Frei, M.; Shao, Z.; Yang, L. Effects of elevated ozone, carbon dioxide, and the combination of both on the grain quality of Chinese hybrid rice. Environ. Pollut. 2014, 189, 9–17. [Google Scholar] [CrossRef]
  15. Zhou, X.; Zhou, J.; Wang, Y.; Peng, B.; Zhu, J.; Yang, L.; Wang, Y. Elevated tropospheric ozone increased grain protein and amino acid content of a hybrid rice without manipulation by planting density. J. Sci. Food Agric. 2015, 95, 72–78. [Google Scholar] [CrossRef]
  16. Shi, G.; Yang, L.; Wang, Y.; Kobayashi, K.; Zhu, J.; Tang, H.; Pan, S.; Chen, T.; Liu, G.; Wang, Y. Impact of elevated ozone concentration on yield of four Chinese rice cultivars under fully open-air field conditions. Agric. Ecosyst. Environ. 2009, 131, 178–184. [Google Scholar] [CrossRef]
  17. Pang, J.; Kobayashi, K.; Zhu, J. Yield and photosynthetic characteristics of flag leaves in Chinese rice (Oryza sativa L.) varieties subjected to free-air release of ozone. Agric. Ecosyst. Environ. 2009, 132, 203–211. [Google Scholar] [CrossRef]
  18. Gelang, J.; Selldén, G.; Younis, S.; Pleijel, H. Effects of ozone on biomass, non-structural carbohydrates and nitrogen in spring wheat with artificially manipulated source/sink ratio. Environ. Exp. Bot. 2001, 46, 155–169. [Google Scholar] [CrossRef]
  19. Pandey, A.K.; Majumder, B.; Keski-Saari, S.; Kontunen-Soppela, S.; Mishra, A.; Sahu, N.; Pandey, V.; Oksanen, E. Searching for common responsive parameters for ozone tolerance in 18 rice cultivars in India: Results from ethylenediurea studies. Sci. Total Environ. 2015, 532, 230–238. [Google Scholar] [CrossRef]
  20. Eckardt, N.A.; Pell, E.J. Effects of ethylenediurea (EDU) on ozone-induced acceleration of foliar senescence in potato (Solanum tuberosum L.). Environ. Pollut. 1996, 92, 299–306. [Google Scholar] [CrossRef]
  21. Gupta, S.K.; Sharma, M.; Majumder, B.; Maurya, V.K.; Deeba, F.; Zhang, J.-L.; Pandey, V. Effects of ethylenediurea (EDU) on regulatory proteins in two maize (Zea mays L.) varieties under high tropospheric ozone phytotoxicity. Plant Physiol. Biochem. 2020, 154, 675–688. [Google Scholar] [CrossRef]
  22. Shao, Z.; Zhang, Y.; Mu, H.; Wang, Y.; Wang, Y.; Yang, L. Ozone-induced reduction in rice yield is closely related to the response of spikelet density under ozone stress. Sci. Total Environ. 2020, 712, 136560. [Google Scholar] [CrossRef]
  23. Huang, M.; Yang, C.; Ji, Q.; Jiang, L.; Tan, J.; Li, Y. Tillering responses of rice to plant density and nitrogen rate in a subtropical environment of southern China. Field Crops Res. 2013, 149, 187–192. [Google Scholar]
  24. Zhou, W.; Lv, T.; Yang, Z.; Wang, T.; Fu, Y.; Chen, Y.; Hu, B.; Ren, W. Morphophysiological mechanism of rice yield increases in response to optimized nitrogen management. Sci. Rep. 2017, 7, 17226. [Google Scholar]
  25. Tegeder, M.; Masclaux-Daubresse, C. Source and sink mechanisms of nitrogen transport and use. New Phytol. 2017, 217, 35–53. [Google Scholar] [CrossRef]
  26. He, H.; Wang, Q.; Yang, K.; Niu, M.; Wang, L.; Wu, H.; You, C.; Ke, J.; Zhu, D.; Wu, L. Optimizing nitrogen distribution in source-sink organs at heading for high grain yield and high nitrogen use efficiency in Japonica rice. Agron. J. 2021, 113, 4832–4849. [Google Scholar] [CrossRef]
  27. Wei, H.; Meng, T.; Li, X.; Dai, Q.; Zhang, H.; Yin, X. Sink-source relationship during rice grain filling is associated with grain nitrogen concentration. Field Crops Res. 2018, 215, 23–38. [Google Scholar]
  28. Pan, Y.; Guo, J.; Fan, L.; Ji, Y.; Liu, Z.; Wang, F.; Pu, Z.; Ling, N.; Shen, Q.; Guo, S. The source sink balance during the grain filling period facilitates rice production under organic fertilizer substitution. Eur. J. Agron. 2022, 134, 126468. [Google Scholar] [CrossRef]
  29. Liang, J.; Zhang, J.; Cao, X. Grain sink strength may be related to the poor grain filling of indica-japonica rice (Oryza sativa) hybrids. Physiol. Plant. 2001, 112, 470–477. [Google Scholar] [CrossRef]
  30. Chen, X.; Chen, M.; Lin, G.; Yang, Y.; Yu, X.; Wu, Y.; Xiong, F. Structural development and physicochemical properties of starch in caryopsis of super rice with different types of panicle. BMC Plant Biol. 2019, 19, 482. [Google Scholar] [CrossRef]
  31. Weber, H.; Borisjuk, L.; Wobus, U. Molecular physiology of legume seed development. Annu. Rev. Plant Biol. 2005, 56, 253–279. [Google Scholar] [CrossRef] [PubMed]
  32. Li, T.; Heuvelink, E.; Marcelis, L.F. Quantifying the source-sink balance and carbohydrate content in three tomato cultivars. Front Plant Sci. 2015, 6, 416. [Google Scholar] [PubMed]
  33. Liu, E.; Zeng, S.; Zhu, S.; Liu, Y.; Wu, G.; Zhao, K.; Liu, X.; Liu, Q.; Dong, Z.; Dang, X.; et al. Favorable alleles of grain-filling rate1 increase the grain-filling rate and yield of rice. Plant Physiol. 2019, 181, 1207–1222. [Google Scholar] [CrossRef] [PubMed]
  34. Hu, L.; Tu, B.; Yang, W.; Yuan, H.; Li, J.; Guo, L.; Zheng, L.; Chen, W.; Zhu, X.; Wang, Y.; et al. Mitochondria-associated pyruvate kinase complexes regulate grain filling in rice. Plant Physiol. 2020, 183, 1073–1087. [Google Scholar] [CrossRef]
  35. Zhang, G.; Sakai, H.; Tokida, T.; Usui, Y.; Zhu, C.; Nakamura, H.; Yoshimoto, M.; Fukuoka, M.; Kobayashi, K.; Hasegawa, T. The effects of free-air CO₂ enrichment (FACE) on carbon and nitrogen accumulation in grains of rice (Oryza sativa L.). J. Exp. Bot. 2013, 64, 3179–3188. [Google Scholar] [CrossRef]
  36. Zhang, G.; Sakai, H.; Usui, Y.; Tokida, T.; Nakamura, H.; Zhu, C.; Fukuoka, M.; Kobayashi, K.; Hasegawa, T. Grain growth of different rice cultivars under elevated CO2 concentrations affects yield and quality. Field Crops Res. 2015, 179, 72–80. [Google Scholar] [CrossRef]
  37. Chen, T.; Zhao, Y.; Zhang, W.; Yang, S.; Ye, Z.; Zhang, G. Variation of the light stable isotopes in the superior and inferior grains of rice (Oryza sativa L.) with different geographical origins. Food Chem. 2016, 209, 95–98. [Google Scholar] [CrossRef]
  38. Zhang, G. Elevated CO2 and positional variation in cereal grains. Crop Sci. 2021, 61, 3859–3860. [Google Scholar] [CrossRef]
  39. Ren, D.; Li, Y.; He, G.; Qian, Q. Multifloret spikelet improves rice yield. New Phytol. 2020, 225, 2301–2306. [Google Scholar] [CrossRef]
  40. Kim, D.M.; Lee, H.S.; Kwon, S.J.; Fabreag, M.E.; Kang, J.W.; Yun, Y.T.; Chung, C.T.; Ahn, S.N. High-density mapping of quantitative trait loci for grain-weight and spikelet number in rice. Rice 2014, 7, 14. [Google Scholar] [CrossRef]
  41. Ding, C.; You, J.; Chen, L.; Wang, S.; Ding, Y. Nitrogen fertilizer increases spikelet number per panicle by enhancing cytokinin synthesis in rice. Plant Cell Rep. 2014, 33, 363–371. [Google Scholar] [CrossRef]
  42. Chaiwong, N.; Rerkasem, B.; Pusadee, T.; Prom-U-Thai, C. Silicon application improves caryopsis development and yield in rice. J. Sci. Food Agric. 2021, 101, 220–228. [Google Scholar] [CrossRef]
Figure 1. Grain nitrogen concentration (GN, %) in rice cultivars. The mean (circle) and 95% confidence interval (short horizontal lines connected with a vertical line) are shown for comparison between EDU and control treatments.
Agronomy 12 01988 g001
Figure 2. Grain nitrogen plotted against grain weight and grain number. GN, GW, SD, and EDU stand for grain nitrogen concentration, grain weight, spikelet density (grain number), and ethylenediurea application. GN and GW under control (a) and EDU (c) treatment across three types of rice cultivars, and separated by the hybrid and inbred cultivars under control (e) and EDU (g). GN and SD under control (b) and EDU (d) treatment across three types of rice cultivars, and separated by the hybrid and inbred cultivars under control (f) and EDU (h). Solid and dashed lines indicate simple linear regressions.
Agronomy 12 01988 g002
Figure 3. Grain nitrogen (GN) plotted against aboveground biomass, sink capacity, and source/sink ratio. Sink capacity is the result of grain number and grain weight, harvest index is the ratio of grain yield to aboveground biomass. GN and aboveground biomass under control and ethylenediurea treatment across three types of rice cultivars (a), and separated by the hybrid (b), inbred (c), and japonica cultivars (d). GN and sink capacity under control and ethylenediurea treatment across three types of rice cultivars (e), and separated by the hybrid (f), inbred (g), and japonica cultivars (h). GN and source/sink ratio under control and ethylenediurea treatment across three types of rice cultivars (i), and separated by the hybrid (j), inbred (k), and japonica cultivars (l). Solid and dashed lines indicate simple linear regressions.
Agronomy 12 01988 g003
Figure 4. Grain nitrogen (GN) plotted against AOT40 at different growth stages ((a), transplanting to flowering; (d), flowering to maturity; (g), transplanting to maturity) in rice cultivars and separate sensitivities for hybrid (b,e,h) and inbred cultivars (c,f,i). Solid and dashed lines indicate simple linear regressions between GN and AOT40.
Agronomy 12 01988 g004
Figure 5. Nitrogen (a) and carbon (b) yield in the control and ethylenediurea (EDU) plots, among 21 rice cultivars. The mean (circle) and 95% confidence interval (short horizontal lines connected with a vertical line) are shown for comparison between EDU and control treatments.
Agronomy 12 01988 g005
Table 1. 21 rice cultivars investigated in this study.
AbbreviationFull NameType
GHHGuihua Huangjaponica
GHQGuihua Qiujaponica
HD5HHuaidao 5 Haojaponica
HKZHuangke Zaojaponica
JNFJinnan Fengjaponica
HGXHuanggua Xianindica
NJ11Nanjing 11indica
NJ1HNanjing 1 Haoindica
TZXTaizhong Xianindica
YD2HYangdao 2 Haoindica
YD6HYangdao 6 Haoindica
YTXYintiao Xianindica
ZZAZhenzhu Aiindica
KLY10HKeliangyou 10 Haotwo-line indica hybrid
LY688Liangyou 688two-line indica hybrid
SY63Shanyou 63three-line indica hybrid
XLY143Xiangliangyou 143two-line indica hybrid
YLY1998Yliangyou 1998two-line indica hybrid
YLY900Yliangyou 900two-line indica hybrid
YLY975Yliangyou 957two-line indica hybrid
YY2640Yongyou 2640three-line indica-japonica hybrid
Table 2. ANOVA results for the grain nitrogen, grain carbon, grain protein, nitrogen yield, carbon yield and protein yield in three types of rice cultivars: hybrid, indica and japonica.
Grain NitrogenGrain CarbonGrain ProteinNitrogen YieldCarbon YieldProtein Yield
Variablep values
Treatment0.00280.65640.0093<0.0001<0.0001<0.0001
Type<0.00010.82230.05530.00030.00030.0003
Cultivar<0.00010.8572<0.0001<0.0001<0.0001<0.0001
Treatment × Type0.09480.14280.99240.35850.46420.3585
Least square means by treatment
Treatment%%gg m−2g m−2g m−2
Control1.6542.991.8210.81282.9064.32
EDU1.5943.011.9112.74339.2575.83
EDU effect (%)−3.810.064.9017.8919.9217.89
Least square means by rice type
Type%%gg m−2g m−2g m−2
hybrid1.5643.021.9215.52427.3692.36
indica1.8242.981.9312.85310.0476.45
japonica1.5343.001.766.96195.8241.41
p values less than 0.05 are shown in bold.
Table 3. Correlation of grain nitrogen with grain carbon concentration (GC), panicle density(PD), spikelet number per panicle(SPP), spikelet density (SD), percentage of ripened spikelet (RS), grain weight (GW), grain yield (GY), and sink capacity (SC).
Correlation RGCPDSPPSDRSGWGYSC
Control3 types0.02780.5285 *0.16650.5183 *−0.6641 **−0.6068 *−0.26630.0743
hybrid0.53120.3303−0.3083−0.0333−0.5221−0.2005−0.2948−0.1624
inbred0.00820.43050.6266 *0.7247 **−0.5807 *−0.6097 *0.09520.4586
EDU3 types0.10820.4877 *0.25510.5721 **−0.6725 ***−0.5422 *−0.10900.3220
hybrid0.52300.4840−0.4065−0.07330.26990.7339 *0.49570.4217
Inbred−0.03790.40720.6995 **0.6738 *−0.7037 **−0.6109 *0.11040.4938
The correlations are estimated by Row-wise. *, p < 0.05; **, p < 0.01; ***, p < 0.001.
Publisher’s Note: MDPI stays neutral with regard to jurisdictional claims in published maps and institutional affiliations.

