Abstract
Suitability evaluation of tea cultivation is very important for improving the yield and quality of tea, which can avoid blind expansion and achieve sustainable development; however, to date, relevant research at town and village scales is lacking. This study selected Xinming Township in Huangshan City, Anhui Province, as the study area, which is the main production area of Taiping Houkui Tea—one of the ten most famous teas in China. We proposed a machine learning-based tea cultivation suitability evaluation model by comparing logistic regression (LR), extreme gradient boosting (XGBoost), adaptive boosting (AdaBoost), gradient boosting decision tree (GBDT), random forest (RF), Gaussian Naïve Bayes (GNB), and multilayer perceptron (MLP) to calculate the weight accuracy of the evaluation factors. We then selected 12 factors, including climate, soil, terrain, and ecological economy factors, using the RF with the highest accuracy to calculate the evaluation factor weights and obtained the suitability evaluation results. The results show that the highly suitable area, moderately suitable area, generally suitable area, and unsuitable area land categories for tea cultivation were 14.13%, 27.25%, 32.46%, and 26.16%, respectively. Combined with field research, the highly suitable areas were mainly distributed in northwest Xinming Town, which is in line with the distribution of tea cultivation at the Xinming township level. The results provide a scientific reference to support land allocation decisions for tea cultivation and sustainable green agricultural development at the town and village scales.
1. Introduction
Tea is a woody plant belonging to the angiosperm family of vegetation classification system []. External morphology is influenced by external environmental conditions and various branching habits, which result in plant forms bearing different types of tea leaves. China is the home of tea. China’s tea production increased from 0.68 million tons in 2000 to 2.93 million tons in 2020. Although consumption of tea was somewhat affected by the COVID-19 pandemic in 2020, the market value of tea remains high, as much as 2.038 billion dollars []. Tea is an integral part of the lives of Chinese people, especially in the Anhui, Yunnan, Guizhou, Sichuan, Zhejiang, Hubei, and Fujian provinces []. Tea has become one of the main cash crops in these regions and a leading industry in some of the villages and towns in these regions. The quality and yield of tea depends on a number of characteristics of the cultivation area, thus constraining the further development of the tea industry [,]. Therefore, it is necessary to explore tea cultivation suitability to address the challenge of tea yield reduction and low quality caused by the lack of scientific or reasonable planning in the early stages of tea plantation construction, as well as to avoid increasing fertilizer, pesticides and other agricultural chemical applications, which mitigate agricultural source pollution []. Additionally, tea cultivation suitability research can provide information regarding the constraints of land use for tea, which is important for the high quality and high yield of tea, the development of the tea industry, and the efficient use of agricultural land resources.
In recent years, several relevant studies have been conducted on the suitability evaluation of crops, such as tea. These studies are mainly divided into evaluation factors, evaluation methods, and evaluation scales. The evaluation factors are mainly classified into natural environmental factors and anthropogenic factors []. Natural environmental factors include climate, soil, and topography. Further, average temperature, maximum temperature, minimum temperature, accumulated temperature, evaporation, relative humidity, precipitation, sunshine duration, and wind speed are the characteristics of climate factors [,,]. Soil characteristics include soil pH, available phosphorus, available potassium, ammonium, and nitrate [,,]. The topography characteristics are mainly slope, aspect, altitude, and elevation, among others [,]. Hence, natural factors are essential for the evaluation of crop cultivation suitability. Anthropogenic factors mainly involve distance from roads and rivers, transportation costs, drainage, population density, and per capita GDP [,,]; some evaluation models mainly reflect the impact of anthropogenic activities on the cultivation of crops, such as tea, and the labor cost in the process of tea cultivation. Existing research has begun to combine natural and anthropogenic factors to carry out a comprehensive evaluation that provides a more scientific theoretical basis for tea production decisions.
The evaluation methodologies can be divided into subjective weighting methods, objective weighting methods, and subjective–objective weighting methods. Subjective weighting is the earliest method based on the importance of decision makers in assigning different weights to the evaluation factors. Although this method is simple and widely used, it has many limitations in its application because of its subjective and arbitrary nature, including the analytic hierarchy process [], fuzzy analysis [], and expert scoring method [], among others. Objective weighting uses the relationship between the evaluation factors and the interaction between the results and evaluation factors to determine the weight, wherein mathematical theory is strong, but its universality is poor, and the calculation is cumbersome; these include the entropy method [] and principal component analysis [], among others. With the development of information technology, machine learning theory and methods have been introduced into suitability evaluation systems, such as artificial neural network (ANN) [], maximum entropy model (MaxEnt) [], Bayesian [], random forest (RF) [], regression model [], and deep learning [], with a collinear relationship between evaluation factors. Some machine learning methods also have overfitting and weak interpretability to prevent the implicit superposition of weights in the process of factor weighting; these include the analytic hierarchy process and gray correlation [], fuzzy mathematics [], genetic algorithm [], and other methods. These methods achieved good results.
At the evaluation scale, the existing crop suitability evaluation system for tea and other crops is mostly aimed at the national, provincial, municipal, and county macroscale. Most tea suitability evaluations are based on multi-standard evaluations of China, India, Kenya, and Sri Lanka—the four major tea-producing countries [,,]. Some studies have focused on tea production areas in different provinces, such as Lahijan in Iran [], Yingde in Guangdong, Zhejiang and Yunnan Province in China [,,]. However, it is difficult to obtain evaluation data on a macro scale. The number of selected factors is not comprehensive, and the accuracy of the natural factor sampling points is poor; therefore, the evaluation results cannot be accurate for specific areas. In recent times, studies have been conducted on suitability evaluations of tea and other crops in cities and counties as the research areas, such as the Yuyao and Shangnan Counties or the Shaanxi Province [,]. Compared with large scales such as national and municipal scales, town and village scales could reveal detailed characteristics of the spatial distribution of tea.
As the demand for tea continues to grow both in China and internationally, the area under cultivation and the total yield of tea are expected to increase accordingly. However, given that the total area of suitable land is limited, it is of the utmost importance to develop a plan for further development of the tea sector in important tea-producing regions. In this study, we considered Xinming Township, Huangshan City, Anhui Province as the study area, which is also one of the ten major green tea-producing areas in China. We selected natural and anthropogenic factors as evaluation factors and combined the following seven machine learning methods: logistic regression (LR), extreme gradient boosting (XGBoost), adaptive boosting (AdaBoost), gradient boosted decision tree (GBDT), random forest (RF), Gaussian Naive Bayes (GNB), and multilayer perceptron (MLP). Machine learning has been used for some time in crop suitability evaluation models. Notable examples are the work of Sarkar et al. [] in which AHP and machine learning were combined to evaluate suitability for rice planting, and the study of cassava and sweet potato by Raji et al. []. In addition, machine learning has been widely used in tea quality assessment [,,,] and tea leaf disease prediction and variety determination [,]. However, no reports have yet been published regarding machine learning methods applied to the study of suitability of tea cultivation at the scale of town and village. The focus of our study was two-fold: (1) optimization of machine learning for the evaluation of tea cultivation suitability, and (2) quantitative analysis of the factors affecting the suitability of tea tree growth. This is the first study to compare the weighting accuracy of different machine learning methods in suitability evaluation systems at town and village scales.
2. Background
In this section, we provide descriptions of research area, tea cultivation suitability evaluation, and data.
2.1. Research Area
The land area of Xinming Township, selected as the study area (Figure 1), is located in the northeast of Huangshan City, Anhui Province, with a central position of 30° 29′ north latitude and 118° 25′ east longitude, mainly comprising mountainous and hilly landforms, with a total area of 139.03 km2. The city is the main production area of green tea in China and the core production area of Taiping Houkui tea—one of the ten most famous teas. Its planting area is mainly distributed in the Fenghuangshan, Shitongshan, Jigongshan, and Jigongjian areas of the three natural villages of Houkeng (Figure 2), Hougang, and Yanjia in Sanhe Village of Xinming Township—known as the “Hometown of Taiping Houkui Tea”.
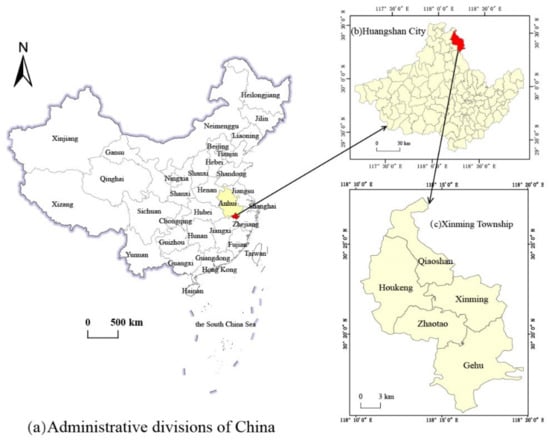
Figure 1.
Xinming Township geographic location map.
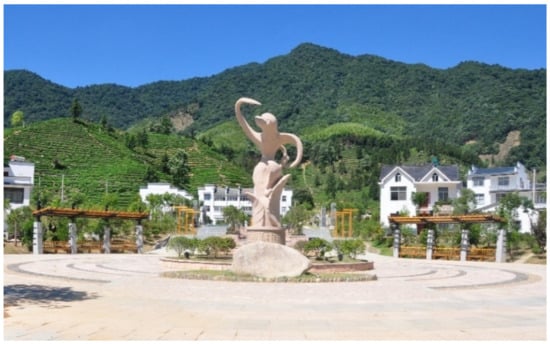
Figure 2.
Houkeng Village landscape.
2.2. Tea Cultivation Suitability Evaluation
Tea cultivation suitability evaluation is often referred to as one of the multi-criteria evaluations of crop cultivation, which analyzes the suitability of regional planting by selecting influencing factors and calculating factor weights in accordance with the needs of tea growth. The suitability evaluation of tea cultivation is beneficial to the scientific planning of tea plantations and the sustainable development of the tea industry []. Meanwhile, in the fields of wheat, rice, coffee, and other crops, the cultivation suitability is commonly used [,]. However, the analytic hierarchy process is mostly used in the conventional planting suitability evaluation model, which has subjective factors interfering. Therefore, researchers have increased the objectivity of evaluation results by using objective evaluation techniques such as machine learning. As a result, the present suitability evaluation can be broadly divided into three types based on the methodologies now in use: subjective evaluation methods, objective evaluation methods, and subjective and objective evaluation methods combined.
2.3. Data
The Digital Elevation Model (DEM) used in this study was obtained from the Geospatial Data Cloud System of the Computer Network Information Center of the Chinese Academy of Sciences. Available online: http://www.gscloud.cn (accessed on 15 October 2020). And we use a GDEMDEM 30 m resolution to analyze slope and aspect. Meteorological data sources were combined with those of the Meteorological Bureau of Huangshan City. As there is no weather station in Xinxiang City, we used weather station data for the surrounding towns, from 2015 to 2019, and current data from the main production area of Taiping Houkui in Xinming Township. Soil data were obtained from field surveys, with a total of 32 soil points sampled. The data were processed for analysis using kriging interpolation in ArcGIS 10.2. The DEM data were analyzed for the slope and slope directions. Meanwhile, climate, soil pH, and soil organic matter data were obtained from field surveys to obtain sample point data, which were converted into raster data through spatial interpolation. The roles of different influencing factors in the tea cultivation process are shown in Table 1.

Table 1.
Factors affecting tea growth.
3. Methods
3.1. Machine Learning
Machine learning was proposed by Tom Mitchell in 1977 [], and involved building an algorithmic model by teaching computers how to make predictions using data and formulas []. In recent years, machine learning has advanced quickly and has found extensive use in numerous industries. According to the various training samples and feedback techniques, machine learning is classified into four main types, including supervised learning, unsupervised learning, semi-supervised learning, and reinforcement learning []. We have included a list of machine learning and other computational acronyms (Table 2) to improve the readability of the article.
Table 2.
The relevant acronyms in this study.
3.1.1. Logistic Regression (LR)
LR is one of the most commonly used prediction models. It is used to describe the multiple regression relationship between one result variable and one or more explanatory variables and can better solve the interdependence between variables [,]. The basic principle is to convert variables into binary data and to construct a categorical probability model for categorical data, which is used to predict the probability of events occurring in a region. In addition, during the modeling process, the explanatory variables can be screened using logistic regression to eliminate those that do not contribute or contribute less to the outcome variable.
3.1.2. Random Forest (RF)
RF is a combination of bagging and random subspaces proposed by Leo Breiman in 2001 []. This is a machine learning method based on the principle of classification and regression analysis using a large number of single-unit classification trees []. The decision tree is constructed by randomly selecting K samples in a given training set with a release, and a random selection of a predictor variable in the sample set is needed to split the “tree” into nodes. The predictor variables are closely related to the nodes of the tree; both achieve randomness in the rows and columns of the sample, and multiple decision trees are combined by voting or averaging to produce the predicted outcome.
3.1.3. Extreme Gradient Boosting (XGBoost)
Also known as the extreme gradient boosting algorithm, the XGBoost algorithm is a machine learning algorithm based on gradient boosting []. Its basic principle is to form a strong classifier by iterative calculation of each weak classifier and optimize the entire objective function in steps, which can effectively build an enhanced decision tree, reduce the error, and have the characteristics of high efficiency and accuracy compared with other machine learning methods.
3.1.4. Adaptive Boosting (AdaBoost)
The principle of the AdaBoost algorithm is similar to that of the XGBoost algorithm, which is a boosting algorithm that obtains classification results through iterative computation of weak classifiers. AdaBoost is mainly used to solve online assignment problems, and is an algorithm based on the idea of weighted voting. At the beginning of the computation, all classifiers have equal weights; the weights are reassigned after checking their performance. In case of incorrect classification, the weaker classifier is assigned a higher weight [].
3.1.5. Gradient Boosting Decision Tree (GBDT)
GBDT is an algorithm proposed by Friedman in 2002 [], which is similar to RF and consists of several small decision trees. However, they differ in the decision tree construction process. In GBDT, decision tree needs to subtract the residuals of the previous decision tree to obtain a new value until all trees are computed or the residuals are sufficiently small. The core is to consider the sum of the residuals computed from all decision trees as the final result [].
3.1.6. Gaussian Naïve Bayes (GNB)
GNB is a common probabilistic statistical classification method with a simple, efficient, and high-accuracy algorithm that is widely used in various fields []. It is based on the Bayesian theory and assigns specific weights to each class given in the training data with the desired feature condition.
3.1.7. Multi-Layer Perceptron (MLP)
MLP is a type of forward network. In general, it consists of input, hidden, and output layers, where the number of hidden layers can be one or more without any limitation, and the layers are connected. The output layer only transmits data to the hidden layer according to different weight values, where the data is processed nonlinearly, and the output layer finally outputs the result [].
3.2. Evaluation Factor
Based on existing research [,], natural and anthropogenic factors comprising 12 criteria, namely, average temperature, relative humidity, elevation, slope, slope direction, pH value, organic matter, nitrogen content, phosphorus content, potassium content, distance from roads, and distance from rivers, are considered to determine suitable land for tea cultivation, according to circumstances.
3.3. Tea Cultivation Suitability Evaluation Model
The technical routes used in this study are illustrated in Figure 3. It can be summarized as the selection and pretreatment of four evaluation factors, selection of evaluation methods, calculation of evaluation factor weight, and suitability evaluation [,,]. By comparing seven machine learning methods—LR, XGBoost, AdaBoost, GBDT, RF, GNB, and MLP—which were selected to calculate the weights of the evaluation factors, we were able to compare the prediction accuracy by AUC values. Finally, we selected the method with the highest accuracy—the random forest method—to calculate the factor weights. GIS software was used to spatially interpolate and reclassify index factors to achieve spatial processing. A superposition analysis was performed according to the weights of each evaluation factor, and the calculated results were classified for suitability. The results were classified into four classes according to the Food and Agriculture Organization of the United Nations (FAO) criteria: high suitability, medium suitability, general suitability, and unsuitable areas []. Additionally, the suitability distribution of Taiping Houkui Tea in Xinxiang City was mapped.
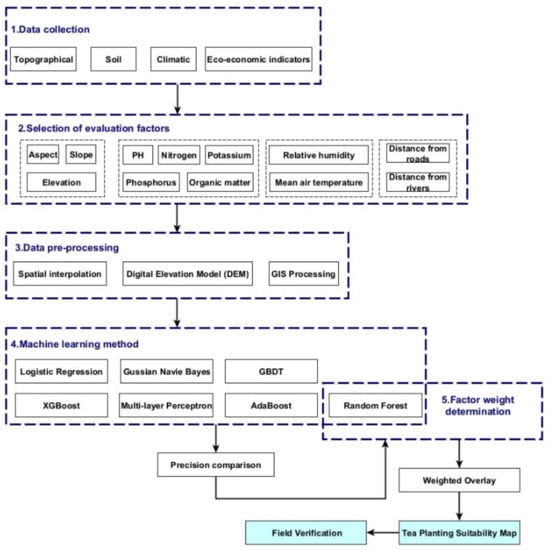
Figure 3.
Technical roadmap of tea cultivation suitability evaluation in Xinming Township.
4. Results
4.1. Evaluation Unit Factor
We used the ordinary kriging method in geostatistical analysis to interpolate the selected evaluation factors, which are widely used in crop suitability evaluation, visualization of soil nutrients, heavy metals, and meteorological spatial variation [,]. The processed data was reclassified to complete the data preprocessing. The results of the processing are shown in Figure 4a–l, with spatially interpolated evaluation factors.
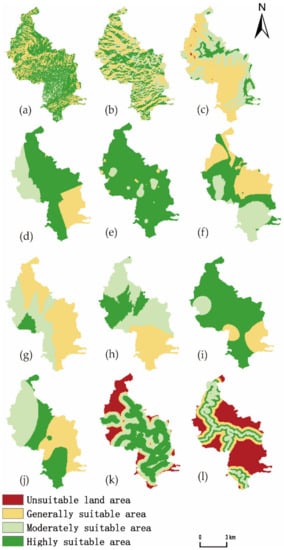
Figure 4.
Reclassification of criteria: (a) Slope, (b) Aspect, (c) Elevation, (d) Organic matter, (e) Soil pH, (f) Nitrogen, (g) Phosphorus, (h) Potassium, (i) Average temperature, (j) Relative humidity, (k) Distance from roads, and (l) Distance from rivers.
The spatial distribution of the evaluation factors selected in this study revealed that the suitable areas were mostly concentrated in the central region, which is located at the intersection of the three villages and towns of Monkey Hang Village, Qiaoshan Village, and Xinming Village. Among them, the most suitable tea growing area, considering pH as the highest factor of importance, was found to be mainly distributed in the western part of Monkey Hang and the Zhaotao Village, the northern part of Gehu Village, and the northern part of Qiaoshan Village. With average temperature as an important factor, less suitable areas were mainly concentrated in the eastern and western part of the Gehu Village, while other villages and towns were found to be more suitable for the growth of tea trees. The most suitable tea growing area according to relative humidity factor was mainly distributed in the Gehu Village and the southern part of Monkey Hang. The content of fast-acting potassium in the soil of Xinming Township was in line with the growth of tea trees. The most suitable area according to nitrogen content was the south of Monkey Hang and the north of Zhaotao Village. The suitable area based on slope showed irregular space distribution and was distributed in all villages. The suitable area based on altitude was mainly distributed in the south of Qiaoshan Village and the east of Gehu Village, though the altitude also showed irregular distribution in terms of space. The weights of the other evaluation factors were not greater than 0.3, and therefore had less influence on the results of tea growth.
4.2. Comparison of Machine Learning Methods
Comprehensive evaluation experiments were conducted using seven machine learning methods. To compare the final results, receiver operating characteristic (ROC) curves were used to test the accuracy of the prediction models. The ROC curve is a common model validation method in applicability evaluation systems that are not subject to critical constraints. In addition, the specificity and sensitivity were calculated by continuously changing the judgment threshold. The area enclosed by the ROC curve and marker line is called the area under the curve (AUC) value. The higher the AUC value, the higher the accuracy of the model []. The AUC values calculated in this study are shown in Figure 5. For LR, RF, XGBoost, AdaBoost, GBDT, GNB, and MLP, the calculated AUC values are 0.618, 0.86, 0.819, 0.731, 0.853, 0.566, and 0.539, respectively. From the perspective of evaluation accuracy, the highest AUC value was calculated by the RF method, indicating its feasible application in the evaluation system of tea cultivation suitability, with better calculation accuracy. Therefore, this method was used in this study to calculate the weights of evaluation factors.
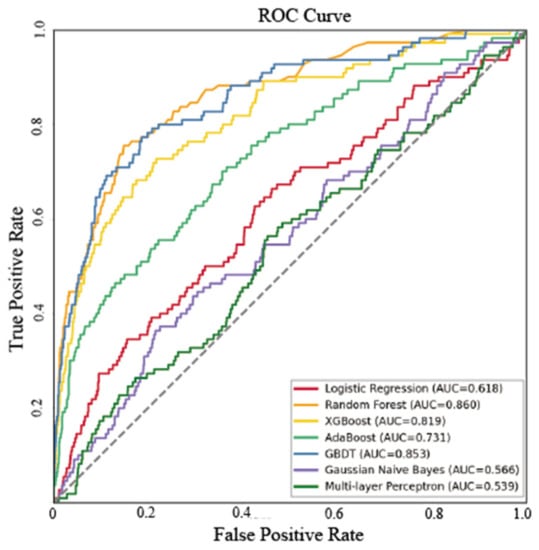
Figure 5.
ROC curve comparison.
4.3. Factor Weight Calculation
The idea of evaluating the importance of evaluation factors in RF is based on the average contribution of each evaluation factor to each tree in RF. There are generally two methods to measure the contribution: the Gini index or the OOB error rate. In this study, the Gini index was used as the evaluation standard to measure contribution [], and the calculation formula is as follows:
where is the Gini index, n is the category, m is the node, and pnm is the proportion of n in m. Using this formula, two features randomly extracted from node m were assigned different probabilities.
The importance of feature in node m is denoted by , and its Gini index before and after node m is inconsistent. Therefore, the change in the Gini index of in node m is (GIa1 is the Gini index before the node, and GIa2 is the Gini index after the node). Finally, the importance of the evaluation factor was normalized [], and the equation is as follows:
Each evaluation factor was substituted into formulas (1) and (2) to calculate the weights of each evaluation factor (Table 3). Referring to studies of Chen [], Das [], and other researchers [], and combining these results with the data in the present study, we classified the factors into different levels (Table 3). The largest weight value of 0.132 is accounted for by pH, followed by average temperature and relative humidity. And the factor weight value of community economic indicators is the smallest. Meanwhile, we classified the obtained evaluation factors into four classes: highly suitable area (S1), moderately suitable area (S2), general suitable area (S3), and unsuitable land area (N).
Table 3.
Weight and analytic hierarchy results of tea suitability evaluation factors in Xinming Township.
4.4. Suitability Evaluation Results
We used GIS-related software to spatially interpolate and reclassify the index factors. After applying the most accurate random forest to determine the weights of each factor, we then carried out the spatial analysis module via ArcGIS software to superimpose different factors according to the corresponding weights []. The equation is as follows:
where Pi is the evaluation factor value, Wi is the weight of each evaluation factor, i = 1, 2, 3… n. Based on international FAO standards, we used the natural breakpoint method to group the final results into four different classes of land: highly suitable, moderately suitable, generally suitable, and unsuitable.
A distribution map of the tea suitability evaluation was obtained in this study by calculation, as shown in Figure 6. The highly suitable area, which is also the area with the most favorable natural geographical conditions for the growth and development of tea crops, accounted for 14.13% of the total evaluated area. It was distributed in the southern and a small northern part of the Houkeng Village and Qiaoshan Village, the northern part of the Xinming Village, and the eastern part of the Gehu Village. The Ma Chuan River flows through the area and provides sufficient water for the growth of tea trees. Geological disasters were unlikely to occur, and the natural environment was relatively stable. Thus, tea plantations in the area were of high yield and good quality. These areas can be treated as a key tea ecological reserve and the preferred area for future tea industry expansion.
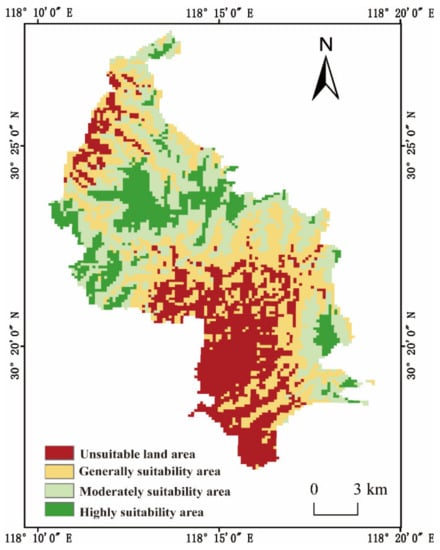
Figure 6.
Tea growth suitability distribution.
The moderately suitable area covered 27.25% of the total area of Xinming Town and was adjacent to the highly suitable area. Both of these areas had roughly the same overall distribution. Generally, the natural environment was more suitable for the growth and development of tea trees—with good yield and quality of tea plantations—and therefore can be used as a tea development area.
The generally suitable area accounted for 32.46% of the total area. It was mainly concentrated in the northern part of Houkeng Village, the southern part of Xinming Village and Gehu Village, and the northern and eastern parts of Zhaotao Village. The topography, soil, and other conditions in the area met the growing needs of tea trees, but the tea yield was low, and the quality was average, and therefore not suitable for the large-scale development of the tea industry.
The unsuitable land area accounted for 26.16% of the total evaluation area. It was widely distributed in the villages of Gehu and Zhao Tao, along with a small part located in the northern part of the Houkeng and Qiaoshan villages. The terrain was steep and soil fertility decreased due to serious soil erosion during the summer rainy season, which makes it unfavorable for the growth of tea.
5. Discussion
5.1. Discussion on Evaluation Factors and Suitability Areas
In the existing evaluation of tea suitability, most studies have focused on the influence of individual elements on tea growth, such as climatic and soil factors [,,,]. Among them, temperature and precipitation as climatic factors [,], and DEM and slope as soil factors exhibit significant effects on the quality and yield of tea []. Owing to the difference in the scale of the study, our findings revealed that the pH value in the soil had the greatest effect on the tea growth, which is consistent with the findings of a previous study []. In addition, the weight value of climatic factors chosen in this study was second only to pH, which is consistent with observations of previous studies. This may be due to the small scale of the study area and the small overall differences in climate and topography; therefore, the soil factor had more influence on tea growth than did the climate and topography factors.
We counted 385 tea gardens in Xinxiang, covering a total area of 667.2922 hm2. Among them, seven tea gardens had an area of more than 10 hm2, and the largest tea garden was located in the moderate and general suitability areas of Houkeng village. The suitability evaluation results of this study were compared with the actual distribution of the tea gardens (Figure 7). The maximum number and area of tea plantations was in the general suitability area. The number of tea gardens accounted for 25.71% and the area of tea gardens accounted for 21.81% of the total statistics, while 19.22% of the tea gardens were partially located in the general suitability area. The second was the number of tea gardens in unsuitable areas, of which 88 tea gardens had more than 19.61% of their total area, and 35 tea gardens were partially in unsuitable areas. Additionally, 74 tea gardens were located in moderately suitable areas, 32 in highly suitable areas, and 18 in highly and moderately suitable areas.
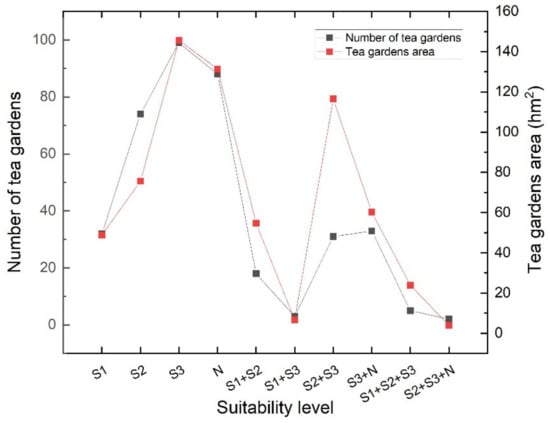
Figure 7.
Distribution diagram of suitability evaluation results of existing tea gardens, where S1, S2, S3, and N represent highly suitable area, moderately suitable area, generally suitable area, and unsuitable land area, respectively. Variables are explained in Section 4.3.
According to the statistical results and Figure 8, most of the tea gardens in the Xinming Village are small-scale cultivations, with more than 94% of the tea gardens being less than 5 hm2. The larger areas were mainly located in Qiaoshan and Houkeng Villages. Combined with field research in some evaluation areas, the distribution areas of high-quality tea gardens in the Xinming Township (Houkeng and Longwangshan) were found to be consistent with the predicted results of this study. Houkeng and Longwangshan villages were the main distribution areas of high and moderate suitability areas, and Longwangshan in Houkeng Village and the Qiaoshan Village were the main producing areas of high-quality Taiping Houkui tea, which has the largest tea industry base in the Xinming Township, indicating that the method used in this study is scientific. However, existing tea gardens have high distribution in the Gehu Village, which was different from the calculation results of this study. Some regional evaluation results of the Gehu Village showed that the area was unsuitable, and the quality and yield of tea planted in this area were lower than those in other areas. Therefore, the distribution of tea gardens should not be expanded in this area. The most suitable area for tea cultivation was at the junction of the Houkeng and Qiaoshan Villages and the Xinming Village. There are many suitable tea cultivation areas in this location that can be used as expansion areas for tea gardens in the future.
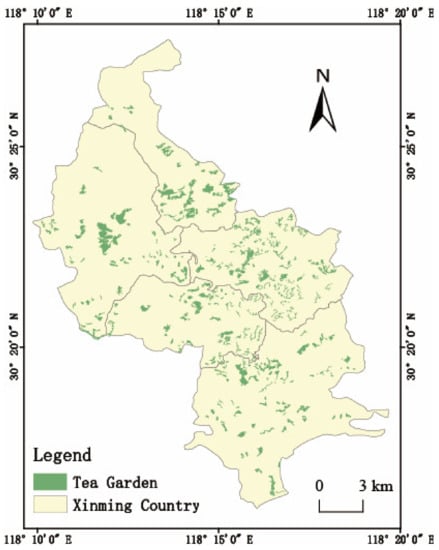
Figure 8.
Spatial distribution map of tea garden.
5.2. Performance Analysis of Evaluation Method
In this study, we compared the prediction accuracy of seven machine learning methods (LR, XGBoost, AdaBoost, GBDT, RF, GNB, and MLP) and selected the method with the highest accuracy to calculate weight of the evaluating factors. The AUC values were then used to evaluate the accuracy of the models. Generally, when the AUC is greater than 0.75, the model is considered to have good performance in the application []. The results showed that the accuracies of RF, XGBoost, and GBDT were all over 0.75, with RF having the highest accuracy of 0.86. The AUC values of LR, AdaBoost, GNB, and MLP were all less than 0.75. The AUC values of GNB and MLP were less than 0.6, and therefore these two methods were not selected in this study because of their poor granularity. However, this does not mean that GNB and MLP are not appropriate for suitability evaluation systems. Different research fields and research objects can affect the accuracy of model prediction [].
In general, machine learning methods have been introduced for crop suitability evaluation, which requires constant adjustment of parameters to avoid overfitting. The evaluation results of different scales and regions may have problems, such as the localization of evaluation factors. However, machine learning methods are characterized by weak interpretability, which can be continuously improved by subsequent research. For example, when using machine learning methods to calculate weights, previous studies have explored the optimal evaluation factors by different factor combinations [], and increased the knowledge and rules in the model to improve the interpretability by combining qualitative and quantitative methods [].
5.3. Tea Cultivation Suitability Evaluation
The evaluation of tea cultivation suitability is of great importance for the planning of tea plantations and future development of the tea industry in China. To evaluate tea cultivation suitability, we selected the method with the highest accuracy—the random forest method—to calculate the factor weights and compare different machine learning methods. We then applied the FAO land suitability grading criteria to group our results into four grades, which roughly mimic the actual distribution of tea plantations in Xinming Township.
5.4. Study Limitations
Owing to some limitations of the study, our findings may not be fully representative of tea growing areas. The study area was relatively small; as expected, the effects of climate and socioeconomic variables were also small. It is worth noting that—although we used machine learning methods to reduce the interference of subjective factors—there were still differences between the calculated results and the actual situation []. In addition, the growth of tea trees is also affected by pests and diseases, vegetation indices, and socio-economic and national policies. However, owing to limitations of the data, not all the suitable areas for tea growth in this study can be expected to produce better quality tea or confer greater economic benefits. The models we use have some limitations in terms of applicability. The most suitable machine learning method may depend on the type of data available. Notwithstanding these limitations, the model is a valuable tool for planning future tea cultivation areas.
6. Conclusions
In this study, we aimed to compare tea suitability maps produced by machine learning models at village and township scales. Specifically, we considered Taiping monkey tea as the research object and selected twelve influencing factors from the natural environment and anthropogenic factors. We then compared seven machine learning methods and selected the method with the highest accuracy for quantitative evaluation of suitability. This study can also provide scientific reference for land allocation decisions for various crops in the town and village scales, such as coffee, rice, and wheat. The evaluation results can be summarized as follows:
- (1)
- By comparing the prediction accuracy of the seven machine learning methods, the final results showed that RF had the highest accuracy, with a predicted AUC value of 0.86. This indicates that the machine learning methods have certain advantages in the suitability evaluation model, with high accuracy and good evaluation results, which can improve the objectivity of the model.
- (2)
- Xinming town “Taiping monkey” tea tree growth suitable area from north to south exhibited a gradually declining trend. Highly suitable areas (14.13%) and medium suitable areas (27.25%) were mainly concentrated in the north, west, and central, specifically distributed in Houkeng, Xinming, Sanmenxia, Longwang Mountain, among other areas. Generally, suitable areas were the most widely distributed, and the general and unsuitable areas were mostly adjacent to each other, accounting for 32.46% and 26.16%, respectively. However, it was mainly distributed in the southern and northwestern regions.
- (3)
- In the future, most of the areas in Houkeng and Qiaoshan villages can be considered for vigorously planting tea trees for suitable growth and be used as the first-choice area for the development of tea gardens to manufacture high-quality Taiping Houkui tea. Gehu Village tea plantations were not suitable for large-scale expansion because the yield and quality of tea planted in the area were not as good as in other areas.
Compared with the traditional weighting method, this study used the machine learning method, which weakens the bias caused by the subjective will to a certain extent; thus, it analyzes the influence of multiple factors on tea growth more objectively and scientifically. We will further improve the evaluation factors and methods, such as anthropogenic activities, tea tree pests, and diseases that affect tea tree growth and quality, in future studies. Meanwhile, improving the generalizability of the model is key to future research on land suitability evaluation of various crops. The evaluation methods can be further extended, such as use of deep learning, to combine subjective and objective evaluations from both qualitative and quantitative perspectives to inform scientific planning of crop planting.
Author Contributions
W.X. and C.Z. contributed equally to this article. Writing—original draft, Visualization, Writing—review & editing, W.X.; Methodology and Software, C.Z.; Data curation: X.C., W.W., J.H. and Y.T.; Funding acquisition, Supervision and Conceptualization, J.L.; Funding acquisition, Y.Z. All authors have read and agreed to the published version of the manuscript.
Funding
The National Key R & D Program of China (No. 2018YFD1100104), the Natural Science Foundation of Anhui Province (No. 2108085MD29), the National Natural Science Foundation of China (No. 41571400), the Offline Excellent Course of Anhui Province (No. 2021xxkc038).
Institutional Review Board Statement
Not applicable.
Informed Consent Statement
Not applicable.
Data Availability Statement
The data used to support the findings of this study area are available from the corresponding author upon request via email.
Conflicts of Interest
The authors declare that they have no known competing financial interests or personal relationships that could have appeared to influence the work reported in this paper.
References
- Ding, Y.S. Introduction to Chinese Tea Culture; Science Press: Beijing, China, 2018. [Google Scholar]
- Weng, W. An Overview of China’s Tea Market in 2020 and First Half of 2021. China Tea 2021, 43, 74–76. [Google Scholar]
- Jin, Z.F.; Ye, J.G.; Yang, Z.Q.; Sun, R.; Hu, B.; Li, R.Z. Climate suitability for tea growing in Zhejiang Province. Yingyong Shengtai Xuebao 2014, 25, 967–973. [Google Scholar] [PubMed]
- Owuor, P.O.; Wachira, F.N.; Ng’etich, W.K. Influence of region of production on relative clonal plain tea quality parameters in Kenya. Food Chem. 2010, 119, 1168–1174. [Google Scholar] [CrossRef]
- Jayasinghe, S.L.; Kumar, L. Potential Impact of the Current and Future Climate on the Yield, Quality, and Climate Suitability for Tea [Camellia sinensis (L.) O. Kuntze]: A Systematic Review. Agronomy 2021, 11, 619. [Google Scholar] [CrossRef]
- Qu, H.; Yin, Y.; Xing, W.; Wang, W.; Zhou, C.; Li, J. Spatial-temporal characteristics and driving factors of the chemical fertilizer supply/demand correlation network in China. Environ. Sci. Pollut. Res. Int. 2022, 29, 1–17. [Google Scholar] [CrossRef]
- Chen, P.; Li, C.; Chen, S.; Li, Z.; Zhang, H.; Zhao, C. Tea Cultivation Suitability Evaluation and Driving Force Analysis Based on AHP and Geodetector Results: A Case Study of Yingde in Guangdong, China. Remote Sens. 2022, 14, 2412. [Google Scholar] [CrossRef]
- Biggs, E.M.; Gupta, N.; Saikia, S.D.; Duncan, J.M.A. The tea landscape of Assam: Multi-stakeholder insights into sustainable livelihoods under a changing climate. Environ. Sci. Policy 2018, 82, 9–18. [Google Scholar] [CrossRef]
- Nowogrodzki, A. How climate change might affect tea. Nature 2019, 566, S10. [Google Scholar] [CrossRef]
- Jayasinghe, S.L.; Kumar, L. Climate Change May Imperil Tea Production in the Four Major Tea Producers According to Climate Prediction Models. Agronomy 2020, 10, 1536. [Google Scholar] [CrossRef]
- Ahamed, T.R.N.; Rao, K.G.; Murthy, J.S.R. GIS-based fuzzy membership model for crop-land suitability analysis. Agric. Syst. 2000, 63, 75–95. [Google Scholar] [CrossRef]
- Juhos, K.; Czigány, S.; Madarász, B.; Ladányi, M. Interpretation of soil quality indicators for land suitability assessment—A multivariate approach for Central European arable soils. Ecol. Indic. 2019, 99, 261–272. [Google Scholar] [CrossRef]
- Tang, S.; Pan, W.; Tang, R.; Ma, Q.; Zhou, J.; Zheng, N.; Wang, J.; Sun, T.; Wu, L. Effects of balanced and unbalanced fertilisation on tea quality, yield, and soil bacterial community. Appl. Soil Ecol. 2022, 175, 104442. [Google Scholar] [CrossRef]
- Pilevar, A.R.; Matinfar, H.R.; Sohrabi, A.; Sarmadian, F. Integrated fuzzy, AHP and GIS techniques for land suitability assessment in semi-arid regions for wheat and maize farming. Ecol. Indic. 2020, 110, 105887. [Google Scholar] [CrossRef]
- Jayasinghe, S.L.; Kumar, L.; Hasan, M.K. Relationship between Environmental Covariates and Ceylon Tea Cultivation in Sri Lanka. Agronomy 2020, 10, 476. [Google Scholar] [CrossRef]
- Das, A.C.; Noguchi, R.; Ahamed, T. Integrating an Expert System, GIS, and Satellite Remote Sensing to Evaluate Land Suitability for Sustainable Tea Production in Bangladesh. Remote Sens. 2020, 12, 4136. [Google Scholar] [CrossRef]
- Zhu, X.f.; Xiao, G.f.; Wang, S. Suitability evaluation of potential arable land in the Mediterranean region. J. Environ. Manag. 2022, 313, 115011. [Google Scholar] [CrossRef]
- Yang, S.; Wang, H.; Tong, J.; Bai, Y.; Alatalo, J.M.; Liu, G.; Fang, Z.; Zhang, F. Impacts of environment and human activity on grid-scale land cropping suitability and optimization of planting structure, measured based on the MaxEnt model. Sci. Total Environ. 2022, 836, 155356. [Google Scholar] [CrossRef]
- Tercan, E.; Dereli, M.A. Development of a land suitability model for citrus cultivation using GIS and multi-criteria assessment techniques in Antalya province of Turkey. Ecol. Indic. 2020, 117, 106549. [Google Scholar] [CrossRef]
- Malczewski, J. Ordered weighted averaging with fuzzy quantifiers: GIS-based multicriteria evaluation for land-use suitability analysis. Int. J. Appl. Earth Obs. Geoinf. 2006, 8, 270–277. [Google Scholar] [CrossRef]
- Yao, M.; Shao, D.; Lv, C.; An, R.; Gu, W.; Zhou, C. Evaluation of arable land suitability based on the suitability function—A case study of the Qinghai-Tibet Plateau. Sci. Total Environ. 2021, 787, 147414. [Google Scholar] [CrossRef]
- You, L.; Wood, S. Assessing the spatial distribution of crop areas using a cross-entropy method. Int. J. Appl. Earth Obs. Geoinf. 2005, 7, 310–323. [Google Scholar] [CrossRef]
- Kliskey, A.D. Recreation terrain suitability mapping: A spatially explicit methodology for determining recreation potential for resource use assessment. Landsc. Urban Plan. 2000, 52, 33–43. [Google Scholar] [CrossRef]
- Farnood Ahmadi, F.; Farsad Layegh, N. Integration of artificial neural network and geographical information system for intelligent assessment of land suitability for the cultivation of a selected crop. Neural Comput. Appl. 2015, 26, 1311–1320. [Google Scholar] [CrossRef]
- Xian, Y.; Liu, G.; Zhong, L. Will citrus geographical indications face different climate change challenges in China? J. Clean. Prod. 2022, 356, 131885. [Google Scholar] [CrossRef]
- Estrada, L.L.; Rasche, L.; Schneider, U.A. Modeling land suitability for Coffea arabica L. in Central America. Environ. Model. Softw. 2017, 95, 196–209. [Google Scholar] [CrossRef]
- Dharumarajan, S.; Kalaiselvi, B.; Lalitha, M.; Vasundhara, R.; Hegde, R. Defining fertility management units and land suitability analysis using digital soil mapping approach. Geocarto Int. 2021, 36, 1–21. [Google Scholar] [CrossRef]
- Park, S.; Jeon, S.; Kim, S.; Choi, C. Prediction and comparison of urban growth by land suitability index mapping using GIS and RS in South Korea. Landsc. Urban Plan. 2011, 99, 104–114. [Google Scholar] [CrossRef]
- Hu, Z.; Hu, J.; Hu, H.; Zhou, Y. Predictive habitat suitability modeling of deep-sea framework-forming scleractinian corals in the Gulf of Mexico. Sci. Total Environ. 2020, 742, 140562. [Google Scholar] [CrossRef]
- Li, B.; Zhang, F.; Zhang, L.W.; Huang, J.F.; Jin, Z.F.; Gupta, D.K. Comprehensive Suitability Evaluation of Tea Crops Using GIS and a Modified Land Ecological Suitability Evaluation Model. Pedosphere 2012, 22, 122–130. [Google Scholar] [CrossRef]
- Porta, J.; Parapar, J.; Doallo, R.; Rivera, F.F.; Santé, I.; Crecente, R. High performance genetic algorithm for land use planning. Comput. Environ. Urban Syst. 2013, 37, 45–58. [Google Scholar] [CrossRef]
- Zhao, Y.c.; Zhao, M.y.; Zhang, L.; Wang, C.y.; Xu, Y.l. Predicting Possible Distribution of Tea (Camellia sinensis L.) under Climate Change Scenarios Using MaxEnt Model in China. Agriculture 2021, 11, 1122. [Google Scholar] [CrossRef]
- Khormali, F.; Ayoubi, S.; KananroFoomani, F.; Fatemi, A.; Hemmati, K. Tea yield and soil properties as affected by slope position and aspect in Lahijan area, Iran. Int. J. Plant Prod. 2012, 1, 99–111. [Google Scholar]
- Ranjitkar, S.; Sujakhu, N.M.; Lu, Y.; Wang, Q.; Wang, M.; He, J.; Mortimer, P.E.; Xu, J.; Kindt, R.; Zomer, R.J. Climate modelling for agroforestry species selection in Yunnan Province, China. Environ. Model. Softw. 2016, 75, 263–272. [Google Scholar] [CrossRef]
- Jin, C.W.; Du, S.T.; Zhang, K.; Lin, X.Y. Factors determining copper concentration in tea leaves produced at Yuyao County, China. Food Chem. Toxicol. 2008, 46, 2054–2061. [Google Scholar] [CrossRef]
- El Kateb, H.; Zhang, H.; Zhang, P.; Mosandl, R. Soil erosion and surface runoff on different vegetation covers and slope gradients: A field experiment in Southern Shaanxi Province, China. Catena 2013, 105, 1–10. [Google Scholar] [CrossRef]
- Sarkar, D.; Saha, S.; Maitra, M.; Mondal, P. Site suitability for Aromatic Rice cultivation by integrating Geo-spatial and Machine learning algorithms in Kaliyaganj, C.D. block, India. Artif. Intell. Geosci. 2021, 2, 179–191. [Google Scholar] [CrossRef]
- Raji, P.; Shiny, R.; Byju, G. Impact of climate change on the potential geographical suitability of cassava and sweet potato vs. rice and potato in India. Theor. Appl. Climatol. 2021, 146, 941–960. [Google Scholar] [CrossRef]
- Wang, S.; Zhang, Z.; Ning, J.; Ren, G.; Yan, S.; Wan, X. Back Propagation-Artificial Neural Network Model for Prediction of the Quality of Tea Shoots through Selection of Relevant Near Infrared Spectral Data via Synergy Interval Partial Least Squares. Anal. Lett. 2013, 46, 184–195. [Google Scholar] [CrossRef]
- Li, L.; Wang, Y.; Jin, S.; Li, M.; Chen, Q.; Ning, J.; Zhang, Z. Evaluation of black tea by using smartphone imaging coupled with micro-near-infrared spectrometer. Spectrochim. Acta A Mol. Biomol. Spectrosc. 2021, 246, 118991. [Google Scholar] [CrossRef]
- Ren, G.; Gan, N.; Song, Y.; Ning, J.; Zhang, Z. Evaluating Congou black tea quality using a lab-made computer vision system coupled with morphological features and chemometrics. Microchem. J. 2021, 160, 105600. [Google Scholar] [CrossRef]
- Song, Y.; Wang, X.; Xie, H.; Li, L.; Ning, J.; Zhang, Z. Quality evaluation of Keemun black tea by fusing data obtained from near-infrared reflectance spectroscopy and computer vision sensors. Spectrochim. Acta A Mol. Biomol. Spectrosc. 2021, 252, 119522. [Google Scholar] [CrossRef] [PubMed]
- Yashodha, G.; Shalini, D. An integrated approach for predicting and broadcasting tea leaf disease at early stage using IoT with machine learning—A review. Mater. Today Proc. 2021, 37, 484–488. [Google Scholar] [CrossRef]
- Nidamanuri, R.R. Hyperspectral discrimination of tea plant varieties using machine learning, and spectral matching methods. Remote Sens. Appl. Soc. Environ. 2020, 19, 100350. [Google Scholar] [CrossRef]
- Mitchell, T. Machine Learning; McGraw Hill: New York, NY, USA, 1997. [Google Scholar]
- Taghizadeh-Mehrjardi, R.; Nabiollahi, K.; Rasoli, L.; Kerry, R.; Scholten, T. Land Suitability Assessment and Agricultural Production Sustainability Using Machine Learning Models. Agronomy 2020, 10, 573. [Google Scholar] [CrossRef]
- Cravero, A.; Pardo, S.; Sepúlveda, S.; Muñoz, L. Challenges to Use Machine Learning in Agricultural Big Data: A Systematic Literature Review. Agronomy 2022, 12, 748. [Google Scholar] [CrossRef]
- Jones, J.A.; Waller, N.G. Fungible weights in logistic regression. Psychol. Methods 2016, 21, 241–260. [Google Scholar] [CrossRef]
- Zabor, E.C.; Reddy, C.A.; Tendulkar, R.D.; Patil, S. Logistic Regression in Clinical Studies. Int. J. Radiat. Oncol. Biol. Phys. 2022, 112, 271–277. [Google Scholar] [CrossRef]
- Beiman, L. Random forests. Mach. Learn. 2001, 45, 5–32. [Google Scholar] [CrossRef]
- Boulesteix, A.L.; Janitza, S.; Kruppa, J.; König, I.R. Overview of random forest methodology and practical guidance with emphasis on computational biology and bioinformatics. Wiley Interdiscip. Rev. Data Min. Knowl. Discov. 2012, 2, 493–507. [Google Scholar] [CrossRef]
- Kang, J.; Guo, X.; Fang, L.; Wang, X.; Fan, Z. Integration of Internet search data to predict tourism trends using spatial-temporal XGBoost composite model. Int. J. Geogr. Inf. Sci. 2021, 36, 236–252. [Google Scholar] [CrossRef]
- Guo, Z.; Shao, X.; Xu, Y.; Miyazaki, H.; Ohira, W.; Shibasaki, R. Identification of Village Building via Google Earth Images and Supervised Machine Learning Methods. Remote Sens. 2016, 8, 271. [Google Scholar] [CrossRef]
- Friedman, J.H. Stochastic gradient boosting. Comput. Stat. Data Anal. 2002, 38, 367–378. [Google Scholar] [CrossRef]
- Zhang, Z.; Jung, C. GBDT-MO: Gradient-Boosted Decision Trees for Multiple Outputs. IEEE Trans. Neural Netw. Learn. Syst. 2020, 32, 3156–3167. [Google Scholar] [CrossRef]
- Wang, S.C.; Gao, R.; Wang, L.M. Bayesian network classifiers based on Gaussian kernel density. Expert Syst. Appl. 2016, 51, 207–217. [Google Scholar] [CrossRef]
- Vrbka, J. Using Artificial Neural Networks for Timeseries Smoothing and Forecasting; Springer International Publishing: Berlin, Germany, 2021. [Google Scholar]
- Jayathilaka, P.M.S.; Soni, P.; Perret, S.R.; Jayasuriya, H.P.W.; Salokhe, V.M. Spatial assessment of climate change effects on crop suitability for major plantation crops in Sri Lanka. Reg. Environ. Chang. 2012, 1, 55–68. [Google Scholar] [CrossRef]
- Liu, L.; Nie, Y.; Zhou, Y. Multi-suitability evaluation of cultivated land in Houhu Farm area based on GIS and niche-fitness. Wuhan Univ. J. Nat. Sci. 2005, 10, 796–802. [Google Scholar]
- Song, X.; Yang, G.; Yang, C.; Wang, J.; Cui, B. Spatial Variability Analysis of Within-Field Winter Wheat Nitrogen and Grain Quality Using Canopy Fluorescence Sensor Measurements. Remote Sens. 2017, 9, 237. [Google Scholar] [CrossRef]
- Zhao, K.; Zhang, L.; Dong, J.; Wu, J.; Ye, Z.; Zhao, W.; Ding, L.; Fu, W. Risk assessment, spatial patterns and source apportionment of soil heavy metals in a typical Chinese hickory plantation region of southeastern China. Geoderma 2020, 360, 114011. [Google Scholar] [CrossRef]
- Talukdar, S.; Singha, P.; Mahato, S.; Shahfahad Pal, S.; Liou, Y.-A.; Rahman, A. Land-Use Land-Cover Classification by Machine Learning Classifiers for Satellite Observations—A Review. Remote Sens. 2020, 12, 1135. [Google Scholar] [CrossRef]
- Menze, B.H.; Kelm, B.M.; Masuch, R.; Himmelreich, U.; Bachert, P.; Petrich, W.; Hamprecht, F.A. A comparison of random forest and its Gini importance with standard chemometric methods for the feature selection and classification of spectral data. BMC Bioinform. 2009, 10, 213. [Google Scholar] [CrossRef]
- Liu, C.; Chen, L.; Tang, W.; Peng, S.; Li, M.; Deng, N.; Chen, Y. Predicting Potential Distribution and Evaluating Suitable Soil Condition of Oil Tea Camellia in China. Forests 2018, 9, 487. [Google Scholar] [CrossRef]
- Lou, W.; Sun, S.; Wu, L.; Sun, K. Effects of climate change on the economic output of the Longjing-43 tea tree, 1972–2013. Int J Biometeorol. 2015, 59, 593–603. [Google Scholar] [CrossRef] [PubMed]
- Wu, K.; Zhao, W.; Liao, F.; Zhang, F.; Gao, J.; Qu, M. Study on Eeological Suitability of Green Tea Garden in Guizhou Province. Earth Environ. 2013, 41, 296–302. [Google Scholar]
- Pearce, J.; Ferrier, S. An evaluation of alternative algorithms for fitting species distribution models using logistic regression. Ecol. Model. 2000, 128, 127–147. [Google Scholar] [CrossRef]
- Møller, A.B.; Mulder, V.L.; Heuvelink, G.B.M.; Jacobsen, N.M.; Greve, M.H. Can We Use Machine Learning for Agricultural Land Suitability Assessment? Agronomy 2021, 11, 703. [Google Scholar] [CrossRef]
- Wang, L.; Kisi, O.; Hu, B.; Bilal, M.; Zounemat-Kermani, M.; Li, H. Evaporation modelling using different machine learning techniques. Int. J. Climatol. 2017, 37, 1076–1092. [Google Scholar] [CrossRef]
- Lin, R.; Liu, J.; Xu, S.; Liu, M.; Zhang, M.; Liang, E. Evaluation methon of landslide susceptibility based on random forest weighted information. Sci. Surv. Mapp. 2020, 45, 131–138. [Google Scholar]
- Gebrewahid, Y.; Abrehe, S.; Meresa, E.; Eyasu, G.; Abay, K.; Gebreab, G.; Kidanemariam, K.; Adissu, G.; Abreha, G.; Darcha, G. Current and future predicting potential areas of Oxytenanthera abyssinica (A. Richard) using MaxEnt model under climate change in Northern Ethiopia. Ecol. Processes 2020, 9, 6. [Google Scholar] [CrossRef] [Green Version]
Publisher’s Note: MDPI stays neutral with regard to jurisdictional claims in published maps and institutional affiliations. |
© 2022 by the authors. Licensee MDPI, Basel, Switzerland. This article is an open access article distributed under the terms and conditions of the Creative Commons Attribution (CC BY) license (https://creativecommons.org/licenses/by/4.0/).