Abstract
Rice holds key importance in food and nutritional security across the globe. Nutrient management involving rice has been a matter of interest for a long time owing to the unique production environment of rice. In this research, an artificial neural network-based prediction model was developed to understand the role of individual nutrients (N, P, K, Zn, and S) on different plant parameters (plant height, tiller number, dry matter production, leaf area index, grain yield, and straw yield) of rice. A feed-forward neural network with back-propagation training was developed using the neural network (nnet) toolbox available in Matlab. For the training of the model, data obtained from two consecutive crop seasons over two years (a total of four crops of rice) were used. Nutrients interact with each other, and the resulting effect is an outcome of such interaction; hence, understanding the role of individual nutrients under field conditions becomes difficult. In the present study, an attempt was made to understand the role of individual nutrients in achieving crop growth and yield using an artificial neural network-based prediction model. The model predicts that growth parameters such as plant height, tiller number, and leaf area index often achieve their maximum performance at below the maximum applied dose, while the maximum yield in most cases is achieved at 100% N, P, K, Zn, and S dose. In addition, the present study attempted to understand the impact of individual nutrients on both plant growth and yield in order to optimize nutrient recommendation and nutrient management, thereby minimizing environmental pollution and wastage of nutrients.
1. Introduction
Rice, being a staple crop in Asia, is of great significance for food and nutritional security. Improper nutrient application methods, imbalanced fertilizer use, and poor choice of agronomic practices result in a huge loss of nutrients and lower fertilizer use efficiency [1,2]. This has both economic and environmental implications. To improve nutrient use efficiency and achieve high productivity, the role of individual nutrients on crop growth and development must be identified. The requirement of individual nutrients to achieve maximum productivity should be known as well in order to optimize the nutrient application.
Plants require seventeen essential nutrients for their growth and development. Fertilizer application is an important agronomic practice, providing plants with sufficient nutrients and/or replenishing the nutrients removed by plants to maintain soil fertility. Multiple nutrients are applied to plants based on plant requirements for desirable outcomes in terms of crop productivity and quality. The role of different nutrients on plants has been studied for a long time. Nitrogen (N) is an essential nutrient for plants, and plays a pivotal role in the photosynthesis, crop physiology, growth, and productivity of rice [3]. It is a component of both amino acids and chlorophyll. Chlorophyll content in leaves has a relation to photosynthesis and is related to crop yield [4]. Nitrogen increases plant height [5,6], internode elongation, production of assimilates, metabolism [7,8], tiller number [9], panicle number, and panicle length [10] in rice. However, while applying nitrogen can enhance rice yield to a certain extent [11], an excessive amount may negatively influence productivity [12,13]. Similarly, excess nitrogen application may lead to more production of spikelets and less translocation of assimilates from leaves to spikelets [14] as well as unfilled grains and low grain yields of rice [8]. In addition to nitrogen, phosphorus (P) has a vital role in the reproductive growth of rice [15] and the improvement of root growth in plants [16,17]. Furthermore, P is a component of many biomolecules, including DNA, RNA, phospholipids, ATP, etc. [18]. Considering the important role played by phosphorus, its importance in improving plant growth and development and the overall yield performance of rice has been widely studied [19,20,21]. Potassium (K) improves the disease and pest tolerance of rice plants [22]. Furthermore, K has been found to improve lodging and to combat abiotic stress in plants [23]. The significance of K in maintaining water balance in a plant through regulation of stomatal movement is very crucial [23]. Sulphur (S) is a constituent of several amino acids, including cysteine and methionine [24]. The role of S in the growth and development of rice has been widely studied [25,26]. In addition to these, the role of zinc (Zn), a micronutrient, has been evaluated, as it has a vital role in the rice production system [26,27,28].
The complex nutrient interactions in soil, multiple roles of a single nutrient, involvement of multiple nutrients in a single plant’s metabolic activity, etc., make it very complex to predict the individual role of a plant nutrient. The nutrient interaction acts at multiple levels. At the soil level, there are synergistic and antagonistic effects that increase or decrease nutrient uptake, respectively. When the nutrients are taken up by the plant, the interaction may happen at the site of metabolism. Such interaction can be synergistic or antagonistic as well, and thus the resultant effect can be either positive or negative. These nutrient interactions at multiple levels often make it difficult to understand the individual effect of a particular nutrient on plant growth and development. The relationship between individual nutrients and crop growth is complex, and there is no clear mathematical relationship between the two. Under such circumstances, an artificial neural network (ANN) can be used to predict the role of individual nutrients on different plant parameters of rice [29]. Researchers have reported that a feed-forward neural network with back-propagation training can be a universal function approximator [30,31]. The hypothesis behind the application of ANNs to plant systems is that although there is a relation between the input and output parameters, the exact mathematical relationship may not be known. The ANN can identify the mathematical relationship between nutrient levels and plant growth parameters. ANNs functions by identifying patterns among experimental data [32], identifying patterns among the data through a learning process, and can predict output parameters for a set of input parameters for which no experiment has been performed. The development of an ANN is usually restricted due to the requirement of a large variety of training data as well as the unavailability of any definite procedure regarding model development.
There is a need to understand the effect of induvial nutrients on plant growth in order to minimize wastage of nutrients and reduce environmental pollution. However, no prediction tool has been reported that can predict the effect of different nutrients. Thus, this study focuses on the development of an ANN-based prediction tool related to the effect of plant nutrients on plant height, dry matter production, leaf area index, grain yield, and straw yield. Experiments in agriculture are usually conducted for three years or longer. In this study, data for two years were collected and utilized as a part of pilot research.
Conventional experimental practices in agriculture to determine the effect of a single input on plant growth and development are time-consuming, input-intensive, and costly. As there are usually different inputs and multiple plant parameters, it is difficult to perform all possible experiments by varying a single parameter at a time while keeping all others constant at various fixed levels. Trying all possible combinations can sometimes be impossible due to sudden variations of climatic parameters such as temperature, rainfall, humidity, etc. The advantage of using an artificial neural network (ANN) is the ability to develop a model based on a few experimental observations and then use the model to predict different possible cases for which no experiment has been performed, thereby saving money and time. On the other hand, an ANN is a mathematical tool, meaning that the effects of all possible conditions can be studied in ways which are not easy to do via experiment. ANNs have the potential to learn and acquire resistance to errors [29,33]. Each neuron in an ANN is assigned an appropriate value of the coefficient (weight), and changes in the weight values ultimately determine the knowledge of the neural network [33]. Machine learning methods, inclusive of ANNs, are characterized by high self-adaptation ability [34], which enables their application to many scientific issues [29].
The novelty of ANNs lies in the use of a mathematical model to study the effects of individual input parameters while keeping all others fixed at the desired levels. This feature of ANNs confers appropriate estimation of the individual impact of nutrients on different plant parameters, and serves as a decision support system for nutrient optimization. In light of the above facts, during the present investigation the influences of N, P, K, Zn, and S on different plant parameters were predicted with the target of nutrient optimization and environmental safety.
2. Materials and Methods
2.1. Experimental Details
An experiment was conducted at Visva-Bharati university farm (20°39′ N latitude and 87°42′ E longitude; altitude 58.9 m above MSL) for the period 2014 to 2016. The field lies in the red and lateritic belt of the western part of West Bengal, a state in eastern India. The study area receives a southwest monsoon and an average annual rainfall of 1377 mm. The field trial was carried out in sandy loam soil belonging to the typical Ultisols. The initial soil fertility status, particularly pH, organic carbon content (%), available nitrogen, phosphorus, potassium, sulfur (kg ha−1), and zinc (mg kg−1), was estimated in the laboratory at the beginning of the experiment based on the methods described in Table 1. The experimental data were recorded as per standard procedure.

Table 1.
Characteristics and initial fertility of the experimental soil and methodologies followed for their determination (June 2014).
The experiment on nutrient management in the rice–rice cropping system was carried out for two consecutive years, 2014–2015 and 2015–2016. Each year, two crops of rice, a high-yielding variety and a hybrid variety, were planted in the kharif (June planting) and boro (January planting) seasons, respectively (Table 2). The experiment was laid out in a completely randomized block design with nine treatments and three replications. The details of the different treatments are presented in Table 3. The maximum dose of nutrients applied was 80:40:40:25:20 and 120:60:60:25:20 kg ha–1 of N:P:K:Zn:S in kharif and boro season rice, respectively. Two different cultivars were taken in both the kharif and boro seasons, with the same growing duration. Rice in both seasons was cultivated based on standard procedures suitable for the local conditions. The sources of nitrogen, phosphorus, potassium, sulfur, and zinc were urea, diammonium phosphate (DAP), muriate of potash (MOP), Bentonite-S (90% S), and Zn-Ethylene-diamine tetra acetic acid (EDTA), respectively. Nitrogen was applied in splits, while the rest of the nutrients were applied completely as basal. Half of the nitrogen was applied as basal; however, the rest of it was top-dressed in two equal splits during the maximum tillering and panicle initiation stages for both Kharif and boro rice [42].
Table 2.
Varietal details.
Table 3.
Treatment combinations according to the recommended dose of fertilizers (RDF) (kg ha−1).
Table 4 summarizes the average plant parameters (plant height, dry matter accumulation, number of tillers, leaf area index, grain yield, and straw yield) corresponding to different treatments. As each experiment was repeated twice, the average values of the two experiments are presented.
Table 4.
Mean summary data of plant parameters.
2.2. Artificial Neural Network (ANN) Model
An ANN model was developed to identify the relationship between the input (nutrient levels for N, P, K, S, Zn, seed type, and year) and output parameters (rice plant parameters such as plant height, dry matter production, leaf area index, grain yield, and straw yield). There may be effects from temperature, humidity, and other climatic factors as well. As detailed data regarding these were not available, the year was fed as an input parameter to represent the effect of any parameters which were not studied or considered. To avoid false interpretation of the role of various parameters due to differences in their range of values (for example, the maximum amount of N applied was 120 kg ha−1, while that of S was 20 kg ha−1), all the parameters were normalized based on Equation (1) [32]:
A feed-forward neural network with back-propagation training was developed using the nnet toolbox available in Matlab. The network consisted of one input layer, one hidden layer, and one output layer. The hidden layer had two sub-layers. In this model, a combination of hyperbolic tangent sigmoidal (tansig) and linear (purelin) transfer functions was associated with the hidden sub-layers. The number of neurons for the hidden layers was identified by the trial-and-error method. In the ANN model, the values of weights and biases associated with the neurons and the layers were initialized using a pseudo-random number generator. The seed of the random number generator was chosen by trial and error. The weights and biases were adjusted using the training function trainlm available in the Matlab toolbox. Trainlm updates the weight and bias values based on Levenberg–Marquardt optimization [32]. Different training algorithms available in Matlab were tried. It was observed that trainlm worked efficiently to develop the ANN model. Usually, in a machine learning model there is a need for a large amount of data. However, what is required is that there is a set of data covering different patterns. In the experiments described here, while the amount of data was rather low, a variety of cases were included. Thus, it was possible to develop an ANN model using the available dataset. In this case, all experimental data excluding ten sets of data were used for training. An ANN model can predict by learning patterns in the datasets used for training and classifying them. A gradient descent algorithm was used for learning. The learning algorithm was chosen based on trial and error. The ten sets of data that were not used for training were used to verify the prediction ability of the final model [32]. The criteria for a successful model were set as (i) the R2 value for a plot of predicted and experimental values for all data should be greater than the threshold value, (ii) the R2 value for a plot of predicted and experimental values for the validation data (i.e., never used for training) should be greater than the threshold value, and (iii) the percentage of the predicted data should be above the threshold value for the defined range. The error was calculated using the mse function in Matlab. The mse function calculates the mean squared error.. Figure 1 shows a representative ANN model; the maximum dose is represented by 100 (Table 5) in the X-axis of the figure. The number of input neurons was seven for all models.
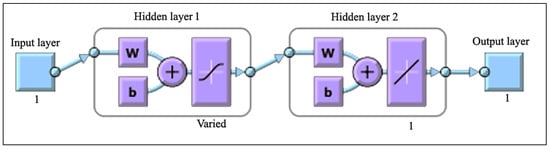
Figure 1.
Representative ANN model. Note: w = weight; b = bias.
Table 5.
Maximum and minimum values of nutrient dose.
The number of neurons for hidden layer 1 varied, as showed in Table 6. The number of neurons associated with hidden layer 2 and the output layer was one in all cases. Table 6 shows the prediction ability of the different ANN models. An R2 value close to unity shows that the model can predict with high accuracy. A percentage of data within a defined range close to 100 suggests that the model leads to less under prediction or over prediction.
Table 6.
The number of neurons in hidden layer 1 and the precision of the models.
The developed ANN models were used to predict the effect of individual nutrients on plant parameters. Only one nutrient level was changed while keeping all other input parameters constant. The input parameters were fed to the developed ANN model and the model predicted the output parameter based on patterns among the training data. The constant values for N, P, K, Zn, S, and Year were arbitrarily chosen as 75 kg ha−1, 40 kg ha−1, 25 kg ha−1, 20 kg ha−1, and 15 kg ha−1, respectively. One model was run for the hybrid variety while another was run for the high-yielding variety. The predicted plant parameters were noted against different nutrient levels.
3. Results and Discussion
The effect of nitrogen, phosphorous, potassium, zinc, and sulfur on different growth and yield parameters such as plant height (HT), dry matter accumulation (DM), leaf area index (LAI), number of tillers/m2 (Tiller), grain yield (GY), and straw yield (SY) of the rice–rice cropping system in the lateritic belt of West Bengal where the recorded parameters were studied. ANN models can predict output efficiently within the range of experimental input data studied.
3.1. Effect of Nitrogen on Different Plant Parameters of Kharif and Boro Rice
Nitrogen is a highly mobile nutrient in the soil; its use efficiency is very critical, as a lower economic efficiency causes both economic loss and negative environmental effects. The ANN prediction shows that plant height increased with nitrogen application up to 60% of the maximum dose of nitrogen (MDN) application during kharif and boro seasons. A similar trend was observed for dry matter accumulation. The LAI continued to increase within the maximum dose of nitrogen in both seasons. However, in the boro season the LAI achieved 20% of maximum value even with no application of nitrogen. This suggests that the native soil nitrogen might be more effective in improving LAI in the boro season than in the kharif season. The number of tillers/m2 increased up to 60% and 80% of MDN in the kharif and boro seasons, respectively. The grain yield continued to increase with the application of nitrogen (Figure 2) during the kharif and boro seasons. The straw yield of HYV rice and hybrid rice increased to 60% of the maximum dose of nitrogen, beyond which a decrease in straw yield was found. All of the parameters except for LAI and grain yield reached their maxima before 100% MDN.
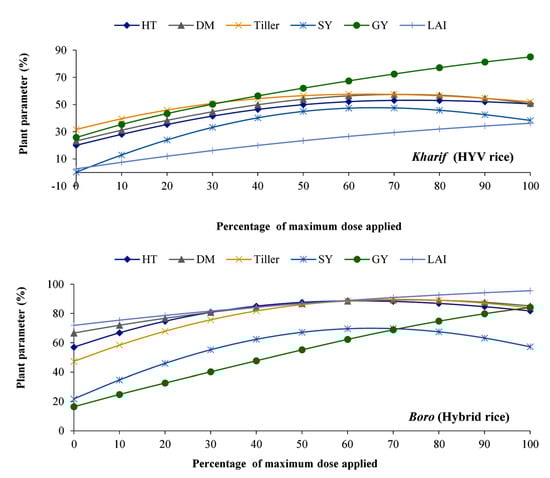
Figure 2.
Effect of nitrogen on different plant parameters of kharif and boro rice. Notation: HT = plant height at 120 DAT (days after transplanting); DM = dry matter accumulation at 120 DAT; SY = straw yield; GY = grain yield; LAI = leaf area index at 60 DAT.
Nitrogen plays an important role in the vegetative growth of plants [42]. The improvement in plant height, tillers, and dry matter observed in this experiment suggest the important role of nitrogen in vegetative growth. These growth parameters, however, started to decrease beyond 60% RDN. Unlike these parameters, the LAI continued to increase up to 100% RDN. LAI is an important indicator, suggesting the photosynthetic surface area per unit of ground area. The increased availability of photosynthetic surface area can be expected to increase photosynthate production. In addition, improvement in growth and grain yield of rice due to nitrogen application has been reported by Anas et al. [43]. However, it must be kept in mind that all nutrients interact with each other in deciding the final yield of a crop.
The model predicts that the yield continues to rise to MDN. However, most growth parameters reached their maxima at around 60% of MDN and then decreased. As yield is the ultimate target for any crop production system, the maximum dose of nitrogen may be applied to realize the yield potential of the crop. Any intervention or approach that can further enhance the growth parameters, especially the tiller number, beyond 60% MDN can help to further improve yield. Furthermore, an approach that can remove the physiological limitations which bring a high yield at a much higher dose as compared to other parameters can help to reduce fertilizer requirements as well. Because the rice field emits greenhouse gases, reducing nitrogen application can help to reduce GHG emissions.
3.2. Effect of Phosphorous on Different Plant Parameters of Kharif and Boro Rice
The growth and yield parameters responded differently to the applied phosphorus in both seasons. The maximum plant height in kharif was found at 30% of the maximum dose of phosphorus (MDP) while the corresponding value for boro was at 45% of the MDP (Figure 3). The tiller count continued to increase with an increase in the dose of phosphorus in the kharif season; however, this increase in tiller count followed the law of diminishing returns for each additional unit of phosphorus. In the boro season, the tiller count increased with an increase in phosphorus application up to 70% of MDP and then started to decrease. The dry matter increased with an increase in phosphorus application in the kharif season; however, in the boro season, the dry matter production declined beyond 60% MDP. An enhancement in grain yield with an increased dose of phosphorus was observed in both seasons, though the increase was not as significant as that observed due to nitrogen application (Figure 3).
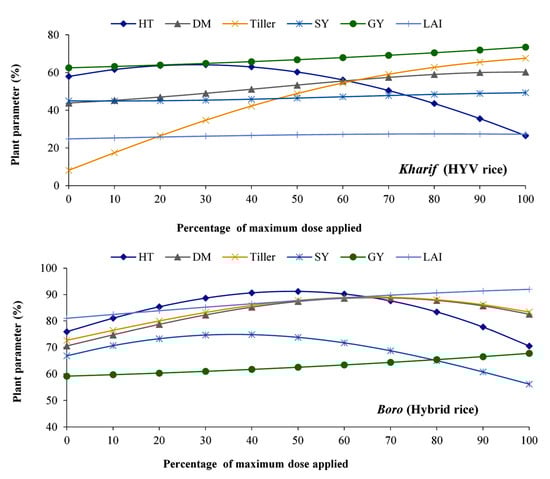
Figure 3.
Effect of phosphorous on different plant parameters of kharif and boro season rice. For notation, see Figure 2.
Phosphorus is important in root growth, as it helps in the better absorption of nutrients and water; in addition, phosphorus is responsible for the reproductive growth of the plant [16]. Phosphorus affects both the growth parameters and yield, as observed in this experiment. The variation in crop performance with phosphorus application in the two different seasons might be due to varietal effects and environmental factors. Though a few parameters such as plant height and dry matter production reached their maxima below 100% MDP, a dose below 100% of MDP cannot be recommended, as the highest crop yield is achieved at 100% MDP. However, understanding the physiological limitations that result in a decrease in these growth parameters can help to further improve crop productivity and save fertilizer. In the boro season, most of the parameters achieved over 60% of the maximum value even with no application of phosphorus. This might be due to the residual phosphorus from the previous season or due to the better effectiveness of soil phosphorus in improving the growth and yield parameters during the boro season. The yield in both seasons achieved 60% of the maximum value even with no application, suggesting that the soil phosphorus improved plant yield to a great extent and showing the role of phosphorus in increasing growth, yield attributes, and grain yield of rice [44,45].
3.3. Effect of Potassium on Different Plant Parameters of Kharif and Boro Season Rice
The application of potassium increased plant height with the increase of potassium up to the maximum dose of potassium (MDK) application. A similar response was observed for tiller count in both seasons. The role of fertilizer potassium in improving tiller count was higher during the kharif season than the boro season. Unlike nitrogen and phosphorus, the effect of potassium was minimal on grain yield. The straw yield was stable in both seasons of the experiment. The leaf area index (LAI) in both seasons was relatively constant. Plant height and dry matter production were the only two parameters that showed significant increases due to an increase in the potassium application. In both the kharif and boro seasons, 60% of maximum yield was achieved with no potassium application, suggesting the important role of inherent soil fertility (Figure 4). Except for yield, all the growth parameters showed better results with no potassium application, which could be due either to the residual effect of potassium applied in the kharif season or to better utilization of soil potassium during the boro season.
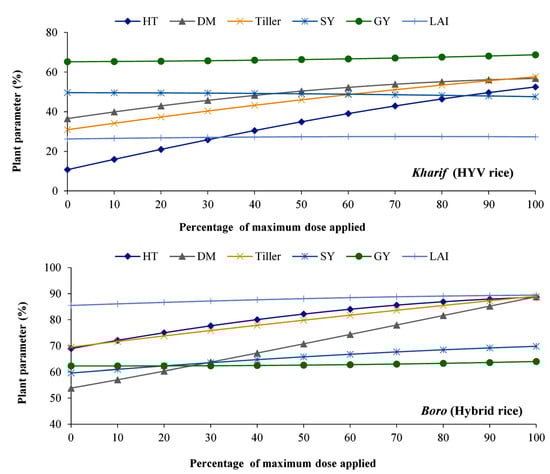
Figure 4.
Effect of potassium on different plant parameters of kharif and boro season rice. For notation, see Figure 2.
Potassium plays a protective role in plants and provides tolerance to different sources of stress [46,47,48]. Because crops in the experiment were not subjected to any acute stresses, the effect of potassium on grain yield was comparatively low. However, under stressed conditions this may change. Hence, the application of potassium should not be overlooked, especially in a stressed environment. The increase in dry matter production suggests an increase in photosynthate accumulation due to potassium application, and hence potassium can play an important role in improving yield, especially when a good source–sink relationship is established. Moreover, the role of potassium in stomatal activity [23] maintains the plants’ water balance, and thus affects the utilization of other nutrients. Such activity of potassium largely affects the photosynthetic activity of plants as well, deciding the final yield of a crop.
3.4. Effect of Zinc on Different Plant Parameters of Kharif and Boro Season Rice
Plant height increased significantly with zinc application in both seasons (Figure 5). Zinc improved dry matter production up to 60% of the maximum dose of zinc (MDZn) in the boro season and 80% of MDZn in the kharif season. The tiller count increased as well, with an increase in zinc application up to 40% of MDZn in kharif and 70% of MDZn in boro. The harvest index was stable throughout the range of zinc application in the kharif season; however, beyond 60% of MDZn the harvest index started to decrease. The grain yield increased with an increase in zinc application, though the enhancement in grain productivity due to zinc application was not very high. As with other nutrients, most of the crop parameters achieved a higher percentage of their maximum value in the boro season as compared to those for the kharif season. This was probably due to the effect of residual zinc in the soil from the kharif season and/or better utilization of inherent soil zinc.
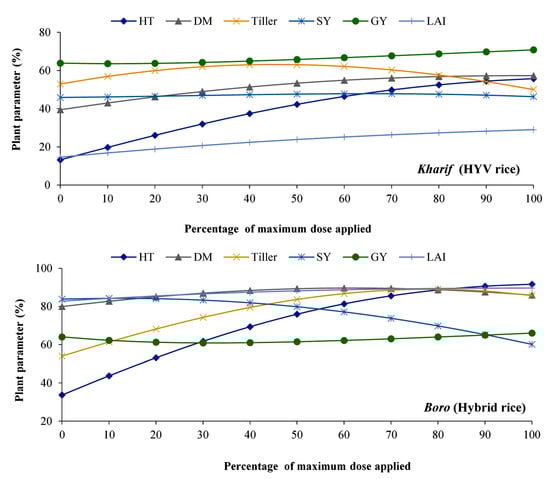
Figure 5.
Effect of zinc on different plant parameters of rice in both kharif and boro seasons. For notation, see Figure 2.
Zinc plays an important role in the biosynthesis of auxin, and thus plays a significant role in plant growth [49]. Hence, a significant improvement in plant height was observed with an increase in zinc application within the recommended dose of zinc application. Though parameters such as tiller count reached their maxima before 100% MDZn, the yield was at its maximum at 100% MDZn. This might be due to the continuous rise in LAI in both seasons with the increase in Zn application. However, the increase in LAI with Zn application was more significant in the kharif than in the boro season. The effect of zinc on improving dry matter production, tillering, and yield of rice [42,50,51] has been reported by many researchers. Zinc is a micronutrient required in relatively low amounts, and hence no yield increment was observed beyond a certain limit.
3.5. Effect of Sulfur on Different Plant Parameters of Kharif and Boro Season Rice
Plant height increased continuously with an increase in sulfur application within the recommended dose in the kharif season; however, in the boro season plant height reached its maximum at 60% of the maximum dose of sulfur (MDS), beyond which it remained constant and then started to decrease. Dry matter production increased continuously with an increase in sulfur application up to the MDS. In kharif, the leaf area index increased steadily with an increase in sulfur application up to 50% of MDS, beyond which it became constant. However, in the boro season, a linear enhancement in LAI was noted with an increase in the sulfur application within the MDS. The tiller number increased up to 80% of MDS during the kharif season, beyond which it decreased; however, in the boro season the tiller count increased continuously within MDS. Grain yield was constant with sulfur application, with a minor increase in grain yield observed towards 100% sulfur application. The straw yield during kharif was stable within the range of application; however, in the boro season the straw yield increased continuously (Figure 6).
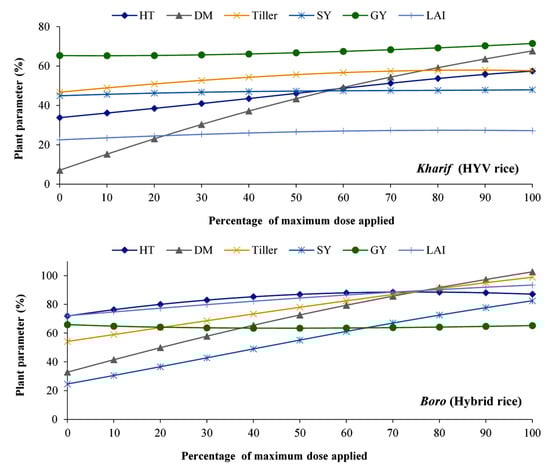
Figure 6.
Effect of sulfur on different plant parameters of kharif and boro season rice. For notation, see Figure 2.
Sulfur plays a crucial role in the formation of enzymes, proteins, vitamins, and chlorophylls in plants, and plays a significant role in plant photosynthesis [52]. Considering its multiple important roles, sulfur is considered the fourth major plant nutrient [53]. Sulfur has been reported to improve LAI and dry matter production in rice [54]. Thus, it can play an important role in improving plant yield [55]. The beneficial effects of sulfur on the growth and yield attributes of rice has been previously observed by Shankar et al. [42]. ANN has proven to be an effective tool for predicting crop yields under varying climatic conditions and input delivery in different crops [56]. In earlier research, linear regression models have mostly been used for yield prediction of crops; however, a crop has a non-linear relationship with input parameters, and hence customization of an ANN can predict the yield with more accuracy [57]. In this regard, it should be mentioned that ANNs are better able to explain yield variability compared to other methods [58]. The present study showed a higher level of accuracy in yield prediction as influenced by various nutrients.
4. Conclusions
Though each nutrient has specific roles in plant growth and development, complex interactions among nutrients often make it difficult to understand the individual action of nutrients in deciding the final yield. Moreover, it is almost impossible to know the individual effect of nutrients on plant parameters, especially in field conditions, where crop performance is subjected to a highly complex environment. The ANN-based model used in this research provides information on individual nutrient functions in plants, especially their role in improving plant height, number of tillers, leaf area index, grain yield, and straw yield. The model predicts that growth parameters such as height, tiller number, and leaf area index often achieve 100% performance at below the maximum applied dose, while the maximum yield in most cases is achieved at 100% of the N, P, K, Zn, and S dose. This suggests a physiological limitation existing within the plant that causes attainment of maximum yield at a relatively higher dose of nutrient. Though the ANN-based model does not provide any explanation for such behavior in plants, it shows an important area in which future works can be directed. Minimizing physiological limitations can help in achieving the maximum desirable yield with an even of a lower dose of nutrient application, ultimately leading to improvements in nutrient use efficiency. The grain yield of rice during both seasons was obtained at about 60% with minimum (zero or close to zero %) application of nutrients, namely, P, K, Zn, and S. However, the corresponding grain yield prediction was around 20% with minimum application of N. This prediction indicates that N is the most limiting nutrient among the nutrients studied here with respect to obtaining the maximum grain yield of rice irrespective of season and cultivar. In addition, lower use of fertilizer can provide additional economic and environmental benefits.
Author Contributions
Conceptualization, T.S., G.C.M., M.B., S.D., S.P., S.L., S.M. (Sagar Maitra), D.B., A.K.D., A.S. and S.M. (Sahasransu Mohanty); methodology, T.S., G.C.M., M.B. and S.M. (Sahasransu Mohanty); software, T.S., A.H. and S.M. (Sahasransu Mohanty); validation, T.S., G.C.M., M.B., S.D. and S.M. (Sahasransu Mohanty); formal analysis, T.S., A.H. and S.M. (Sahasransu Mohanty); investigation, S.M. (Sagar Maitra), M.B. and G.C.M.; resources, M.B. and G.C.M.; data curation, S.M. (Sagar Maitra) and M.B.; writing—original draft preparation, T.S., S.M. (Sagar Maitra), M.B., G.C.M., S.M. (Sagar Maitra), A.K.D., A.S. and S.M. (Sahasransu Mohanty); writing—review and editing, A.G. and A.H.; visualization, T.S., G.C.M. and M.B.; supervision, G.C.M. and M.B.; project administration, G.C.M.; Funding, G.C.M., S.M., A.G. and A.H. All authors have read and agreed to the published version of the manuscript.
Funding
Department of Agronomy, Palli Siksha Bhavana, Visva-Bharati, Sriniketan 731204, India and Department of Agronomy, Centurion University of Technology and Management, Odisha 761211, India. This research was partially funded by the Taif University Researchers with Supporting Project number (TURSP-2020/39), Taif University, Taif, Saudi Arabia.
Institutional Review Board Statement
Not applicable.
Informed Consent Statement
Not applicable.
Data Availability Statement
Most of the recorded data are available in all Tables in the manuscript.
Acknowledgments
The authors acknowledge the Department of Agronomy, Palli Siksha Bhavana, Visva-Bharati, Sriniketan 731204, India, the Department of Agronomy, Centurion University of Technology and Management, Odisha 761211, India, and the Taif University Researchers for funding this research with Supporting Project number (TURSP-2020/39), Taif University, Taif, Saudi Arabia.
Conflicts of Interest
The authors declare no conflict of interest.
References
- Pattanayak, S.; Jena, S.; Das, P.; Maitra, S.; Shankar, T.; Praharaj, S.; Mishra, P.; Mohanty, S.; Pradhan, M.; Swain, D.K.; et al. Weed management and crop establishment methods in rice (Oryza sativa L.) influence the soil microbial and enzymatic activity in sub-tropical environment. Plants 2022, 14, 1071. [Google Scholar] [CrossRef] [PubMed]
- Mangaraj, S.; Paikaray, R.K.; Maitra, S.; Pradhan, S.R.; Garnayak, L.M.; Satapathy, M.; Swain, B.; Jena, S.; Nayak, B.; Shankar, T.; et al. Integrated nutrient management improves the growth and yield of rice and greengram in a rice—greengram cropping system under the coastal plain agro-climatic condition. Plants 2022, 11, 142. [Google Scholar] [CrossRef]
- Lv, X.H.; Fu, L.D.; Song, Y.T.; Chen, W.F. Effects of nitrogen application on nitrogen metabolism and related physiological characteristics of leaves of rice of different plant types. Jiangsu Agric. Sci. 2017, 45, 62–65. [Google Scholar]
- Zhang, J.; Tong, T.; Potcho, P.M.; Huang, S.; Ma, L.; Tang, X. Nitrogen effects on yield, quality and physiological characteristics of giant rice. Agronomy 2020, 10, 1816. [Google Scholar] [CrossRef]
- Chou, J.T.; Wu, Z.; Jiang, T.H.; Liu, F.; Zhang, Z.J. Effects of nitrogen reduction at different growth stages on rice population production characteristics and preliminary analysis of nitrogen reduction strategies. J. Yangzhou Univ. 2020, 65, 52–58. [Google Scholar]
- Tayefe, M.; Gerayzade, A.; Amiri, E.; Zade, A.N. Effect of nitrogen on rice yield, yield components and quality parameters. Afr. J. Biotechnol. 2014, 13, 91–105. [Google Scholar] [CrossRef]
- Li, X.; Liu, Z.Z.; Ji, W.W. Effects of nitrogen application on osmotic regulators in leaves of different plant types of rice. Jiangsu Agric. Sci. 2019, 47, 117–121. [Google Scholar]
- Jahan, A.; Aminul, I.A.; Sarkar, M.I.U.; Iqbal, M.; Ahmed, M.N.; Islam, M.R. Nitrogen response of two high yielding rice varieties as influenced by nitrogen levels and growing seasons. Geol. Ecol. Landsc. 2020, 6, 24–31. [Google Scholar] [CrossRef]
- Contreras, H.A.S.; Barzan, R.R.; Contreras, M.S.; Brito, O.R. Growth, yield and agronomic efficiency of rice (Oryza sativa L.) cv. IAPAR 117 affected by nitrogen rates and sources. Acta Agron. 2017, 66, 558–565. [Google Scholar] [CrossRef]
- Ghoneim, A.M.; Gewaily, E.E.; Osman, M.M.A. Effects of nitrogen levels on growth, yield and nitrogen use efficiency of some newly released Egyptian rice genotypes. Open Agric. 2018, 3, 310–318. [Google Scholar] [CrossRef]
- Khairunniza-Bejo, S.; Zulkifli, Z.; Muharam, F.M. Effect of nitrogen fertilizer to growth, biomass and grain yield of paddy. Acta Hortic. 2017, 1152, 159–164. [Google Scholar] [CrossRef]
- Moro, B.M.; Nuhu, I.R.; Ato, E.; Naathanial, B. Effect of nitrogen rates on the growth and yield of three rice (Oryza sativa L.) varieties in rain-fed lowland in the forest agro-ecological zone of Ghana. Int. J. Agric. Sci. 2015, 5, 878–885. [Google Scholar]
- Zhang, G.L.; Zhao, R.; Liu, Y.T.; Yao, F.W.; Tang, W.B. Effect of different amount of nitrogen on the yield and the quality of high quality rice and its nitrogen utilization efficiency. J. Hunan Agric. Univ. Nat. Sci. 2019, 45, 231–236. [Google Scholar]
- Yoshida, H.; Horie, T.; Shiraiwa, T. A model explaining genotypic and environmental variation of rice spikelet number per unit area measured by cross-locational experiments in Asia. Field Crop. Res. 2006, 97, 337–343. [Google Scholar] [CrossRef]
- Ye, T.; Li, Y.; Zhang, J.; Hou, W.; Zhou, W.; Lu, J.; Xing, Y.; Li, X. Nitrogen, phosphorus, and potassium fertilization affects the flowering time of rice (Oryza sativa L.). Glob. Ecol. Conserv. 2019, 20, e00753. [Google Scholar] [CrossRef]
- Gao, W.; Blaser, S.R.; Schlüter, S.; Shen, J.; Vetterlein, D. Effect of localised phosphorus application on root growth and soil nutrient dynamics in situ–comparison of maize (Zea mays) and faba bean (Vicia faba) at the seedling stage. Plant Soil 2019, 441, 469–483. [Google Scholar] [CrossRef]
- He, J.; Jin, Y.; Turner, N.; Chen, Z.; Liu, H.-Y.; Wang, X.-L.; Siddique, K.; Li, F.-M. Phosphorus application increases root growth, improves daily water use during the reproductive stage, and increases grain yield in soybean subjected to water shortage. Environ. Exp. Bot. 2019, 166, 103816. [Google Scholar] [CrossRef]
- Smit, A.L.; Bindraban, P.S.; Schröder, J.J.; Conijn, J.G.; Van der Meer, H.G. Phosphorus in Agriculture: Global Resources, Trends and Developments. Report to the Steering Committee Technology Assessment of the Ministry of Agriculture; Plant Research International: Wageningen, The Netherlands, 2009. [Google Scholar]
- Mori, A.; Fukuda, T.; Vejchasarn, P.; Nestler, J.; Pariasca-Tanaka, J.; Wissuwa, M. The role of root size versus root efficiency in phosphorus acquisition in rice. J. Exp. Bot. 2016, 67, 1179–1189. [Google Scholar] [CrossRef] [PubMed]
- Xu, H.X.; Weng, X.Y.; Yang, Y. Effect of phosphorus deficiency on the photosynthetic characteristics of rice plants. Russ. J. Plant Physiol. 2007, 54, 741–748. [Google Scholar] [CrossRef]
- Yosef, T.S. Effect of nitrogen and phosphorus fertilizer on growth and yield rice (Oryza sativa L). Int. J. Agron. Plant Prod. 2012, 3, 579–584. [Google Scholar]
- Amtmann, A.; Troufflard, S.; Armengaud, P. The effect of potassium nutrition on pest and disease resistance in plants. Physiol. Plant. 2008, 133, 682–691. [Google Scholar] [CrossRef]
- Wang, M.; Zheng, Q.; Shen, Q.; Guo, S. The critical role of potassium in plant stress response. Int. J. Mol. Sci. 2013, 14, 7370–7390. [Google Scholar] [CrossRef] [PubMed]
- Atmaca, G. Antioxidant effects of sulfur-containing amino acids. Yonsei Med. J. 2004, 45, 776–788. [Google Scholar] [CrossRef]
- Jawahar, S.; Vaiyapuri, V. Effect of sulphur and silicon fertilization on growth and yield of rice. Int. J. Curr. Res. 2010, 9, 36–38. [Google Scholar]
- Singh, A.K.; Meena, M.K.; Upadhyaya, A. Effect of sulphur and zinc on rice performance and nutrient dynamics in plants and soil of Indo Gangetic plains. J. Agric. Sci. 2012, 4, 162. [Google Scholar] [CrossRef]
- Rehman, H.U.; Aziz, T.; Farooq, M.; Wakeel, A.; Rengel, Z. Zinc nutrition in rice production systems: A review. Plant. Soil 2012, 361, 203–226. [Google Scholar] [CrossRef]
- Yadi, R.; Dastan, S.; Yasari, E. Role of zinc fertilizer on grain yield and some qualities parameters in Iranian rice genotypes. Ann. Biol. Res. 2012, 3, 4519–4527. [Google Scholar]
- Hara, P.; Piekutowska, M.; Niedbała, G. Selection of independent variables for crop yield prediction using artificial neural network models with remote sensing data. Land 2021, 10, 609. [Google Scholar] [CrossRef]
- White, H. Artificial Neural Networks: Approximation and Learning Theory; Blackwell: Cambridge, UK, 1992. [Google Scholar]
- Gupta, N.K.; Chandwani, V. Artificial Neural Networks as Universal Function Approximators. Int. J. Emerg. Trend Engin. Devel. 2012, 4, 455–464. [Google Scholar]
- Bhattacharyay, D.; Kocaefe, D.; Kocaefe, Y.; Morais, B. An artificial neural network model for predicting the CO2 reactivity of carbon anodes used in the primary aluminum production. Neural Comp. Appl. 2015, 28, 553–563. [Google Scholar] [CrossRef]
- Miao, Y.; Mulla, D.J.; Robert, P.C. Identifying important factors influencing corn yield and grain quality variability using artificial neural networks. Precis. Agric. 2006, 7, 117–135. [Google Scholar] [CrossRef]
- Schwalbert, R.A.; Amado, T.; Corassa, G.; Pott, L.P.; Prasad, P.V.V.; Ciampitti, I.A. Satellite-based soybean yield forecast: Integrating machine learning and weather data for improving crop yield prediction in southern Brazil. Agric. For. Meteorol. 2020, 284, 107886. [Google Scholar] [CrossRef]
- Bouyoucos, G.J. Hydrometer method improved for making particle size analysis of soils. J. Agron. 1951, 54, 464–465. [Google Scholar] [CrossRef]
- Jackson, M.L. Soil Chemical Analysis; Prentice Hall of India Pvt. Ltd.: New Delhi, India, 1973; pp. 183–193. [Google Scholar]
- Subbiah, B.V.; Asija, G.L. A rapid procedure for the determination of available nitrogen in soils. Curr. Sci. 1956, 25, 259–260. [Google Scholar]
- Bray, R.H.; Kurtz, L.T. Determinations of total, organic and available forms of phosphorus in soils. Soil Sci. 1945, 59, 39–45. [Google Scholar] [CrossRef]
- Hanway, J.J.; Heidel, H. Soil analyses methods as used in Iowa State College Soil Testing Laboratory. Iowa Agric. 1952, 57, 131. [Google Scholar]
- Lindsay, W.L.; Norvell, W.A. Development of DTPA soil test for Zn, Fe, Mn and Cu. Soil Sci. Soc. Am. J. 1978, 42, 421–428. [Google Scholar] [CrossRef]
- Chesnin, L.; Yien, C.H. Turbid metric Determination of Available Sulphates. Soil Sci. Soc. Am. J. 1950, 15, 149–151. [Google Scholar] [CrossRef]
- Shankar, T.; Malik, G.C.; Banerjee, M.; Dutta, S.; Maitra, S.; Praharaj, S.; Sairam, M.; Kumar, D.S.; Dessoky, E.S.; Hassan, M.M.; et al. Productivity and Nutrient Balance of an Intensive Rice–Rice Cropping System Are Influenced by Different Nutrient Management in the Red and Lateritic Belt of West Bengal, India. Plant 2021, 10, 1622. [Google Scholar] [CrossRef] [PubMed]
- Anas, M.; Liao, F.; Verma, K.K.; Muhammad, A.S.; Mahmood, A.; Chen, Z.-L.; Li, Q.; Zeng, X.-P.; Yang, L.; Li, Y.-R. Fate of nitrogen in agriculture and environment: Agronomic, eco-physiological and molecular approaches to improve nitrogen use efficiency. Biol. Res. 2020, 53, 47. [Google Scholar] [CrossRef]
- Peng, S.; Buresh, R.J.; Huang, J.; Zhong, X.; Zou, Y.; Yang, J.; Wang, G.; Liu, Y.; Hu, R.; Tang, Q.; et al. Improving nitrogen fertilization in rice by site-specific N management. A review. Agron. Sustain. Dev. 2010, 30, 649–656. [Google Scholar] [CrossRef]
- Ram, M.S.; Shankar, T.; Maitra, S.; Adhikary, R.; Swamy, G.V.V.S.N. Productivity, nutrient uptake and nutrient use efficiency of summer rice (Oryza sativa) as influenced by integrated nutrient management practices. Crop Res. 2020, 55, 65–72. [Google Scholar]
- Meena, R.K.; Neupane, M.P.; Singh, S.P. Effect of phosphorus levels and bio-organic sources on growth and yield of rice (Oryza sativa L.). Int. J. Agric. Sci. 2015, 11, 286–289. [Google Scholar] [CrossRef]
- Hasanuzzaman, M.; Bhuyan, M.H.M.; Nahar, K.; Hossain, M.; Mahmud, J.A.; Hossen, M.; Masud, A.A.C.; Fujita, M. Potassium: A vital regulator of plant responses and tolerance to abiotic stresses. Agron. 2018, 8, 31. [Google Scholar] [CrossRef]
- Shankar, T.; Maitra, S.; Ram, M.S.; Mahapatra, R. Influence of integrated nutrient management on growth and yield attributes of summer rice (Oryza sativa L.). Crop Res. 2020, 55, 1–5. [Google Scholar]
- Shabala, S.; Pottosin, I. Regulation of potassium transport in plants under hostile conditions: Implications for abiotic and biotic stress tolerance. Physiol. Plant 2014, 151, 257–279. [Google Scholar] [CrossRef]
- Cheng, T. The role of zinc in auxin synthesis in the tomato plan. Am. J. Bot. 1948, 35, 172–179. [Google Scholar]
- Muthukumararaja, T.M.; Sriramachandrasekharan, M.V. Effect of zinc on yield, zinc nutrition and zinc use efficiency of lowland rice. J. Agric. Technol. 2012, 8, 551–561. [Google Scholar]
- Hemesh, K.; Brar, B.S. Role of sulphur in cereal crops: A review. J. Pharm. Phytochem. 2020, 9, 1864–1869. [Google Scholar]
- Shah, M.A.; Manaf, A.; Hussain, M.; Farooq, S.; Zafar-ul-Hye, M. Sulphur fertilization improves the sesame productivity and economic returns under rainfed conditions. Int. J. Agric. Biol. 2013, 15, 1301–1306. [Google Scholar]
- Chandel, R.S.; Singh, K.; Singh, A.K.; Sudhakar, P.C.; Singh, K. Effect of sulphur nutrition in rice (Oryza sativa L.) and mustard (Brassica juncea L. Czern and Coss.) grown in sequence. Ind. J. Plant Physiol. 2003, 8, 155–159. [Google Scholar]
- Verma, S.; Choudhary, M.R.; Sengupta, S.; Mishra, S.; Rani, V. Economic aspect of vermicompost and sulphur application in the garlic cultivation. J. Pharmacogn. Phytochem. 2018, 7, 2546–2548. [Google Scholar]
- Savin, I.Y.; Stathakis, D.; Negre, T.; Isaev, V.A. Prediction of crop yields with the use of neural networks. Russ. Agric. Sci. 2007, 33, 361–363. [Google Scholar] [CrossRef]
- Shastry, K.A.; Sanjay, H.A.; Deshmukh, A. A parameter based customized artificial neural network model for crop yield prediction. J. Artif. Intel. 2016, 9, 23–32. [Google Scholar] [CrossRef][Green Version]
- Khairunniza-Bejo, S.; Samihah Mustaffha, S.; Ismail, W.I.W. Application of Artificial Neural Network in Predicting Crop Yield: A Review. J. Food Sci. Eng. 2014, 4, 1–9. [Google Scholar]


Publisher’s Note: MDPI stays neutral with regard to jurisdictional claims in published maps and institutional affiliations. |
© 2022 by the authors. Licensee MDPI, Basel, Switzerland. This article is an open access article distributed under the terms and conditions of the Creative Commons Attribution (CC BY) license (https://creativecommons.org/licenses/by/4.0/).