1. Introduction
A knowledge graph [
1] is essentially a structured semantic knowledge database that uses triples to describe the concepts, entities and their relations in the objective world. Specifically, the triples are represented in the form of (entity, relation and entity) or (entity, attribute and attribute value) [
2,
3]. According to the knowledge coverage scope, knowledge graphs can be classified into general knowledge graphs [
4,
5,
6] and domain knowledge graphs [
7,
8]. A general knowledge graph mainly contains a large amount of common-sense knowledge, featured with a wide coverage and a high degree of automated knowledge acquisition, but its knowledge representations have a coarse granularity and a shallow depth. A domain knowledge graph (also known as an industrial knowledge graph or vertical knowledge graph) is generally an industrial knowledge database based on the professional knowledge data in a specific field, which is subjected to a high requirement on the quality of knowledge acquisition. Its knowledge representations are much more fine-grained, but the application is more complicated [
9,
10].
China has one of the most serious crop-disease problems in the world. Over 700 kinds of diseases occur all year round, leading to an economic loss of more than 200 billion yuan [
11]. In recent years, under the impact of multiple factors such as global climate change, the adjustment of agricultural structure and changes in farming methods, the scope and degree of damage caused by crop diseases are both on the rise. According to the estimates of the Food and Agriculture Organization of the United Nations, the average loss related to crop diseases is around 10–15% of the total crop output. Therefore, strengthening the utilization of crop-disease domain knowledge is of great significance to reducing losses caused by crop diseases through scientific guidance and strengthening the overall national economy. The knowledge data of crop diseases may come from a wide range of sources, which leads to the problems of heterogeneity, diversity, and scattered structure in knowledge management. Consequently, it is difficult for users to query and use such knowledge in a quick and efficient manner. Since knowledge graphs have been demonstrated to be useful in the management and application of domain knowledge, in recent years, researchers have carried out extensive research on the construction of agricultural domain knowledge graphs and achieved encouraging results. However, in-depth studies on crop-disease domain-knowledge graphs are still rare. Wu et al. [
12] proposed a deep-learning-based method for the construction of crop disease knowledge graphs by directly modeling the triples (achieved an F1 score of 91.34%). With respect to the agricultural named-entity recognition, Zhao et al. [
13] proposed a named-entity recognition method by integrating the BERT Chinese-character-level features and external dictionary features. The recognition accuracy reached 94.84% on a corpus dataset composed of five types of agricultural entities. Li [
14] proposed the processes of knowledge extraction, fusion and storage for multi-source and multi-carrier knowledge data. Wu [
15] built an agricultural domain knowledge graph by applying ontology and its related technologies, which contained the data of crop varieties, crop diseases and insect pests, and pesticides and fertilizers. Guo et al. [
16] have built NER models based on the convolutional neural network and attention mechanism to effectively identify entities such as agricultural diseases and insect pests.
However, due to the lack of publicly available labeling datasets, limited effort has been made on crop disease domain knowledge graphs. The research on entity and relation extraction is still at a superficial level, with no generalized methods available. In view of the current problems, this paper aimed to achieve the following objectives:
- (1)
To build a fine-grained Chinese crop disease corpus dataset by crawling network resources and searching professional books manually.
- (2)
To propose a named-entity recognition model (BERT-BiLSTM-CRF) and a relation-extraction model (PERT-FC) for the crop disease domain.
- (3)
To integrate the named-entity recognition model and the relation-extraction model in the form of an assembly line to establish a triple-extraction model (BBCPF) based on entity-relation joint extraction.
2. Materials and Methods
2.1. Model Construction
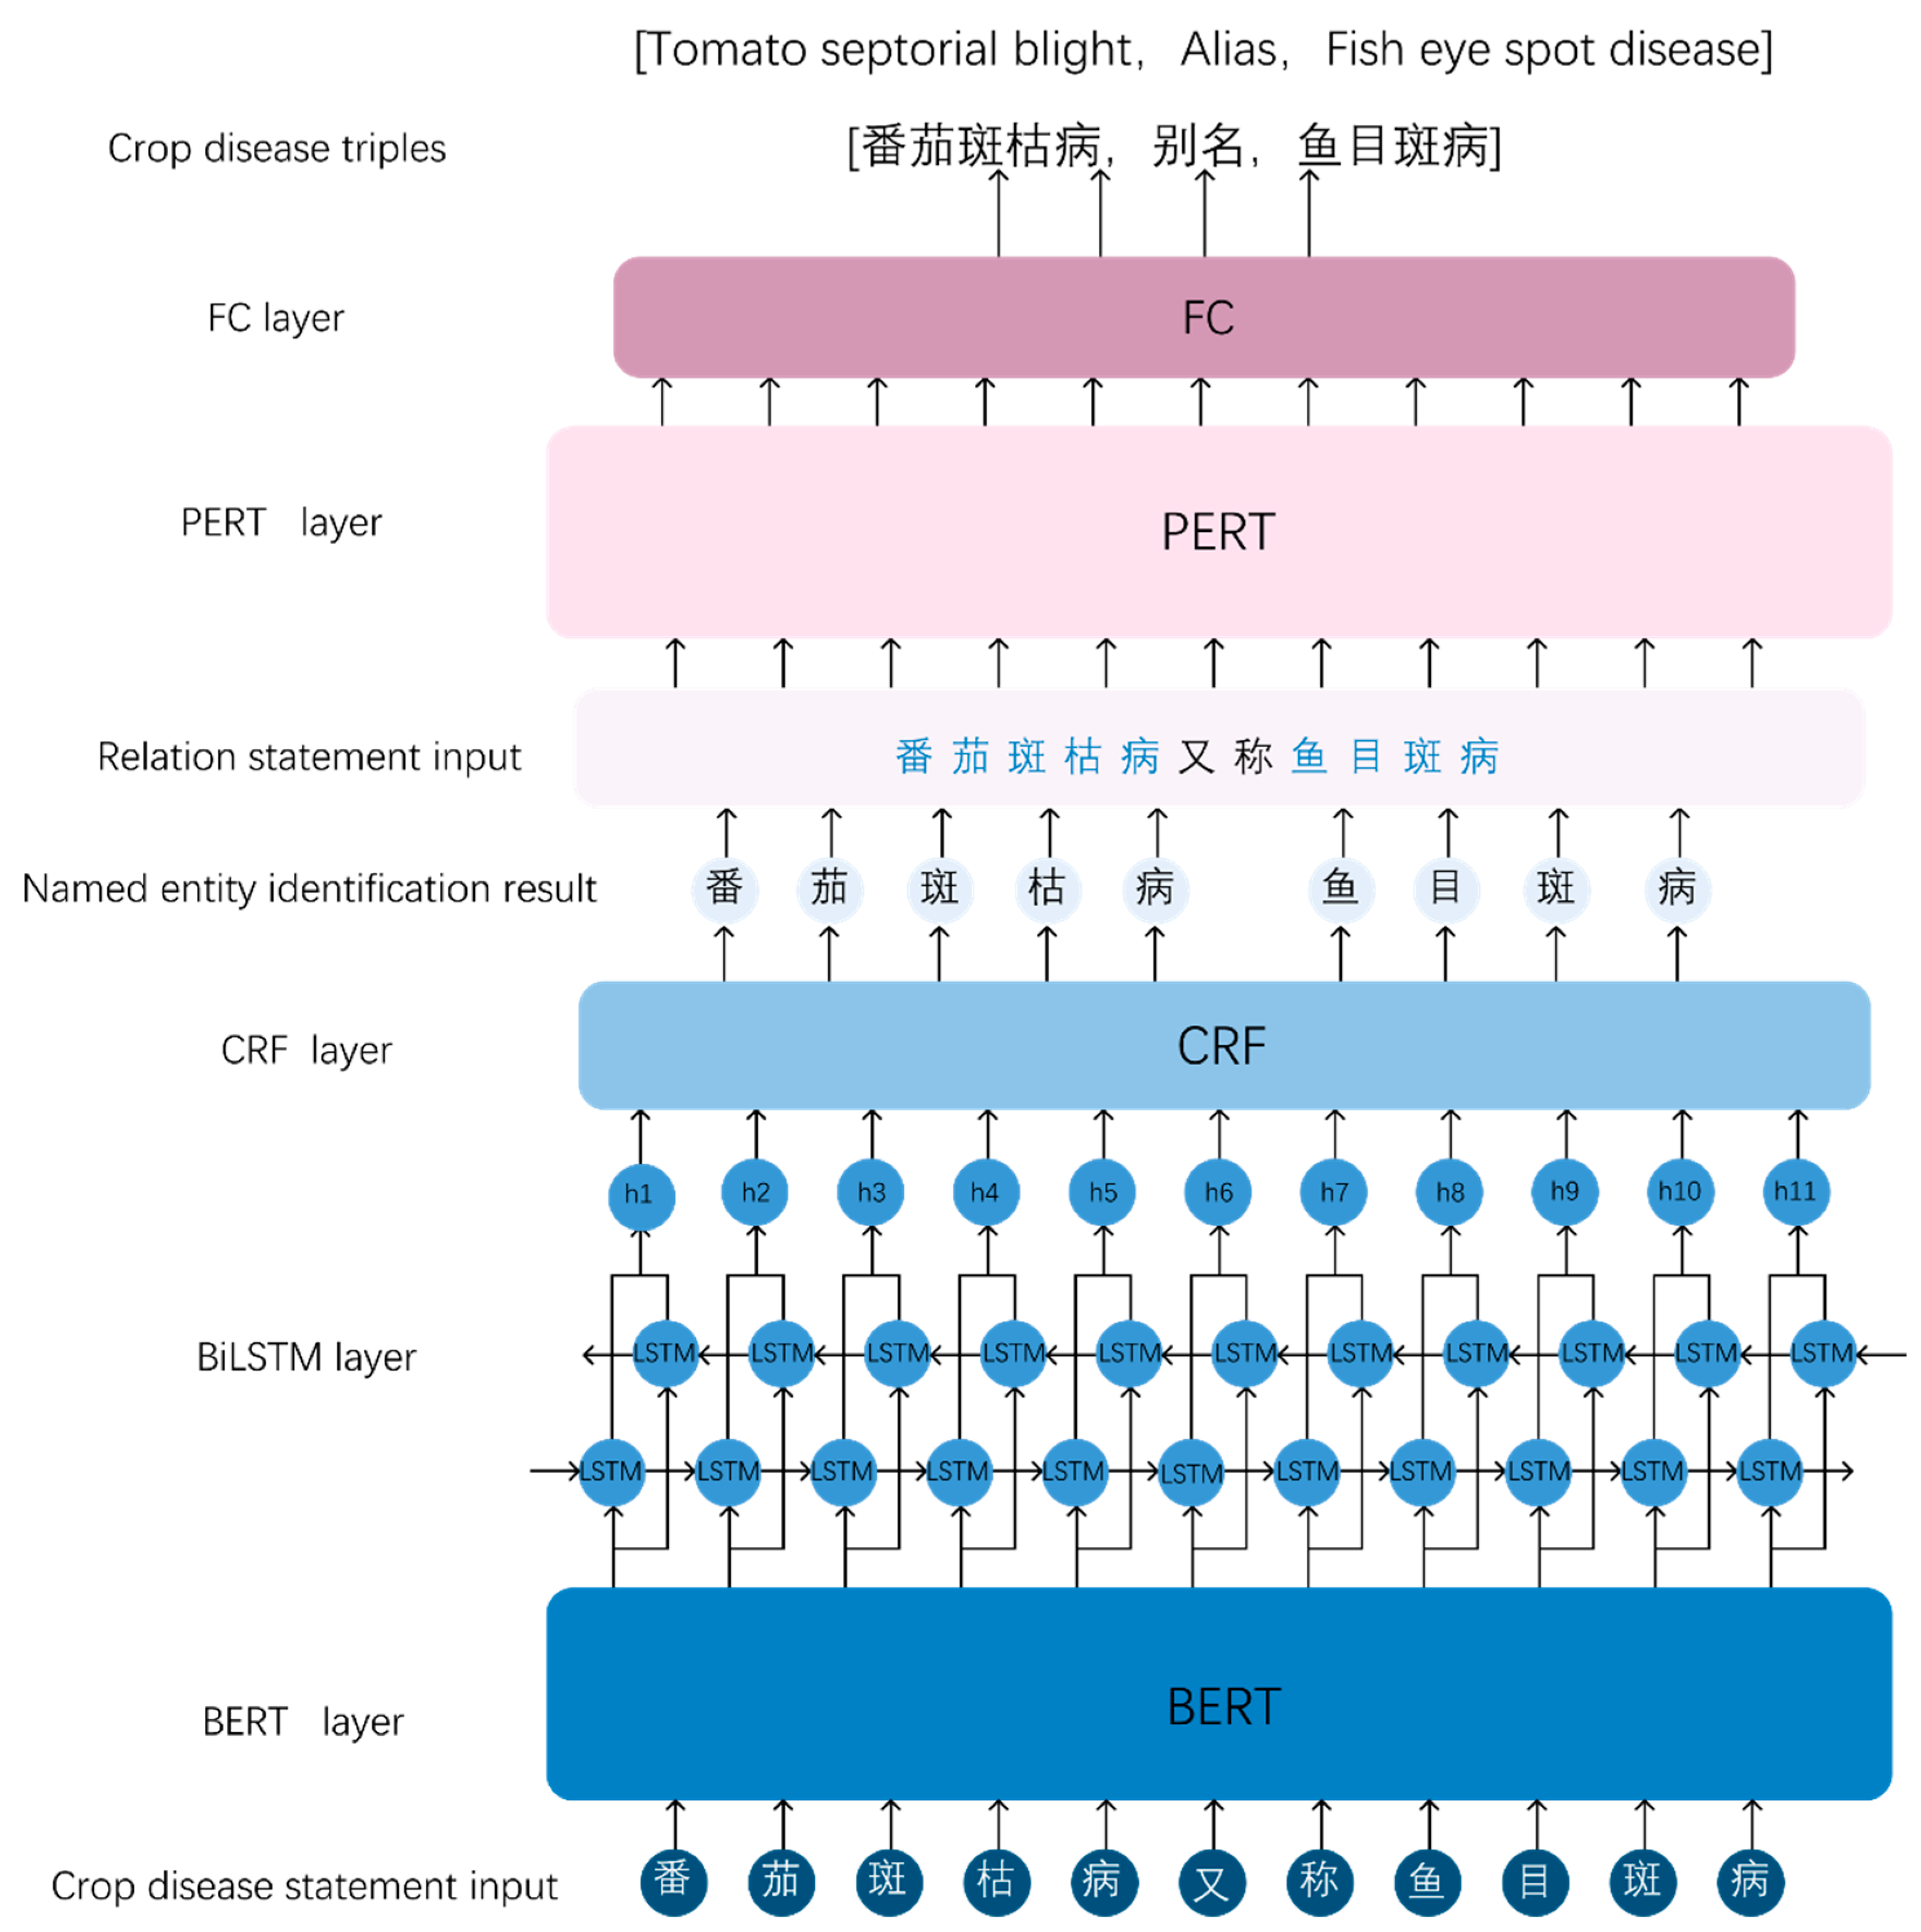
The BBCPF model proposed in this paper consisted of two parts, i.e., the named-entity recognition part and the relation extraction part. More specifically, the named-entity recognition part was composed of three modules: BERT [
17], BiLSTM, and CRF [
18]; the relation extraction part was composed of the PERT [
19] module and FC module. The detailed process is as follows: input a sentence in the disease knowledge corpus into BERT for dynamic vector representation; input the encoded data into the BiLSTM layer to learn long-distance text information; CRF obtains the globally optimal labeling sequence and outputs the entities contained in the sentence; the entities are classified as subjects and objects and are input into the PERT layer combined with the disease sentence; PERT extracts the contextual features of the relation data and outputs the encoding results to the FC layer; finally, the FC layer outputs the crop disease triples. The model structure is illustrated in
Figure 1.
2.1.1. BERT
BERT is the acronym of Bidirectional Encoder Representations from the Transformer, which is a pre-trained language representation model for natural language processing. Its main structure is an encoder of a deep bidirectional Transformer model. Recent studies suggest that the learning of widely applicable word embedding representations is an integral part of a modern NLP system. The pre-trained word embedding representations are more conducive to improving the performance of subsequent tasks than the conventional one-hot encoding input. At present, Word2Vec is the most widely used model. However, as a static word vector pre-training model, its word vectors are fixed, unable to solve the problem of polysemy and take into account the contextual information of a sentence. In the crop disease domain, an entity may have different meanings in different contexts. For example, “black hair” is an alias for tomato leaf mold, but it can also be a manifestation of the disease in a different context. The BERT model is supplemented with position encoding and the multi-head labeling mechanism to solve the above problems, which greatly improves the performance of the pre-training model.
The BERT vector representation is composed of three parts, namely, Token Embedding, Segment Embedding, and Position Embedding, as shown in
Figure 2. Token Embedding represents a word vector; Segment Embedding encodes a sentence to describe the global semantic information of the text; and Position Embedding encodes the position information and records the word sequence in order to distinguish the same character or word in different positions. The addition of the 3 vectors forms the final vector for each token.
The Transformer [
20] is the core module of BERT, while self-attention is a key part of Transformer, as shown in Equation (1). In this paper, the Transformer uses self-attention, instead of the traditional Recurrent Neural Network (RNN), to model a piece of text completely based on the attention mechanism.
where
refers to the query;
refers to the key; and
refers to the value. The principle of this method is to firstly calculate the interrelation between each word and all the other words in a sentence, which reflects the relevance and importance of different words in the sentence. The interrelation is utilized to adjust the importance of each word in order to obtain a new expression for the word and capture the relation between one word and other words. To solve the degradation problem in deep learning, the Transformer encoding unit is further supplemented with a residual network and the layer normalization operation. Its structure is shown in
Figure 3.
BERT builds a language model mainly through two pre-training methods: MASKED LM and Next-Sentence Prediction. Method 1: MASKED LM is used to mask or replace any character or word in a sentence and then let the model predict the masked or replaced part based on the contextual information. Its specific operation is to randomly mask 15% of the words as training samples, among which 80% are replaced with mask tokens, 10% are replaced with any other words, and 10% remain unchanged. Method 2: Next-Sentence Prediction is used to pre-train a two-category model to learn the relation between sentences. Its specific process is to randomly replace some sentences and then use the previous sentence to perform IsNext/NotNext prediction.
2.1.2. BiLSTM
Long Short-Term Memory (LSTM), which is a type of RNN, is an improved model proposed by Hochreiter et al. [
21] in 1997 to address the problems of gradient disappearance and gradient explosion of the RNN model. The LSTM model encodes sentences in a forward manner, so it can only grasp the contextual information from front to back but cannot encode the information from back to front. For the above problem, the forward LSTM and backward LSTM can be combined into a BiLSTM (Bi-directional Long Short-Term Memory) model to better capture the bidirectional semantic dependency. The diagram of the LSTM structure is shown in
Figure 4, and the internal equations of LSTM are shown by Equations (2)–(7).
where
σ refers to the Sigmoid function, which outputs a value in (0,1);
represents the dot product;
,
,
and
represent the input gate, forget gate, output gate, and memory unit at time
t, respectively;
represents the output at the previous time of
t;
represents the network input at time
t; and
W and
b represent the weight matrix and bias vector, respectively, of the input gate, forget gate, and output gate.
BiLSTM is composed of the forward LSTM and the backward LSTM. Therefore, the output of BiLSTM at time
t is
ht, as shown in Equation (8).
2.1.3. Conditional Random Field
Because BiLSTM only considers the long-distance text information but not the relation between adjacent labels, the Conditional Random Field (CRF) is used to correct the output of the BiLSTM layer to obtain the globally optimal labeling sequence with the largest probability. For the specified input sequence
, the corresponding labeling sequence is
, and the labeling sequence
score can be calculated by Equation (9).
where the transition matrix element
represents the probability of labeling transition from
to
;
represents the probability that the
i-th word labeled as
. The Softmax function is used to normalize
to obtain the probability distribution of the labeling sequence Y. Finally, the Viterbi algorithm [
22] is employed to obtain the optimal labeling sequence y* of the
, as shown in Equation (10).
2.1.4. PERT
PERT refers to the Permuted Language Model proposed by the Harbin Institute of Technology iFLYTEK Lab in 2022, which has achieved excellent results in certain NLP tasks. The core of PERT is to develop diverse pre-training tasks rather than mask variants of the language model, thereby converting the mask prediction task in the MLM language model to a word sequence prediction task. The main idea behind this method is that when people are reading, some words in the sentence are out of order, but this problem does not affect our understanding of the sentence. Based on this idea, the words in a sentence are scrambled to allow the model to learn the contextual representations of the sentence and predict the original position of a word.
The model structure of PERT (
Figure 5) is basically the same as that of BERT. A slight difference lies in the input and the prediction target during the pre-training stage. The main features of PERT are as follows: no NSP task is used; the disordered candidate tokens are selected through whole-word masking and N-gram masking strategies; the prediction space is based on the length of the input sequence rather than the entire vocabulary; the probability of a disordered candidate token is 15%, and the truly disordered sequences only account for 90% of the total candidate tokens, while the rest 10% remain unchanged; the disordered language model is used as a pre-training task, and the prediction target is the original position of the word; and due to the same structure as BERT, the PERT model can be replaced by the BERT model for downstream pre-training.
In the crop disease domain as concerned in this paper, it is found that the performance of PERT in named-entity recognition was slightly worse than that of BERT. This is because the labeled entities in the crop disease domain account for a larger proportion in a sentence, so that the arrangement of words may lead to changes in the meaning of the sentence. However, for the relation data, labels account for a smaller proportion in a sentence. Thus, compared with MLM, the PerLM model is more suitable for the relation data. The crop disease domain entities are complex and may involve boundary problems. The PerLM model supplemented with whole-word masking and N-gram masking makes PERT more sensitive to word/phrase boundaries. Therefore, in this paper, the relation data of crop diseases was extracted by using PERT as the encoder and the fully connected layer as the decoder.
2.2. Dataset Construction
2.2.1. Data Acquisition
Knowledge data from agricultural technology websites (lightweight crawler frame Scrapy [
23]) and professional books (through manual extraction), such as Baidu Encyclopedia, CNHNB.com, Vegetable Disease and Pest Control Manual, and Primary Color Map of Vegetable Pests and Diseases in China (Sequel), was collected and preprocessed for data cleaning, de-noising, and de-redundancy. Then, the named entities were categorized by referring to Baidu Encyclopedia combined with advice from domain experts. The YEDDA [
24] tool was used to label the data to establish the crop disease entity corpus dataset, which contained 3000 sentences and 125,679 characters. The entity recognition model was used for named-entity recognition, and the entities were further corrected manually to create the crop disease relation corpus dataset, which contained 2700 sentences.
2.2.2. Data Labeling
The named-entity recognition corpus dataset contained a total of eight labeling categories and 9227 entities (see
Table 1).
The BIOES labeling system was adopted in this study, where “B” represents the starting position of the entity; “I” represents the interior of the entity; E represents the end position of the entity; “S” represents a single character entity; and “O” represents a non-entity.
Figure 6 shows an example of named-entity recognition labeling.
The relation corpus dataset contained a total of 14 categories of relations. The specific categories and the number of triples are shown in
Table 2, and
Figure 7 shows an example of relation labeling.
Compared with the existing studies [
12,
13,
14], the disease knowledge corpus established in this paper was supplemented with the labeling information of disease features, control methods, and pathogenic factors, so that the labeling granularity was much finer. A finer-grained corpus contains richer knowledge. On the one hand, it can reduce the workload of domain experts in manually compiling the rules for information extraction; on the other hand, it provides more comprehensive knowledge for downstream applications such as disease recognition and question answering. Below are some examples:
- (1)
Features of cucumber target spot characteristics: a round or irregular shape; easy to perforate; rough and uneven; brown; gray-white at the center area; and translucent.
- (2)
Control methods: agricultural control; chemical control.
- (3)
Pathogenic factors: environmental factors; cultivation factors.
The knowledge above can not only provide knowledge, reasoning, support and interpretability for disease diagnosis but also achieve the purposes of identifying disease categories, providing prevention methods, and tracing pathogenic factors. Compared with a general domain, the entities in the crop disease domain are more specialized and are featured by multiple nesting, symbol interval, and long length. Therefore, the entity-labeling process must take into account the special characteristics of each crop disease in order to determine the entity boundaries. For example, tomato powdery mildew and cucumber powdery mildew are actually the same disease that occurs on different crops and should be labeled in the form of “crop name + disease name”.
3. Results
All the experiments were carried out in the Ubuntu (version 20.04) environment. Other hardware configurations were as follows: processor: Intel core i9-10920X; memory: 256G; and graphics card: GeForce RTX 3090. The deep learning framework Pytorch (version 1.7.0), combined with Cuda (version 11.0), was employed for model training.
3.1. Evaluation Indicators
In order to test the performance of different algorithms, the Precision, Recall, and F1-score were selected as evaluation indicators in this paper, which are defined as
Only when the entity boundary identified by the model is consistent with the true boundary, the named-entity recognition is judged correct. If the relation category and the head and tail entities are both correct, the extracted relation is considered correct.
3.2. Named Entity Recognition
This section focuses on the named-entity recognition part. The BERT-BiLSTM-CRF model was adopted, with the BERT version of BERT-base-Chinese, which consists of 12 Transformer layers, 768-dimensional hidden layers, and a 12-head multi-head attention mechanism. The other parameters are shown in
Table 3.
Table 4 shows the entity recognition results by BERT-BiLSTM-CRF. It can be seen that the recognition of Factor, Method, Period, Feature, and Crop was lower than that on other entities. By adding the labels of Method, Feature, and Factor, the recognition granularity in this study was much finer. The three label categories above are all characterized by long content and multiple nesting, leading to unsatisfactory recognition results. In addition, the low R of Crop and Period is attributed to two factors: (1) the nesting with other entity types and non-entity content (e.g., cucumber and cucumber powdery mildew; seedling period and early disease period), and (2) a small number of entities.
The control group for the entity recognition part consists of BiLSTM-CRF [
25], BERT, BERT-BiLSTM, BERT-CRF, BERT-BiLSTM-CRF, RoBERT-BiLSTM-CRF [
26], and PERT-BiLSTM-CRF. Their Precision, Recall, and F1-Score values are shown in
Table 5.
For the comparison of different embedding vector models, BiLSTM-CRF is a classic model for named-entity recognition that uses Word2Vec for the training purpose to obtain word vectors. BERT-BiLSTM-CRF incorporates a BERT pre-training model based on the classic model to represent the input sequence as a vector. Compared with BiLSTM-CRF, the Precision, Recall, and F1-Score of BERT-BiLSTM-CRF were improved by 13.7%, 5.8%, and 9.64%, respectively, on the crop disease domain dataset. It is proven that the BERT model can fully extract character-level features and dynamically adjust the vector representations of characters according to the contextual semantic environment. This ensures the model to accurately express the meaning in the current environment, thereby improving the generalization ability and the entity recognition results of the model. After adding BERT into the bottom layer of different benchmark models, the performance of BERT, BERT-BiLSTM, BERT-CRF, and BERT-BiLSTM-CRF was compared, and BERT-BiLSTM-CRF achieved the best results. Then, on the basis of BERT-BiLSTM-CRF, BERT was further replaced by ROBERT and PERT, and it is found that PERT-BiLSTM-CRF had a higher Precision on the crop disease dataset. However, according to the overall F1-Score, the recognition results of BERT-BiLSTM-CRF were the best.
3.3. Relation Extraction
This section focuses on the relation extraction part. The PERT-FC model was adopted, with the PERT version of Chinese-PERT-base, which consists of 12 Transformer layers, 768-dimensional hidden layers, and a 12-head multi-head attention mechanism. Other parameters are shown in
Table 6.
Table 7 shows the relation recognition results by the PERT-FC model. It can be seen that the extraction result of causes was worse than that of other relation categories. This is because the relation entity of disease features can be easily confused with the relation entity of causes and because the causes category has a small number of samples.
The control group for relation extraction consists of RNN [
27], CNN [
28], BiRNN [
29], PCNN [
30], BERT-FC, ROBERT-FC, and PERT-FC models. Their Precision, Recall, and F1-Score values are shown in
Table 8.
The optimal results of the RNN, CNN, BiRNN, and PCNN models were obtained when the batch size was set to 8 and epoch was set to 60. Compared with mainstream relation-extraction models, including RNN, CNN, BiRNN, and PCNN, PERT-FC achieved better results on the self-built crop disease domain dataset. Specifically, compared with the best performer of the control group, i.e., PCNN, the Precision, Recall, and F1-Score values of PERT-FC improved by 17.95%, 14.89%, and 16.42%, respectively. Compared with BERT-FC and RoBERT, the PERT-FC model had the highest Precision and F1-Score value, while its Recall value was only 0.03% lower than that of BERT-FC. Overall, the PERT-FC model is more suitable for relation extraction on the self-built crop disease domain dataset.
3.4. Knowledge Graph
Finally, the extracted crop disease triples were imported into the neo4j [
31] graph database for storage to complete the construction of the crop disease domain knowledge graph, as shown in
Figure 8. After visualization, a final assessment of the quality of named-entity recognition and relation extraction was performed by plant protection experts. As a structured semantic knowledge base, the knowledge graph evaluated by experts is widely used in various tasks such as intelligent question answering, dialogue generation, and personalized recommendation in the field of agricultural diseases.
4. Conclusions
At present, the research on the construction of crop disease domain knowledge graphs is still in an early stage; it involves multiple problems such as lack of public datasets, the disordered management of crop disease knowledge, weak correlation, and difficulty in knowledge sharing. In this paper, a fine-grained crop disease corpus dataset was established by crawling agricultural technology websites and manually extracting data from professional books. Then, the entity-relation-extraction models BERT-BiLSTM-CRF and PERT-FC were proposed, respectively, which were combined in the form of an assembly line to create the triple-extraction model BBCPF. According to the experimental results, the Precision, Recall, and F1-Score values of the named-entity recognition part reached 85.63%, 79.46%, and 82.43% respectively, and those of the relation extraction part reached 97.96%, 98.43%, and 98.16%, respectively. Finally, the triples were displayed in a visualized form. This paper provides an effective method for the key information extraction task in the construction of Chinese crop disease domain knowledge graphs. As the model was built in the form of an assembly line, although it has a high flexibility, the problem of error propagation might be involved. In addition, the entity recognition and relation extraction are executed independently, so there is a lack of interaction between each other. Due to the limitation in data collection budget, the crop disease domain corpus dataset established in this paper is small in scale, which restricts the application scope of the knowledge graph to a certain extent. Therefore, future work, on the one hand, can focus on the method of joint-entity extraction to overcome the shortcomings of the assembly line method and, on the other hand, can also enrich the entity-relation categories and expand the coverage and scale of the corpus dataset to improve the performance of the knowledge graph.
Author Contributions
W.Z.: writing—original draft preparation; C.W. and H.W.: writing—reviewing and editing; C.Z.: methodology; G.T.: supervision, data curation; S.H.: visualization, software; and Z.L.: investigation, validation. All authors have read and agreed to the published version of the manuscript.
Funding
This research was funded by National Key Research and Development Program of China, grant number 2020YFD1100204; in part by the Natural Science Foundation of Hebei province, grant number F2022204004; and in part by the Hebei Province Key Research and Development Program, grant number 20327402D, 19227210D.
Institutional Review Board Statement
Not applicable.
Informed Consent Statement
Not applicable.
Data Availability Statement
Not applicable.
Acknowledgments
We are grateful to our colleagues at Hebei Key Laboratory of Agricultural Big Data and National Engineering Research Center for Information Technology in Agriculture for their help and input, without which this study would not have been possible.
Conflicts of Interest
The authors declare no conflict of interest.
References
- Pujara, J.; Miao, H.; Getoor, L.; Cohen, W. Knowledge graph identification. In Proceedings of the International Semantic Web Conference, Sydney, Australia, 21–25 October 2013; Springer: Berlin/Heidelberg, Germany, 2013; pp. 542–557. [Google Scholar]
- Liu, Q.; Li, Y.; Duan, H.; Liu, Y.; Qin, Z. Knowledge Graph Construction Techniques. J. Comput. Res. Dev. 2016, 53, 582–600. [Google Scholar]
- Zhang, J.; Zhang, X.; Wu, C.; Zhao, Z. Survey of Knowledge Graph Construction Techniques. Comput. Eng. 2022, 48, 23–37. [Google Scholar] [CrossRef]
- Auer, S.; Bizer, C.; Kobilarov, G.; Lehmann, J.; Cyganiak, R.; Ives, Z. Dbpedia: A nucleus for a web of open data. In The Semantic Web; Springer: Berlin/Heidelberg, Germany, 2007; pp. 722–735. [Google Scholar]
- Bollacker, K.; Evans, C.; Paritosh, P.; Sturge, T.; Taylor, J. Freebase: A collaboratively created graph database for structuring human knowledge. In Proceedings of the 2008 ACM SIGMOD International Conference on Management of Data, Vancouver, Canada, 9–12 June 2008; pp. 1247–1250. [Google Scholar]
- Niu, X.; Sun, X.; Wang, H.; Rong, S.; Qi, G.; Yu, Y. Zhishi. me-weaving Chinese linking open data. In Proceedings of the International Semantic Web Conference, Bonn, Germany, 23–27 October 2011; Springer: Berlin/Heidelberg, Germany, 2011; pp. 205–220. [Google Scholar]
- Bodenreider, O. The unified medical language system (UMLS): Integrating biomedical terminology. Nucleic Acids Res. 2004, 32 (Suppl. S1), D267–D270. [Google Scholar] [CrossRef]
- Li, F.-L.; Chen, H.; Xu, G.; Qiu, T.; Ji, F.; Zhang, J.; Chen, H. In AliMeKG: Domain knowledge graph construction and application in e-commerce. In Proceedings of the 29th ACM International Conference on Information & Knowledge Management, Virtual Event, Ireland, 19–23 October 2020; pp. 2581–2588. [Google Scholar]
- Liu, Y.; Li, H. Survey on Domain Knowledge Graph Research. Comput. Syst. Appl. 2020, 29, 1–12. [Google Scholar] [CrossRef]
- Ruan, T.; Wang, M.; Wang, H.; Hu, F. Research on the construction and application of vertical knowledge graphs. Knowl. Manag. Forum 2016, 1, 226–234. [Google Scholar]
- Wang, G.; Wang, Y.; Yang, G.; Wang, Y.; Zhou, X. Frontiers in scientific issues of controlling agricultural pests and diseases by environmental-friendly methods. Bull. Natl. Nat. Sci. Found. China 2020, 34, 374–380. [Google Scholar]
- Wu, S.; Zhou, A.; Xie, N.; Liang, X.; Wang, H.; Li, X.; Chen, G. Construction of visualization domain-specific knowledge graph of crop diseases and pests based on deep learning. Trans. Chin. Soc. Agric. Eng. 2020, 36, 177–185. [Google Scholar]
- Zhao, P.; Zhao, C.; Wu, H.; Wang, W. Recognition of the agricultural named entities with multi-feature fusion based on BERT. Trans. Chin. Soc. Agric. Eng. 2022, 38, 112–118. [Google Scholar]
- Li, Y. Research on the Construction of Knowledge Graph of Crop Diseases and Pests. Master’s Thesis, Chinese Academy of Agricultural Sciences, Beijing, China, 2021. [Google Scholar]
- Wu, Q. Design and Implmentation of Agriculture Intelligent Q&A System Based on Knowledge Graph. Master’s Thesis, Xiamen University, Xiamen, China, 2019. [Google Scholar]
- Guo, X.; Zhou, H.; Su, J.; Hao, X.; Tang, Z.; Diao, L.; Li, L. Chinese agricultural diseases and pests named entity recognition with multi-scale local context features and self-attention mechanism. Comput. Electron. Agric. 2020, 179, 105830. [Google Scholar] [CrossRef]
- Devlin, J.; Chang, M.-W.; Lee, K.; Toutanova, K. Bert: Pre-training of deep bidirectional transformers for language understanding. arXiv 2018, arXiv:1810.04805. [Google Scholar]
- Lafferty, J.; McCallum, A.; Pereira, F.C. Conditional Random Fields: Probabilistic Models for Segmenting and Labeling Sequence Data. In Proceedings of the 18th International Conference on Machine Learning, Williamstown, MA, USA, 28 June–1 July 2001; pp. 282–289. [Google Scholar]
- Cui, Y.; Yang, Z.; Liu, T. PERT: Pre-training BERT with permuted language model. arXiv 2022, arXiv:2203.06906. [Google Scholar]
- Vaswani, A.; Shazeer, N.; Parmar, N.; Uszkoreit, J.; Jones, L.; Gomez, A.N.; Kaiser, Ł.; Polosukhin, I. Attention is all you need. In Proceedings of the 31st Conference on Neural Information Processing Systems, Long Beach, CA, USA, 4–9 December 2017; pp. 5998–6008. [Google Scholar]
- Hochreiter, S.; Schmidhuber, J. Long short-term memory. Neural Comput. 1997, 9, 1735–1780. [Google Scholar] [CrossRef] [PubMed]
- Strubell, E.; Verga, P.; Belanger, D.; McCallum, A. Fast and accurate entity recognition with iterated dilated convolutions. arXiv 2017, arXiv:1702.02098. [Google Scholar]
- Wang, J.; Guo, Y. In Scrapy-based crawling and user-behavior characteristics analysis on Taobao. In Proceedings of the 2012 International Conference on Cyber-Enabled Distributed Computing and Knowledge Discovery, Sanya, China, 10–12 October 2012; pp. 44–52. [Google Scholar]
- Yang, J.; Zhang, Y.; Li, L.; Li, X.J. YEDDA: A lightweight collaborative text span annotation tool. arXiv 2017, arXiv:1711.03759. [Google Scholar]
- Huang, Z.; Xu, W.; Yu, K. Bidirectional LSTM-CRF models for sequence tagging. arXiv 2015, arXiv:1508.01991. [Google Scholar]
- Liu, Y.; Ott, M.; Goyal, N.; Du, J.; Joshi, M.; Chen, D.; Levy, O.; Lewis, M.; Zettlemoyer, L.; Stoyanov, V. Roberta: A robustly optimized bert pretraining approach. arXiv 2019, arXiv:1907.11692. [Google Scholar]
- Zaremba, W.; Sutskever, I.; Vinyals, O. Recurrent neural network regularization. arXiv 2014, arXiv:1409.2329. [Google Scholar]
- Zeng, D.; Liu, K.; Lai, S.; Zhou, G.; Zhao, J. In Relation classification via convolutional deep neural network. In Proceedings of the COLING 2014, the 25th International Conference on Computational Linguistics: Technical Papers, Dublin, Ireland, 23–29 August 2014; pp. 2335–2344. [Google Scholar]
- Schuster, M.; Paliwal, K.K. Bidirectional recurrent neural networks. IEEE Trans. Signal Process. 1997, 45, 2673–2681. [Google Scholar] [CrossRef] [Green Version]
- Zeng, D.; Liu, K.; Chen, Y.; Zhao, J. Distant supervision for relation extraction via piecewise convolutional neural networks. In Proceedings of the 2015 Conference on Empirical Methods in Natural Language Processing, Lisbon, Portugal, 17–21 September 2015; pp. 1753–1762. [Google Scholar]
- Miller, J.J. Graph database applications and concepts with Neo4j. In Proceedings of the Southern Association for Information Systems Conference, Atlanta, GA, USA, 23–24 March 2013. [Google Scholar]
Figure 1.
Triple-extraction model. Example “番茄斑枯病又称鱼目斑病” (this means that tomato septorial blight is also known as fish eye spot disease).
Figure 1.
Triple-extraction model. Example “番茄斑枯病又称鱼目斑病” (this means that tomato septorial blight is also known as fish eye spot disease).
Figure 2.
Input representations of the BERT model. Example “番茄斑枯病又称鱼目斑病” (this means that tomato septorial blight is also known as fish eye spot disease). Note: (CLS) locates the starting position of the sequence; (SEP) identifies the segmentation between sentences; and (ei) represents the embedded features of each character.
Figure 3.
Transformer structure.
Figure 3.
Transformer structure.
Figure 4.
The LSTM structure.
Figure 4.
The LSTM structure.
Figure 5.
Neural architecture of PERT. Example “我喜欢吃苹果,他也是” (this means ”I love eating apples, and so does he”).
Figure 5.
Neural architecture of PERT. Example “我喜欢吃苹果,他也是” (this means ”I love eating apples, and so does he”).
Figure 6.
An example of named-entity recognition labeling. Example “黄瓜白粉病主要危害叶片, 也危害叶柄和茎” (this means that the cucumber powdery mildew mainly harms the leaves, as well as the petioles and stems).
Figure 6.
An example of named-entity recognition labeling. Example “黄瓜白粉病主要危害叶片, 也危害叶柄和茎” (this means that the cucumber powdery mildew mainly harms the leaves, as well as the petioles and stems).
Figure 7.
An example of relation labeling. Example “番茄细菌性斑疹病的农业防治方法主要有加强检疫, 防止带菌种子传入非疫区” (this means that the agricultural prevention and control methods of tomato bacterial leaf spot mainly include strengthening quarantine and preventing the introduction of bacterial seeds into non-epidemic areas).
Figure 8.
Crop disease domain knowledge graph.
Figure 8.
Crop disease domain knowledge graph.
Table 1.
Labels for named-entity recognition.
Table 1.
Labels for named-entity recognition.
| Category | Entity | Label |
|---|
| Disease name | Tomato leaf blight, tomato virus disease | Disease |
| Crop name | Cucumber, tomato | Crop |
| Pathogen | Septoria lycopersici Speg | Pathogeny |
| Disease features | Yellow-brown necrotic spots | Feature |
| Affected region | Middle and lower reaches of the Yangtze River | Region |
| Disease period | Seedling stage, fruit setting stage | Period |
| Control method | Rotation | Method |
| Pathogenic factors | Poor irrigation and drainage, dense planting | Factor |
Table 2.
Relation categories.
Table 2.
Relation categories.
| Category | Number of Triples | Category | Number of Triples |
|---|
| Unknown | 120 | Disease period | 71 |
| Alias | 34 | Similar diseases | 17 |
| Disease features | 654 | Chemical control | 42 |
| Pathogen | 145 | Agricultural control | 189 |
| Causes | 145 | Environmental factors | 296 |
| Affected region | 141 | Cultivation factors | 258 |
| Damaged sites | 513 | | |
| Affected plants | 125 | | |
Table 3.
Parameter settings.
Table 3.
Parameter settings.
| Parameter | Value/Algorithm |
|---|
| Maximum sequence length | 256 |
| Epoch | 50 |
| Batch size | 32 |
| Gradient descent algorithm | AdamW |
| Dropout | 0.3 |
| BERT learning rate | 0.00003 |
| BiLSTM learning rate | 0.0003 |
| CRF learning rate | 0.03 |
| No. of LSTM hidden layer | 128 |
Table 4.
Entity recognition results.
Table 4.
Entity recognition results.
| Entity Name | Precision | Recall | F1-Score |
|---|
| Factor | 79% | 87% | 83% |
| Method | 77% | 81% | 79% |
| Region | 90% | 92% | 91% |
| Pathogeny | 86% | 88% | 87% |
| Period | 92% | 59% | 72% |
| Feature | 84% | 76% | 80% |
| Crop | 97% | 64% | 77% |
| Disease | 99% | 93% | 96% |
Table 5.
Comparison of named-entity recognition experiment results.
Table 5.
Comparison of named-entity recognition experiment results.
| Models | Precision | Recall | F1-Score |
|---|
| BilSTM-CRF | 71.93% | 73.66% | 72.79% |
| BERT | 85.15% | 77.48% | 81.13% |
| BERT-BiLSTM | 85.33% | 78.11% | 81.56% |
| BERT-CRF | 84.86% | 79.28% | 81.97% |
| BERT-BiLSTM-CRF | 85.63% | 79.46% | 82.43% |
| RoBERT-BiLSTM-CRF | 85.19% | 77.75% | 81.30% |
| PERT-BiLSTM-CRF | 85.76% | 79.19% | 82.34% |
Table 6.
Parameter settings.
Table 6.
Parameter settings.
| Parameter | Value/Algorithm |
|---|
| Maximum sequence length | 256 |
| Epoch | 15 |
| Batch size | 8 |
| Gradient descent algorithm | Adam |
| Dropout | 0.3 |
| PERT learning rate | 0.00003 |
| Fully connected layer learning rate | 0.0003 |
Table 7.
Relation recognition results.
Table 7.
Relation recognition results.
| Relation Name | Precision | Recall | F1-Score |
|---|
| Unknown | 96% | 100% | 98% |
| Alias | 100% | 100% | 100% |
| Pathogen | 100% | 100% | 100% |
| Affected region | 100% | 100% | 100% |
| Affected plant | 100% | 100% | 100% |
| Similar diseases | 100% | 100% | 100% |
| Disease features | 98% | 99% | 98% |
| Damaged sites | 98% | 98% | 98% |
| Environmental factors | 97% | 97% | 97% |
| Causes | 94% | 86% | 90% |
| Disease period | 90% | 100% | 95% |
| Cultivation factors | 98% | 98% | 98% |
| Agricultural control | 100% | 100% | 100% |
| Chemical control | 100% | 100% | 100% |
Table 8.
Comparison of relation extraction results.
Table 8.
Comparison of relation extraction results.
| Models | Precision | Recall | F1-Score |
|---|
| RNN | 57.31% | 52.22% | 54.65% |
| CNN | 73.90% | 68.31% | 71.00% |
| BiRNN | 71.45% | 67.72% | 69.54% |
| PCNN | 80.01% | 83.54% | 81.74% |
| BERT-FC | 97.25% | 98.47% | 97.81% |
| RoBERT-FC | 96.78% | 97.39% | 97.04% |
| PERT-FC | 97.96% | 98.43% | 98.16% |
| Publisher’s Note: MDPI stays neutral with regard to jurisdictional claims in published maps and institutional affiliations. |
© 2022 by the authors. Licensee MDPI, Basel, Switzerland. This article is an open access article distributed under the terms and conditions of the Creative Commons Attribution (CC BY) license (https://creativecommons.org/licenses/by/4.0/).


 ,
, 


