Article

Species Choice Influences Weed Suppression, N Sharing and Crop Productivity in Oilseed Rape–Legume Intercrops

by
Elana Dayoub
1,
Guillaume Piva
1,
Steven J. Shirtliffe
2,
Joëlle Fustec
1,
Guénaëlle Corre-Hellou
1 and
Christophe Naudin
1,*
1
USC 1432 LEVA, École Supérieure des Agricultures (ESA), INRAE, SFR 4207 QUASAV, 55 rue Rabelais, F-49007 Angers, France
2
Department of Plant Sciences, College of Agriculture and Bioresources, University of Saskatchewan, Saskatoon, SK S7N 5A8, Canada
*
Author to whom correspondence should be addressed.
Agronomy 2022, 12(9), 2187; https://doi.org/10.3390/agronomy12092187
Submission received: 23 July 2022 / Revised: 30 August 2022 / Accepted: 8 September 2022 / Published: 15 September 2022

Abstract

:
Increasing crop trait diversity in oilseed rape (OR, Brassica napus L.) cropping systems by introducing frost-sensitive legume species could improve weed suppression and crop productivity. Intercrops and sole crops were compared over two years in the field in Western France. Winter OR was intercropped simultaneously with either spring faba bean (Vicia faba L.) or common vetch (Vicia sativa L.) in a row replacement design without herbicides. Each species was sown at 50% of the recommended sole crop density in alternate rows. Due to the high values of faba bean aboveground traits (height, leaf area, and biomass) and the strong competitive ability for soil N of OR, both species appeared complementary in resource utilization, and thus less soil N and light were available for weeds. The OR–faba bean intercrop was able to reduce weed biomass by 41% compared to the OR–common vetch intercrop. Furthermore, growth and competitive ability of OR for soil N were increased when intercropped with faba bean. Both grain yield and number per plant were three times higher in OR–faba bean intercrops compared to OR sole crops. Under high weed infestation, the presence of faba bean with OR reduced weed aboveground biomass by 35% and weed N accumulation by 11% compared to the OR sole crop. No change was observed in the weed community composition. We observed that a level of aboveground biomass greater than 2 t ha−1 and a soil N uptake at approximately 80 kg ha−1 was needed to reduce biomass and N content of weeds.

1. Introduction

Weed management using herbicides as the sole weed control tool is seriously being questioned due to environmental impacts, agrochemical costs and technical problems related to resistance in weed populations to one or several herbicides [1]. Winter oilseed rape (OR, Brassica napus L.) is the dominant oilseed crop in northern Europe and is known to require large amounts of nitrogen inputs for growth [2] and pesticides for managing several critical biotic factors. Weeds are one of the important factors limiting OR growth and grain yield. In France, where herbicide-tolerant OR is prohibited, the cost of herbicide treatments is the major component of a farmer’s total variable operating costs for winter OR [3]. Because of the difficulty to find selective post-emergence herbicides against dicotyledonous weeds in winter OR, weed infestation management is based mainly on pre-emergence herbicide applications as the systematic practice in France [4,5]. To increase the sustainability of cropping systems, new and innovative crop practices are required in order to both optimize OR performance and suppress weeds with less dependence on herbicides.
Several studies have examined crop–weed competition to identify the main functional traits involved in competitiveness against weeds. These studies have investigated plant functional traits relating mainly to competition for light such as height, leaf area, early growth and canopy closure [6,7]. In the current agricultural systems in Europe, fields consist mainly of one crop with low genetic and functional trait diversity. Intercropping, defined as the simultaneous growing of two or more crops in the same field for a significant period of time [8], can be a relevant practice to increase the diversity of functional traits. The combination of intercropped species with contrasting traits could thus increase the use of the available growth resources and increase the competitive ability of the mixture against weeds. Several studies have shown the effect of intercropping on weed suppression mainly in cereal–legume intercrops [9,10,11,12,13,14,15] and also in Brassicaceae–Fabaceae intercrops [16,17,18,19,20,21]. Nevertheless, assessment of the ability of the two intercropped species to acquire resources is lacking: the quantification of agronomic variables involved in resource acquisition would help to increase the understanding of the weed suppression effect and the variability of the response according to the chosen species.
OR and legumes differ in their morphological traits and ability to acquire resources. An OR sole crop is known to have a greater capacity to take up soil mineral N compared to legumes [22,23] due to its rapid and deep root growth [23,24]. Conversely, grain legume species are known to have a weaker need to take up soil mineral N than non-legumes due to their large seeds rich in N, low rooting depth penetration [25], and low soil N demand and ability to fix N2 from the atmosphere [23,26,27]. Moreover, some legume species are able to produce greater biomass than brassica species [22,28], which may improve competitive ability against weeds for light.
Intercropping OR with a legume may increase the diversity of functional traits in the field, and thus, the interspecific complementary combination can exploit growth resources (nitrogen and light) differently and more efficiently compared to OR sole crops. Therefore, intercropping may lead to less soil N and light available for weeds. Moreover, the choice of a legume species having very contrasting traits with OR should be a determining factor to increase the success of this practice. Indeed, there is a variability among legume species for both aboveground traits and their soil N uptake ability [27,29,30,31].
The complementarity between intercropping species may also increase crop growth and productivity, which is usually observed in intercrops based on legumes with non-legumes. This complementarity in the use of N sources is considered one of the main factors explaining the increase in crop productivity of intercrops compared to sole crops [32,33,34]. Legumes and non-legumes have the ability to take up soil N, but legumes also have the ability to use an additional source of N, N2 from the atmosphere, thus, increasing N accumulation in intercrops [22,35,36]. In Brassicaceae–Fabaceae intercrops, an increase in brassica biomass and N accumulation has previously been observed [22,37,38]. This intercropping effect can reinforce the competitive ability of the crops against weeds while improving crop productivity. However, the biggest challenge in intercropping systems is to ensure the complementarity between intercrops in order to maintain crop yield.
Previous studies showed that weed growth and weed density are influenced by the level of inorganic N in the soil as a function of weed species [39,40,41,42]. Moreover, the composition of a weed community is determined by environmental factors and competition between and within weeds and crops [43,44]. Soil N availability is also an important determinant of the weed community composition [45]. Thus, intercropping legume species with OR may change the use of available resources, which could modify the weed species community compared with sole crops. However, few studies have investigated this point in intercropping systems.
In the present study, OR is the main crop, and frost-sensitive legume species were introduced as service plants. The insertion of frost-sensitive legume species with OR has often been practised with an additive design [16,19,46], with intercropped OR sown at the same density as the sole crop. Recent literature studies by Gu et al. (2021; 2022) [47,48] showed that annual intercrops with an additive design resulted in stronger weed suppression than with a replacement design, but depending on how crops are arranged together and on involved species. Then, choice of intercropped species, relative sowing densities and spatial arrangement are key points concerning weed suppression. Moreover, these factors are determining for crop productivity in intercrops compared to sole crops [49,50,51,52].
We expected to favour and highlight the interspecific complementarity between OR and legume species thanks to a row replacement design, which may lead to both the suppression of weeds and the increase in OR productivity or at least the avoidance of yield loss by yield compensation ability of OR [53]. Indeed, our choice of a row replacement design facilitates the quantification of the complementarity for resources between intercropped species. Two legume species were chosen, known for their contrasting above and below-ground growth and N acquisition at the beginning of their crop cycle [17,27,47].
The objectives of this study were (i) to determine the ability of OR intercropped with faba bean (Vicia faba L.) or common vetch (Vicia sativa L.) to suppress weeds and (ii) to investigate the effects on OR productivity. The originality of this work is to study the intercropping effects in relation with the differences between species in aboveground growth and soil N uptake during the winter in a row replacement design. Two experiments were carried out in Western France under field conditions for two years in order to compare intercrops and sole crops without weeding.

2. Materials and Methods

2.1. Site Characteristics

Field experiments were carried out in 2013/14 and 2015/16 at the FNAMS (Fédération Nationale des Agriculteurs Multiplicateurs de Semences) experimental field station near Angers, France (47.5° N, 0.6° W). The experiment was conducted on a different field each year. In the ploughed layer (0–30 cm), the soil texture was a sandy clay in 2013/14 and a sandy loam clay in 2015/16. The main characteristics of each site are presented in Table 1 (AUREA Laboratory, Ardon, France). The mineral soil N content of representative soil samples from a 0–90 cm depth at sowing was measured via segmented flow analysis (Skalar Analytical B.V., Breda, Netherlands), which enables the determination of nitrate and ammonium contents by extraction with KCl. The soil contained 125 and 124 kg ha−1 KCl-extractable inorganic N in 2013/14 and 2015/16, respectively. The average annual temperature and precipitation were 11.2 °C and 565 mm (1993–2013), respectively. The environmental conditions during the experimental years are presented in Figure 1 (data provided by weather station of FNAMS). Rainfall and the number of cumulative degree-days between September and July were quite similar for both years. The number of days with a minimum average temperature lower than 0 °C was 19 and 32 days from November to April in 2013/14 and 2015/16, respectively. The previous crop was winter wheat (Triticum aestivum L.) for 2013/14 and winter barley (Hordeum vulgare L.) for 2015/16. Both previous crops were conducted under conventional conditions.

2.2. Experimental Design and Crop Management

Winter oilseed rape (OR, Brassica napus L.) was grown as a sole crop (SC) and intercropped (IC) with spring faba bean (Vicia faba L.) or common vetch (Vicia sativa L.). Faba bean and common vetch were also grown as sole crops.
Faba bean and common vetch were chosen for their contrasting ability for soil N uptake [27] and aboveground growth [54].
Intercrops were studied using a row replacement design; each species was sown at 50% of the recommended sole crop density in alternate rows (1 row of OR and 1 row of legume). The target seeding rates for winter OR (cv. Boheme), spring faba bean (cv. Divine) and common vetch (cv. Nacre) sole crops were 60, 46, and 90 seeds m−2, respectively. Actual densities were observed before winter (December) and after winter (February) on 1.05 m² area per replication. The experiments were arranged in a block design with four replicates. The size of each plot was 5 × 10 and 6.3 × 10 m in 2013/14 and 2015/16, respectively.
Soil preparation was carried out by ploughing, followed by harrowing. The crops were sown on 19 September in 2013 and on 8 September in 2015. For the intercrop treatments, the two species were sown simultaneously with a seed drill that allowed differential sowing depth for each species. The sowing depth was 2 cm for OR and common vetch and 4 cm for faba bean. Row spacing was 35 cm. Both IC and SC were irrigated one day after sowing at a rate of 15 mm for once to ensure homogeneous emergence.
All plots were supplied with 70 kg N ha−1 in the form of ammonium nitrate-based fertilizer (NH4NO3) applied in two applications (35 kg N ha−1 by application) after winter in February (stem elongation stage) and March (inflorescence emergence stage). This nitrogen fertilization rate was calculated according to the balance sheet method [55,56] for intercrops and based on the need of OR in intercrops. No application of P and K was achieved during both experiments. No weed control was performed. Pests and diseases were controlled with appropriate pesticides. Anti-slug treatments of ferric phosphate (Sluxx® HP, Certis Europe France; Guyancourt) were applied each year. In addition, the insecticide deltamethrin (Decis Protech Bayer SAS; 0.33 L ha−2) was applied in 2013/14, and the fungicide prothioconazole (Prosaro Bayer SAS; 1 L ha−1) was applied in 2015/16.

2.3. Sampling Measurements and Analytical Methods

Crop and weed biomass were harvested twice during the OR life cycle: prior (December) to and after winter (February) (Table 2). Plants were harvested from a 1.05 m² area (4 rows × 0.75 m) in both years within each plot. Total aboveground biomass included legume residues after the frost period. The green leaves were separated from the other parts of the plant for each species. The leaf area (LA) of the crops and weeds were determined for each sampling date, except at harvest, by measuring the green leaf area of 5 plants for cultivated crops and for all weeds present in the sampling area. Leaf area (LA) was measured using a LI3100 area metre (LI-COR Inc., Lincoln, NE, USA). In 2015/16, due to the destruction of leaves of faba bean and common vetch by frost damage and disease, leaf area was measured only before winter. Crop and weed samples were dried at 70 °C for 48 h. Samples harvested before and after winter were ground to measure N content (for weeds and crops) and the 15N:14N ratio (for legumes) in aboveground biomass using a CHN analyser (EA3000, Euro Vector, Milan, Italy) and a mass spectrometer (IsoPrime, Elementer, Hanau, Germany).
Crop height for five plants per harvested area was measured from the soil surface to the canopy height in the field. The density of both crops and weeds (for each species) was estimated on the same harvested areas before sampling and at each sampling date.
OR was harvested manually from a 1.05 m² area in both years within each plot. Yield and the yield components of OR (grain yield per hectare and per plant, weight per 1000 grains, number of grains per m², and number of grains per plant) were measured.

2.4. Calculations and Statistical Analysis

The nitrogen content in the crop and weed biomass was calculated as the product of aboveground biomass and %N content. The percentage of accumulated exogenous N derived from the atmosphere (%Ndfa) was determined using the 15N natural abundance method [58]. The OR sole crop was used as a reference crop to calculate N2 fixation in the legume species by using the following equation:
%Ndfa = 100 ∗ [(δ15NOR−δ15Nlegume)/(δ15NOR-β)],
where δ15Nlegume and δ15NOR are the natural 15N enrichment of the legume and OR sole crops, respectively.
The β value is the isotopic fractionation factor measured for each species from legumes grown in N-free conditions. β = −1.70 for faba bean shoots grown in N free medium [59], and β = −0.9 for common vetch [60].
The amount of N2 fixed was calculated as the product of aboveground biomass, %N content and the proportion of plant N derived from N2 fixation (%Ndfa). The amount of N derived from soil (Ndfs) was calculated as the difference between the aboveground N content and the amount of N2 fixed from the air.
The land equivalent ratio (LER) is defined as the relative land area required when growing sole crops to produce the yield achieved in an intercrop [61,62]. LER for an OR-legume intercrop is the sum of the partial LER values for OR (LEROR) and legume (LERL). LER was calculated for crop aboveground biomass and crop soil N uptake as follows:
LER = LEROR + LERL,
LEROR = ORIC/ORSC, LERL = LIC/LSC,
where OR and L are the assessed variables for OR and legumes, respectively, in the inter-cropped (IC) and sole-cropped (SC) designs. LER values higher than 1 indicate an advantage from intercropping compared to the respective sole crops in terms of crop aboveground biomass and crop soil N uptake.
The percentage of weed biomass in the total aboveground biomass (crops + weeds) was calculated in each treatment. The percentage of soil N accumulated by weeds in the total soil N accumulated by both weeds and crops was also calculated.
The species diversity of the weed community was assessed by calculating different indices at each sampling date. Species richness (S) was the mean number of species observed per treatment [63]. Shannon-Wiener’s indicator (H) was used to describe the diversity of the weed population using the following equation:
H   = ( p i   ln   p i   )   p i   = n i / N
where ni represents the number of observed individuals for one weed species, and N the total number of observed individuals per treatment. The value of H varied from 1 (low diversity) to 4 (high diversity).
The Simpson evenness index (D) was used as a measure of equitability of the weed population [63] and was calculated using the following equation:
D = 1 − ∑ (ni/N)2,
where the Simpson evenness index (D) varies from 0 (a very dominant weed species) to 1 (weed species are equally distributed).
The statistical analysis was conducted using the combined experimental years, except for weed variables and OR yield components, where the analyses were performed separately for each year. The effect of the different treatments on weeds (density, leaf area (LA), aboveground biomass and soil N uptake) was tested by a one-way analysis of variance (type III sum of squares; α = 0.05). To test for the normality of residues and homoscedasticity, the Shapiro–Wilk and Bartlett tests were used, respectively (α = 0.05). Means were compared using Tukey’s HSD test (Honest Significant Differences; α = 0.05). To meet the assumptions of ANOVA, weed proportion data were transformed using the arcsine square root transformation, whereas weed density and weed leaf area were squared and ln transformed, respectively, for the after-winter sampling date in 2013/14. All statistical analyses were performed using package R Commander in R software, v3.1.2 [64]. In addition, all figures representing our results were created using Systat SigmaPlot software (for Windows v14.5). We compared the ICs and SCs each year for several variables (crop traits and weed infestation) by radar plots (Microsoft Excel, 2021) using scores calculated for each variable and for each year separately through the minimum (min) and maximum (max) observed values as follows:
Score = 10 × (value − min)/(max − min),
where value refers to the measured variables for crop (height, dry matter and soil N uptake) and for weed (density, dry matter and soil N uptake).

3. Results

3.1. Comparison between Three Sole Crops (Oilseed Rape and Legumes) Growth and Soil N Uptake Ability

Significant differences were observed between SCs concerning crop growth and soil mineral N uptake before and after winter (Table 3). Before winter, faba bean showed the greatest values per plant for leaf area (884 cm²), canopy height (70.9 cm) and aboveground biomass (5.44 g). In contrast, OR showed the smallest values per plant for leaf area (300 cm²), canopy height (21 cm) and aboveground biomass (2.15 g). Despite having lower crop biomass, OR was able to take up a high amount of soil mineral N (0.06 g per plant), which was not significantly different from those of SC faba bean. The differences between faba bean and OR in crop height were maintained after winter. The highly competitive ability of OR for soil N was also maintained after winter. Unlike faba bean, common vetch had closed aboveground traits (leaf area, canopy height and biomass) as OR after winter. Nevertheless, common vetch had a significantly lower soil N uptake than OR before and after winter (Table 3).
The two legumes have contrasting growth traits before and after winter. Faba bean had a higher canopy height, aboveground biomass and soil N uptake than common vetch (Table 3).

3.2. Effects of Intercropping on Oilseed Rape Growth and Productivity

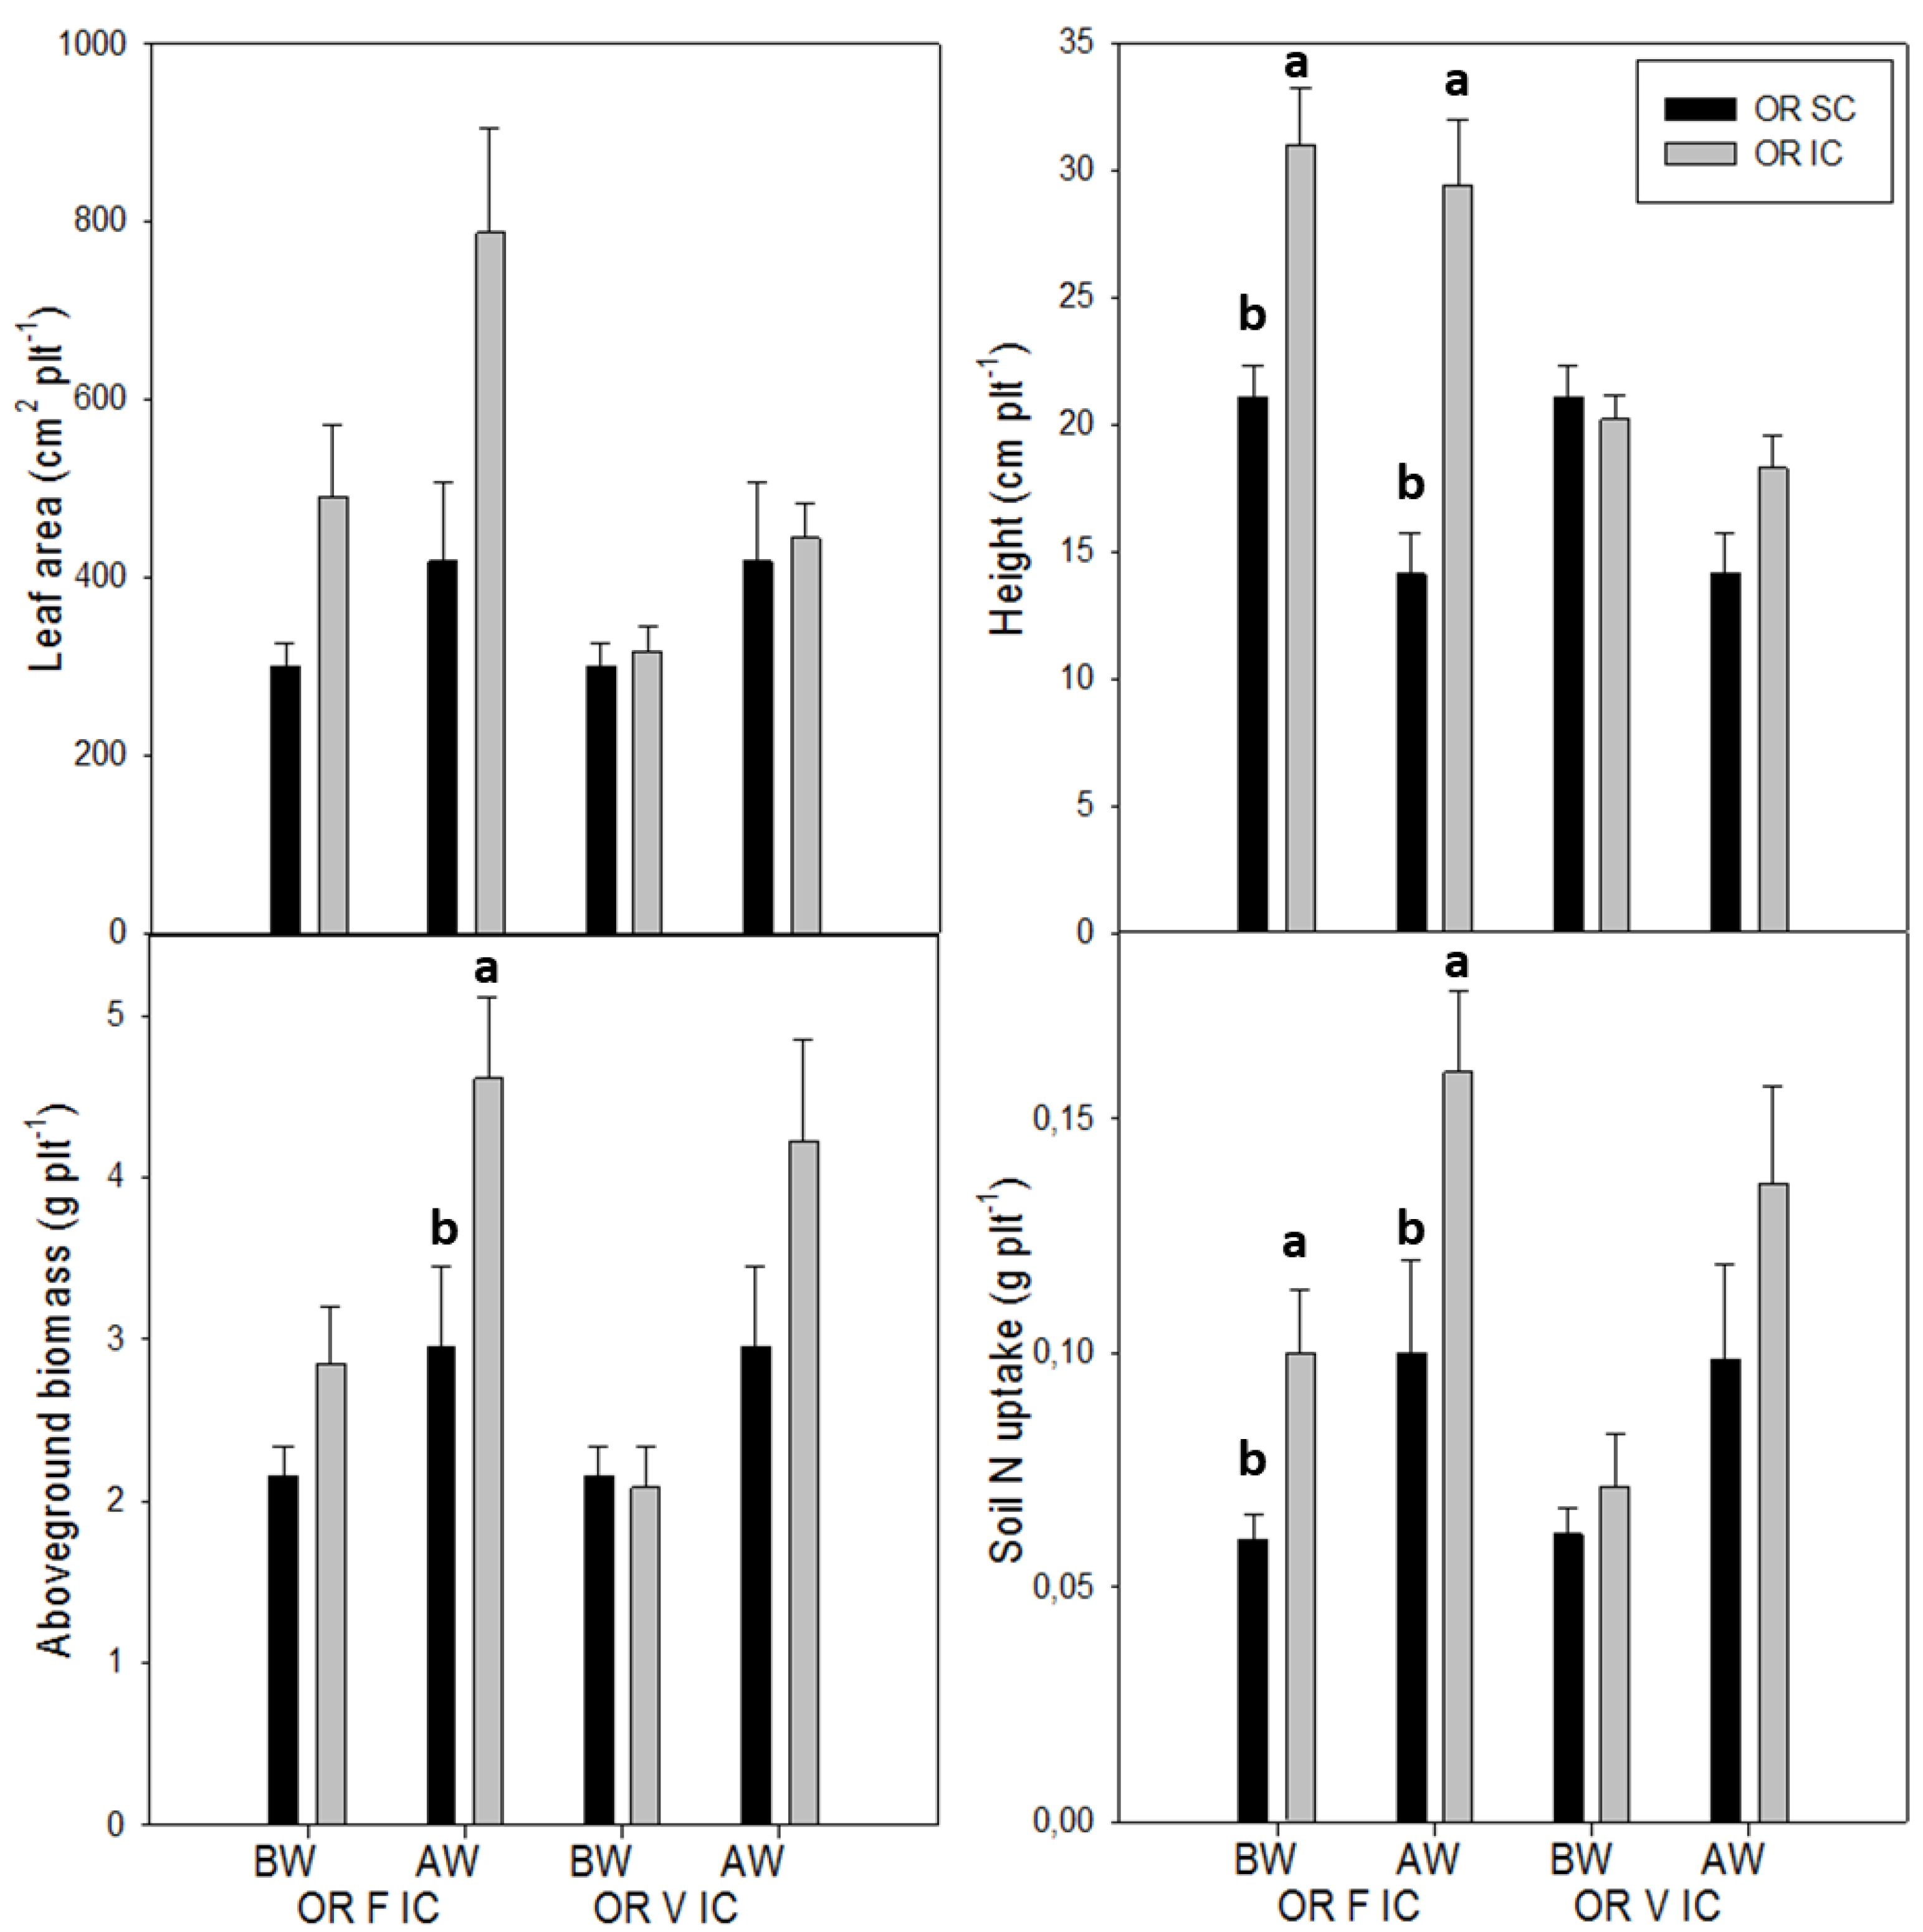
OR growth and soil mineral N uptake were greater in faba bean–OR IC compared with the OR SC in both experimental years (Figure 2). These positive effects began before winter (height and soil N uptake) and increased after winter (height, aboveground biomass and soil N uptake). The aboveground biomass per OR plant intercropped with faba bean increased from 2.2 to 2.9 g before winter and from 3 to 4.6 g after winter compared to the OR SC (Figure 2). The presence of faba bean resulted in an increased canopy height per OR plant from 21 to 31 cm and from 14 to 29.4 cm before and after winter, respectively. The average leaf area per plant was also higher for intercropped OR than OR SC, but the differences were not significant and leaf area was measured only before winter in the second year. Accumulated N per plant increased significantly from 0.06 to 0.10 g and from 0.10 to 0.16 g before and after winter, respectively, in OR–-faba bean IC compared to the OR SC.
Unlike the OR–faba bean IC, in the OR–common vetch IC, leaf area, height, OR biomass and soil N uptake were not significantly different as in the SC before winter (Figure 2). The leaf area and crop height of OR intercropped with faba bean were increased from 445 to 787 cm² and from 18.3 to 29 cm, respectively, compared to OR intercropped with common vetch after winter.
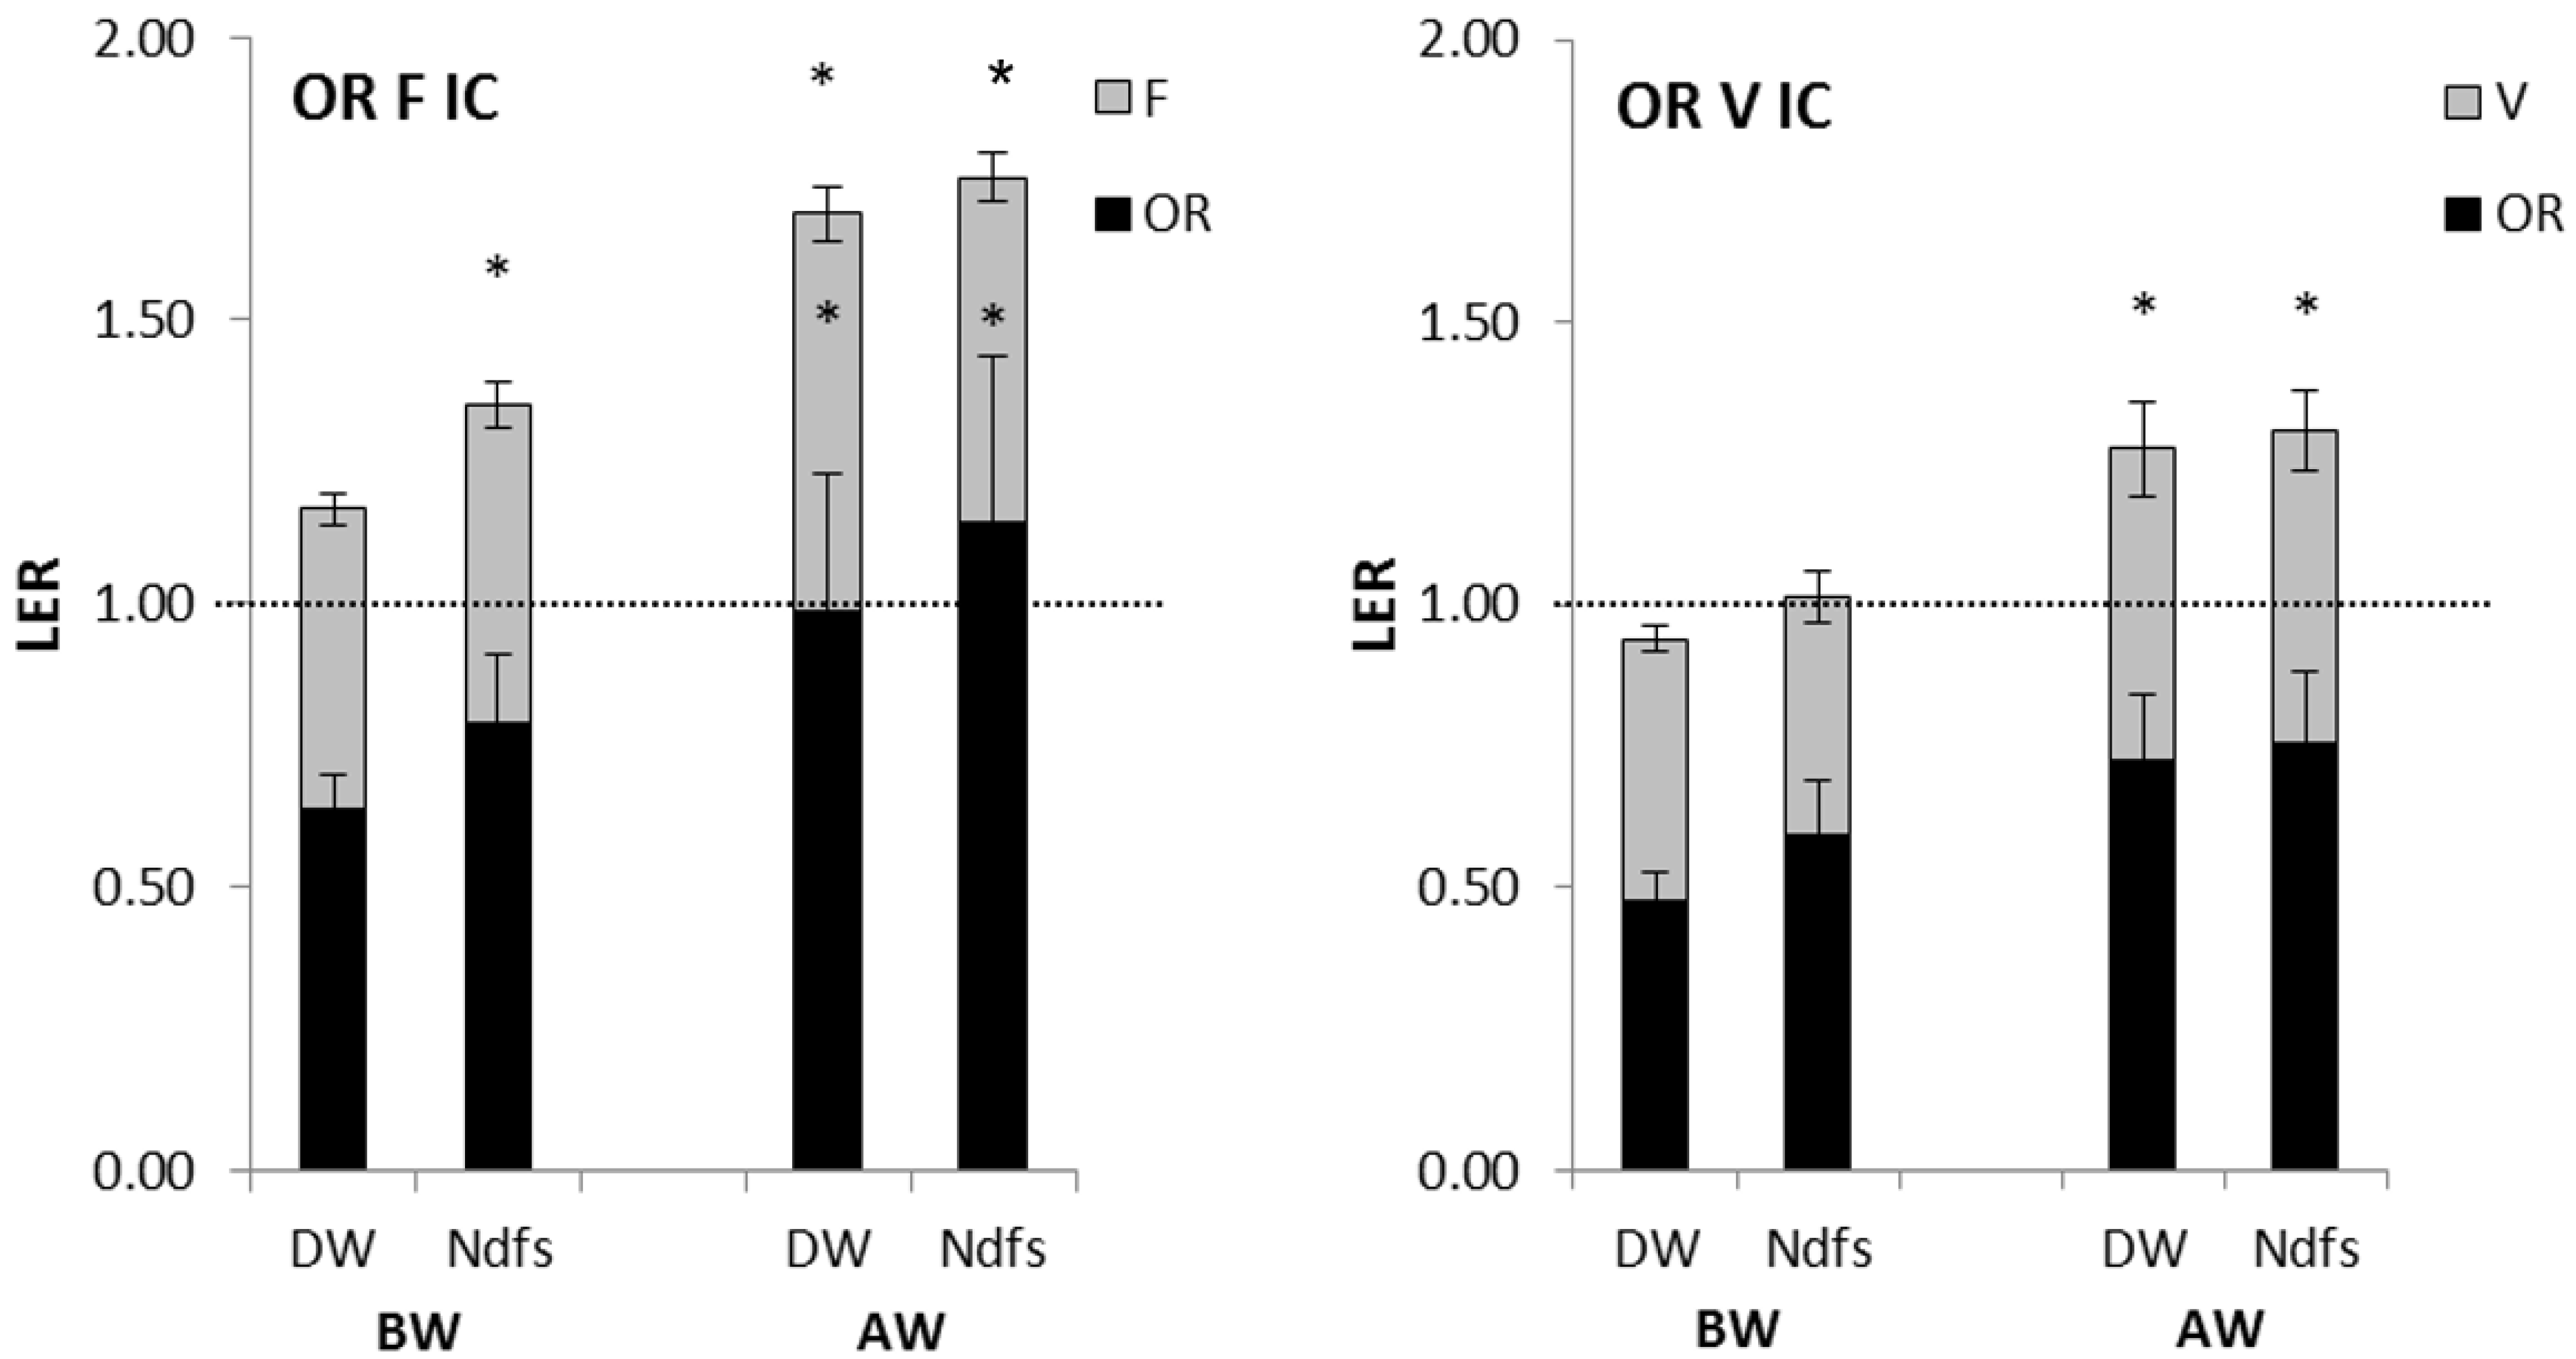
The total LER obtained by OR–faba bean for aboveground biomass and soil N uptake were greater than 1, indicating an increase IN crop growth and soil N accumulation in ICs compared to SCs. The LER values increased between December (before winter) and February (after winter). The values ranged from 1.17 to 1.69 for aboveground biomass and from 1.35 to 1.75 for soil N uptake before and after winter, respectively (Figure 3). When OR was intercropped with common vetch, the LER values were less than that with faba bean and varied from 0.94 to 1.28 for aboveground biomass and from 1.01 to 1.31 for soil N uptake before and after winter, respectively. Partial LER values were greater for OR than for legumes, indicating that OR benefited more than the legumes from intercropping (Figure 3).

3.3. Effects of Intercropping on Weed Suppression

Weed infestation in 2015/16 was greater than that in 2013/14. Weed density and weed biomass before winter were about four times higher in 2015/16 than in 2013/14 in the OR SC (Table 4). The most prevalent annual weed species in 2013/14 was Vulpia myuros L., whereas Veronica persica L. and Stellaria media L. dominated the weed community in the second experimental year. Before winter, no significant differences were observed between the treatments for weed biomass, weed N uptake and weed leaf area index. Weed biomass contributed to 13% of the total biomass (weeds and crops) in 2013/14 and up to 51% in 2015/16 before winter in the OR SC. In 2015/16, in OR–faba bean IC, the percentage of weeds in the total biomass was significantly reduced from 51 to 27% compared to the OR SC before winter.
After winter, significant differences were observed between the treatments for weed biomass and weed N uptake but not for the weed leaf area index. In 2013/14, weed biomass and weed N uptake were significantly lower under the faba bean SC than the common vetch SC. However, intercropping did not reduce weed biomass and weed N uptake compared to the OR SC. In 2015/16, the OR–faba bean intercrop reduced weed biomass compared to the OR SC from 1.17 to 0.76 t ha−1, respectively, but did not significantly reduce weed N uptake. The percentage of weeds in the total aboveground biomass (weeds and crops) was about 25% in the OR–faba bean IC compared to 64% in the OR SC. Unlike the OR–faba bean SC, the OR–vetch IC was not able to reduce weed biomass compared to the OR SC.
The proportion of total soil N taken up by weeds after winter was greater in common vetch SC (43% in 2013/14 and up to 94% in 2015/16), compared to that of the faba bean SC (14% and 61% in 2013/14 and 2015/16, respectively). Similar proportions were observed for both faba bean and oilseed rape in SCs regardless of the experimental year. In 2015/16, the amount of nitrogen taken up by weeds in the OR–faba bean IC was lower (36%) than in the OR SC (61%) (Table 4).
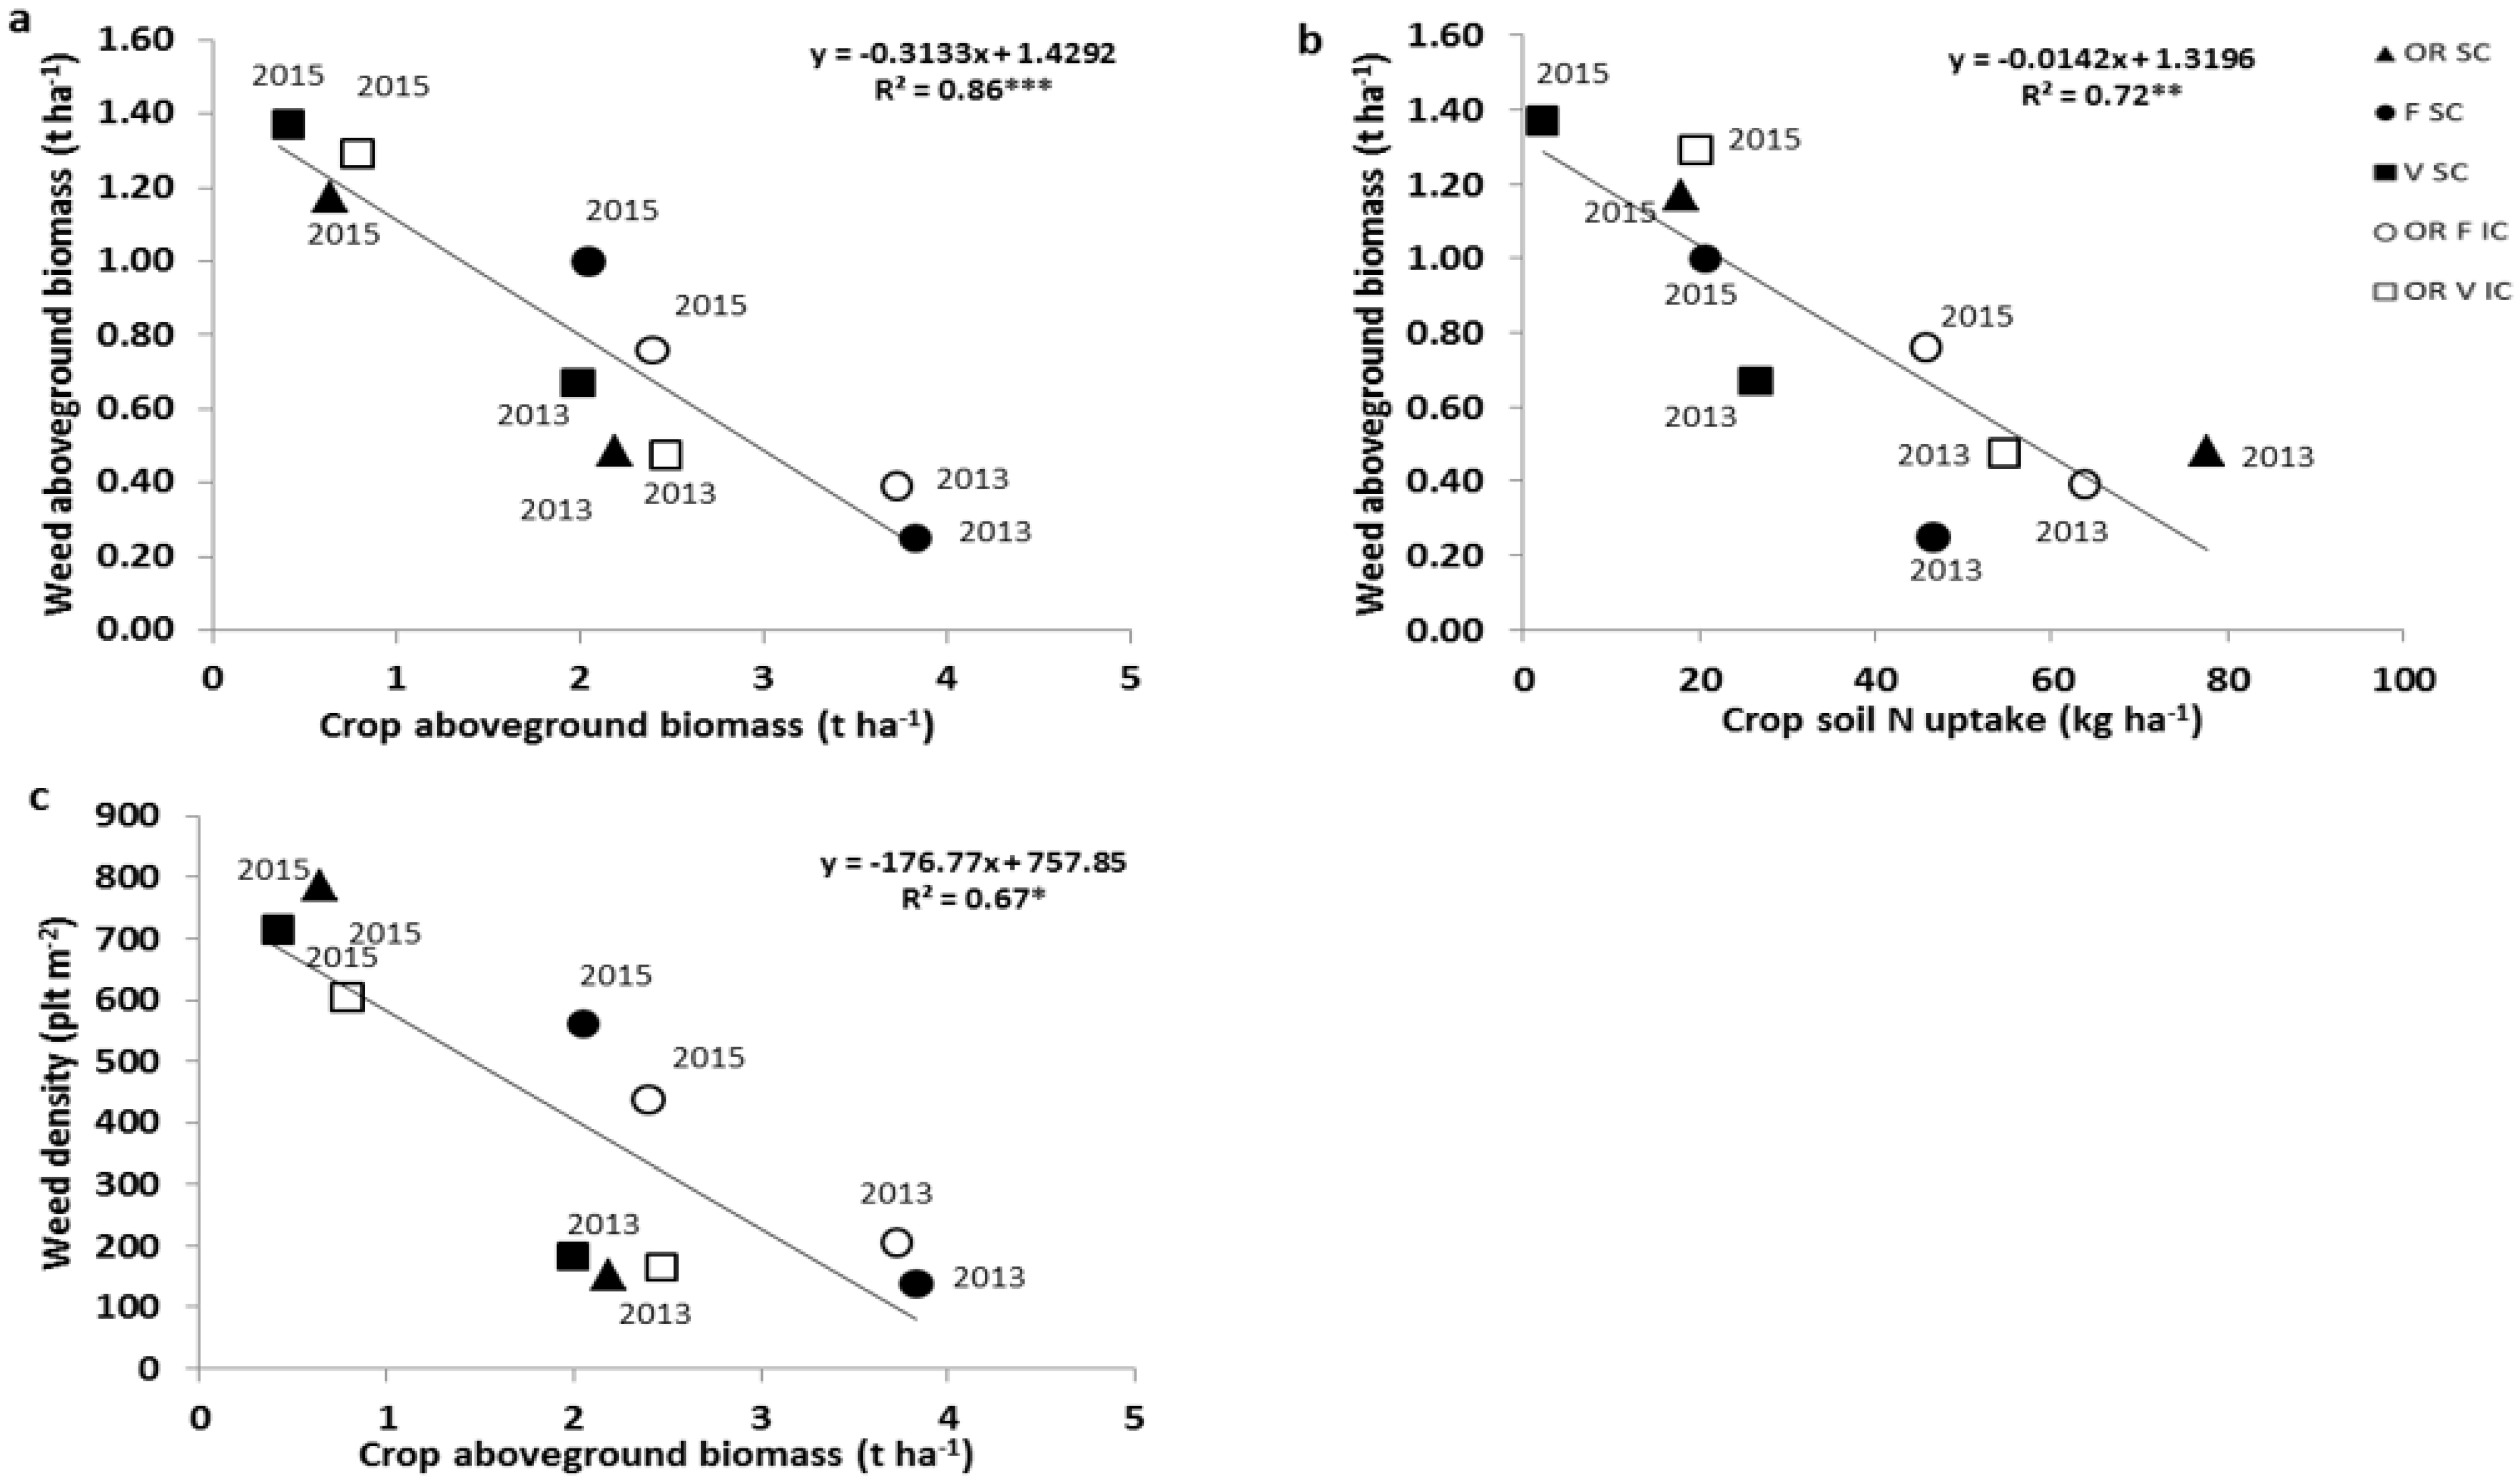
There was a negative relationship between the crop and weed aboveground biomass accumulation after winter (R² = 0.86 ***) (Figure 4a). Moreover, a negative relationship was also found between the crop N uptake and weed aboveground biomass (R² = 0.72 **) (Figure 4b). Weed density and crop aboveground biomass were negatively correlated (R² = 0.67 *) but to a lesser extent than weed biomass (Figure 4c).

3.4. Competitive Abilities Profiles

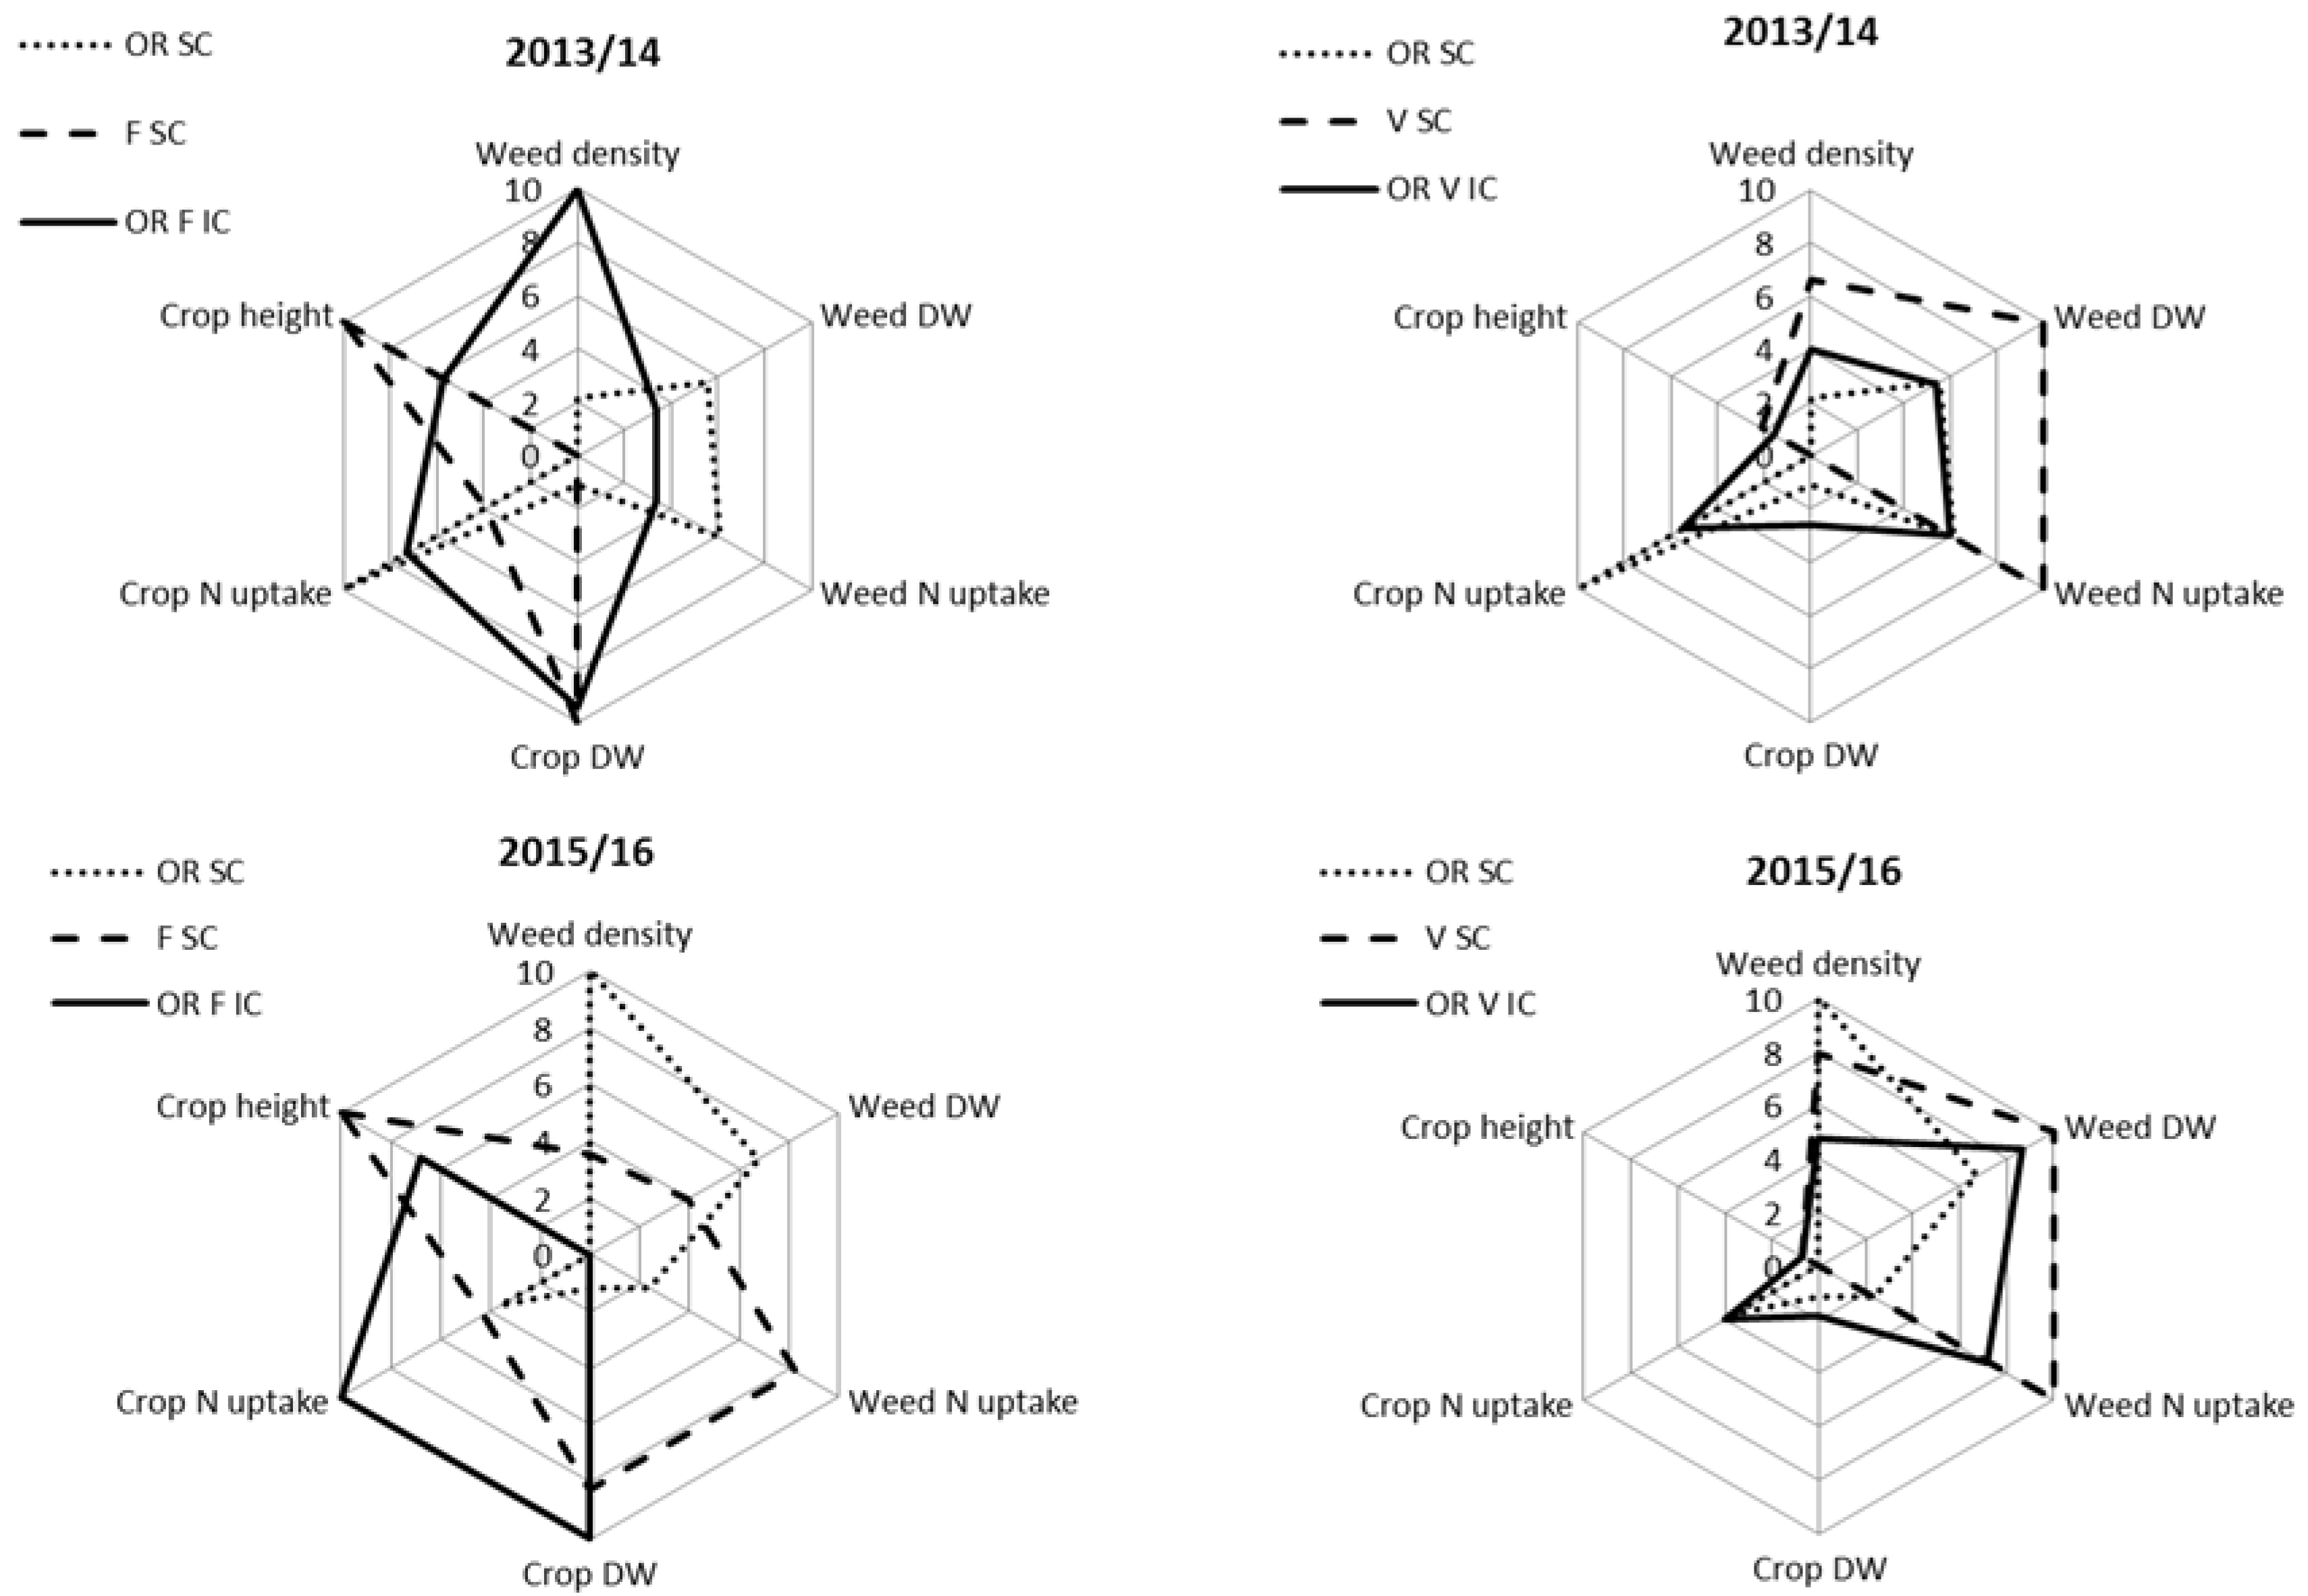
The differences between the treatments in competitive abilities against weeds after winter were represented with radar plots (Figure 5). Faba bean and OR displayed large differences concerning height and aboveground biomass. Faba bean had a greater crop height and crop biomass than OR. Moreover, despite its lower aboveground biomass, OR had a high ability to take up soil N. The complementarity between faba bean and OR increased crop growth and soil N uptake in the ICs. Intercropping faba bean with OR was efficient in reducing weeds compared to the OR SC, especially in 2015/16.
Common vetch had reduced values for aboveground biomass and height compared to faba bean each year, and these values were close to those of OR. Moreover, common vetch had a low soil N uptake ability. Thus, common vetch had a lower competitive ability against weeds. Intercropping common vetch with OR was not able to reduce weeds compared to the OR SC.

3.5. Weed Diversity and Species Richness

Species diversity (H) of the weed communities was low and was not influenced by crop treatment regardless of the sampling date (Table 5). The number of weed species (S) was similar under the different treatments. Weed species evenness (D) values were about 0.65 regardless of the sampling date and treatment, which indicated that weed species were equally distributed in the population during the two experimental years.

3.6. Yield Components of Oilseed Rape

The grain yield of the OR SC reached 1.82 and 1.57 t ha−1 in 2013/14 and 2015/16, respectively (Table 6). Although the planting density of OR in the ICs was half of that in the SC, no significant difference for grain yield was obtained in the ICs and SC in both 2013/14 and 2015/16. The yield components, number of grains per m² and weight per 1000 grains were also similar in the ICs and SC. However, the number of grains and grain yield per plant increased by three times in the ICs compared to the OR SC in 2015/2016

4. Discussion

This work demonstrates that the OR–legume IC is a relevant strategy to control weeds and favour crop productivity, especially under high weed infestations. We observed that the effects on weed suppression differed greatly according to legume species and appeared dependent on the contrasts between the two intercropped species concerning aboveground growth and soil N uptake.

4.1. Observed Complementarity between Intercropped Species

An interesting result of this study is that OR yield was not significantly different in ICs compared to the SC despite a half sowing density in the intercropped design (Table 6). Indeed, intercropping improved and facilitated the growth of OR by increasing its canopy height, aboveground biomass per plant and its ability to take up soil N compared to the OR SC. This may be related to the interspecific complementarity of resource use. The positive effects of intercropping on OR performance had already been shown in some previous studies in additive design but not in the specific case of replacement design [17,46]. In an OR–faba bean IC, Jamont et al. (2013) reported that intercropped OR accumulated a 20% greater amount of N per plant than SCs in controlled conditions, likely due to root complementarity for soil N resources in the early growth, before nitrogen biological fixation, as the net N transfer from faba bean to OR in autumn was found to be negligible [66]. Moreover, Andersen et al. (2004) have shown that in an intercropping replacement design, pea increased the ability of OR to take up soil N and soil N availability for OR was greater than in SC [22]. Since OR is known as a strong competitor crop for soil N [23], intercropping with legumes for achieving complementarity for N use could be an advantage in low-input cropping systems [22]. Furthermore, in our study, OR grown in ICs built up a high plasticity for yield, which could be the result of crop trait plasticity already underlined by Ajal et al. (2022) [67], who reported larger volume of traits in species grown as intercrops than as sole crops because of trait plasticity.

4.2. Contrasts between Species and Intercropping Effects on Weed Suppression

OR–faba bean ICs tended to suppress weeds greater than OR–common vetch ICs. The higher competitiveness of intercropping against weeds notably appeared after winter for each experimental year. The main factor explaining these effects on weed infestation seems to be the interspecific complementarity between OR and faba bean from sowing and during winter. Indeed, faba bean had probably a higher competitive ability for light in relation to its dense canopy and its tall plants. By contrast, OR produced less aboveground biomass and shorter plants than faba bean, but it showed higher competitive ability for soil N uptake. This variability between OR and faba bean may contribute to achieve a complementary use of growth resources when intercropped. Thus, reduced amounts of light and soil N may have been available for associated weeds.
Unlike the OR–faba bean IC, the OR–common vetch IC was less efficient in reducing weed growth in both experimental years. Indeed, common vetch displayed a very low aboveground biomass and soil N uptake compared to faba bean. Moreover, common vetch had similar aboveground biomass and height as OR, but OR was more competitive for soil N. As a result, a greater amount of light and soil N was probably available for weeds, and the level of complementarity for using resources between OR and common vetch was not enough to reduce weed infestation.
These differences in weed suppression performance between different companion species were already identified [16,17,19,46] but not for replacement design and without linking them to several underlying mechanisms and crop traits. Several studies have examined crop–weed competition to identify the main functional traits involved in competitiveness against weeds. These studies have investigated plant traits relating mainly to competition for light such as height, leaf area, early growth and canopy closure [6,7]. However, few studies have investigated soil N acquisition to explain competitive ability against weeds. It can be determined particularly when legumes and non-legumes are associated because they are very different in root growth and use of N sources [12,13,36,61,68]. The identification of the main root traits involved in soil N acquisition should be further investigated in future studies. Moreover, identifying species and variety traits that work together to maximize resource use efficiency could be helpful in developing models for predicting crop yield [51] and weed suppression [48] in intercropping systems.

4.3. Competitiveness of the Intercrops against Weeds Compared to the Sole Crops

The weed infestation level was greater in 2015/16 compared to 2013/14 (906 and 224 weed m−2 before winter). In a network of organic farmers‘ fields of OR, weed density was on average 102 and 120 plants per m² in early winter and late winter, respectively [5]. The density of weeds in OR SCs in conventional systems may be considered high at 120 plants per m².
In 2013/14, after winter, the OR SC accumulated a greater biomass (2.19 t ha−1) and was able to take up more soil N (77.65 kg ha−1) than all the other treatments (Figure 4). Therefore, the OR SC was a greater competitor against weeds, and the presence of legumes intercropped with OR did not improve weed control. In 2015/16, OR developed slowly, had less aboveground biomass (0.65 t ha−1) and a weak ability to take up soil N (17.87 kg ha−1) after winter, and thus provided low weed suppression. In this year, the presence of faba bean with OR increased aboveground biomass to 2.40 t ha−1 and soil N uptake to 45.96 kg ha−1, contributing to a reduction in weed biomass by 35% compared to the OR SC. In addition, the frost period (number of days with a temperature lower than 0 °C) was longer in 2015/16 (32 days) than in 2013/15 (19 days); thus, faba bean and common vetch were partially killed and provided a dead mulch contributing to weed control after winter [17].
In our experimental conditions, OR was able to suppress weeds alone once it reaches a threshold of 2 t ha−1 of aboveground biomass and 80 kg ha−1 of soil N uptake at the end of the winter. Our relationships between aboveground biomass and weed biomass are consistent with previous studies. A previous work showed effective competition against weeds when aboveground biomass of both intercropped plants reached a threshold of 2 t ha−1 in November [16]. Additionally, Valantin-Morison and Meynard (2008) showed that when an OR SC was able to accumulate 100 kg ha−1 of soil N in the early winter, it was highly competitive against weeds [5]. In low input systems, as in our study, it is difficult to reach these thresholds in sole crops. OR–legume ICs may be a relevant practice to attain the sufficient amount of aboveground biomass and N uptake in order to ensure reducing weed infestation in low-input systems under high weed pressure.
Weed biomass was more influenced than weed density or diversity as a function of crop treatment (Figure 4). Conversely to Szumigalski and Van Acker (2005) or Poggio (2005) [37,41], we did not observe significant effects of OR–legume ICs on either weed density or diversity. This kind of information could contribute to improve our understanding of how crop–weed communities are assembled and may help in developing weed management practices with less dependence on herbicides [41].

4.4. Effects of Intercropping on Crop Growth and Productivity: Which Benefits for Farmers?

All studied intercrops displayed land equivalent ratio (LER) values close to or exceeding 1 for both aboveground biomass and soil N uptake, indicating a complementary use of growth resources before and after winter. However, the evaluation of intercropping performance according to LER values showed a greater benefit of IC over SC under OR–faba bean than under OR–common vetch ICs. Andersen et al. (2004) observed that the LER values of aboveground biomass in intercropped pea–-OR varied from 1.32 to 1.16 at low and high fertilization levels, respectively, in a replacement design, indicating the abilities of legume and non-legume plants to exploit different N pools leading to yield advantages over SCs especially in low nitrogen input systems [22]. When mustard was intercropped with pea, lentil or chickpea in a replacement design, all ICs reached LER values more than 1, except in mustard–chickpea ICs [38]. The LER values were affected negatively by increasing the N fertilization rate in OR–pea ICs [22] and mustard–pea ICs [69]. A high amount of soil N at sowing (approximately 100 kg ha-1, as in our study) contributed to increasing the competitive ability of OR against weeds [5]. However, in intercropping, this level of soil N availability can decrease or delay complementary effects linked to biological N fixation.
In our study, OR produced similar grain yield per hectare in both the SC and ICs for both experimental years. Moreover, in 2015/16, OR grain yield (g per plant) and the number of seeds produced per plant were significantly greater in ICs with faba bean than in SC. OR can demonstrate high plasticity for yield build-up in replacement ICs when sown at half density. This confirms the findings of a previous study that highlighted the significance of intercrops for increasing productivity and land use (LER > 1) and absolute yield gains [49]. Moreover, it was demonstrated that intercrops in replacement designs had significantly higher yield stability (coefficient of variation of 19%) than additive intercrops [51,70]. A recent study found that the yield of OR intercropped with frost-sensitive legumes (faba bean and grass pea) was significantly higher (3.5 t h−1) than in the SC without weed control [71]. Banik et al. (2000) observed that mustard–pea ICs performed better than (mustard–lentil) and (mustard–chickpea) ICs, where mustard (B. campestris) had the highest yield (1 t ha−1) compared to mustard SCs (0.70 t ha−1) in a replacement design [38]. In our work, because of the absence of weed control, the grain yield of OR (1.59 t ha−1) was low compared to the average yield of OR in France (4 t h−1). However, Valantin-Morison and Meynard (2008) obtained similar grain yields (1.19 t ha−1 on average) in organic OR SCs where similar weed pressures were observed [5].

4.5. Perspectives for Improving Design and Crop Management of Oilseed Rape–Legume Intercrops

Climatic conditions and cultural practices (intercropping design, sowing density, sowing date…) may influence the performance of OR. Differences observed in our study between two experimental years confirm that the pedoclimatic conditions affect the performance of rapeseed intercropping [46]. Our results highlighted the advantages of a row replacement design regarding weed suppression and favouring the interspecific complementarity between intercropped species associated with positive effects on OR performance. It would be interesting to compare in a same study replacement and additive designs and to compare intercropping effects with a control treatment with herbicides (non-selective to legumes) in various weed pressure conditions. A recent study found that annual ICs with an additive design had stronger weed suppression than ICs with a replacement design [47]. Moreover, within the replacement design, the mixed spatial arrangement showed a stronger weed suppression than an alternate row design [47]. The weed suppression ability of a species observed in sole crops seems to be a good predictor of weed suppression in additive or substitutive intercrops [47,48]. This finding may help for deepening intercrop performances according to different choice species and spatial and temporal arrangements [47,48].
Moreover, in such ICs, the legumes were sown at a different time than their recommended sowing times in SCs with potential negative impacts on their development and sensitivity to pests and disease. In our study, the early sowing of common vetch (one month before the recommended sowing time in a sole crop) increased its sensitivity to fungal diseases (rust), especially in 2015/16. The choice of contrasting legumes, but also different cultivars within a species, concerning competition for light and soil N uptake is crucial.
In our study only the intercropped OR was harvested, whereas legumes were considered as frost-sensitive legumes even if the temperature was not low enough to completely kill the legumes in both years. The possibility of harvesting the two species and having an additional benefit of ICs may be enhanced [22].
Finally, a wide diversity of management methods (species/cultivar choice, sowing and harvest conditions) needs to be tested in order to achieve the trade-off between services and disservices of intercropped crops [72].

5. Conclusions

Our study demonstrates that OR–legume intercrops could be a relevant strategy when trying to reduce weed infestation and favour OR productivity, especially under high weed infestations. We observed that the effects on weed suppression differed greatly as a function of legume species and interspecific complementarity that resulted from contrasting aboveground growth and soil N acquisition between OR and legumes. Our results also highlighted the advantages of a replacement design compared to a SC regarding weed suppression and favouring the interspecific complementarity between intercropped species associated with the positive effects on OR performance under a low input cropping system. The combination of intercropped species with contrasting traits appears to be a key factor for the success of ICs in order to improve both weed suppression and crop productivity.

Author Contributions

Conceptualization, E.D., G.P., S.J.S., J.F., G.C.-H. and C.N.; methodology, E.D., G.P., G.C.-H. and C.N.; software, E.D. and C.N.; validation, E.D., G.P., G.C.-H. and C.N.; formal analysis, E.D., G.P. and C.N.; investigation, E.D.; resources, E.D., G.P., G.C.-H., and C.N.; data curation, E.D.; writing—original draft preparation, E.D.; writing—review and editing, E.D., G.P., S.J.S., J.F., G.C.-H. and C.N.; visualization, E.D., G.P., G.C.-H. and C.N.; supervision, J.F., G.C.-H., and C.N.; project administration, J.F., G.C.-H. and C.N.; funding acquisition, E.D., J.F., G.C.-H. and C.N. All authors have read and agreed to the published version of the manuscript.

Funding

This work was funded by CASDAR n°5376 (Compte d’Affectation Spéciale pour le Développement Agricole et Rural) and Elana Dayoub’s Ph.D thesis was supported by the Syrian government.

Acknowledgments

We gratefully acknowledge the technical staff of the research unit of LEVA (Légumineuses, Ecophysiologie Végétale, Agroécologie) for their excellent technical assistance. We are most grateful to the PLATIN’ (Plateau d’Isotopie de Normandie) core facility for all element and isotope analyses used in this study.

Conflicts of Interest

The authors declare no conflict of interest.

References

  1. Heap, I. Global Perspective of Herbicide-Resistant Weeds. Pest. Manag. Sci. 2014, 70, 1306–1315. [Google Scholar] [CrossRef]
  2. Malagoli, P.; Laine, P.; Rossato, L.; Ourry, A. Dynamics of Nitrogen Uptake and Mobilization in Field-Grown Winter Oilseed Rape (Brassica napus) from Stem Extension to Harvest: I. Global N Flows between Vegetative and Reproductive Tissues in Relation to Leaf Fall and Their Residual N. Ann. Bot. 2005, 95, 853–861. [Google Scholar] [CrossRef]
  3. Lutman, P.J.W.; Dixon, F.L. The Competitive Effects of Volunteer Barley (Hordeum Vulgare) on the Growth of Oilseed Rape (Brassica napus). Ann. Appl. Biol. 1990, 117, 633–644. [Google Scholar] [CrossRef]
  4. Primot, S.; Valantin-Morison, M.; Makowski, D. Predicting the Risk of Weed Infestation in Winter Oilseed Rape Crops. Weed Res. 2006, 46, 22–33. [Google Scholar] [CrossRef]
  5. Valantin-Morison, M.; Meynard, J.M. Diagnosis of Limiting Factors of Organic Oilseed Rape Yield. A Survey of Farmers’ Fields. Agron. Sustain. Dev. 2008, 28, 527–539. [Google Scholar] [CrossRef]
  6. Beckie, H.J.; Johnson, E.N.; Blackshaw, R.E.; Gan, Y. Weed Suppression by Canola and Mustard Cultivars. Weed Technol. 2008, 22, 182–185. [Google Scholar] [CrossRef]
  7. Pakeman, R.J.; Karley, A.J.; Newton, A.C.; Morcillo, L.; Brooker, R.W.; Schöb, C. A Trait-Based Approach to Crop-Weed Interactions. Eur. J. Agron. 2015, 70, 22–32. [Google Scholar] [CrossRef]
  8. Willey, R.W. Intercropping—Its Importance and Research Needs. 1.Competition and Yield Advantages. Field Crop Abstracts 1979, 32, 1–10. [Google Scholar]
  9. Gronle, A.; Böhm, H.; Heß, J. Effect of Intercropping Winter Peas of Differing Leaf Type and Time of Flowering on Annual Weed Infestation in Deep and Shallow Ploughed Soils and on Pea Pests. Landbauforschung-vTI Agric. For. Res. 2014, 64, 31–44. [Google Scholar] [CrossRef]
  10. Banik, P.; Midya, A.; Sarkar, B.K.; Ghose, S.S. Wheat and Chickpea Intercropping Systems in an Additive Series Experiment: Advantages and Weed Smothering. Eur. J. Agron. 2006, 24, 325–332. [Google Scholar] [CrossRef]
  11. Carr, P.M.; Gardner, J.C.; Schatz, B.G.; Zwinger, S.W.; Guldan, S.J. Grain Yield and Weed Biomass of a Wheat-Lentil Intercrop. Agron. J. 1995, 87, 574–579. [Google Scholar] [CrossRef]
  12. Carton, N.; Naudin, C.; Piva, G.; Corre-Hellou, G. Intercropping Winter Lupin and Triticale Increases Weed Suppression and Total Yield. Agriculture 2020, 10, 316. [Google Scholar] [CrossRef]
  13. Corre-Hellou, G.; Dibet, A.; Hauggaard-Nielsen, H.; Crozat, Y.; Gooding, M.; Ambus, P.; Dahlmann, C.; von Fragstein, P.; Pristeri, A.; Monti, M.; et al. The Competitive Ability of Pea-Barley Intercrops against Weeds and the Interactions with Crop Productivity and Soil N Availability. F. Crop. Res. 2011, 122, 264–272. [Google Scholar] [CrossRef]
  14. Liebman, M.; Dyck, E. Crop Rotation and Intercropping Strategies for Weed Management. Ecol. Appl. 1993, 3, 92–122. [Google Scholar] [CrossRef]
  15. Hauggaard-Nielsen, H.; Ambus, P.; Jensen, E.S. Interspecific Competition, N Use and Interference with Weeds in Pea-Barley Intercropping. Field Crop. Res. 2001, 70, 101–109. [Google Scholar] [CrossRef]
  16. Cadoux, S.; Sauzet, G.; Valantin-Morison, M.; Pontet, C.; Champolivier, L.; Robert, C.; Lieven, J.; Flénet, F.; Mangenot, O.; Fauvin, P.; et al. Intercropping Frost-Sensitive Legume Crops with Winter Oilseed Rape Reduces Weed Competition, Insect Damage, and Improves Nitrogen Use Efficiency. OCL Oilseeds Fats 2015, 22. [Google Scholar] [CrossRef]
  17. Lorin, M.; Jeuffroy, M.-H.; Butier, A.; Valantin-Morison, M. Undersowing Winter Oilseed Rape with Frost-Sensitive Legume Living Mulches to Improve Weed Control. Eur. J. Agron. 2015, 71, 96–105. [Google Scholar] [CrossRef]
  18. Gharineh, M.H.; Moradi-Telavat, M.R. Investigation of Ecological Relationship and Density Acceptance of Canola in Canola-Field Bean Intercropping. Asian J. Agric. Res. 2009, 1, 11–17. [Google Scholar] [CrossRef]
  19. Emery, S.E.; Anderson, P.; Carlsson, G.; Friberg, H.; Larsson, M.C.; Wallenhammar, A.-C.; Lundin, O. The Potential of Intercropping for Multifunctional Crop Protection in Oilseed Rape (Brassica napus L.). Front. Agron. 2021, 3, 782686. [Google Scholar] [CrossRef]
  20. Gewen, V. An Underground Revolution. Nature 2010, 466, 552–553. [Google Scholar] [CrossRef]
  21. Dowling, A.; Sadras, V.O.; Roberts, P.; Doolette, A.; Zhou, Y.; Denton, M.D. Legume-Oilseed Intercropping in Mechanised Broadacre Agriculture—A Review. Field Crop. Res. 2021, 260, 107980. [Google Scholar] [CrossRef]
  22. Andersen, M.K.; Hauggaard-Nielsen, H.; Ambus, P.; Jensen, E.S. Biomass Production, Symbiotic Nitrogen Fixation and Inorganic N Use in Dual and Tri-Component Annual Intercrops. Plant Soil 2004, 266, 273–287. [Google Scholar] [CrossRef]
  23. Thorup-Kristensen, K. The Effect of Nitrogen Catch Crop Species on the Nitrogen Nutrition of Succeeding Crops. Fertil. Res. 1994, 37, 227–234. [Google Scholar] [CrossRef]
  24. Thorup-Kristensen, K. Are Differences in Root Growth of Nitrogen Catch Crops Important for Their Ability to Reduce Soil Nitrate-N Content, and How Can This Be Measured? Plant Soil 2001, 230, 185–195. [Google Scholar] [CrossRef]
  25. Gregory, P.J. Growth and Functioning of Plant Roots. Russell’s Soil Conditions and Plant Growth. Longman Scientific and Technical; Longman Group UK Limited: Haelow, Essex, UK, 1988. [Google Scholar]
  26. Schröder, D.; Köpke, U. Faba Bean (Vicia faba L.) Intercropped with Oil Crops—A Strategy to Enhance Rooting Density and to Optimize Nitrogen Use and Grain Production? Field Crop. Res. 2012, 135, 74–81. [Google Scholar] [CrossRef]
  27. Dayoub, E.; Naudin, C.; Piva, G.; Shirtliffe, S.J.; Fustec, J.; Corre-Hellou, G. Traits Affecting Early Season Nitrogen Uptake in Nine Legume Species. Heliyon 2017, 3, e00244. [Google Scholar] [CrossRef] [PubMed]
  28. Szumigalski, A.R.; Van Acker, R.C. Nitrogen Yield and Land Use Efficiency in Annual Sole Crops and Intercrops. Agron. J. 2006, 98, 1030–1040. [Google Scholar] [CrossRef]
  29. Herridge, D.F.; Peoples, M.B.; Boddey, R.M. Global Inputs of Biological Nitrogen Fixation in Agricultural Systems. Plant Soil 2008, 311, 1–18. [Google Scholar] [CrossRef]
  30. Hamblin, A.P.; Hamblin, J. Root Characteristics of Some Temperate Legume Species and Varieties on Deep, Free-Draining Entisols. Aust. J. Agric. Res. 1985, 36, 63–72. [Google Scholar] [CrossRef]
  31. Liu, L.; Gan, Y.; Bueckert, R.; Van Rees, K. Rooting Systems of Oilseed and Pulse Crops. II: Vertical Distribution Patterns across the Soil Profile. F. Crop. Res. 2011, 122, 248–255. [Google Scholar] [CrossRef]
  32. Corre-Hellou, G.; Fustec, J.; Crozat, Y. Interspecific Competition for Soil N and Its Interaction with N2 Fixation, Leaf Expansion and Crop Growth in Pea-Barley Intercrops. Plant Soil 2006, 282, 195–208. [Google Scholar] [CrossRef]
  33. Jensen, E.S. Grain Yield, Symbiotic N2 Fixation and Interspecific Competition for Inorganic N in Pea-Barley Intercrops. Plant Soil 1996, 182, 25–38. [Google Scholar] [CrossRef]
  34. Bedoussac, L.; Journet, E.P.; Hauggaard-Nielsen, H.; Naudin, C.; Corre-Hellou, G.; Jensen, E.S.; Prieur, L.; Justes, E. Ecological Principles Underlying the Increase of Productivity Achieved by Cereal-Grain Legume Intercrops in Organic Farming. A Review. Agron. Sustain. Dev. 2015, 35, 911–935. [Google Scholar] [CrossRef]
  35. Hauggaard-Nielsen, H.; Gooding, M.; Ambus, P.; Corre-Hellou, G.; Crozat, Y.; Dahlmann, C.; Dibet, A.; Von Fragstein, P.; Pristeri, A.; Monti, M. Pea–Barley Intercropping for Efficient Symbiotic N2-Fixation, Soil N Acquisition and Use of Other Nutrients in European Organic Cropping Systems. Field Crop. Res. 2009, 113, 64–71. [Google Scholar] [CrossRef]
  36. Naudin, C.; Corre-Hellou, G.; Pineau, S.; Crozat, Y.; Jeuffroy, M.H. The Effect of Various Dynamics of N Availability on Winter Pea-Wheat Intercrops: Crop Growth, N Partitioning and Symbiotic N2 Fixation. Field Crop. Res. 2010, 119, 2–11. [Google Scholar] [CrossRef]
  37. Szumigalski, A.; Van Acker, R. Weed Suppression and Crop Production in Annual Intercrops. Weed Sci. 2005, 53, 813–825. [Google Scholar] [CrossRef]
  38. Banik, P.; Sasmal, T.; Ghosal, P.K.; Bagchi, D.K. Evaluation of Mustard (Brassica compestris var. Toria) and Legume Intercropping under 1: 1 and 2: 1 Row-replacement Series Systems. J. Agron. Crop Sci. 2000, 185, 9–14. [Google Scholar] [CrossRef]
  39. Blackshaw, R.E.; Brandt, R.N.; Janzen, H.H.; Entz, T.; Grant, C.A.; Derksen, D.A. Differential Response of Weed Species to Added Nitrogen. Weed Sci. 2003, 51, 532–539. [Google Scholar] [CrossRef]
  40. Moreau, D.; Milard, G.; Munier-Jolain, N. A Plant Nitrophily Index Based on Plant Leaf Area Response to Soil Nitrogen Availability. Agron. Sustain. Dev. 2013, 33, 809–815. [Google Scholar] [CrossRef]
  41. Poggio, S.L. Structure of Weed Communities Occurring in Monoculture and Intercropping of Field Pea and Barley. Agric. Ecosyst. Environ. 2005, 109, 48–58. [Google Scholar] [CrossRef]
  42. Saucke, H.; Ackermann, K. Weed Suppression in Mixed Cropped Grain Peas and False Flax (Camelina sativa). Weed Res. 2006, 46, 453–461. [Google Scholar] [CrossRef]
  43. Spitters, C.J.T.; Van Den Bergh, J.P. Competition between Crop and Weeds: A System Approach. In Biology and Ecology of Weeds; Springer: Dordrecht, The Netherlands, 1982; pp. 137–148. [Google Scholar] [CrossRef]
  44. Fried, G.; Cordeau, S.; Metay, A.; Kazakou, E. Relative Importance of Environmental Factors and Farming Practices in Shaping Weed Communities Structure and Composition in French Vineyards. Agric. Ecosyst. Environ. 2019, 275, 1–13. [Google Scholar] [CrossRef]
  45. Pyšek, P.; Lepš, J. Response of a Weed Community to Nitrogen Fertilization: A Multivariate Analysis. J. Veg. Sci. 1991, 2, 237–244. [Google Scholar] [CrossRef]
  46. Verret, V.; Gardarin, A.; Makowski, D.; Lorin, M.; Cadoux, S.; Butier, A.; Valantin-Morison, M. Assessment of the Benefits of Frost-Sensitive Companion Plants in Winter Rapeseed. Eur. J. Agron. 2017, 91, 93–103. [Google Scholar] [CrossRef]
  47. Gu, C.; Bastiaans, L.; Anten, N.P.R.; Makowski, D.; van der Werf, W. Annual Intercropping Suppresses Weeds: A Meta-Analysis. Agric. Ecosyst. Environ. 2021, 322, 107658. [Google Scholar] [CrossRef]
  48. Gu, C.; van der Werf, W.; Bastiaans, L. A Predictive Model for Weed Biomass in Annual Intercropping. Field Crop. Res. 2022, 277, 108388. [Google Scholar] [CrossRef]
  49. Li, C.; Hoffland, E.; Kuyper, T.W.; Yu, Y.; Zhang, C.; Li, H.; Zhang, F.; van der Werf, W. Syndromes of Production in Intercropping Impact Yield Gains. Nat. Plants 2020, 6, 653–660. [Google Scholar] [CrossRef]
  50. Cheriere, T.; Lorin, M.; Corre-Hellou, G. Species Choice and Spatial Arrangement in Soybean-Based Intercropping: Levers That Drive Yield and Weed Control. Field Crop. Res. 2020, 256, 107923. [Google Scholar] [CrossRef]
  51. Stomph, T.J.; Dordas, C.; Baranger, A.; de Rijk, J.; Dong, B.; Evers, J.; Gu, C.; Li, L.; Simon, J.; Jensen, E.S.; et al. Designing Intercrops for High Yield, Yield Stability and Efficient Use of Resources: Are There Principles? Adv. Agron. 2020, 160, 1–50. [Google Scholar] [CrossRef]
  52. Bousselin, X.; Cassagne, N.; Baux, A.; Valantin-Morison, M.; Herrera, J.M.; Lorin, M.; Hédan, M.; Fustec, J. Interactions between Plants and Plant-Soil in Functionally Complex Mixtures Including Grass Pea, Faba Bean and Niger, Intercropped with Oilseed Rape. Agronomy 2021, 11, 1493. [Google Scholar] [CrossRef]
  53. Khan, S.; Anwar, S.; Kuai, J.; Ullah, S.; Fahad, S.; Zhou, G. Optimization of Nitrogen Rate and Planting Density for Improving Yield, Nitrogen Use Efficiency, and Lodging Resistance in Oilseed Rape. Front. Plant Sci. 2017, 8, 532. [Google Scholar] [CrossRef]
  54. Jensen, E.S.; Peoples, M.B.; Hauggaard-Nielsen, H. Faba Bean in Cropping Systems. Field Crop. Res. 2010, 115, 203–216. [Google Scholar] [CrossRef]
  55. Lagarde, F.; Champolivier, L. Le Raisonnement et Les Avancées Techniques Permettent de Réduire La Fertilisation Azotée: Le Cas de Farmstar-Colza®. Oléagineux Corps Gras Lipides 2006, 13, 384–387. [Google Scholar] [CrossRef]
  56. Parnaudeau, V.; Jeuffroy, M.H.; Machet, J.M.; Reau, R.; Bissuel, C.; Eveillard, P. Methods for Determining the Nitrogen Fertiliser Requirements of Some Major Arable Crops in France. In Proceedings of the Conference of the International Fertiliser Society, Cambridge, UK, 10 December 2009; pp. 1–26. [Google Scholar]
  57. JKI, O. Growth Stages of Mono-and Dicotyledonous Plants; Federal Biological Research Centre for Agriculture and Forestry: Berlin, Germany; Braunschweig, Germany, 2010. [Google Scholar]
  58. Amarger, N.; Mariotti, A.; Mariotti, F.; Durr, J.C.; Bourguignon, C.; Lagacherie, B. Estimate of Symbiotically Fixed Nitrogen in Field Grown Soybeans Using Variations In15N Natural Abundance. Plant Soil 1979, 52, 269–280. [Google Scholar] [CrossRef]
  59. López-Bellido, F.J.; López-Bellido, R.J.; Redondo, R.; López-Bellido, L. B Value and Isotopic Fractionation in N2 Fixation by Chickpea (Cicer arietinum L.) and Faba Bean (Vicia faba L.). Plant Soil 2010, 337, 425–434. [Google Scholar] [CrossRef]
  60. Yoneyama, T.; Fujita, K.; Yoshida, T.; Matsumoto, T.; Kambayashi, I.; Yazaki, J. Variation in Natural Abundance of 15N among Plant Parts and in 15N/14N Fractionation during N2 Fixation in the Legume-Rhizobia Symbiotic System. Plant Cell Physiol. 1986, 27, 791–799. [Google Scholar] [CrossRef]
  61. De Wit, C.T.; Van den Bergh, J.P. Competition between Herbage Plants. J. Agric. Sci. 1965, 13, 212–221. [Google Scholar] [CrossRef]
  62. Willey, R.W.; Osiru, D.S.O. Studies on Mixtures of Dwarf Sorghum and Beans (Phaseolus vulgaris) with Particular Reference to Plant Population. J. Agric. Sci. 1972, 79, 531–540. [Google Scholar] [CrossRef]
  63. Magurran, A.E. Ecological Diversity and Its Measurement; Princeton University Press: Princeton, NJ, USA, 1988. [Google Scholar] [CrossRef]
  64. RCore. A Language and Environment for Statistical Computing; R Foundation for Statistical Computing: Vienna, Austria, 2014. [Google Scholar]
  65. Fisher, R.A.; Yates, F. Statistical Tables for Biological, Agricultural Aad Medical Research; Oliver and Boyd: Edinburgh, UK, 1938; p. 90. [Google Scholar]
  66. Jamont, M.; Piva, G.; Fustec, J. Sharing N Resources in the Early Growth of Rapeseed Intercropped with Faba Bean: Does N Transfer Matter? Plant Soil 2013, 371, 641–653. [Google Scholar] [CrossRef]
  67. Ajal, J.; Kiær, L.P.; Pakeman, R.J.; Scherber, C.; Weih, M. Intercropping Drives Plant Phenotypic Plasticity and Changes in Functional Trait Space. Basic Appl. Ecol. 2022, 61, 41–52. [Google Scholar] [CrossRef]
  68. Carton, N.; Naudin, C.; Piva, G.; Baccar, R.; Corre-Hellou, G. Differences for Traits Associated with Early N Acquisition in a Grain Legume and Early Complementarity in Grain Legume-Triticale Mixtures. AoB Plants 2018, 10, ply001. [Google Scholar] [CrossRef]
  69. Waterer, J.G.; Vessey, J.K.; Stobbe, E.H.; Soper, R.J. Yield and Symbiotic Nitrogen Fixation in a Pea-Mustard Intercrop as Influenced by N Fertilizer Addition. Soil Biol. Biochem. 1994, 26, 447–453. [Google Scholar] [CrossRef]
  70. Raseduzzaman, M.; Jensen, E.S. Does Intercropping Enhance Yield Stability in Arable Crop Production? A Meta-Analysis. Eur. J. Agron. 2017, 91, 25–33. [Google Scholar] [CrossRef]
  71. Breitenmoser, S.; Steinger, T.; Baux, A.; Hiltpold, I. Intercropping Winter Oilseed Rape (Brassica napus L.) Has the Potential to Lessen the Impact of the Insect Pest Complex. Agronomy 2022, 12, 723. [Google Scholar] [CrossRef]
  72. Gardarin, A.; Celette, F.; Naudin, C.; Piva, G.; Valantin-Morison, M.; Vrignon-Brenas, S.; Verret, V.; Médiène, S. Intercropping with Service Crops Provides Multiple Services in Temperate Arable Systems: A Review. Agron. Sustain. Dev. 2022, 42, 39. [Google Scholar] [CrossRef]
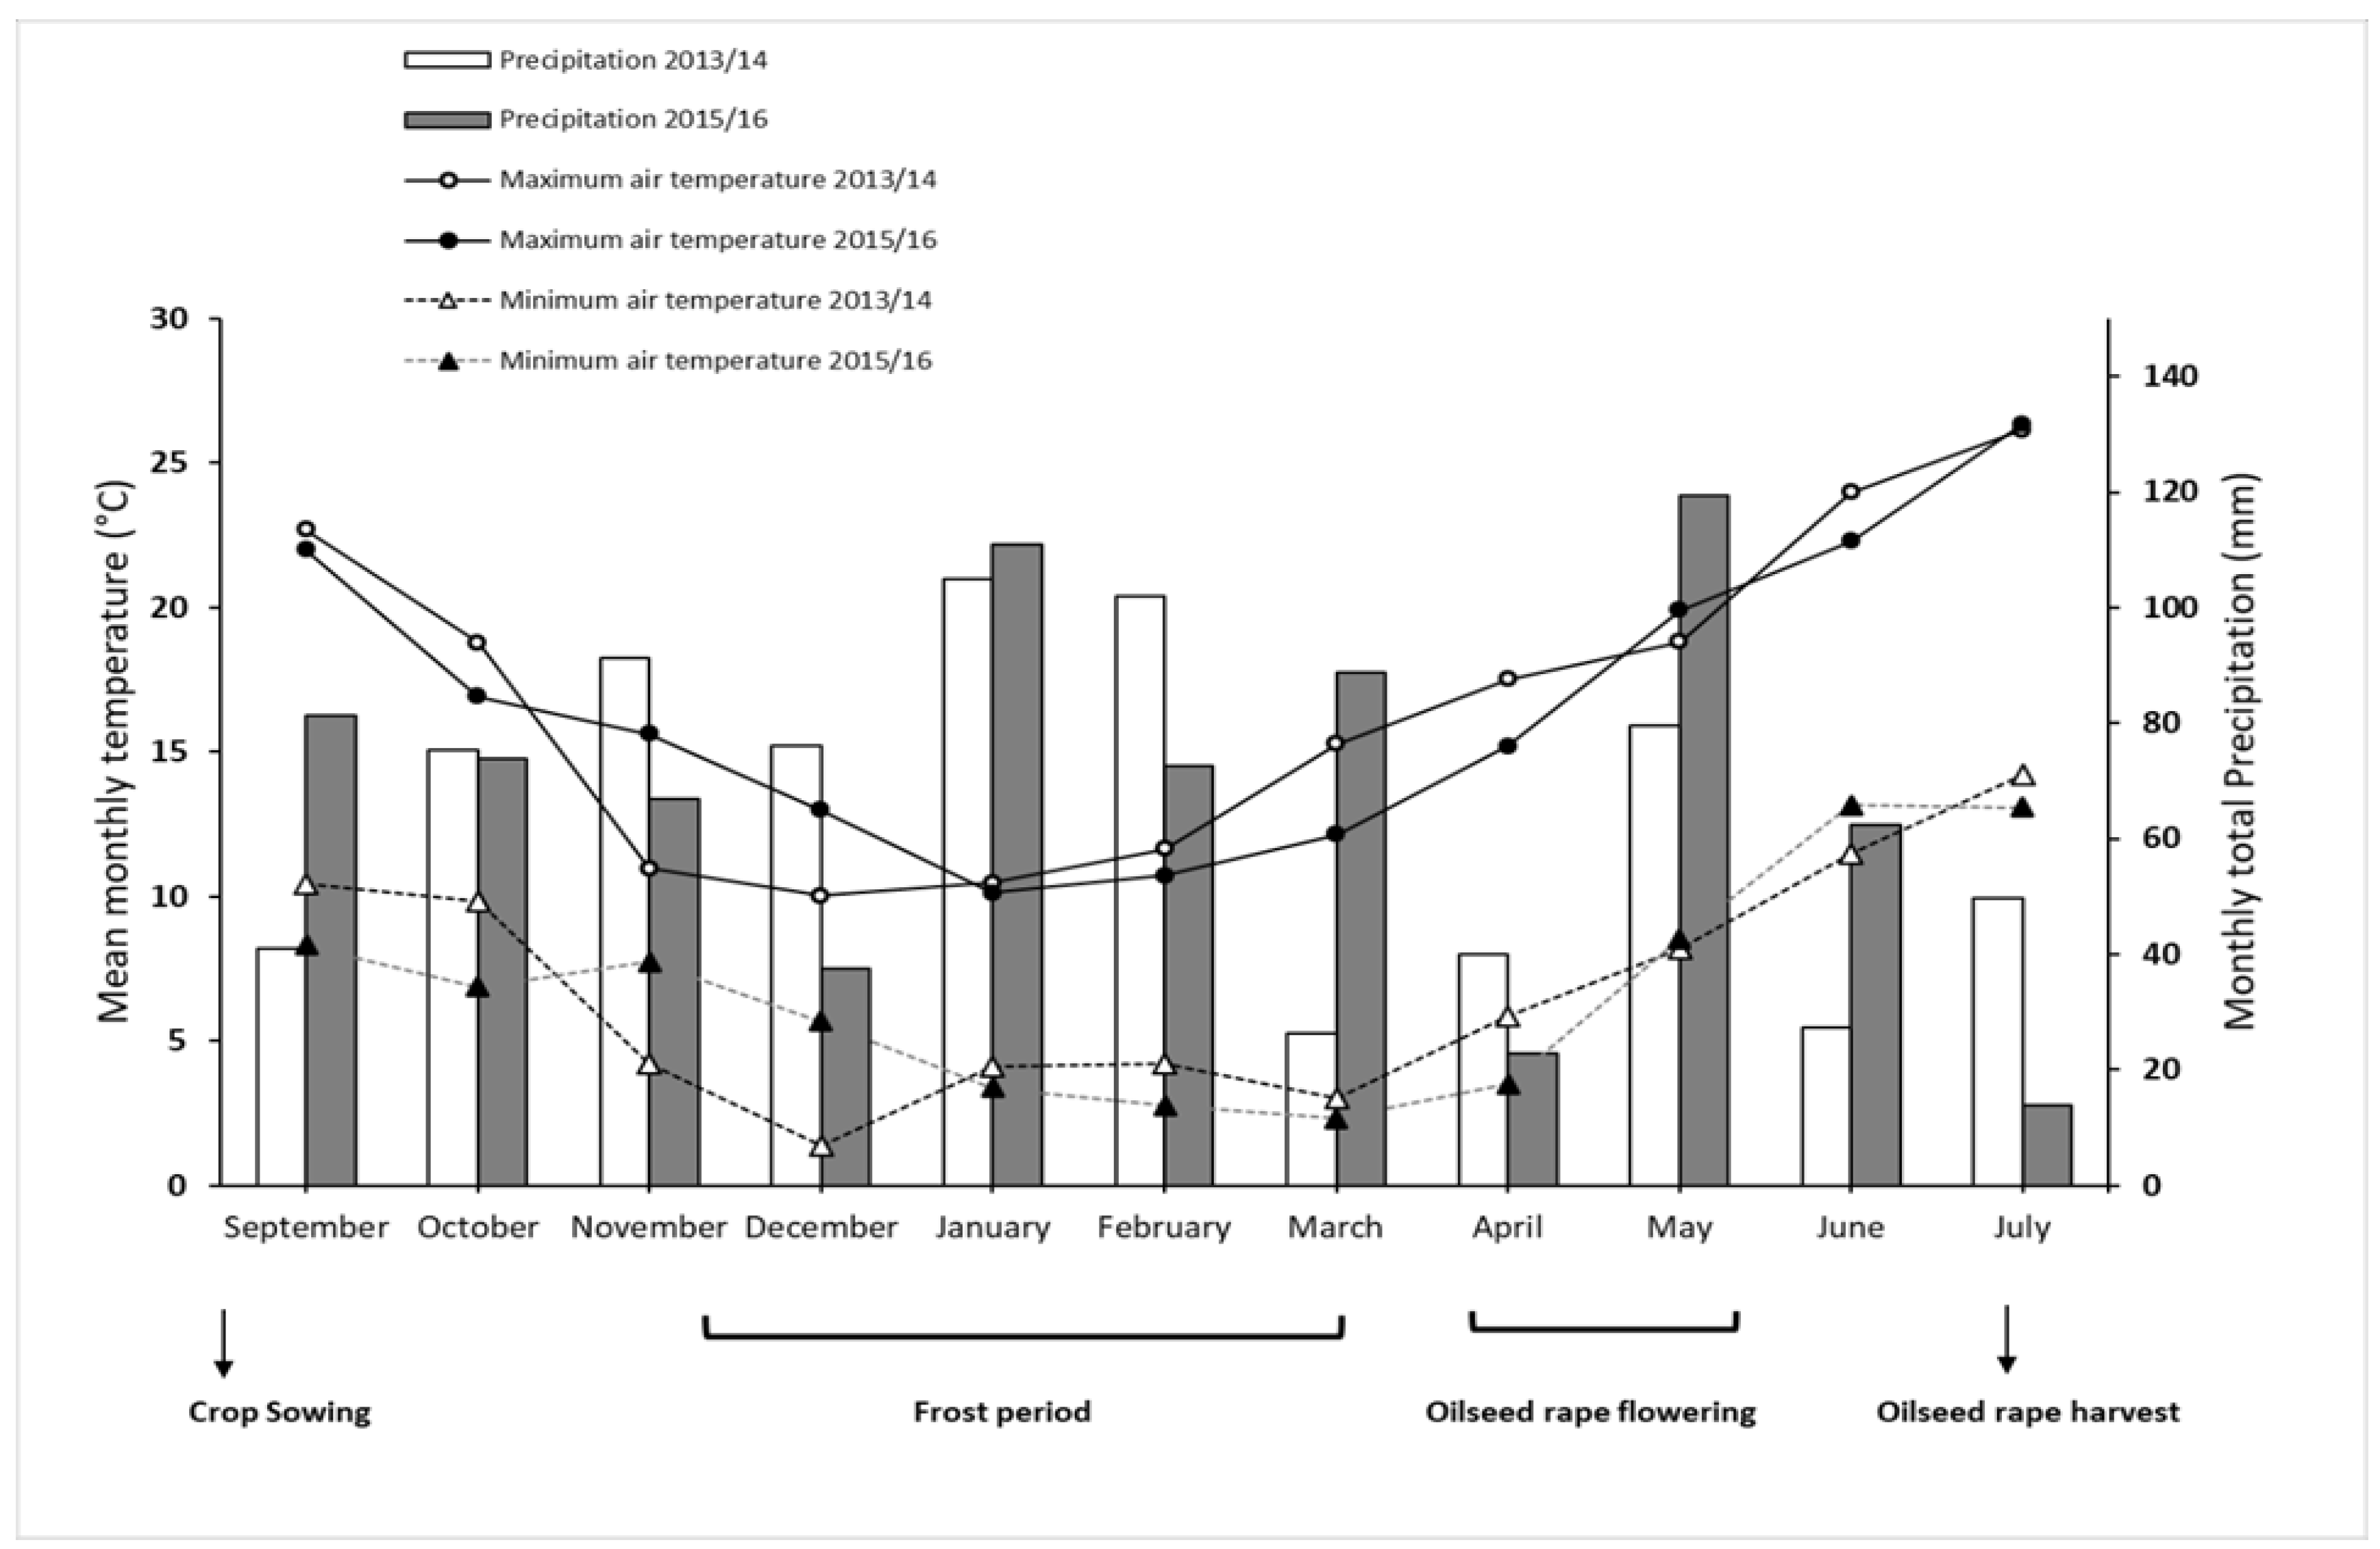
Figure 1. Mean monthly temperature and monthly total precipitation during the 2013/14 and 2015/16 experimental years.
Agronomy 12 02187 g001
Figure 2. Effects of legume species on intercropped oilseed rape (OR) with faba bean (OR F IC) or common vetch (OR V IC) before winter (BW) in December and after winter (AW) in February compared to oilseed rape sole crop (OR SC). Values are mean (n = 8) ± standard error for the two experimental years (2013/14 and 2015/16), except for leaf area after winter (n = 4), which was measured only in 2013/14. Columns with the different letters are significantly different using Tukey’s studentized range test (Tukey’s HSD; α = 0.05).
Agronomy 12 02187 g002
Figure 3. Total and partial Land Equivalent Ratio (LER) of oilseed rape (OR), faba bean (F) and common vetch (V) using aboveground biomass (DW) and soil N uptake (Ndfs) before winter (BW) in December and after winter (AW) in February when oilseed rape is intercropped using a replacement design with faba bean (OR F IC) or common vetch (OR V IC). Values are mean (n = 8) ± standard error for the two experimental years 2013/14 and 2015/16. “*” above the histogram indicates that a total LER was significantly higher than 1 at p = 0.05, whereas “*” on the histogram indicates that a partial LER was significantly higher than 0.5 at p = 0.05.
Agronomy 12 02187 g003
Figure 4. Weed aboveground biomass (t ha−1) as a function of the crop aboveground biomass (a) and crop soil N uptake (b), and weed density as a function of crop aboveground biomass (c) for all treatments. Linear regression was carried out for the combined two years and included both the sole and intercropped treatments after winter in February. “*”, “**”, “***” indicate that a regression is significant at p < 0.001, p < 0.05, p < 0.01, respectively, according to the table proposed by Fisher and Yates (1938) [65].
Agronomy 12 02187 g004
Figure 5. Comparison between the sole crops and intercropping on crop growth (height and crop dry matter) and soil N uptake and their effects on weed suppression after winter in February by using radar plots for each experimental year in 2013/14 and 2015/16. Oilseed rape sole crop (OR SC), faba bean sole crop (F SC), common vetch sole crop (V SC), and oilseed rape intercropped with faba bean (OR F IC) or common vetch (OR V IC). Weed DW and weed N uptake indicate the proportion (%) of weed aboveground biomass and weed aboveground N in the total (weeds and crops), respectively. Crop N uptake indicates the quantity of N derived from soil by crop (kg ha−1). Crop DW indicates the quantity of aboveground biomass produced by crop (t ha−1). ICs and SCs were compared each year for several variables (crop traits and weed infestation) by radar plots using scores calculated for each variable and for each year separately through the minimum (min) and maximum (max) observed values as follows: Score = 10 ∗ (value − min)/(max − min).
Agronomy 12 02187 g005
Table 1. Characteristics of the topsoil (0 to 30 cm) before crop establishment in 2013/14 and 2015/16.
2013/142015/16NormsAnalysis Method *
Granulometric analysis% Clay14.716.2 Granulometric analysis after decarbonation (×31.107)
% Silt2220.3
% Sand61.138.5
Chemical analysispH (water)7.38.2 Water extraction, “acidity active” (NF ISO 10390)
CaCO3 Total (%)<0.122.5 (NF ISO 10693)
P2O5 (mg kg−1)1766020 to 70Olsen (NF ISO 11263)
K2O (mg kg−1)46639280 to 150Extraction with ammonium acetate (NF × 31.108)
MgO (mg kg−1)316250100 to 140Extraction with ammonium acetate (NF × 31.108)
% Organic matter2.22.62.20Organic carbon × 1.72 (NF ISO 14235)
% Carbon1.261.511.3Oxidizable soil organic matter determination
% Total N0.170.170.15DUMAS (NF ISO 13878)
* Soil physico-chemical analyses were achieved by AUREA laboratory approved by the Ministry of Food, Agriculture and Fisheries in France. The laboratory applies the protocol based on the European norms (NF).
Table 2. Dates of weed and crop biomass samplings with the corresponding days after sowing and crop growth stages (BBCH) in 2013/14 and 2015/16.
2013/142015/16
Days after SowingGrowth Stage 1Days After SowingGrowth Stage 1
Oilseed Rape Faba BeanCommon Vetch Oilseed Rape Faba BeanCommon Vetch
2013 2015
Crop and weed biomass74Leaf development (16)Formation of side shoots (21)Stem elongation (34)85Leaf development (16)Formation of side shoots (21)Stem elongation (34)
2014 2016
Crop and weed biomass151Stem elongation (32)Inflorescence emergence (55)Inflorescence emergence (51)168Inflorescence emergence (51)__
Oilseed rape yield286Ripening (81)__294Ripening (81)__
“_” indicates that the legumes species were partially or totally killed by frost and disease. 1 According to BBCH scale [57] at sampling date (achieved on 5 plants by harvest area).
Table 3. Comparison of aboveground variables and soil mineral N uptake between three sole crops: oilseed rape (OR), faba bean (F) and common vetch (V) growth and soil N uptake as sole crops (SC) before winter in December and after winter in February. Values are mean (n = 8) ± standard error for 2013/14 and 2015/16 except for crop leaf area after winter (n = 4) ± standard error, which was measured only in 2013/14.
Before Winter
OR SCF SCV SCp-Value 1
Density (plt m−2)45.48 ± 1.57 b36.90 ± 1.80 c70.83 ± 4.69 a1.39 × 10−6 ***
Leaf area (cm2 plt−1)299.83 ± 25.95 b884.19 ± 37.92 a157.66 ± 16.32 c8.71 × 10−12 ***
Aboveground biomass (g plt−1)2.15 ± 0.19 b5.44 ± 0.16 a1.13 ± 0.07 c2.42 × 10−12 ***
Soil mineral N uptake (g plt−1)0.06 ± 0.01 a0.05 ± 0.00 a0.01 ± 0.00 b1.48 × 10−9 ***
Canopy height (cm)21.10 ± 1.25 b70.90 ± 4.41 a18.20 ± 0.97 b3.07 × 10−11 ***
After Winter
Density (plt m−2)45.83 ± 3.10 ab35.71 ± 1.37 b48.57 ± 4.27 a3.58 × 10−2 *
Leaf area (cm2 plt−1)418.00 ± 90.08739.30 ± 125.89548.36 ± 18.07NS
Aboveground biomass (g plt−1)2.95 ± 0.50 b8.52 ± 1.27 a2.26 ± 0.41 b1.80 × 10−4 ***
Soil mineral N uptake (g plt−1)0.10 ± 0.02 a0.10 ± 0.02 a0.03 ± 0.01 b2 × 10−2 *
Canopy height (cm)14.13 ± 1.61 b66.73 ± 4.28 a21.60 ± 2.95 b5.65 × 10−9 ***
Means within the same row with different letters are significantly different at p < 0.05. NS: Means were not significantly different. ***, *, indicate significant differences among species at p < 0.001, p < 0.01, respectively. 1 p-values (analysis of variance ANOVA Type III, sum of squares, α = 0.05).
Table 4. Effects of oilseed rape (OR), faba bean (F) and common vetch (V) grown as sole crops (SC) or as intercrops (IC) on weed infestation before winter (BW) and after winter (AW) in 2013/14 and 2015/16. Values are mean (n = 4) ± standard error for the two separate experimental years.
Weed Aboveground
Biomass (t ha−1)
Weed Biomass in Total Aboveground Biomass (%)Weed N (kg ha−1)Weed N in Total
Aboveground N (%)
Weed Density (plt m−2)Weed Leaf Area Index
(m2 m−2)
BWAWBWAWBWAWBWAWBWAWBWAW
2013/14
OR SC0.20 ± 0.03 0.48 ± 0.08 ab13.80 ± 1.85 ab18.13 ± 3.03 ab 6.28 ± 1.2415.24 ± 2.65 ab14.62 ± 1.8 b16.26 ± 2.34 b224.29 ± 55.28153.10 ± 43.920.31 ± 0.070.67 ± 0.15
F SC0.17 ± 0.070.25 ± 0.08 b 8.08 ± 3.79 b 6.27 ± 2.19 c 3.51 ± 1.27 6.97 ± 1.76 b16.82 ± 5.25 b13.99 ± 4.29 b228.57 ± 79.13138.33 ± 34.790.40 ± 0.170.50 ± 0.15
V SC0.30 ± 0.090.67 ± 0.11 a28.15 ± 6.67 a24.73 ± 3.16 a 7.72 ± 1.9320.52 ± 3.33 a49.97 ± 9.47 a42.69 ± 3.52 a182.38 ± 72.73183.10 ± 43.020.47 ± 0.111.10 ± 0.21
OR F IC0.23 ± 0.050.39 ± 0.06 ab12.32 ± 3.07 ab 9.62 ± 1.76 bc 6.17 ± 1.1511.58 ± 1.68 ab16.72 ± 3.97 b15.11 ± 1.62 b168.33 ± 31.91205.95 ± 40.280.33 ± 0.050.76 ± 0.13
OR V IC0.31 ± 0.090.48 ± 0.06 ab24.94 ± 6.26 a16.01 ± 1.43 ab 9.68 ± 3.1615.11 ± 2.04 ab31.78 ± 9.36 ab21.32 ± 1.66 b204.76 ± 94.03165.48 ± 33.160.71 ± 0.250.74 ± 0.11
p-value 1NS4.33 × 10−2 * 8.32 × 10−3 **1.97 × 10⁻³ **NS3.70 × 10−2 *7.55 × 10−3 ** 1.61 × 10⁻⁴ ***NSNSNSNS
2015/16
OR SC0.77 ± 0.101.17 ± 0.10 ab51.16 ± 4.43 a64.41 ± 4.89 a22.05 ± 1.4226.03 ± 2.41 ab51.58 ± 3.9259.33 ± 5.47 b906.67 ± 185.63786.90 ± 148.591.28 ± 0.14_
F SC0.53 ± 0.041.00 ± 0.12 bc20.66 ± 1.66 c33.21 ± 4.24 b22.11 ± 2.3633.37 ± 3.99 ab50.20 ± 2.7661.03 ± 5.27 b585.00 ± 64.45561.19 ± 177.171.34 ± 1.80_
V SC0.57 ± 0.111.37 ± 0.10 a38.61 ± 7.28 abc76.30 ± 2.07 a20.85 ± 3.3735.52 ± 2.00 a66.73 ± 6.4894.04 ± 1.03 a719.76 ± 246.65715.48 ± 235.561.19 ± 0.26_
OR F IC0.62 ± 0.120.76 ± 0.06 c27.36 ± 4.49 bc25.46 ± 4.53 b24.77 ± 5.2323.11 ± 0.96 b42.75 ± 5.435.83 ± 5.56 c695.48 ± 198.57438.10 ± 111.111.53 ± 0.24_
OR V IC0.71 ± 0.091.29 ± 0.08 a46.83 ± 4.07 ab62.50 ± 3.99 a23.09 ± 3.0432.02 ± 3.04 ab54.83 ± 5.7662.42 ± 3.07 b712.14 ± 98.53603.81 ± 159.351.36 ± 0.17_
p-value 1NS3.49 × 10−05 ***2.49 × 10⁻³ ** 4.53 × 10−06 ***NS1.35 × 10−2 * NS5.55 × 10−05 ***NSNSNS
Means within each column and experimental year with different letters are significantly different (p < 0.05). NS: Means were not significantly different. ***, **, *, indicate significant differences among species at p < 0.001, p < 0.05, p < 0.01, respectively. 1 p-values (analysis of variance ANOVA Type III, sum of squares, α = 0.05). “_ “: unavailable data.
Table 5. The Shannon–Wiener index (H), species richness (S) and the Simpson evenness index (D) corresponding to the treatments of oilseed rape (OR), faba bean (F) and common vetch (V) grown as sole crops (SC) or as intercrops (IC) carried out using the means (n = 8) ± standard error in 2013/14 and 2015/16.
Before WinterAfter Winter
TreatmentH S DH S D
OR SC1.52 ± 0.1316.25 ± 0.930.65 ± 0.051.55 ± 0.1914.25 ± 1.060.65 ± 0.06
F SC1.70 ± 0.1817.50 ± 0.560.68 ± 0.051.51 ± 0.1213.25 ± 0.820.66 ± 0.05
V SC1.66 ± 0.2016.63 ± 1.130.68 ± 0.071.92 ± 0.4615.13 ± 1.080.65 ± 0.06
OR F IC1.64 ± 0.1916.38 ± 0.730.65 ± 0.061.38 ± 0.1514.13 ± 0.910.64 ± 0.05
OR V IC1.66 ± 0.1915.13 ± 1.100.69 ± 0.072.19 ± 0.5214.63 ± 0.880.64 ± 0.06
Table 6. The grain yield components of oilseed rape grown as either a sole crop (OR SC) or intercropped with faba bean (OR F IC) or common vetch (OR V IC) in 2013/14 and 2015/16. Values are mean (n = 3) ± standard error.
TreatmentPlant m−2Grain Yield
(t ha−1)
Grain Yield (g plt−1)Weight per 1000 Seed (g)Number of Grains m−2Number of Grains per Plant
2013/14
OR SC37 ± 0.4 a1.82 ± 0.194.89 ± 0.514.40 ± 0.0541187 ± 39381109 ± 106
OR F IC15 ± 1.6 b1.17 ± 0.338.08 ± 2.824.66 ± 0.1025371 ± 75671771 ± 654
OR V IC21 ± 1.4 b1.51 ± 0.18 7.6 ± 1.414.58 ± 0.1632747 ± 29601632 ± 246
p-value 12.76 × 10⁻³ **NSNSNSNSNS
2015/16
OR SC49 ± 1.6 a1.57 ± 0.453.24 ± 0.99 b3.41 ± 0.0645649 ± 12620940 ± 275 b
OR F IC21 ± 0.8 b1.97 ± 0.169.39 ± 0.54 a3.42 ± 0.0557515 ± 39992741 ± 138 a
OR V IC23 ± 1.1 b1.47 ± 0.236.28 ± 0.81 ab3.34 ± 0.0543,865 ± 63451874 ± 225 ab
p-value 11.76 × 10⁻⁴ ***NS4.92 × 10−2 *NSNS3.96 × 10−2 *
Means within each column and experimental year with different letters are significantly different (p < 0.05). NS: Means were not significantly different. ***, **, *, indicate significant differences among species at p < 0.001, p < 0.05, p < 0.01, respectively. 1 p-values (analysis of variance ANOVA Type III, sum of squares, α = 0.05).
Publisher’s Note: MDPI stays neutral with regard to jurisdictional claims in published maps and institutional affiliations.