Article

Monitoring Growth Status of Winter Oilseed Rape by NDVI and NDYI Derived from UAV-Based Red–Green–Blue Imagery

by
Nazanin Zamani-Noor
* and
Dominik Feistkorn
Julius Kühn-Institute (JKI), Institute for Plant Protection in Field Crops and Grassland, Messeweg 11-12, D-38104 Braunschweig, Germany
*
Author to whom correspondence should be addressed.
Agronomy 2022, 12(9), 2212; https://doi.org/10.3390/agronomy12092212
Submission received: 28 August 2022 / Revised: 12 September 2022 / Accepted: 13 September 2022 / Published: 16 September 2022
(This article belongs to the Section Precision and Digital Agriculture)

Abstract

:
The current study aimed to evaluate the potential of the normalized difference vegetation index (NDVI), and the normalized difference yellowness index (NDYI) derived from red–green–blue (RGB) imaging to monitor the growth status of winter oilseed rape from seeding to the ripening stage. Subsequently, collected values were used to evaluate their correlations with the yield of oilseed rape. Field trials with three seed densities and three nitrogen rates were conducted for two years in Salzdahlum, Germany. The images were rapidly taken by an unmanned aerial vehicle carrying a Micasense Altum multi-spectral camera at 25 m altitudes. The NDVI and NDYI values for each plot were calculated from the reflectance at RGB and near-infrared (NIR) bands’ wavelengths pictured in a reconstructed and segmented ortho-mosaic. The findings support the potential of phenotyping data derived from NDVI and NDYI time series for precise oilseed rape phenological monitoring with all growth stages, such as the seedling stage and crop growth before winter, the formation of side shoots and stem elongation after winter, the flowering stage, maturity, ripening, and senescence stages according to the crop calendar. However, in comparing the correlation results between NDVI and NDYI with the final yield, the NDVI values turn out to be more reliable than the NDYI for the real-time remote sensing monitoring of winter oilseed rape growth in the whole season in the study area. In contrast, the correlation between NDYI and the yield revealed that the NDYI value is more suitable for monitoring oilseed rape genotypes during flowering stages.

1. Introduction

Monitoring the growth status of winter oilseed rape (WOSR, Brassica napus L.) within a season is essential to decision-making in a precision farming system (PFS). PFS is an agricultural production method that considers the spatial variability of field conditions (e.g., seedbed, pest and pathogen infestation, weeds management) that influence crop production. PFS consists of the collection of data, drafting of field variabilities, making decisions, and the application of management practices. Remote sensing facilities can be adequately applied at PFS, especially when the field variability maps are involved or modernized to help farmers approve appropriate methods based on variable management policies within a field according to the location conditions. Based on diverse platforms, agricultural remote sensing could be classified into near-ground remote, aerial remote, and satellite remote sensing. Multi-temporal imaging using an unmanned aerial vehicle (UAV) has recently become a rapidly developing technology. It has been broadly applied in monitoring field crops due to its high competence, elevated temporal and geographical resolution, easy customization, and low cost [1,2,3,4,5]. It provides farmers and scientists with the actual and instinctive determination of crop growth status, as color images indicate particular vegetation greenness. In addition, it provides more significant signals for predicting or perceiving the physiological variations during plant vegetation development.
Spectral vegetation indices, for example, the normalized difference vegetation index (NDVI) or the normalized difference yellowness index (NDYI), have been widely used in past decades to estimate fractional field vegetation and cover quantitatively and qualitatively. Plant pigments, principally carotenoids and chlorophyll, adsorb actively in the visible part of the spectrum other than for the green sector. Nevertheless, such strong adsorption does not appear in the spectrum’s near-infrared (NIR) part, leading to high reflectance in the NIR region from green and healthy plants. The NDVI applies measured reflectance values in red and NIR regions to obtain important information on crop physiological development and yield, interacting with environmental and practical characteristics such as water content, seed density, plant genotype, and fertilizers. By using NDVI values, seeding performance, the seed germination rate, and canopy cover were extensively estimated in potatoes, maize, rice, sugar beet, sunflower, and oilseed rape cultivations [6,7,8,9]. Further studies have demonstrated that multispectral reflectance profiles of visible bands (red, green, and blue (RGB)) and NIR bands could also determine canopy features, such as nitrogen use efficiency and leaf area index (LAI), as well as flower numbers [10,11,12,13,14,15,16]. Zeng et al. [17] assessed the capability of NDVI derived from RGB images, which UAV collected, in the prediction of yield in winter wheat cultivations by correlating it to multi-source observations (structure, thermal, volumetric metrics, as well as ground-observed LAI and chlorophyll content) under different levels of nitrogen fertilization. They have shown that a number of the color indices gathered at the seedling, flowering, and early maturity growth stages had an excessive correlation (R2 = 0.76–0.93) with wheat seed yield. It was concluded that LAI at the stem elongation stage is closely related to the yield. Thus, the remote assessment of LAI at this growth stage could be used to specify the yield in oilseed rape cultivations. In other research conducted by Stoyanova et al. [18], the data from a multispectral camera was analyzed to evaluate the development of the oilseed rape and wheat crops on the field. They focused on achieving an agronomic evaluation and making recommendations for optimization of the production by plant and soil sampling to increase yields and reduce the cost of production. Analyzing the NDVI values enabled them to classify areas with good crop development and areas with poor vegetation. Furthermore, Peng et al. [19] developed a method to determine plant yield based entirely on remotely sensed data in oilseed rape crops under different sowing methods and nitrogen fertilizer applications. In their study, LAI derived from NDVI values was measured at four different growth stages, which were later correlated with the yield of oilseed rape. Moreover, Zhang et al. [20] evaluated the application of vegetation indices to estimate the number of oilseed rape flowers and developed a descriptive model of oilseed rape yield. They found that the NDYI was a convenient vegetation index for defining oilseed rape yellowness, which is related to oilseed rape flowering intensity during the full flowering growth stage.
Winter oilseed rape is the main oilseed crop not only in Germany but also in Europe [21], and it is mainly grown for edible oil, biofuel, and medicine. In order to optimize WOSR yield and seed quality, optimal agronomic management concerning WOSR growth stages is essential. Compared to other arable crops such as wheat, maize, or soybean, the WOSR architecture and coverage were enormously different during its entire growing season since leaves, stems, buds, yellow flowers, and pods appeared gradually. When considering these restrictions, remote sensing techniques based on hyperspectral data of plants over the top canopy are needed for accurately monitoring WOSR during its development.
To date, few efforts have been made on RGB-based agricultural applications during the entire oilseed rape growing season due to its different growth variations with environmental changes over time. On the other hand, analyzing the time-series variation in crop growth needs long-term measurement of the oilseed rape crop during plant development. An optimal solution is the use of aerial photographs from UAV aircraft. Therefore, in this study, we emphasize (1) evaluating the potential of multi-temporal imaging using an unmanned aerial vehicle (UAV) for calculating normalized difference vegetation index (NDVI) and normalized difference yellowness index (NDYI) during the oilseed rape growing season (2) estimating the effects of seed density and nitrogen fertilizer treatments on NDVI and NDYI values, and (3) finding out the specific phenological stages in which the collected data are correlated with the oilseed rape yield.

2. Materials and Methods

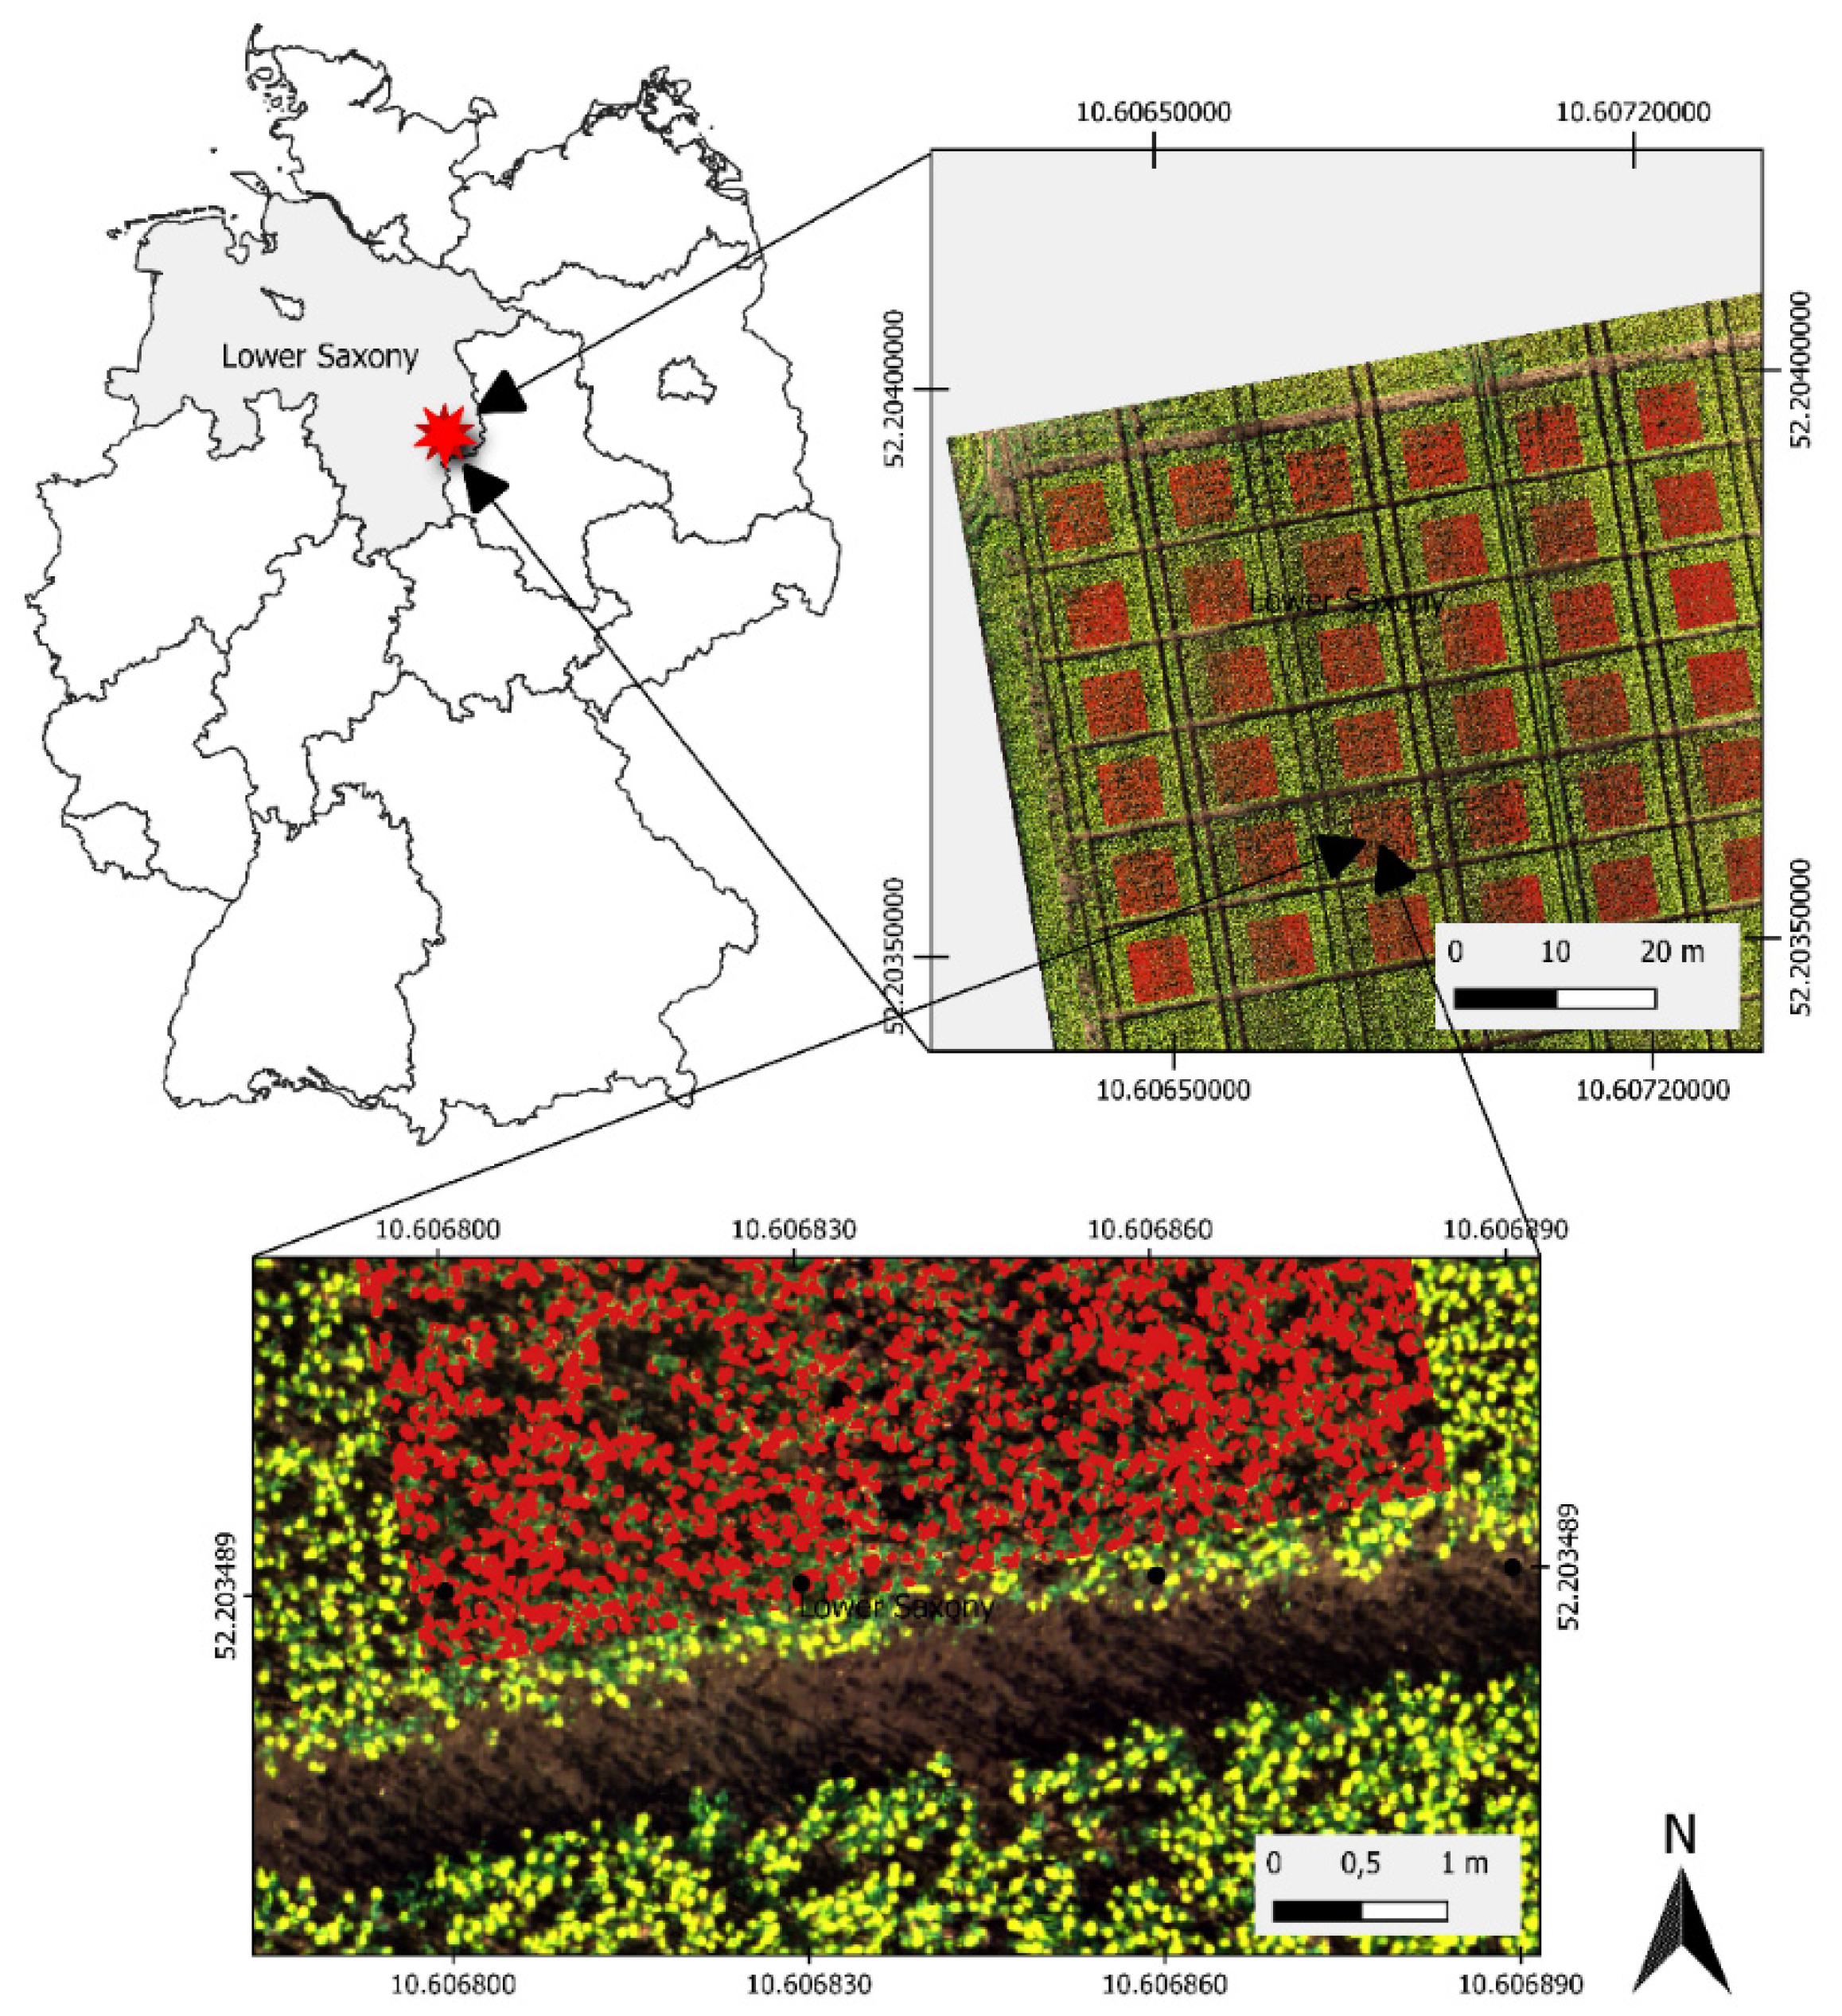
2.1. Field Trial Location and Experimental Design

Field trials were conducted over two consecutive years in Salzdahlum (52°12’16.3” N 10°36’30.8” E), Lower Saxony, Germany, in 2019–2020 and 2020–2021 (Figure 1). The experiment was laid out in a split-plot block design, in which plant densities were the main factor, and N-Fertilizers were the sub-factor, with four replications. The plot size was 10 × 4.5 m. Both field trials were non-irrigated. Winter wheat was the previous crop for the plots sown during both growing seasons.
The winter oilseed rape-growing season in this area would start between 15 August and 15 September and would end approximately at the end of June or the beginning of July of the following year. Figure 2 represents the development stages of WOSR after sowing in the current study.
Seeds of winter oilseed rape cv. Avatar (Norddeutsche Pflanzenzucht Hans-Georg Lembke KG, Holtsee, Germany) were drilled in 22.5 cm rows on 25 August 2019 and 31 August 2020, respectively, at seeding rates of 30 (low density), 50 (moderate density), and 70 (high density) seeds m2. In addition, to stimulate variability between plots to study the relation of NDVI with several vegetation indices related to crop growing status, three levels of nitrogen were applied to the field (160 (low), 200 (moderate), and 280 (high) kg [N] ha−1). Nitrogen was broadcasted twice as urea fertilizer (46% N), with 60% during the over-wintering period and 40% at the beginning of spring, respectively.
Weather data associated with the experimental location (monthly precipitation (mm), relative humidity (%), and mean air temperature (°C)) were obtained from the German National Weather Service (Deutscher Wetterdienst: DWD) between August 2019 and July 2021. Good weeds, pathogen, and pest control in both field trials were achieved by applying appropriate herbicides, fungicides, and insecticides [22].
At the end of the season, plots were harvested on 8 July 2020 and 20 July 2021, respectively, with a Haldrup-C58 plot combine-harvester (Haldrup GmbH, Ilshofen, Germany), and the seed yield was determined at a water content of 9% [23].

2.2. Unmanned Aerial Vehicle (UAV) Platform and Digital Sensor

The current study conducted flight missions with an octocopter (CiS GmbH, Rostock, Germany). The system had a take-off weight of approximately 2.2 kg and was capable of flight times up to 15–20 min. It could depart and land based on a global positioning system (GPS) and a computer-based geographical information system (Quantum GIS; www.qgis.org; accessed on 11 September 2018). The flight route was designed in QGIS software (version 3.14.16-Pi) by importing landscape coordinates of the trial borderlines.
A multi-spectral camera (MicaSense, Seattle, WA, USA) was used to acquire images (12-bit raw image) with an image resolution of 1.22 megapixels (1280 × 960 pixels) for each of five spectral bands (blue: 475 ± 20 nm; green: 560 ± 20 nm; red: 668 ± 10 nm; red edge: 717 ± 10 nm; and near-infrared: 840 ± 10 nm). The camera was attached to the UAV by one plate with a shock absorption rubber/spring damping suspension system to protect against any vibration and to ensure a better quality of the images. Before each image acquisition, one image was taken from bare ground-control points for radiometric calibration.

2.3. Image Acquisition

The flight campaigns were operated at approximately 25 m in altitude and a speed of 2.3–2.5 ms−1 between 8:00 a.m. and 3:00 p.m. (local time); the flight dates and related crop growth stages are shown in Table 1. The weather was primarily sunny without much wind, so image distortion affected by the weather condition could be eliminated. The UAV platform was adjusted to acquire pictures with 60% forward and 75% lateral overlap to achieve a good image mosaicking performance.

2.4. Image Processing and Data Extraction

After each flight, images were photogrammetrically processed using AgiSoft Metashape software (Agisoft LLC, St. Petersburg, Russia) to develop a 3D model from 2D images. It produced a set of 3D coordinates recognized as a point cloud. Furthermore, the digital surface model and orthomosaic image were developed. Based on the sensor’s characteristics and the camera’s height, the ground resolution cell was 1 × 1 cm. As a result, with the initial resolution of 1 × 1 cm, a series of 10 images was used at each point in this study.
Parameters for estimating the image location and its orientation and corresponding to overlapping neighboring images were specified to high quality. Once the orthomosaic image was generated, QGIS software (www.qgis.org) estimated the spectral vegetation indices using the raster calculator tool. In particular, we used NDVI and NDYI values, which have been known to perform plant growth and development accurately (Table 2).

2.5. Statistical Analyses

Inference about the significance of differences between various treatments was performed by an analysis of variance (ANOVA) using Fisher’s least significant difference (LSD). It was considered significant at p ≤ 0.05 in Statistica version 9.1 (Stat Soft, Inc., Tulsa, OK, USA). In addition, Spearman’s rank correlation coefficient was used to analyze the relationship between vegetation indices with the final yield.

3. Results

3.1. Weather Conditions

The two consecutive growing seasons showed varied temperature, precipitation, and air humidity from seeding date to harvesting time (Table 3). The mean average temperature in autumn, winter, and almost spring in the first investigated season, 2019–2020, was higher, with more precipitation than the following year. In particular, the average temperature in April 2020 (development of buds and flower stages) was 4° higher than in April 2021. In contrast, the rainfall was higher during April and May in 2021 than in 2020. However, precipitation in June and July 2020, during pod development and ripening stages, was significantly higher than in 2021 (Table 3).
In general, the NDVI value varied between −1.0 and +1.0. Values between −1.0 and 0.0 show dead plants or inorganic materials such as stones or buried soil. The healthy vegetation has a low red light and high near-infrared reflectance, indicating high NDVI values. The mounting amount of the positive NDVI values indicates the increase in the amounts of green vegetation. In oilseed rape cultivation, when values of NDVI change from the 0.0 to +1.0 direction, it shows initial crop growth stages such as seed germination and leaves development. Peak NDVI values describe the highest crop growth stages, such as the complete inflorescence emergence stage before flowering stages or the full development of pods. Once the NDVI time series curve changes from positive to negative, it figures out the crop’s flowering or complete ripening stage. Contrary to NDVI, NDYI determined from the green, and blue wavebands reduce limitations of the NDVI during the crop flowering stage.

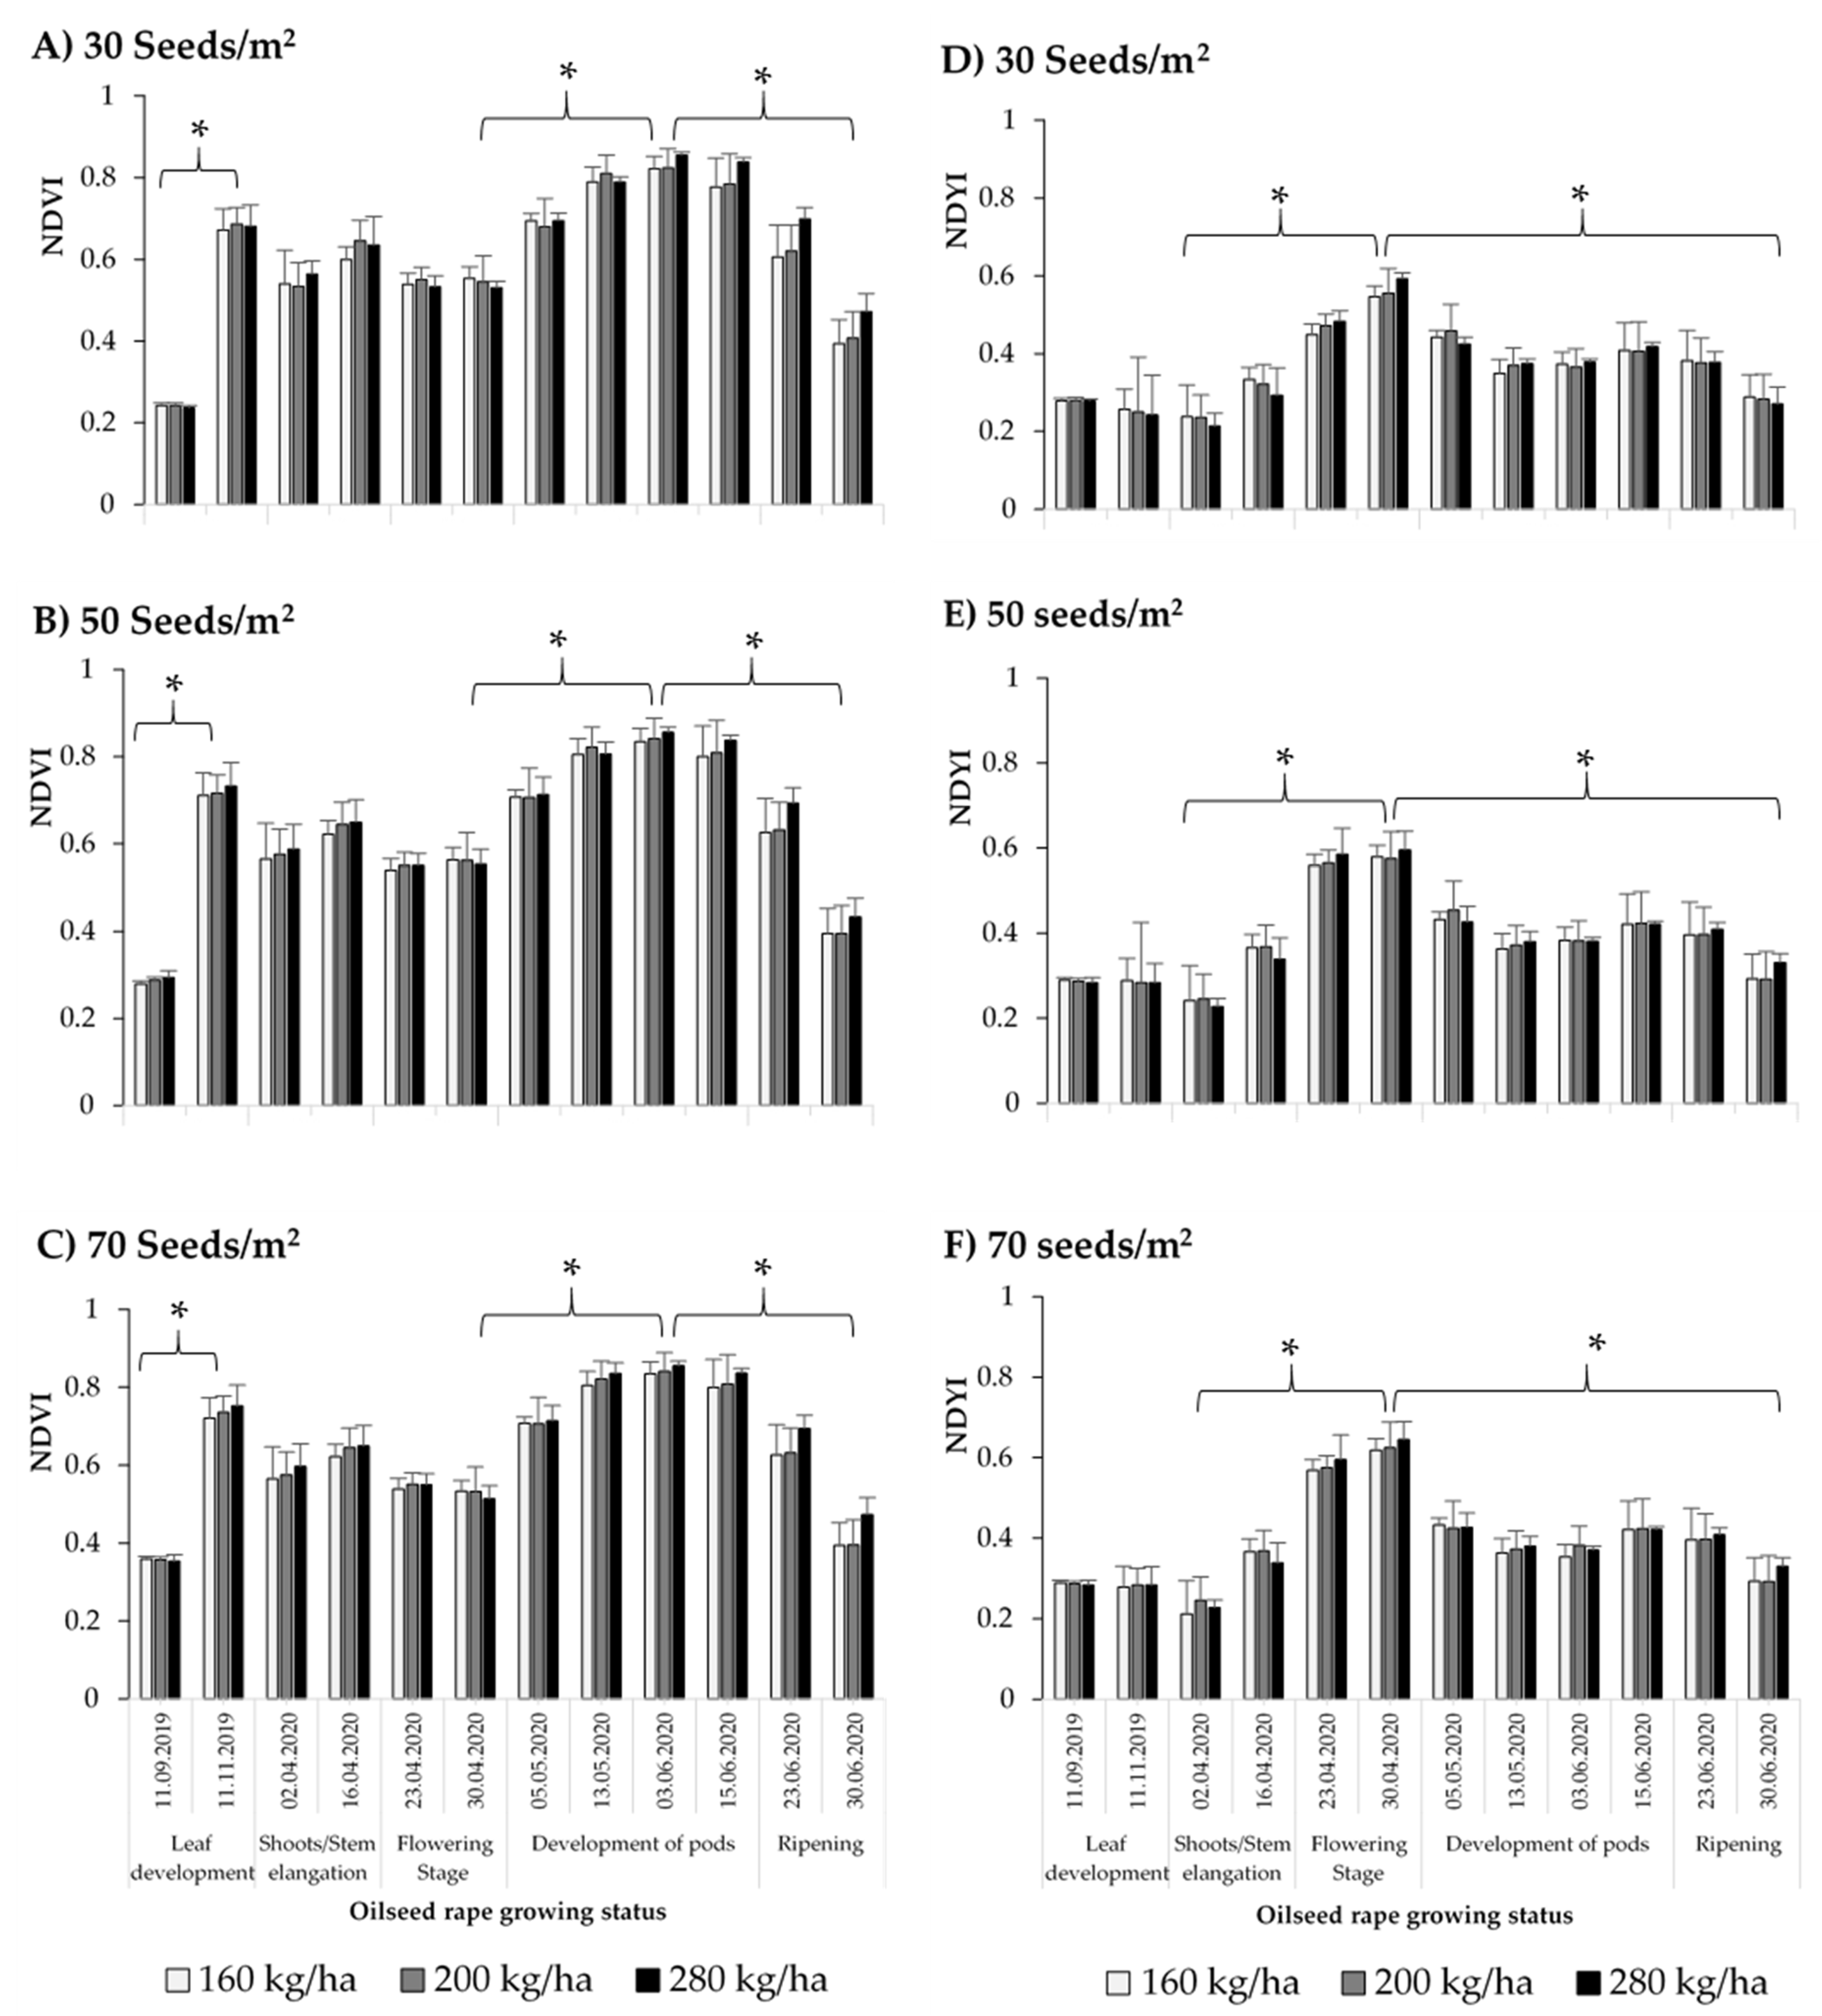
3.2. Monitoring Winter Oilseed Rape Growth Statue in 2019–2020

Twelve flights were conducted by a UAV at an altitude of 25 m during the winter oilseed rape growing season in 2019–2020. NDVI values were estimated over time in each plot using the mosaic images, in which all pixel values were averaged to represent the NDVI in each plot. The mean and standard deviation were estimated for each treatment (Figure 3). At the beginning of the season, 17 days after sowing, the variation of NDVI was observed between plots with different seed densities at the seedling growth stage, BBCH 11–12 (Figure 3A–C). The average NDVI of the three seed densities at this time ranged from 0.24 to 0.35 (Figure 3A–C). From 17 to 78 days after sowing, along with an increase in the number of leaves and green leaf areas, the NDVI increased accordingly. The vegetative peak before winter was noticed at the beginning of November, in which the average NDVI value significantly increased to 0.67 (30 seeds/m2), 0.71 (50 seeds/m2), and 0.73 (70 seeds/m2) at the full leaf development stage (BBCH 19–20; Figure 3A–C). After winter, approximately 220 days after sowing at plant growth stage BBCH 25–29, the NDVI values decreased to approximately 0.54 to 0.58 due to leaf and plant senescence during winter. However, it increased moderately until the full inflorescence emergence stage, BBCH 55–58 (Figure 3A–C). At this time, slight differences were also observed between the plots with different N-fertilizers. Warmer temperatures and higher precipitation between February and April 2020 led to the start of the flowering stage on approximately 20 April. So, the NDVI decreased during the oilseed rape flowering stage from 20–30 April 2020, because of the production of the yellow blossoms (Figure 3A–C). Nevertheless, the mean NDVI increased further during the pod development stages (BBCH 70–79; almost 270–280 days after sowing). The highest value of NDVI was observed on 13 May 2020 at BBCH 73–75, which ranged from 0.81 to 0.84. Differences were also observed between plots with different seed densities and N-fertilizer. The maximum NDVI under the highest N-treatment was higher than those under low and moderate nitrogen treatments (Figure 3A–C). The ripening growth stage in this growing season started in the middle of June, in which the average NDVI decreased strongly until the end of June at the beginning of the oilseed rape senescence stage, BBCH 92–95.
In contrast to NDVI, no variation of NDYI was detected between plots with different seed densities at the seedling growth stage (Figure 3D,E). The average NDYI of the three seed densities at this time ranged from 0.27 to 0.28. Furthermore, no changes in NDYI values were noticed during early crop development until oilseed rape plants reached the full inflorescence emergence stage, BBCH 55–58. At this time, the average NDYI values ranged from 0.33 to 0.36. Slightly greater NDVI was observed in plots treated with the highest amount of N-fertilizer (280 kg ha−1). The highest NDYI was observed at the oilseed rape full flowering stage, BBCH 65–68, in which the values ranged from 0.54 to 0.64. Differences were also observed between plots with different seed densities and N-fertilizer (Figure 3D,E). By the beginning of the pod development stage, BBCH 71–73, the NDYI decreased significantly to 0.42–0.45 (Figure 3D,E). It decreased further until the full pod development stage at BBCH 74–76 (Figure 3D,E). Later, a slight increase was noticed when the pods changed color from green to green/yellowish. However, no significant differences were observed between the plots. Afterward, NDYI values decreased gradually when the pods changed color from yellowish-green to brown. At the end of the oilseed rape growing season (BBCH 88–90), the NDYI values were reduced to 0.28–0.33 (Figure 3D,E).

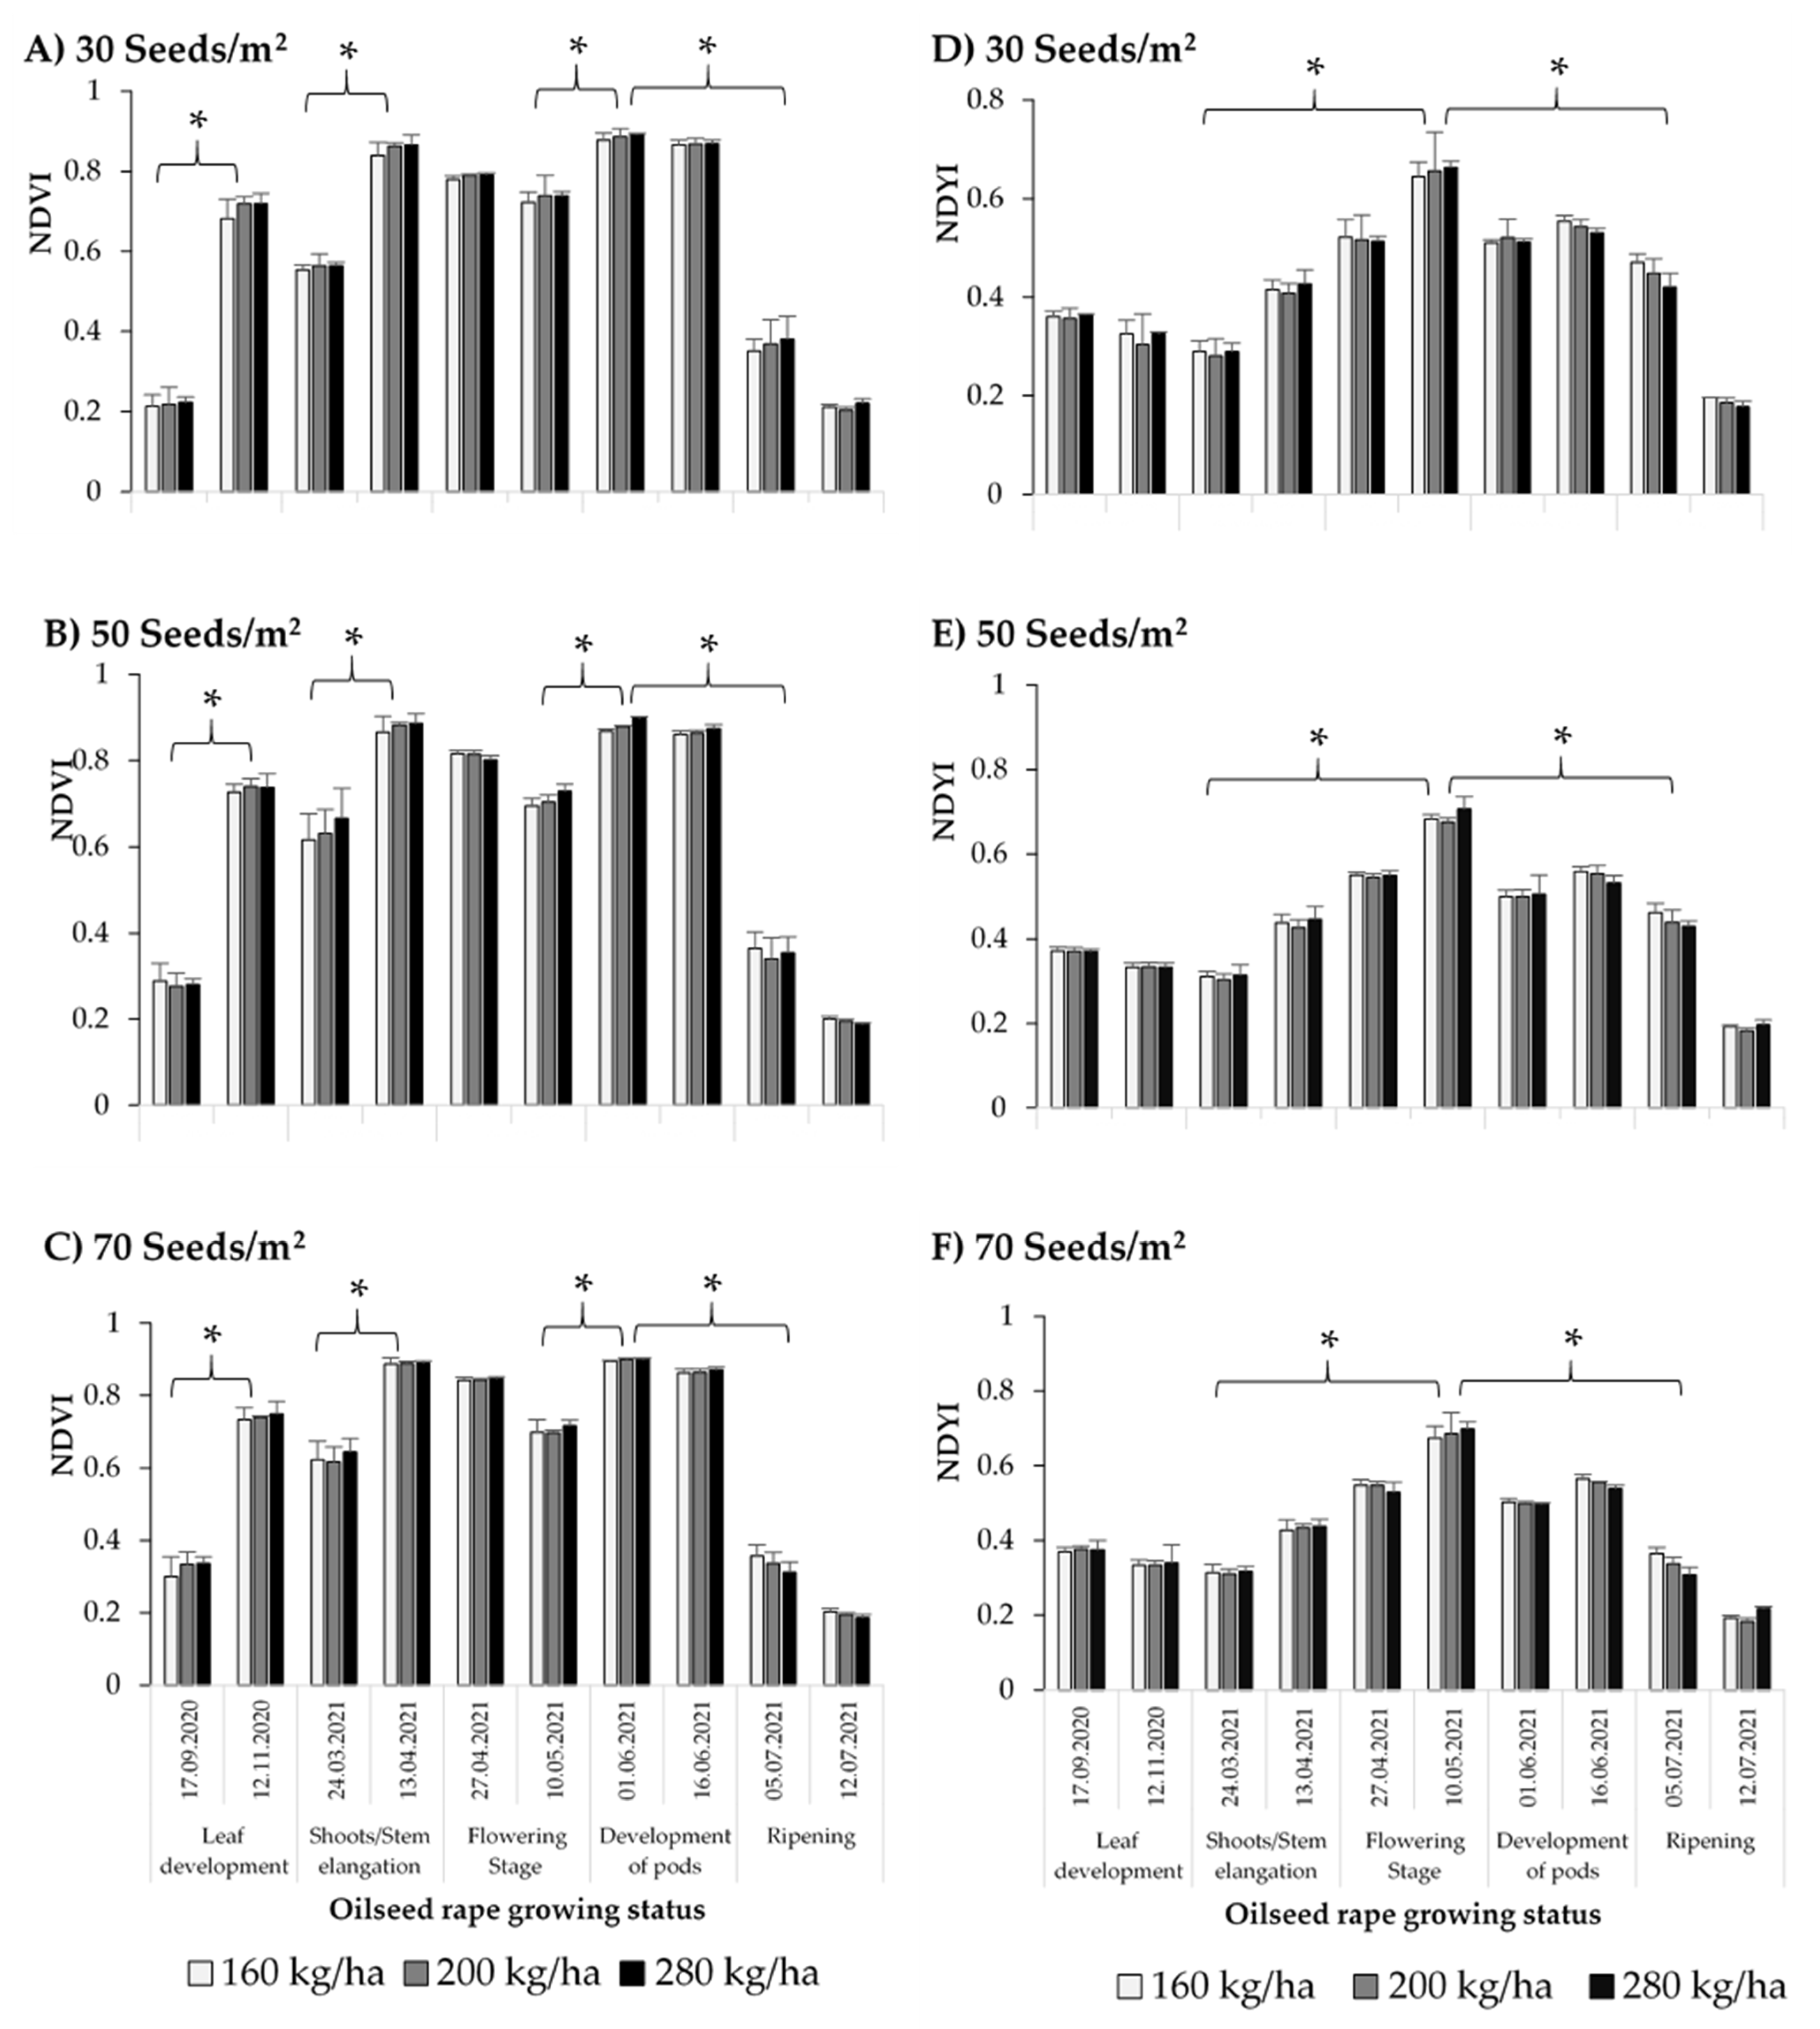
3.3. Monitoring Winter Oilseed Rape Growth Statue in 2020–2021

Ten flights were conducted in this growing season. Almost three weeks after sowing, the average NDVI of the three oilseed rape seed densities ranged from 0.21 to 0.33 for plots with 30 seeds per m2 to plots with 70 seeds per m2, respectively (Figure 4A–C). From approximately 20–56 days after sowing, the NDVI followed a similar trend to the previous oilseed rape growing season and reached the maximum values significantly before winter (NDVI: 0.68–0.74) at the full leaf development stage. From 56–90 days after sowing, NDVI values decreased significantly due to overwintering crops across all treatments from 0.55 to 0.75. Further, in the season, the NDVI values increased significantly until the middle of April (almost 230 days after sowing), which ranged from 0.86 to 0.88. Differences were also noted between plots with different treatments; however, the differences were insignificant (Figure 4A–C). At the beginning of the flowering stage, approximately 25 April, the NDVI values gradually decreased due to the appearance of yellow blossoms. The lowest peak (NDVI: 0.69–0.74) was observed around the 10 May (approximately 250 days after sowing), two weeks later than the previous oilseed rape growing season. However, the NDVI values increased further by the beginning of the pod development stage. From the beginning to the middle of June, the NDVI values increased up to 0.86–0.87, without significant differences among the three seed densities and different nitrogen treatments. The ripening of oilseed rape plants took place at the end of June, in which the NDVI values decreased significantly to 0.18–0.20.
At the beginning of the season (BBCH 11–12), consistent patterns of NDYI values were found across all treatments (NDYI: 0.36–0.37). No significant differences were observed between plots with different seed densities (Figure 4D,E). Later, the NDYI values gradually decreased until the beginning of spring. At the beginning of the flowering stage (BBCH 61–62), the NDYI values kept increasing as the yellow blossoms appeared vigorously (Figure 4D,E). The lower mean temperature during April 2021, compared to April 2020, postponed the full flowering stage, so the highest NDYI values (NDYI: 0.64–0.70) were observed on the 10th of May (full flowering stage; BBCH 65–66). The NDYI decreased significantly to 0.49–0.50 by the beginning of the pod development stage, BBCH 71–73 (Figure 4D,E). Subsequently, similar to the previous year, a slight increase was recognized when the pods changed color from green to green/yellowish. In the following year, NDYI values decreased moderately when the pods changed color from yellowish-green to brown. At the end of the oilseed rape growing season (BBCH 88–90), NDYI values were reduced to 0.18–0.21 (Figure 4D,E).

3.4. Correlation Analysis

Spearman’s rank correlation coefficient (p < 0.05) was used to analyze the relationship between vegetation indices (NDVI and NDY) and the final yield in oilseed rape growing seasons of 2019–2020 and 2020–2021, respectively (Table 4, Table 5, Table 6 and Table 7). Combined across all treatments, the strongest correlations observed in the growing season of 2019–2020 were between the final yield and NDVI values at the full-leaves development stage before winter, BBCH 19–20 (rs = 0.5066, p = 0.0016), followed by the final yield and NDVI of the full pod development stage, BBCH 75–77 (rs = 0.6890, p = 0.00) (Table 4). Weaker correlations and flatter slopes were found between the final yield and NDVI values of beginning of pod development stages, BBCH 70–71 (rs = 0.3482, p = 0.0374) and BBCH 73–75 (rs = 0.4404, p = 0.0072), respectively (Table 4). Furthermore, a significant correlation was observed between the final yield and the NDVI value of the plant at the beginning or ripening stage, BBCH 81–82 (rs = 0.4700, p = 0.0003; Table 4).
In contrast to NDVI values, no significant correlation was observed in the oilseed rape growing season of 2019–2020 between NDYI values and the final yield neither at plant development stages before winter, nor the formation of side shoot and stem elongation stages (Table 5). However, a weak correlation was noted between NDYI and the final yield at the beginning of the oilseed rape flowering stage, BBCH 62–64 (rs = 0.3650, p = 0.0286). The strongest correlation was observed when the plant reached the full flowering stage, BBCH 65–68 (rs = 0.6687, p = 0.0005). Furthermore, the correlations strongly decreased from flowering time to maturity (Table 5). Finally, at the beginning of the plant ripening stage, BBCH 81–82, there was a good relationship between the NDYI values and the final yield (rs = 0.5294, p = 0.0009).
Table 6 shows Spearman’s rank correlation coefficient between the final yield and NDVI values during the winter oilseed rape growing season of 2020–2021. This season’s final yield was lower than the previous season, and weaker correlations were observed between treatments and the final oilseed rape yield. However, similarly to the previous oilseed rape growing season, the most significant correlations between NDVI and the final yield occurred during the full leaf development stage before winter at BBCH 19–20 (rs = 0.3387, p = 0.0009), at the beginning of pod development stage, BBCH 73–75 (rs = 0.3010, p = 0.0415), and at middle to the end of the pod development stage, BBCH 75–77 (rs = 0.4090, p = 0.0377). Further, the correlations tended to decline when considering oilseed rape ripening periods and the time before harvest.
Table 7 shows Spearman’s rank correlation coefficients between NDYI and final oilseed rape yield in 2020–2021. Similar to the previous growing season, NDYI values in the plant flowering stages provided the most accurate prediction of the yield, with the lowest significant rs at the beginning of the flowering stage, BBCH 62–64 (rs = 0.3940, p = 0.0451), and the highest one at the mid-flowering stage, BBCH 65–68 (rs = 0.5425, p = 0.0352). Nevertheless, the correlation was lower than the previous year. No further significant correlation was observed in later growth stages.

4. Discussion

The use of UAVs carrying different types of cameras has increased enormously during the last decade due to their flexibility and cost-effectiveness in collecting the high-resolution (cm-scale) images needed for precision farming system applications. Alongside this, the normalized difference vegetation index (NDVI) and the normalized difference yellowness index (NDYI) are widely used remote sensing indicators for monitoring crop growth status, field management strategies, and crop production prediction [25]. Positive NDVI values reveal increasing greenness, for example, an increase in leaf area and plant vigor. Conversely, negative values show non-vegetated areas such as urban regions, bare soil, and water.
In the present study, we estimated the growth timing and condition of oilseed rape fields based on NDVI and NDYI values. Field trials with three different seed densities and nitrogen rates were conducted for two years. The images were rapidly taken by an unmanned aerial vehicle carrying a Micasense Altum multi-spectral camera; the NDVI and NDYI values for each plot were calculated from the reflectance at RGB and NIR bands’ wavelengths pictured in a re-constructed and segmented ortho-mosaic. Furthermore, collected values are used to evaluate their correlations with the final yield of WOSR crops to generate helpful information that can be applied to PFS. The NDVI profiles showed that the cropping season began almost three weeks after sowing when the NDVI values were over 0.2, and it began to increase up to November each year. It should be considered that, compared to other crops such as cereals, maize, or soybean, attempts to monitor the growth and yield parameters of oilseed rape during its growing season are limited. In general, the main life cycle of the oilseed rape crop can be divided into three stages: Germination and the production of green leaves; the flowering stage, in which yellow blossoms provide red radiation to the canopy spectra that decrease NDVI values [10] (Sulik and Long 2016); and the last and third stage is the formation of green pods, leading to the increase in NDVI after the flowering stage. The NDVI values then decrease by the beginning of the ripening stages when the pods change color from yellowish-green to brown.
Our results strongly demonstrated that the oilseed rape growth stage greatly influenced the sensitivity to different wavelengths and the performance of NDVI and NDYI values. The significant correlation (rs) between final yield and NDVI and NDYI values varied with growth stages from 0.30 to 0.69 for NDVI and from 0.36 to 0.67 for NDYI, respectively (Table 4, Table 5, Table 6 and Table 7). However, there was little difference among observations between different treatments. Furthermore, lower NDVI values and no correlation with the yield were observed at the beginning of the spring. So, it could be due to decreased photosynthetic ability per unit leaf area and die-backs of leaves or whole plants during winter, which leads to reduced NDVI values. Our findings agree with those of Ma et al. [26], who reported that the vegetation indices derived from canopy hyperspectral data could accurately estimate oilseed rape aboveground biomass.
In both growing seasons, the NDVIs observed at the full leaf development stage before winter, BBCH 19–20, and NDVIs during pods developments stages, BBCH 71–77, had a higher correlation with the final yield than those observed on other dates. As described in previous studies, the leaves of oilseed rape plants are mainly responsible for photosynthesis, which is crucial to the final yield. Therefore, the leaf status at the full leaf development and plant mature stages is characteristic of crop potential yield [27]. Furthermore, the NDVI indices express vegetation coverage, quality, and nitrogen concentration [28,29], all of which can be favorable for grain yield in different plant types. Additionally, our result is consistent with Bennett et al.’s [30] findings, which developed a statistical crop model to describe the relationship between seed yield and phenotypic diversity within the Brassica napus gene pool. They observed that larger above-ground biomass with increased branching, supported by a larger stem and taller plants, gives rise to more available positions upon which pods can develop [30], which leads to an increase in the final yield. Moreover, Hassan et al. [31] described that NDVI measured at the grain filling stage could be a promising tool for wheat yield prediction, with R2 ranging from 0.83 to 0.89 in field conditions.
Compared with other arable crops, oilseed rape has unique spectral characteristics during the flowering stages. For example, it appears green/yellowish or yellow in the image of a combination of RGB bands. Therefore, the visual interpretation of oilseed rape is based on the specific spectral feature [26]. The NDVI values decreased significantly at flowering stages in both oilseed rape growing seasons, and no significant correlation was observed between NDVI values in these periods with the final yield. Our results agreed with Sulik and Long [10] that the correlation between the final yield and NDVI was only 0.22 in spring canola during flowering seasons. They suggested a yellowness index, which was linearly and firmly related to the final canola yield with a correlation coefficient of 0.76. Similarly, Gong et al. [12] showed a weak correlation during the canola flowering period between vegetation indices versus yield with R2 below 0.43. Furthermore, Shen et al. [32] reported that the yellow flower of Halerpestes tricuspis significantly increased the red band canopy reflectance, but without apparent variations in near-infrared or blue band reflectance, and the increase in red band reflectance strongly reduced the NDVI values.
During our experiments, oilseed flowering dates varied over the years, likely due to differences in monthly temperature and precipitation between the two years. We have clearly shown the possibility of using NDYI, which is a combination of green and blue bands, in the remote estimation of the flowering duration for the winter oilseed rape crop. At the early flowering stage, developing yellow flowers were on the upper part of the plants, so sensors could easily detect these early-blooming flowers. The NDYI increased significantly up to the full flowering stage, which was related to the oilseed rape flowering intensity during the full flowering stage. Afterward, the NDYI decreased at the late flowering stages, which may be a result of the lower sensitivity of NDYI to separate yellow blossoms and green pods. The highest significant correlation of NDYIs with the final yields was achieved using the images collected when most plots were in full flowering, BBCH 65–68. (Table 4, Table 5, Table 6 and Table 7). However, the correlation was lower in the growing season of 2020–2021 than in the previous year. We also found a lower significant relationship between the NDYI values at the later flowering stage, indicating that flowers at this time point may still have the potential to increase the final yield. Our results agree with those of Zhang et al. [20], who investigated the application of vegetation indices in estimating the number of canola flowers and developing a descriptive model of canola seed yield. Finally, yet importantly, we should consider that a single correlation analysis of yellow flowers could not fully predict the oilseed rape final yield. The number of pods per plant and seed weight per pod also significantly correlated with the final yield. Poor pod formation could occur under drought and heat stress during further plant development at later growth stages.

5. Conclusions

Monitoring crop growth and yield are essential to recognizing the crop response to the environment and agronomic practices and promoting effective management strategies. From multi-temporal UAV orthomosaic images and calculating vegetative indexes such as NDVI and NDYI, we could visualize all oilseed rape growth stages, from germination, leaf development, flowering, and finally, ripening stages. However, in comparing the correlation results between NDVI and NDYI with the final yield, the NDVI values turn out to be more reliable than the NDYI for the real-time remote sensing monitoring of winter oilseed rape growth in the whole season in the study area. In contrast, the correlation between NDYI and the yield revealed that the NDYI value is more suitable for monitoring oilseed rape genotypes during flowering stages. Therefore, the workflow in the current study is suitable for capturing images of an extensive breeding and agronomy trial and extracting phenotypes on a plot scale.

Author Contributions

Conceptualization, N.Z.-N. and D.F.; methodology, N.Z.-N. and D.F.; software, D.F.; validation, N.Z.-N. and D.F.; formal analysis, N.Z.-N. and D.F.; investigation, N.Z.-N.; resources, N.Z.-N. and D.F.; data curation, N.Z.-N.; writing—original draft preparation, N.Z.-N.; writing—review and editing, N.Z.-N.; supervision, N.Z.-N. All authors have read and agreed to the published version of the manuscript.

Funding

This work was funded by the Julius Kühn-Institute.

Institutional Review Board Statement

Not applicable.

Informed Consent Statement

Not applicable.

Data Availability Statement

Data presented in this study are available upon request.

Acknowledgments

The authors want to thank the invaluable help of Jaroslaw Acalski, Kelly Coutinho Szinovatz, and Anke Kawlath for their technical assistance.

Conflicts of Interest

The authors declare no conflict of interest. The funder had no role in the design of the study; in the collection, analyses, or interpretation of data; or in the writing of the manuscript.

References

  1. Holman, F.H.; Riche, A.B.; Michalski, A.; Castle, M.; Wooster, M.J.; Hawkesford, M.J. High Throughput Field Phenotyping of Wheat Plant Height and Growth Rate in Field Plot Trials Using UAV Based Remote Sensing. Remote Sens. 2016, 8, 1031. [Google Scholar] [CrossRef]
  2. Yang, G.; Liu, J.; Zhao, C.; Li, Z.; Huang, Y.; Yu, H.; Xu, B.; Yang, X.; Zhu, D.; Zhang, X. Unmanned aerial vehicle remote sensing for field-based crop phenotyping: Current status and perspectives. Front. Plant Sci. 2017, 8, 1111. [Google Scholar] [CrossRef]
  3. Tsouros, D.C.; Bibi, S.; Sarigiannidis, P.G. A Review on UAV-Based Applications for Precision Agriculture. Information 2019, 10, 349. [Google Scholar] [CrossRef]
  4. Sishodia, R.P.; Ray, R.L.; Singh, S.K. Applications of Remote Sensing in Precision Agriculture: A Review. Remote Sens. 2020, 12, 3136. [Google Scholar] [CrossRef]
  5. Gallmann, J.; Schüpbach, B.; Jacot, K.; Albrecht, M.; Winizki, J.; Kirchgessner, N.; Aasen, H. Flower Mapping in Grasslands With Drones and Deep Learning. Front. Plant Sci. 2022, 12, 774965. [Google Scholar] [CrossRef]
  6. Gnädinger, F.; Schmidhalter, U. Digital counts of maize plants by unmanned aerial vehicles (UAVs). Remote Sens. 2017, 9, 544. [Google Scholar] [CrossRef]
  7. Zhao, X.; Yuan, Y.; Song, M.; Ding, Y.; Lin, F.; Liang, D.; Zhang, D. Use of unmanned aerial vehicle imagery and deep learning UNet to extract rice lodging. Sensors 2019, 19, 3859. [Google Scholar] [CrossRef]
  8. Li, B.; Xu, X.; Han, J.; Zhang, L.; Bian, C.; Jin, L.; Liu, J. The estimation of crop emergence in potatoes by UAV RGB imagery. Plant Methods 2019, 15, 15. [Google Scholar] [CrossRef]
  9. David, E.; Daubige, G.; Joudelat, F.; Burger, P.; Comar, A.; Solan, B.; Baret, F. Plant detection and counting from high-resolution RGB images acquired from UAVs: Comparison between deep-learning and handcrafted methods with application to maize, sugar beet, and sunflower crops. bioRxiv 2021. [Google Scholar] [CrossRef]
  10. Sulik, J.J.; Long, D.S. Spectral indices for yellow canola flowers. Int. J. Remote Sens. 2015, 36, 2751–2765. [Google Scholar] [CrossRef]
  11. Fang, S.; Tang, W.; Peng, Y.; Gong, Y.; Dai, C.; Chai, R.; Liu, K. Remote estimation of vegetation fraction and flower fraction in oilseed rape with unmanned aerial vehicle data. Remote Sens. 2016, 8, 416. [Google Scholar] [CrossRef]
  12. Gong, Y.; Duan, B.; Fang, S.; Zhu, R.; Wu, X.; Ma, Y.; Peng, Y. Remote estimation of rapeseed yield with unmanned aerial vehicle (UAV) imaging and spectral mixture analysis. Plant Methods 2018, 14, 70. [Google Scholar] [CrossRef]
  13. Wan, L.; Li, Y.; Cen, H.; Zhu, J.; Yin, W.; Wu, W.; Zhu, H.; Sun, D.; Zhou, W.; He, Y. Combining UAV-Based Vegetation Indices and Image Classification to Estimate Flower Number in Oilseed Rape. Remote Sens. 2018, 10, 1484. [Google Scholar] [CrossRef]
  14. Blancon, J.; Dutartre, D.; Tixier, M.-H.; Weiss, M.; Comar, A.; Praud, S.; Baret, F. A High-throughput model-assisted method for phenotyping maize green leaf area index dynamics using unmanned aerial vehicle imagery. Front. Plant Sci. 2019, 10, 685. [Google Scholar] [CrossRef]
  15. Prey, L.; Hu, Y.; Schmidhalter, U. High-Throughput Field Phenotyping Traits of Grain Yield Formation and Nitrogen Use Efficiency: Optimizing the Selection of Vegetation Indices and Growth Stages. Front. Plant Sci. 2020, 10, 1672. [Google Scholar] [CrossRef]
  16. Fu, Z.; Jiang, J.; Gao, Y.; Krienke, B.; Wang, M.; Zhong, K.; Cao, Q.; Tian, Y.; Zhu, Y.; Cao, W.; et al. wheat growth monitoring and yield estimation based on multi-rotor unmanned aerial vehicle. Remote Sens. 2020, 12, 508. [Google Scholar] [CrossRef]
  17. Zeng, L.; Peng, G.; Meng, R.; Man, J.; Li, W.; Xu, B.; Lv, Z.; Sun, R. Wheat yield prediction based on unmanned aerial vehicles-collected red–green–blue imagery. Remote Sens. 2021, 13, 2937. [Google Scholar] [CrossRef]
  18. Stoyanova1, M.; Kandilarov, A.; Koutev, V.; Nitcheva, O.; Dobreva, P. Unmanned drone multispectral imaging for assessment of wheat and oilseed rape habitus. Bul. J. Agric. Sci. 2021, 27, 875–879. [Google Scholar]
  19. Peng, Y.; Li, Y.; Dai, C.; Fang, S.; Gong, Y.; Wu, X.; Zhu, R.; Liu, K. Remote prediction of yield based on LAI estimation in oilseed rape under different planting methods and nitrogen fertilizer applications. Agric. For. Meteorol. 2019, 271, 116–125. [Google Scholar] [CrossRef]
  20. Zhang, T.; Vail, S.; Duddu, H.S.; Parkin, I.A.; Guo, X.; Johnson, E.N.; Shirtliffe, S.J. Phenotyping Flowering in Canola (Brassica napus L.) and estimating seed yield using an unmanned aerial vehicle-based imagery. Front. Plant Sci. 2021, 12, 1178. [Google Scholar]
  21. Tuck, G.; Glendining, M.J.; Smith, P.; House, J.I.; Wattenbach, M. The potential distribution of bioenergy crops in Europe under present and future climate. Biomass Bioenergy 2006, 30, 183–197. [Google Scholar] [CrossRef]
  22. Zamani-Noor, N. Baseline Sensitivity and Control Efficacy of Various Group of Fungicides against Sclerotinia sclerotiorum in Oilseed Rape Cultivation. Agronomy 2021, 11, 1758. [Google Scholar] [CrossRef]
  23. Zamani-Noor, N.; Knüfer, J. Effects of host plant resistance and fungicide application on phoma stem canker, growth parameters and yield of winter oilseed rape. Crop. Ptotect. 2018, 112, 313–321. [Google Scholar] [CrossRef]
  24. Rouse, J.W., Jr.; Deering, D.W.; Schell, J.A.; Harlan, J.C. Monitoring the Vernal Advancement and Retro-Gradation (Green Wave Effect) of Natural Vegetation; NASA: Greenbelt, MD, USA, 1974. [Google Scholar]
  25. Khanal, S.; Fulton, J.; Shearer, S. An overview of current and potential applications of thermal remote sensing in precision agriculture. Comput. Electron. Agric. 2017, 139, 22–32. [Google Scholar] [CrossRef]
  26. Ma, Y.; Fang, S.; Peng, Y.; Gong, Y.; Wang, D. Remote estimation of biomass in winter oilseed rape (Brassica napus L.) using canopy hyperspectral data at different growth stages. Appl. Sci. 2019, 9, 545. [Google Scholar] [CrossRef]
  27. Habekotte, B. Evaluation of seed yield determining factors of winter oilseed rape (Brassica napus L.) by means of crop growth modelling. Field Crops Res. 1997, 54, 137–151. [Google Scholar] [CrossRef]
  28. Shi, P.; Wang, Y.; Xu, J.; Zhao, Y.; Yuan, Z.; Sun, Q. Rice nitrogen nutrition estimation with RGB images and machine learning methods—ScienceDirect. Comput. Electron. Agric. 2020, 180, 105860. [Google Scholar] [CrossRef]
  29. Guo, Z.C.; Wang, T.; Liu, S.L.; Kang, W.P.; Zhi, Y. Biomass and vegetation coverage survey in the Mu Us sandy land-based on unmanned aerial vehicle RGB images. Int. J. Appl. Earth Obs. Geoinf. 2021, 94, 102239. [Google Scholar] [CrossRef]
  30. Bennett, E.J.; Brignell, C.J.; Carion, P.W.C.; Cook, S.M.; Eastmond, P.J.; Teakle, G.R.; Hammond, J.P.; Love, C.; King, G.J.; Roberts, J.A.; et al. Development of a statistical crop model to explain the relationship between seed yield and phenotypic diversity within the Brassica napus genepool. Agronomy 2017, 7, 31. [Google Scholar] [CrossRef]
  31. Hassan, M.A.; Yang, M.; Rasheed, A.; Yang, G.; Reynolds, M.; Xia, X.; Xiao, Y.; He, Z. A rapid monitoring of NDVI across the wheat growth cycle for grain yield prediction using a multi-spectral UAV platform. Plant Sci. 2019, 282, 95–103. [Google Scholar] [CrossRef]
  32. Shen, M.; Chen, J.; Zhu, X.; Tang, Y. Yellow flowers can decrease NDVI and EVI values: Evidence from a field experiment in an alpine meadow. Can. J. Remote Sens. 2009, 35, 99–106. [Google Scholar] [CrossRef]
Figure 1. The general location of experimental trials and the overview of the images obtained by unmanned aerial vehicle (UAV) remote sensing platform for the oilseed rape field in Salzdahlum, Lower Saxony, Germany. The image was acquired on 30 April 2020.
Agronomy 12 02212 g001
Figure 2. Winter oilseed rape-growth stages calendar in Germany.
Agronomy 12 02212 g002
Figure 3. Monitoring winter oilseed rape growth status, from seeding to ripening stages, by normalized difference vegetation index (NDVI; AC) and normalized difference yellowness index (NDYI; DF) derived from UAV-based RGB imaging. A field trial (sown on 28 August 2019) with different seed densities (30, 50, and 70 seeds per m2) and three nitrogen rates (160, 200, and 280 kg [N] ha−1) was conducted in 2019–2020 in Salzdahlum, Germany. In this growing season, 12 flight campaigns were operated at approximately 25 m altitude. The NDVI and NDYI values for each plot (n = 4 replicates per treatment) were calculated from the reflectance at RGB and NIR bands’ wavelengths pictured in a reconstructed and segmented ortho-mosaic. Error bars indicate the standard deviation between replicates. *: Differences between growth stages are significant (p ≤ 0.05).
Agronomy 12 02212 g003
Figure 4. Monitoring winter oilseed rape growth status, from seeding to ripening stages, by normalized difference vegetation index (NDVI; AC) and normalized difference yellowness index (NDYI; DF) derived from UAV-based RGB imaging. A field trial (sown on 30 August 2020) with different seed densities (30, 50, and 70 seeds per m2) and three nitrogen rates (160, 200, and 280 kg [N] ha−1) was conducted in Salzdahlum, Germany, in 2020–2021. In this growing season, 10 flight campaigns were operated at approximately 25 m altitude. The NDVI and NDYI values for each plot (n = 4 replicates per treatment) were calculated from the reflectance at RGB and NIR bands’ wavelengths pictured in a reconstructed and segmented ortho-mosaic. Error bars indicate the standard deviation between replicates. *: Differences between growth stages are significant (p ≤ 0.05).
Agronomy 12 02212 g004
Table 1. Flight dates and different growing stages of winter oilseed rape during the growing seasons of 2019–2020 and 2020–2021.
DatesOilseed Rape Growth Stages
2019–20202020–2021
11 September 201917 September 2020BBCH 11–12; Seedling stage
11 November 201912 November 2020BBCH 19–20; Leaf development
02 April 202024 March 2021BBCH 25–29; formation of side shoots, stem elongation
16 April 202013 April 2021BBCH 55–58; Inflorescence emergence
23 April 202027 April 2021BBCH 62–64; Flowering
30 April 202010 May 2021BBCH 65–68; Flowering
05 May 2020BBCH 70–71; Development of pods
13 May 202001 June 2021BBCH 73–75; Development of pods
03 June 202016 June 2021BBCH 75–77; Development of pods
15 June 2020BBCH 81–82; Ripening
23 June 202005 July 2021BBCH 88–89; Ripening
30 June 202012 July 2021BBCH 92–95; Senescence
Table 2. Spectral vegetation indices derived from Red–Green–Blue images in this study.
Vegetation IndicesAbb.Formula *References
Normalized Difference Vegetation IndexNDVI(NIR – Red)/(NIR + Red)Rouse et al. [24]
Normalized Difference Yellowness IndexNDYI(Green – Blue)/(Green + Blue)Sulik and long [10]
* Red, Green, Blue and NIR are the digital values of the pixels corresponding to those bands.
Table 3. Monthly mean air temperature (°C), precipitation (mm), and relative humidity (%) during two consecutive growing seasons (2019–2020 and 2020–2021) of winter oilseed rape in Salzdahlum, Lower Saxony, Germany (German Weather Service (DWD); Salzdahlum, Germany).
Growing SeasonMonths
AugSepOctNovDecJanFebMarAprMayJunJul
Temperature (°C)
2019–202019.514.211.67.24.64.66.35.59.912.317.617.2
2020–202120.514.911.35.44.91.20.55.15.811.418.918.9
Precipitation (mm)
2019–202040609541583114655221112389
2020–2021984752145435313952615556
Relative humidity [%]
2019–2020738191979394877964737878
2020–2021757993969997958787858485
Table 4. Spearman’s rank correlation coefficients between final yield and normalized difference vegetation index (NDVI) values of each flight date during winter oilseed rape growing season of 2019–2020.
Variable
(Yield/NDVI of Each Date)
Linear Equationrsp-Value *
11 September 2019 (BBCH 11–12)y = 0.2468 + 0.0003x0.07940.6455
11 November 2019 (BBCH 19–20)y = 0.2710 + 0.0120x0.50660.0016 *
02 April 2020 (BBCH 25–29)y = 0.4673 + 0.0027x0.18970.2687
16 April 2020 (BBCH 55–58)y = 0.5859 + 0.0016x0.14220.4080
23 April 2020 (BBCH 62–64)y = 0.5215 + 0.0007x0.12450.4695
30 April 2020 (BBCH 65–68)y = 0.4586 + 0.0032x0.36930.2661
05 May 2020 (BBCH 70–71)y = 0.5946 + 0.0034x0.34820.0374 *
13 May 2020 (BBCH 73–75)y = 0.6925 + 0.0035x0.44040.0072 *
03 June 2020 (BBCH 75–77)y = 0.7044 + 0.0041x0.68900.0000 *
15 June 2020 (BBCH 81–82)y = 0.6290 + 0.0055x0.47000.0003 *
23 June 2020 (BBCH 88–89)y = 0.4451 + 0.0061x0.40860.1332
30 June 2020 (BBCH 92–95)y = 0.3082 + 0.0031x0.20850.2223
* Correlation is significant at p < 0.05.
Table 5. Spearman’s rank correlation coefficient between final yield and normalized difference yellowness index (NDYI) values of each flight date during winter oilseed rape growing season of 2019–2020.
Variable
(Yield/NDYI of Each Date)
Linear Equationrsp-Value *
11 September 2019 (BBCH 11–12)y = 0.2835 + 0.0063x0.02580.8814
11 November 2019 (BBCH 19–20)y = 0.1844 + 0.0030x0.29520.0805
02 April 2020 (BBCH 25–29)y = 0.2140 + 0.0007x0.12950.4516
16 April 2020 (BBCH 55–58)y = 0.2044 + 0.0045x0.30970.0600
23 April 2020 (BBCH 62–64)y = 0.2822 + 0.0067x0.36500.0286 *
30 April 2020 (BBCH 65–68)y = 0.3104 + 0.0039x0.66870.0005 *
05 May 2020 (BBCH 70–71)y = 0.3323 + 0.0031x0.27410.1057
13 May 2020 (BBCH 73–75)y = 0.3234 + 0.0014x0.25940.1266
03 June 2020 (BBCH 75–77)y = 0.3114 + 0.0021x0.46590.0642
15 June 2020 (BBCH 81–82)y = 0.3572 + 0.0019x0.22720.0594
23 June 2020 (BBCH 88–89)y = 0.2883 + 0.0033x0.52940.0009 *
30 June 2020 (BBCH 92–95)y = 0.2194 + 0.0025x0.30130.0741
* Correlation is significant at p < 0.05.
Table 6. Spearman’s rank correlation coefficient between final yield and normalized difference vegetation index (NDVI) values of each flying date during winter oilseed rape growing season of 2020–2021.
Variable
(Yield/NDVI of Each Date)
Linear Equationrsp-Value *
17 September 2020 (BBCH 11–12)y = 0.5470 + 0.0007x0.25320.1362
12 November 2020 (BBCH 19–20)y = 0.3638 + 0.0093x0.33870.0433 *
24 March 2021 (BBCH 25–29)y = 0.8026 + 0.0007x0.04350.8013
13 April 2021 (BBCH 55–58)y = 0.7915 + 0.0023x0.16530.3353
27 April 2021 (BBCH 62–64)y = 0.7991 + 0.0013x0.33480.0559
10 May 2021 (BBCH 65–68)y = 0.5512 + 0.0045x0.29370.0821
01 June 2021 (BBCH 73–75)y = 0.7834 + 0.0030x0.30100.0415 *
16 June 2021 (BBCH 75–77)y = 0.8479 + 0.0005x0.40900.0377 *
05 July 2021 (BBCH 88–89)y = 0.2401 + 0.0030x0.13340.4380
12 July 2021 (BBCH 92–95)y = 0.2216 + 0.0007x0.12840.4557
* Correlation is significant at p < 0.05.
Table 7. Spearman’s rank correlation coefficients between final yield and normalized difference yellowness index (NDYI) values of each flight date during winter oilseed rape growing season of 2020–2021.
Variable
(Yield/NDVI of Each Date)
Linear Equationrsp-Value *
17 September 2020 (BBCH 11–12)y = 0.4344 + 0.0018x0.29730.0782
12 November 2020 (BBCH 19–20)y = 0.4034 + 0.0020x0.15710.3603
24 March 2021 (BBCH 25–29)y = 0.2729 + 0.0008x0.07010.6845
13 April 2021 (BBCH 55–58)y = 0.3060 + 0.0034x0.27430.1054
27 April 2021 (BBCH 62–64)y = 0.4813 + 0.0041x0.39400.0451 *
10 May 2021 (BBCH 65–68)y = 0.4359 + 0.0048x0.54250.0352 *
01 June 2021 (BBCH 73–75)y = 0.4595 + 0.0013x0.15830.3564
16 June 2021 (BBCH 75–77)y = 0.6067 + 0.0016x0.20290.0554
05 July 2021 (BBCH 88–89)y = 0.0295 + 0.0013x0.18530.6209
12 July 2021 (BBCH 92–95)y = 0.1641 + 0.0006x0.19790.5700
* Correlation is significant at p < 0.05.
Publisher’s Note: MDPI stays neutral with regard to jurisdictional claims in published maps and institutional affiliations.

