Abstract
In this study, we aimed to develop a prediction model of the solid solutions concentration (SSC) and moisture content (MC) in oriental melon with snapshot-type hyperspectral imagery (Visible (VIS): 460–600 nm, 16 bands; Red-Near infrared (Red-NIR): 600–860 nm, 15 bands) using a machine learning model. The oriental melons were cultivated in a hydroponic greenhouse, Republic of Korea, and a total of 91 oriental melons that were harvested from March to April of 2022 were used as samples. The SSC and MC of the oriental melons were measured using destructive methods after taking hyperspectral imagery of the oriental melons. The reflectance spectrum obtained from the hyperspectral imagery was processed by the standard normal variate (SNV) method. Variable importance in projection (VIP) scores were used to select the bands related to SSC and MC. As a result, ten (609, 736, 561, 849, 818, 489, 754, 526, 683, and 597 nm) and six (609, 736, 561, 818, 849, and 489 nm) bands were selected for the SSC and MC, respectively. Four machine learning models, support vector regression (SVR), ridge regression (RR), K-nearest neighbors regression (K-NNR), and random forest regression (RFR), were used to develop models to predict SSC and MC, and their performances were compared. The SVR showed the best performance for predicting both the SSC and MC of the oriental melons. The SVR model achieved a relatively high accuracy with R2 values of 0.86 and 0.74 and RMSE values of 1.06 and 1.05 for SSC and MC, respectively. However, it will be necessary to carry out more experiments under various conditions, such as differing maturities of fruits and varying light sources and environments, to achieve more comprehensive predictions and apply them to monitoring robots in the future. Nevertheless, it is considered that the snapshot-type hyperspectral imagery aided by SVR would be a useful tool to predict the SSC and MC of oriental melon. In addition, if the maturity classification model for the oriental melon can be applied to fields, it could lead to less labor and result in high-quality oriental melon production.
1. Introduction
Oriental melon (Cucumis melo L.) belongs to the Cucurbitaceae family and is one of six species (inodorus, reticulatus, cantalupensis, acidulous, saccharinus, and makuwa), and is called ‘Chamoe’ in the Republic of Korea [1]. It is a commercially valuable fruit cultivated in Korea, Japan, and China because of its sweet and crisp taste, flavor, juicy flesh, and valuable nutrients (such as vitamin C and β-Carotene) [2]. Oriental melon is conventionally cultivated in soil culture; however, the culture method may cause a high workload for farmers, changes in soil environments, and so on. Thus, several studies have been conducted to find a new methods of cultivation to reduce these problems during oriental melon cultivation, and a hydroponic culture is one of them [3,4]. For example, Lee et al. [5] conducted a study on the workload of farmers and yields of oriental melons according to the stem training methods in a hydroponic greenhouse environment, and they reported that the oriental melons can be cultivated with several advantages, such as labor-saving, increase in yield, and so on, through hydroponics. Nevertheless, oriental melon farms are having difficulty from cultivation until harvest, because of the aging of farmers, the labor shortage as a proportion of the population, and so on. For these reasons, studies on artificial intelligence, information and communications technology (ICT), and robot-based automation technologies for various crops have been conducted to solve these problems. In particular, several studies have been conducted to develop a crop monitoring system, and it will be necessary for automation conversion in a hydroponic greenhouse [6,7,8]. Now, the maturity level of the oriental melon is generally classified using a color chart. However, this method may be influenced by several factors, such as light source, resolution of color chart, and subjective assessment of farmers, and there is a possibility that the oriental melon will be harvested with insufficient sugar content [9]. It is known that the changes of sugar content and moisture content are related to the maturity stages of the oriental melons; for example, the sugar content of oriental melons increases with the ripening progress [10]. For this reason, to accurately classify the maturity stages of oriental melons in the pre-harvest stage, it is necessary to non-destructively classify the maturity stages based on the sugar content and moisture content as well as the color change of the oriental melon.
Hyperspectral imaging technology can provide a significant amount of information in both the spectral and spatial domains, and is used in various fields, such as agriculture, food, environmental management, and urban planning [11,12,13,14]. In particular, it is widely used in various agricultural fields, such as the non-destructive analysis of the internal quality in agricultural products. Hyperspectral imaging is divided into four categories: ultraviolet (UV: 200–400 nm), visible/near-infrared (VIS/NIR: 400–1000 nm), short wave infrared (SWIR: 1.0–2.5 μm), and middle wave infrared (MWIR: 2.5–7 μm), according to the spectrum range [15,16]. VIS and NIR are typically used for internal quality analysis in agricultural products [17,18,19]. The data acquisition types of hyperspectral imaging systems are classified into spatial scanning and spectral scanning. First, the line-scanning method based on the spatial scanning simultaneously measures a certain spectral region, and it continuously obtains y-axis data with the movement of a single line sensor. Second, a snapshot method based on spectrum scanning simultaneously measures multiple spectral areas through various multispectral filters [15]. Line-scanning method-based hyperspectral imaging has commonly been used in food and agricultural applications for the past 20 years [12,20]. However, it is difficult to handle the line-scanning method-based systems because there are more than 100 spectral bands, and the device is large and expensive. Meanwhile, the snapshot method-based systems have several advantages, such as low power, the acquisition of hyperspectral images at video rate, ultra-portability, and easy handling, and a small number of spectral bands. Thus, it is considered that the snapshot-type hyperspectral camera is suitable for application to an automated monitoring robot in a hydroponic greenhouse [21].
Recently, machine learning algorithms have been used to analyze hyperspectral imaging data. In particular, several studies have used hyperspectral imaging with machine learning models to predict the internal quality in agricultural products. Gao et al. [8] and Zhang et al. [22] used hyperspectral imaging with a support vector machine (SVM) model to predict the sugar content of strawberries and Dangshan pear, respectively. Osco et al. [23] used various machine learning models, such as SVM, K-nearest neighbor regression (K-NNR), lasso regression (LR), ridge regression (RR), and random forest (RF) to predict the nutritional components in Valencia-orange leaves. As above, there are many studies that used several machine learning models, such as SVM, K-NNR, RR, and RF, to develop internal quality prediction models, and they reported that these models are a very powerful tool for predicting the internal quality in crops. However, there are only a few studies that have used hyperspectral imaging with machine learning models to predict the internal quality of the oriental melon. Kim et al. [24] developed a solid solutions concentration (SSC) prediction model of the oriental melon with hyperspectral data using machine learning models and reported that the developed models can be potentially used for both static calibration in a laboratory and for a real-time online sorter in an agricultural products processing center (APC). However, they used the semi-penetration measurement method to obtain VIS and NIR hyperspectral data of the oriental melons, and it is difficult to apply the semi-penetration measurement method to a real-time maturity monitoring system for oriental melons in a hydroponic greenhouse. For this reason, hyperspectral technology that can be applied in a hydroponic greenhouse and other agricultural fields is required, and a snapshot-type hyperspectral method could be a useful method for that.
As above, it is necessary that the system can monitor the quality indices or maturity stages of the oriental melons in fields. Therefore, here we examine a technology that could non-destructively monitor oriental melons in a hydroponic greenhouse and develop two models for predicting solid solutions concentration (SSC) and moisture content (MC) in the oriental melons with snapshot-type hyperspectral images using machine learning algorithms. We obtain hyperspectral images of the oriental melons at a laboratory level, and the standard normal variate (SNV) method is applied for the pre-processing of hyperspectral data. Variable importance in projection (VIP) score is used to select the bands related to the SSC and MC of oriental melons. In addition, we use several machine learning models to train the SSC and MC prediction models and compare the prediction performance of them.
2. Materials and Methods
2.1. Sampling
“Ohbokggul” variety oriental melons (Cucumis melo L.) cultivated in a hydroponic greenhouse, Republic of Korea (National Institute of Agricultural Sciences) were used as a sample. An image of the hydroponic greenhouse is shown in Figure 1. A total of 91 oriental melons without any damages were harvested from March to April of 2022. The average weight and length of harvested fruits were 447.5 ± 77.6 g and 117.4 ± 9.0 mm, respectively. Fruits of similar weight and size were harvested in this study, because the fruit weight may affect the internal quality [10]. In addition, we selected various maturities of oriental melons, because hyperspectral data and internal quality may be changed by maturity stages. However, there is no maturity standard for the oriental melons. Thus, we harvested the oriental melons in three maturity stages (unripe, turning, and ripe), and the maturity stages were determined based on L*a*b* value, as shown in Table 1. The L*a*b* value was determined using a portable colorimeter (CR-20, KONICA MINOLTA, Tokyo, Japan).
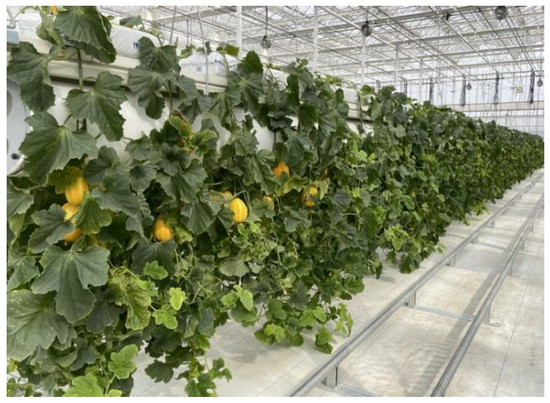
Figure 1.
Image of hydroponic greenhouse in the Republic of Korea (National Institute of Agricultural Sciences).

Table 1.
Maturity stages of oriental melon fruits.
2.2. Hyperspectral Imaging System
Figure 2 shows a schematic diagram of the hyperspectral imaging system, and the specifications of the hyperspectral camera used in this study are shown in Table 2. Two snapshot-type hyperspectral cameras (SM4 × 4-VIS3, IMEC, Leuven, Belgium; SM4X4-RN2, IMEC, Leuven, Belgium) were used to take hyperspectral images of the oriental melons, and they were fixed at a vertical distance of 400 mm above the bottom of the supporting frame. Four halogen lamps (20 W, 12 V) were used to provide diffuse, well-distributed illumination, and were fixed at 300 mm above the bottom. In addition, HIS Mosaic software (Ver. 5.0.2, IMEC, Leuven, Belgium) was used to control the hyperspectral imaging system.

Figure 2.
Schematic diagram of hyperspectral imaging system.
Table 2.
The specifications of VIS and Red-NIR hyperspectral cameras.
2.3. Hyperspectral Data Extraction and Pre-Processing
White and dark reference images were obtained to correct the raw images from several effects, such as the noise generated by the device and the effect of uneven light source intensities [25]. The white reference was obtained using a white board with 95% reflectance (SG3151-U, IMEC, Leuven, Belgium), and the dark reference was obtained with the camera lens completely covered with a lens cap and the light source turned off. Hyperspectral data on the fruit surface were then extracted from corrected images with white and dark reference images, and ENVI software (Ver. 5.3, Exelis Visual Information Solutions Inc., Boulder, CO, USA) was used to process the images and extract the hyperspectral data. The fruit surface was separated from the background using the threshold method. The 588 nm and 700 nm bands were applied to separate the fruit surface from the background for VIS and Red-NIR images, respectively. In addition, the region-of-interest (ROI) from the segmented image were manually selected and the hyperspectral data were extracted. The extracted hyperspectral data were averaged for each band within the entire ROI of each fruit.
Meanwhile, the hyperspectral data contain several noises and spectral variations generated by the device, or by other factors. Therefore, it is necessary to pre-process the hyperspectral data before analysis. There are several methods for the pre-processing, such as normalization, multiplicative scatter correction, standard normal variate (SNV), and others [26]. The SNV was designed to remove at least some of the large amount of variability from the reflectance spectra that may be caused by various effects, and it has been used very successfully in spectroscopy [25]. Thus, in this study, SNV was applicable to pre-process the hyperspectral data.
2.4. Measurements
Soluble solids concentration (SSC) and moisture content (MC) were used to assess the quality and maturity stage of the oriental melons after acquiring the hyperspectral images. Oriental melons were peeled, and seeds were removed. The pulp portions of each fruit were used to measure the SSC and MC [27]. To measure SSC, the juice was extracted from the pulp of each fruit using a juice extractor. SSC was determined using a refractometer (RX-5000a, ATAGO, Tokyo, Japan) and was expressed as % Brix [28]. MC was determined by drying at 105 °C for 72 h using a dry oven (ON-22GW, JEIO TECH, Daejeon, Korea), and an electronic scale (FX-3000i, AND, Tokyo, Japan) was used to measure the weight before and after the drying of fruit pulp [29]. The MC was expressed in percent wet basis (% w.b.).
3. Data Analysis
In this study, the variable importance in projection (VIP) score was used to select the important bands for SSC and MC of the oriental melons. Several machine learning models were used to analyze the hyperspectral data that were selected by VIP score and were implemented using the Scikit-learn machine learning library in the Python program. Figure 3 shows the flowchart for predicting the SSC and MC in the oriental melons using the snapshot-type hyperspectral image and machine learning models.

Figure 3.
Flowchart diagram for predicting the SSC and MC in oriental melons from the snapshot-type hyperspectral image.
3.1. Variable Importance in Projection
Variable importance in projection (VIP) is one of the most frequently used methods for variable selection in chemometrics, and the VIP scores selection method has been extensively used in various agricultural fields [24,30]. It summarizes the influence of individual x variables on the partial least squares (PLS) model and provides a measure that is useful for selecting x variables that contribute most to the y variance explanation [31]. In addition, VIP scores close to 1.0 or higher can be considered important in the given model, while VIP scores of significantly less than 1.0 are less important and might be excluded from the model. In this study, therefore, the VIP scores method was used to select the hyperspectral data that related to the quality factors of oriental melons and was defined as Formula (1) [31].
where is a measure of the contribution of each variable according to the variance explained by each PLS component. F is the total number of components and is the weight value for the j variable and f component. is the sum of squares of explained variance for the J number of x variables and the jth component, and is the total sum of squares explained of the dependent variable.
3.2. Support Vector Regression
Support vector regression (SVR) can efficiently perform non-linear regression using the kernel trick, and it is able to handle high-dimensional data [32]. In this study, SVR with a Gaussian radial basis function (rbf) kernel was considered to analyze the collected hyperspectral data of the oriental melon. The rbf kernel is a nonlinear function and is used in strategy solving for regression problems. The grid search method was applied to select the optimal hyperparameters, such as C and gamma. It is an optimization algorithm that automates the trial-and-error method and is used in machine learning to obtain the parameters at which the model gives the best accuracy. Parameter C determines the regularization strength, and parameter gamma controls the rbf kernel shape in SVR formulation [33].
3.3. Ridge Regression
Ridge regression (RR) is a regularized version of linear regression, and it is the method used for the analysis of multicollinearity in multiple regression data [34]. The RR shrinks model weights to the smallest possible size via L2 regularization, to limit the model and avoid overfitting. The grid search method was applied to select the optimal , which controls how much to regularize a model [35].
3.4. K-Nearest Neighbors Regression
K-nearest neighbors regression (K-NNR) is a non-parametric method that approximates the continuities between independent variables and the continuous outcome by averaging the observations in the same neighbors [36]. In addition, it uses the Euclidean distance method to organize the searching and filtering of input data and the hyperparameter k to control the number of neighbors. In this study, the optimal k was selected through grid search [37].
3.5. Random Forest Regression
Random forest regression (RFR) is an ensemble learning algorithm that consist of a combination of tree predictors, where each tree is generated using a random vector sampled independently from the input vector [38]. It has several hyperparameters. In this study, the number of regression trees (number of estimators; NE) and the number of input variables per node (number of max depth; ND) were considered to optimize the prediction model. The grid search was used to select the optimal parameters [39].
3.6. Model Evaluation
The entire dataset containing a total of 91 hyperspectral data was randomly divided into two datasets, as the training set (80%, 72 data) and the testing set (20%, 19 data). The leave-one-out cross-validation method is appropriate when a dataset is small (less than 100) [26]. It uses only one sample as a validation set, while the rest are used to train the machine learning model. This means that more data can be used in each iteration to train the machine learning models. Thus, in this study, it was applied to select the best model among SVR, RR, K-NNR, and RFR. In addition, the performance of the developed prediction models was evaluated by two actions, the root mean squared error (RMSE) and the coefficient of determination (R2), and these were defined using Formulas 2 and 3, respectively. The lower the RMSE, the better a model fits a dataset. The R2 indicates the goodness of fit of the model, and values ranging from 0.0 to 1.0 could be attained, with 1.0 revealing the perfect linear relationship between measured and predicted values.
where is the predicted value and is the measured value.
3.7. Statistical Analysis
An SPSS statistical package (IBM SPSS Statistics 20.0, IBM, Armonk, NY, USA) was used to analyze the data by one-way ANOVA. In addition, the results were statistically analyzed using the Tukey–Kramer multiple range test, with significance level p < 0.05.
4. Results and Discussion
4.1. Quality Indices
The changes in SSC and MC according to the maturity stages are shown in Figure 4. The SSC is one of the important factors relative to the quality of the oriental melons, and it determines the sweetness and flavor of the oriental melon. The SSC of the oriental melons gradually increased as the fruits ripened, and it showed a similar trend as that shown in a previous study [40]. These changes were probably caused by the starch and sucrose metabolism-related enzymes. It is known that sucrose synthetase and sucrose phosphate are closely related to sugar accumulation, fruit quality, ripeness, and senescence [41]. The MC decreased as the fruits ripened, and this is considered to be due to the decrease in fruit density [40]. It is known that there is a positive linear relationship between the density and moisture content of fruits [42]. In addition, there is a high correlation between SSC and moisture content; thus, it is considered that the MC decreased as the SSC increased [43]. As in the above results, the SSC and MC are closely related to the maturity stage of the oriental melons; thus, it is considered that the SSC and MC can be used to predict the quality or maturity of oriental melons.

Figure 4.
The changes in (A) SSC and (B) MC according to the maturity stages of oriental melons. Error bars indicate the standard deviation. Means with different letters (a–c) above the bars indicate significant differences based on the Tukey–Kramer multiple range test (p < 0.05).
4.2. Hyperspectral Data and VIP
The reflectance spectrum of oriental melons in the spectral range of 460–850 nm are shown in Figure 5. The raw spectral data extracted from hyperspectral images were processed with the SNV method, as shown in Figure 5B. The reflectance spectrum of 648–683 nm increased during the maturity process of the oriental melons, while the reflectance spectrum of 770–818 nm decreased. It is known that a reflectance spectrum of approximately 670 and 800 nm is related to the chlorophyll absorption of crops [44,45]. Thus, these changes are considered to be due to the progressive change in the color of the oriental melons from green to yellow.
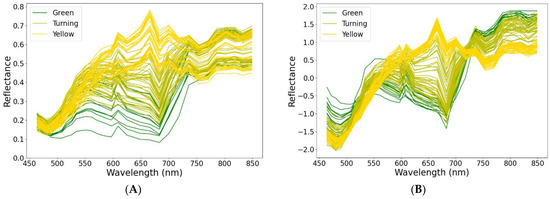
Figure 5.
Reflectance spectrum of the oriental melons in (A) raw data and (B) pre-processed data with SNV.
Figure 6 shows the VIP scores for SSC and MC. The VIP scores of 1.0 or over indicate the important wavelength bands, and a higher VIP score indicates more significant variables [46]. Ten bands containing 609, 736, 561, 849, 818, 489, 754, 526, 683, and 597 nm were VIP scores of more than 1.0 for the SSC, and this result showed a similar trend to that shown in a previous study [24]. For the MC of the oriental melons, six bands were selected: 609, 736, 561, 818, 849, and 489 nm. Based on these results, the reflectance spectrum of ten and six bands were used to develop the prediction model for SSC and MC, respectively.
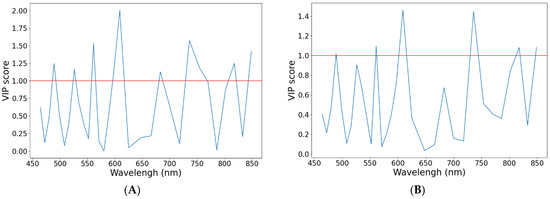
Figure 6.
VIP scores for (A) SSC and (B) MC, calculated by PLS.
4.3. Prediction Model
In this study, the optimal parameters for each model were selected using the grid search method, and the grid search was performed using several factors, such as the hyperparameters for each model and the number of bands. Table 3 shows the selected optimal parameters for each model, and each model was trained based on the selected parameters. In addition, the performance of each model is shown in Table 4, and Figure 6 shows the match between the measured and predicted values in the best models. As shown in Table 4 and Figure 7, the SVR model predicts the SSC and MC of the oriental melons well, with R2 values of 0.86 and 0.74 and RMSE values of 1.06% Brix and 1.05% for SSC and MC, respectively. The K-NNR and RFR models showed over-fitting during the training process, and this is considered to be due to several effect, such as insufficient data, incompatibility between the model and selected data, and so on. Meanwhile, Kim et al. [24] developed an SSC prediction model of the oriental melon in laboratory and APC and used a VIS/NIR spectroscopy with several regression models, such as the PLSR multivariate regression analysis method, ANN-based technique, and deep learning-based CNN technique. They obtained VIS and NIR hyperspectral data of the oriental melons by using the semi-penetration measurement method and reported that the PLS-ANN model could achieve an SSC prediction accuracy with R2 of 0.83 and RMSE of 0.63. Compared with our model, the RMSE value of their model was slightly lower. However, it is difficult to apply the semi-penetration measurement method to a real-time maturity monitoring system for oriental melons in a hydroponic greenhouse. Meanwhile, it is considered that the prediction accuracy of our model could be improved with more data collection. Therefore, our study demonstrated that a snapshot-type hyperspectral camera has the potential to be used as a tool to predict the SSC and MC of oriental melons. In addition, in the testing set, we confirmed that the SVR model based on non-linear regression performed better than the other models, such as the linear, nearest neighbor, and ensemble models, which means that a non-linear model may be more suitable for predicting the SSC and MC of oriental melons. Nevertheless, it will be necessary to carry out more experiments with various maturities of fruits to achieve a more comprehensive prediction in the future.
Table 3.
The optimal parameters for each prediction model.
Table 4.
The performance for each prediction model.

Figure 7.
Match between measured and predicted values for (A) SSC and (B) MC obtained from the best prediction models.
5. Conclusions
We developed two models for predicting the SSC and MC of oriental melons with a snapshot-type hyperspectral camera using a machine learning algorithm. To achieve this, several machine learning algorithms, such as SVR based on a non-linear model, RR based on a linear model, K-NNR based on a nearest neighbor model, and RFR based on an ensemble model, were applied and were compared with R2 and RMSE. The SNV method was applied to the pre-processing of the reflectance spectrum of the oriental melons. In addition, the important bands for predicting the SSC and MC of the oriental melons were selected using VIP score, and ten (609, 736, 561, 849, 818, 489, 754, 526, 683, and 597 nm) and six (609, 736, 561, 818, 849, and 489 nm) bands were selected for the SSC and MC, respectively. Based on these, each model was trained to predict the SSC and MC, and SVR showed the best SSC and MC prediction performances with R2 values of 0.86 and 0.74 and RMSE values of 1.06% Brix 1.05% for SSC and MC, respectively. Therefore, a snapshot-type hyperspectral camera aided by SVR would be a useful tool for predicting the SSC and MC of oriental melons at the laboratory level. In addition, we consider that if the snapshot-type hyperspectral camera using the machine learning model is installed on mobile robots, it would be possible to non-destructively monitor the maturity or quality indices of oriental melons in a hydroponic greenhouse. Nevertheless, it will be necessary to carry out more experiments under various conditions, such as differing maturities of fruits and varying light sources and environments, to achieve more comprehensive predictions and apply them to monitoring robots in the future.
Author Contributions
B.-H.C. and K.-B.L., as the first authors, planned the experiments and wrote the manuscript. Y.H. helped with the experiments and the investigation of related information. K.-C.K. led the overall research as a corresponding author and helped to revise the manuscript. All authors have read and agreed to the published version of the manuscript.
Funding
This work was supported by the Korea Institute of Planning and Evaluation for Technology in Food, Agriculture, and Forestry (IPET) and the Korea Smart Farm R&D Foundation through the Smart Farm Innovation Technology Development Program, funded by MAFRA, MSICT, and RDA (421031-04).
Data Availability Statement
The data presented in this study are available on request from the corresponding author. The data are not publicly available due to privacy reasons.
Conflicts of Interest
The authors declare no conflict of interest.
References
- Liu, L.; Kakihara, F.; Kato, M. Characterization of six varieties of Cucumis melo L. based on morphological and physiological characters, including shelf-life of fruit. Euphytica 2004, 135, 305–313. [Google Scholar] [CrossRef]
- Nguyen, N.N.; Kwon, Y.S.; Park, J.R.; Sim, S.C. Development of a cor set of SSR markers for cultivar identification and seed purity tests in oriental melon (Cucumis melo L. var. makuwa). Hortic. Sci. Technol. 2019, 37, 119–129. [Google Scholar] [CrossRef]
- Jun, H.J.; Shin, Y.S.; Suh, J.K. Soil EC and yield and quality of oriental melon (Cucumis melo L. var. makuwa Mak.) as affected by fertigation. J. Bio-Environ. Control 2012, 21, 186–191. [Google Scholar]
- Jun, H.J.; Jo, I.H. Changes of nutrient contents of circulating solution in three different new hydroponics for oriental melons (Cucumis melo L. var. makuwa Mak.). J. Bio-Environ. Control 2002, 11, 168–174. [Google Scholar]
- Lee, D.S.; Kwon, J.K.; Yun, S.W.; Lee, S.Y.; Seo, M.T.; Lee, H.J.; Lee, S.G.; Kang, T.G. Comparison of yield and workload depending on stem training methods in oriental melon hydroponics. J. Bio-Environ. Control 2021, 30, 377–382. [Google Scholar] [CrossRef]
- Jia, W.; Tian, Y.; Luo, R.; Zhang, Z.; Lian, J.; Zheng, Y. Detection and segmentation of overlapped fruits based on optimized mask R-CNN application in apple harvesting robot. Comput. Electron. Agric. 2020, 172, 105380. [Google Scholar] [CrossRef]
- Seo, D.; Cho, B.H.; Kim, K.C. Development of monitoring robot system for tomato fruits in hydroponic greenhouses. Agronomy 2021, 11, 2211. [Google Scholar] [CrossRef]
- Gao, Z.; Shao, Y.; Xuan, G.; Wang, Y.; Liu, Y.; Han, X. Real-time hyperspectral imaging for the in-field estimation of strawberry ripeness with deep learning. Artif. Intell. Agric. 2020, 4, 31–38. [Google Scholar] [CrossRef]
- Kim, J.S.; Choi, H.R.; Chung, D.S.; Lee, Y.S. Current research status of postharvest and packaging technology of oriental melon (Cucumis melo var. makuwa) in Korea. Hortic. Sci. Technol. 2010, 28, 902–911. [Google Scholar]
- Lee, D.U.; Bae, J.M.; Lim, J.H.; Choi, J.H. Prediction of consumer acceptance of oriental melon based on physicochemical and sensory characteristics. Hortic. Sci. Technol. 2017, 35, 446–455. [Google Scholar] [CrossRef][Green Version]
- Liang, H.; Li, Q. Hyperspectral imagery classification using sparse representations of convolutional neural network features. Remote Sens. 2016, 8, 99. [Google Scholar] [CrossRef]
- Liu, D.; Sun, D.W.; Zeng, X.A. Recent advances in wavelength selection techniques for hyperspectral image processing in the food industry. Food Bioprocess Technol. 2014, 7, 307–323. [Google Scholar] [CrossRef]
- Song, Y.Q.; Zhao, X.; Su, H.Y.; Li, B.; Hu, Y.M.; Cui, X.S. Predicting spatial variations in soil nutrients with hyperspectral remote sensing at regional scale. Sensors 2018, 18, 3086. [Google Scholar] [CrossRef]
- López-Andreu, F.J.; López-Morales, J.A.; Erena, M.; Skarmeta, A.F.; Martínez, J.A. Monitoring system for the management of the common agricultural policy using machine learning and remote sensing. Electronics 2022, 11, 325. [Google Scholar] [CrossRef]
- Lee, M.S.; Kim, K.S.; Min, G.; Son, D.H.; Kim, J.E.; Kim, S.C. Recent trends of hyperspectral imaging technology. Electron. Telecommun. Trends 2019, 34, 86–97. [Google Scholar] [CrossRef]
- Elmasry, G.; Kamruzzaman, M.; Sun, D.W.; Allen, P. Principles and applications of hyperspectral imaging in quality evaluation of agro-food products: A review. Crit. Rev. Food Sci. Nutr. 2012, 52, 999–1023. [Google Scholar] [CrossRef]
- Fadock, M.; Brown, R.B.; Reynolds, A.G. Visible-near infrared reflectance spectroscopy for nondestructive analysis of red wine grapes. Am. J. Enol. Vitic. 2016, 67, 38–46. [Google Scholar] [CrossRef]
- Gómez, A.H.; He, Y.; Pereira, A.G. Non-destructive measurement of acidity, soluble solids and firmness of Satsuma mandarin using Vis/NIR-spectroscopy techniques. J. Food Eng. 2006, 77, 313–319. [Google Scholar] [CrossRef]
- Li, X.; Wei, Y.; Xu, J.; Feng, X.; Wu, F.; Zhou, R.; Jin, J.; Xu, K.; Yu, X.; He, Y. SSC and pH for sweet assessment and maturity classification of harvested cherry fruit based on NIR hyperspectral imaging technology. Postharvest Biol. Technol. 2018, 143, 112–118. [Google Scholar] [CrossRef]
- Qin, J.; Kim, M.S.; Chao, K.; Chan, D.; Delwiche, S.R.; Cho, B.K. Line-scan hyperspectral imaging techniques for food safety and quality applications. Appl. Sci. 2017, 7, 125. [Google Scholar] [CrossRef]
- Al-Sarayreh, M.; Reis, M.M.; Yan, W.Q.; Klette, R. Potential of deep learning and snapshot hyperspectral imaging for classification of species in meat. Food Control 2020, 117, 107332. [Google Scholar] [CrossRef]
- Zhang, D.; Xu, L.; Liang, D.; Xu, C.; Jin, X.; Weng, S. Fast prediction of sugar content in Dangshan pear (Pyrus spp.) using hyperspectral imagery data. Food Anal. Methods 2018, 11, 2336–2345. [Google Scholar] [CrossRef]
- Osco, L.P.; Ramos, A.P.M.; Pinheiro, M.M.F.; Moriya, E.A.S.; Imai, N.N.; Estrabis, N.; Ianczyk, F.; de Araujo, F.F.; Liesenberg, V.; Jorge, L.A.d.C.; et al. A machine learning framework to predict nutrient content in Valencia-orange leaf hyperspectral measurements. Remote Sens. 2020, 12, 906. [Google Scholar] [CrossRef]
- Kim, S.Y.; Hong, S.J.; Kim, E.; Lee, C.; Kim, G. Neural network based prediction of soluble solids concentration in oriental melon using VIS/NIR spectroscopy. Appl. Eng. Agric. 2021, 37, 653–663. [Google Scholar] [CrossRef]
- Fearn, T.; Riccioli, C.; Garrido-Varo, A.; Guerrero-Ginel, J.E. On the geometry of SNV and MSC. Chemometr. Intell. Lab. Syst. 2009, 96, 22–26. [Google Scholar] [CrossRef]
- Rahman, A.; Kandpal, L.M.; Lohumi, S.; Kim, M.S.; Lee, H.; Mo, C.; Cho, B.K. Nondestructive estimation of moisture content, pH and soluble slid contents in intact tomatoes using hyperspectral imaging. Appl. Sci. 2017, 7, 109. [Google Scholar] [CrossRef]
- Zhou, X.; Wu, Y.; Chen, S.; Chen, Y.; Zhang, W.; Sun, X.; Zhao, Y. Using Cucurbita rootstocks to reduce fusarium wilt incidence and increase fruit yield and carotenoid content in oriental melons. J. Am. Soc. Hortic. Sci. 2014, 49, 1365–1369. [Google Scholar] [CrossRef]
- Choi, J.W.; Chang, M.S.; Lee, J.H.; Hong, Y.; Kim, J.G. Changes in quality of oriental melon ‘Smartkkul’ during vessel transportation. Hortic. Sci. Technol. 2018, 36, 552–559. [Google Scholar] [CrossRef]
- Jo, Y.J.; Jang, S.Y.; Kim, O.M.; Park, C.W.; Jeong, Y.J. Effects of sugars addition in alcohol fermentation of oriental melon. J. Korean Soc. Food Sci. Nutr. 2010, 39, 1359–1365. [Google Scholar] [CrossRef]
- Kang, Y.S.; Jang, S.H.; Park, J.W.; Song, H.Y.; Ryu, C.S.; Jun, S.R.; Kim, S.H. Yield prediction and validation of onion (Allium cepa L.) using key variables in narrowband hyperspectral imagery and effective accumulated temperature. Comput. Electron. Agric. 2020, 178, 105667. [Google Scholar] [CrossRef]
- Farrés, M.; Platikanov, S.; Tsakovski, S.; Tauler, R. Comparison of the variable importance in projection (VIP) and of the selectivity ratio (SR) methods for variable selection and interpretation. J. Chemom. 2015, 29, 528–536. [Google Scholar] [CrossRef]
- Allouhi, A.; Choab, N.; Hamrani, A.; Saadeddine, S. Machine learning algorithms to assess the thermal behavior of a Moroccan agriculture greenhouse. Clean. Eng. Technol. 2021, 5, 100346. [Google Scholar] [CrossRef]
- Uzal, L.C.; Grinblat, G.L.; Namías, R.; Larese, M.G.; Bianchi, J.S.; Morandi, E.N.; Granitto, P.M. Seed-per-pod estimation for plant breeding using deep learning. Comput. Electron. Agric. 2018, 150, 196–204. [Google Scholar] [CrossRef]
- McDonald, G.C. Ridge regression. WIREs Comp. Stats. 2009, 1, 93–100. [Google Scholar] [CrossRef]
- Jamal, N.; Rind, M.Q. Ridge regression: A tool to forecast wheat area and production. Pak. J. Stat. Oper. Res. 2009, 3, 125–134. [Google Scholar] [CrossRef][Green Version]
- Kramer, O. K-Nearest Neighbors; Springer: Berlin, Germany, 2013; pp. 13–23. [Google Scholar] [CrossRef]
- Martínez, F.; Frías, M.P.; Pérez, M.D.; Rivera, A.J. A methodology for applying k-nearest neighbor to time series forecasting. Artif. Intell. Rev. 2017, 52, 2019–2037. [Google Scholar] [CrossRef]
- Breiman, L. Random forests. Mach. Learn. 2001, 45, 5–32. [Google Scholar] [CrossRef]
- Singh, B.; Sihag, P.; Singh, K. Modelling of impact of water quality on infiltration rate of soil by random forest regression. Model. Earth Syst. Environ. 2017, 3, 999–1004. [Google Scholar] [CrossRef]
- Shin, Y.S.; Park, S.D.; Kim, J.H. Influence of pollination methods on fruit development and sugar contents of oriental melon (Cucumis melo L. cv. Sagyejeol-Ggul). Sci. Hortic. 2007, 112, 388–392. [Google Scholar] [CrossRef]
- Guo, X.; Xu, J.; Cui, X.; Chen, H.; Qi, H. iTRAQ-based protein profiling and fruit quality changes at different development stages of oriental melon. BMC Plant Biol. 2017, 17, 28. [Google Scholar] [CrossRef]
- Akar, R.; Aydin, C. Some physical properties of gumbo fruit varieties. J. Food Eng. 2005, 66, 387–393. [Google Scholar] [CrossRef]
- Nelson, S.O.; Trabelsi, S.; Kays, S.J. Dielectric spectroscopy of melons for potential quality sensing. Trans. ASABE 2008, 51, 2209–2214. [Google Scholar] [CrossRef]
- Zhu, Q.; He, C.; Lu, R.; Mendoza, F.; Cen, H. Ripeness evaluation of ‘Sun Bright’ tomato using optical absorption and scattering properties. Postharvest Biol. Technol. 2015, 103, 27–34. [Google Scholar] [CrossRef]
- Cho, B.H.; Kang, T.H.; Han, C.S.; Lee, J.H.; Lee, D.I.; Noh, H.K. Estimation of lettuce growth characteristics under different LED light intensities in a closed-type plant factory. Hortic. Sci. Technol. 2018, 36, 350–361. [Google Scholar] [CrossRef]
- Wold, S.; Sjöström, M.; Eriksson, L. PLS-regression: A basic tool of chemometrics. Chemometr. Intell. Lab. Syst. 2001, 58, 109–130. [Google Scholar] [CrossRef]


Publisher’s Note: MDPI stays neutral with regard to jurisdictional claims in published maps and institutional affiliations. |
© 2022 by the authors. Licensee MDPI, Basel, Switzerland. This article is an open access article distributed under the terms and conditions of the Creative Commons Attribution (CC BY) license (https://creativecommons.org/licenses/by/4.0/).